prognostic factors for transplant-free survival and ... · clinical and translational...
TRANSCRIPT

TitlePrognostic Factors for Transplant-Free Survival and Validationof Prognostic Models in Chinese Patients with Primary BiliaryCholangitis Receiving Ursodeoxycholic Acid
Author(s) Cheung, KS; Seto, WKW; Fung, JYY; Lai, CL; Yuen, RMF
Citation Clinical and Translational Gastroenterology, 2017, v. 8 n. 6, p.e100:1-10
Issued Date 2017
URL http://hdl.handle.net/10722/246564
Rights This work is licensed under a Creative Commons Attribution-NonCommercial-NoDerivatives 4.0 International License.

Prognostic Factors for Transplant-Free Survival andValidation of Prognostic Models in Chinese Patientswith Primary Biliary Cholangitis ReceivingUrsodeoxycholic Acid
Ka-Shing Cheung, MBBS, MPH1, Wai-Kay Seto, MD1,2, James Fung, MD1,2, Ching-Lung Lai, MD1,2 and Man-Fung Yuen, MD, PhD1,2
OBJECTIVES: We aimed to validate the prognostic models for primary biliary cholangitis (PBC) in Chinese patients receivingursodeoxycholic acid (UCDA), and to compare their performances in predicting the long-term survival.METHODS: Chinese patients with PBC from a tertiary center were identified via electronic search of hospital medical registry. Riskfactors associated with adverse events (liver transplantation or death from liver-related causes including hepatocellular carcinoma(HCC) and liver decompensation) were determined. Transplant-free survival was defined as survival free of liver-related death ortransplantation.RESULTS: Of the 144 patients, 41 (28.5%) had baseline cirrhosis. The median age at diagnosis was 57.8 years. During a medianfollow-up of 7.0 years, 40 patients died (21 liver-related; 19 non-liver-related), 12 developed HCC, and 10 underwenttransplantations. The 5-, 10-, and 15-year transplant-free survival probabilities were 91.0%, 78.1%, and 58.9%, respectively.Independent risk factors for adverse events were increasing age (hazard ratio (HR) 1.05), cirrhosis (HR 8.53), and suboptimaltreatment response (HR 3.06). Aspartate aminotransferase/platelet ratio index at 1 year (APRI-r1) in combination with treatmentresponse optimized the risk stratification. The performances of the GLOBE, UK-PBC scores, Rotterdam criteria, and APRI-r1 werecomparable in predicting adverse events. The area under receiver operating curves within 5, 10, and 15 years were as follows—GLOBE score: 0.83, 0.85, and 0.85, respectively; UK-PBC score: 0.89, 0.83, and 0.79, respectively; Rotterdam criteria: 0.82, 0.76, and0.80, respectively; APRI-r1: 0.80, 0.83, and 0.77, respectively.CONCLUSIONS: The UK-PBC, GLOBE scores, Rotterdam criteria, and APRI-r1 had good and comparable prognostic predictionvalues for Chinese PBC patients receiving UCDA.Clinical and Translational Gastroenterology (2017) 8, e100; doi:10.1038/ctg.2017.23; published online 22 June 2017Subject Category: Liver
INTRODUCTION
Primary biliary cholangitis (PBC) is a chronic cholestatic liverdisease due to an immune-mediated damage on the small-sized biliary ducts leading to progressive ductal destructionand loss.1 Cirrhosis is one of the major risk factors for poorprognosis, posing a higher risk of hepatocellular carcinoma(HCC) development and death.2
Without treatment, patients with PBC are estimated to have5-, 10-, and 15-year transplant-free survival rates of 79%, 59%,and 32%, respectively.3 Currently, ursodeoxycholic acid (UDCA)is the global standard of treatment that has consistently shownto be beneficial in delaying histologic progression, reducingcirrhotic complications, and liver transplantations, as well asimproving long-term survival.4–7 In fact, among those who havean adequate response to UDCA, the survival is comparable tothat of age- and sex-matched healthy subjects, while thedisease progression is faster for suboptimal responders.5
Around 35% of PBC patients do not have an optimalresponse to UDCA.8 Therefore, a number of prognosticmodels exist to define biochemical response to UCDA,including the Rotterdam criteria,9 Barcelona criteria,5 Paris Icriteria,8 Paris II criteria,10 and Toronto criteria.11 They havebeen shown to be able to stratify the risks of developingadverse outcomes including cirrhosis, HCC, and mortality.However, these prognostic models are based on treatmentresponse only. Newer models, the UK-PBC score and GLOBEscore, have been developed by including other prognosticfactors such as age, platelet count,12 aspartate aminotrans-ferase (AST). The AST/platelet ratio index (APRI) at baselineand at 1 year (APRI-r1) were also found to be able to optimizerisk stratification.12–14 The UK-PBC score and GLOBE scorewere found to outperform the other models based on treat-ment response only. Application of APRI-r1 to all biochemicalcriteria has also been shown to improve the predictive
1Department of Medicine, The University of Hong Kong, Queen Mary Hospital, Hong Kong, Hong Kong and 2State Key Laboratory for Liver Research, The University ofHong Kong, Hong Kong, Hong KongCorrespondence: Man-Fung Yuen, MD, PhD, Department of Medicine, The University of Hong Kong Queen Mary Hospital, Pokfulam Road, Hong Kong, Hong Kong.E-mail: [email protected] 5 January 2017; accepted 28 April 2017
Citation: Clinical and Translational Gastroenterology (2017) 8, e100; doi:10.1038/ctg.2017.23Official journal of the American College of Gastroenterology
www.nature.com/ctg
performances.15 As such, the net reclassification indexeswere similar for APRI in combination with other biochemicalcriteria and GLOBE score (20–35%).There is a recent study conducted by Yang et al.16 validating
various prognostic models in the Chinese population. How-ever, this study has a short duration of follow-up (a mean of36±16 months), and therefore the performances of thesemodels to predict adverse outcomes can only be determinedat the time point of 5 years. In addition, since only sevenpatients had liver transplantations or liver-related deaths,the study end point was defined as development of cirrhoticcomplications, while the UK-PBC and PBC scores aredeveloped to predict adverse outcomes of liver transplantationand death.The aim of our study was to validate various prognostic
models and to compare their performances in predicting thelong-term survival in Chinese patients with PBC.
METHODS
Data sources and study population. All patients with PBCwho were followed up in the Hepatology Clinic of Queen MaryHospital between January 2000 and October 2015 wererecruited. Queen Mary Hospital is one of the major publichospitals in Hong Kong with a population of ~ 7.3 million, andis also a tertiary referral center.Our departmental practice was to prescribe UCDA to all
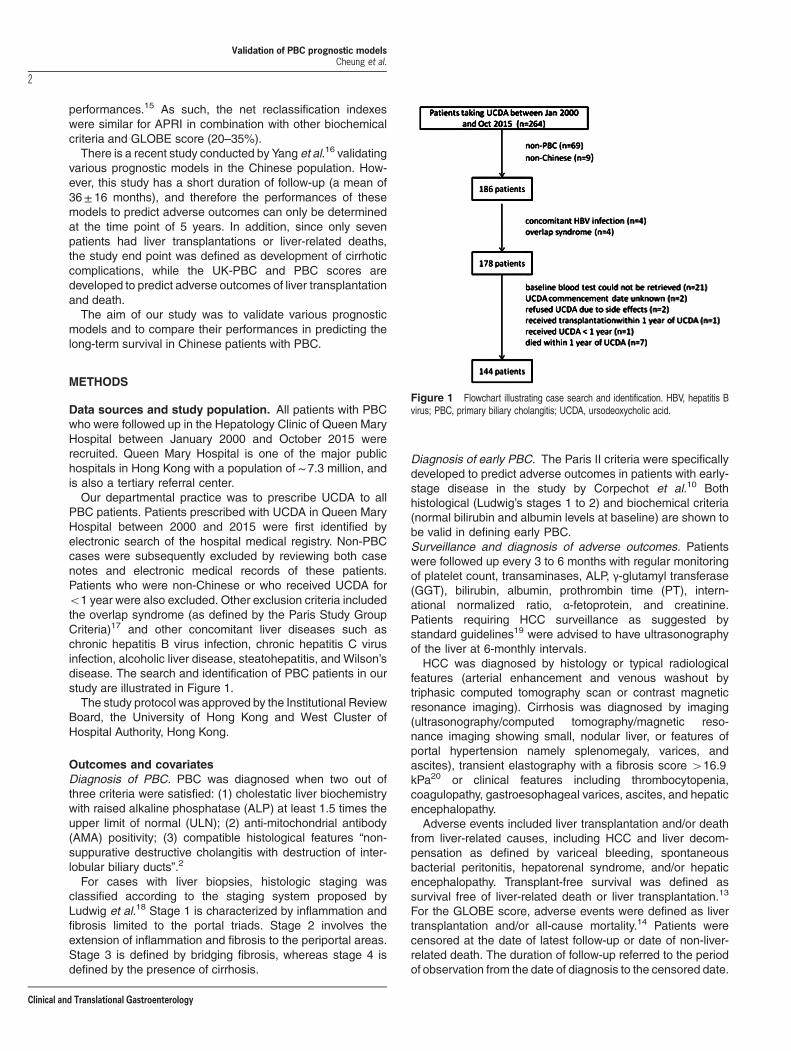
PBC patients. Patients prescribed with UCDA in Queen MaryHospital between 2000 and 2015 were first identified byelectronic search of the hospital medical registry. Non-PBCcases were subsequently excluded by reviewing both casenotes and electronic medical records of these patients.Patients who were non-Chinese or who received UCDA foro1 year were also excluded. Other exclusion criteria includedthe overlap syndrome (as defined by the Paris Study GroupCriteria)17 and other concomitant liver diseases such aschronic hepatitis B virus infection, chronic hepatitis C virusinfection, alcoholic liver disease, steatohepatitis, and Wilson’sdisease. The search and identification of PBC patients in ourstudy are illustrated in Figure 1.The study protocol was approved by the Institutional Review
Board, the University of Hong Kong and West Cluster ofHospital Authority, Hong Kong.
Outcomes and covariatesDiagnosis of PBC. PBC was diagnosed when two out ofthree criteria were satisfied: (1) cholestatic liver biochemistrywith raised alkaline phosphatase (ALP) at least 1.5 times theupper limit of normal (ULN); (2) anti-mitochondrial antibody(AMA) positivity; (3) compatible histological features “non-suppurative destructive cholangitis with destruction of inter-lobular biliary ducts”.2
For cases with liver biopsies, histologic staging wasclassified according to the staging system proposed byLudwig et al.18 Stage 1 is characterized by inflammation andfibrosis limited to the portal triads. Stage 2 involves theextension of inflammation and fibrosis to the periportal areas.Stage 3 is defined by bridging fibrosis, whereas stage 4 isdefined by the presence of cirrhosis.
Diagnosis of early PBC. The Paris II criteria were specificallydeveloped to predict adverse outcomes in patients with early-stage disease in the study by Corpechot et al.10 Bothhistological (Ludwig’s stages 1 to 2) and biochemical criteria(normal bilirubin and albumin levels at baseline) are shown tobe valid in defining early PBC.Surveillance and diagnosis of adverse outcomes. Patientswere followed up every 3 to 6 months with regular monitoringof platelet count, transaminases, ALP, γ-glutamyl transferase(GGT), bilirubin, albumin, prothrombin time (PT), intern-ational normalized ratio, α-fetoprotein, and creatinine.Patients requiring HCC surveillance as suggested bystandard guidelines19 were advised to have ultrasonographyof the liver at 6-monthly intervals.HCC was diagnosed by histology or typical radiological
features (arterial enhancement and venous washout bytriphasic computed tomography scan or contrast magneticresonance imaging). Cirrhosis was diagnosed by imaging(ultrasonography/computed tomography/magnetic reso-nance imaging showing small, nodular liver, or features ofportal hypertension namely splenomegaly, varices, andascites), transient elastography with a fibrosis score 416.9kPa20 or clinical features including thrombocytopenia,coagulopathy, gastroesophageal varices, ascites, and hepaticencephalopathy.Adverse events included liver transplantation and/or death
from liver-related causes, including HCC and liver decom-pensation as defined by variceal bleeding, spontaneousbacterial peritonitis, hepatorenal syndrome, and/or hepaticencephalopathy. Transplant-free survival was defined assurvival free of liver-related death or liver transplantation.13
For the GLOBE score, adverse events were defined as livertransplantation and/or all-cause mortality.14 Patients werecensored at the date of latest follow-up or date of non-liver-related death. The duration of follow-up referred to the periodof observation from the date of diagnosis to the censored date.
Figure 1 Flowchart illustrating case search and identification. HBV, hepatitis Bvirus; PBC, primary biliary cholangitis; UCDA, ursodeoxycholic acid.
Validation of PBC prognostic modelsCheung et al.
2
Clinical and Translational Gastroenterology

Suboptimal response to treatment. In the initial analysis ofthe risk factors for adverse events, suboptimal response toUCDA was identified by using the Paris I criteria, defined asALP more than three times the ULN, AST more than two timesthe ULN, or bilirubin more than 1 mg/dl. The Paris I criteriawere used because they were shown in previous studies tooutperform other treatment response criteria.9,12,21,22 Thedescriptions of other prognostic risk models are shown inSupplementary Table 1. As proposed by Trivedi et al.,12 APRI-r1 in combination with treatment response criteria enables theclassification of PBC patients into low-risk (biochemicalresponse with APRI-r1 ≤0.54), intermediate risk (suboptimalbiochemical response with APRI-r1 ≤0.54, or biochemicalresponse with APRI-r1 40.54), and high risk (suboptimalbiochemical response with APRI-r1 40.54).
Statistical analyses. All statistical analyses were performedusing R version 3.2.3 (A language and environment forstatistical computing, Vienna, Austria, ISBN 3-900051-07-0,URL http://www.R-project.org) statistical software. Continu-ous variables were expressed as median and interquartilerange. The Mann–Whitney U-test was used to comparecontinuous variables of two groups. The χ2 test or Fisher’sexact test when appropriate was applied for comparingcategorical variables. The Cox proportional hazards modelwas used to identify variables that were associated withadverse events. To deal with missing data in the Cox model,multiple imputation was used to construct 50 complete data
sets by imputing the missing variables.23 The Kaplan–Meiermethod was used to analyze the adverse outcomes, andstatistical significance was determined by log-rank test. Thereceiver operating curve was generated by plotting ‘sensitivity’against ‘1 - specificity’ at different values. The performances ofvarious prognostic models were expressed in terms of areaunder receiver operating curve (AUROC), with the 95%confidence interval (95% CI) being derived from bootstrappingby sampling with replacement from the original sample andrepeating the process by 1,000 times. A two-sided P value ofo0.05 was used to define statistical significance.
Results
Patient characteristics. A total of 144 patients with PBCwere identified. The baseline demographics, laboratoryresults, and histology staging are shown in Table 1a. Onehundred and twenty-seven patients (88.2%) were female, andthe median age at diagnosis was 57.8 years (interquartilerange: 48.7–71.5 years). Forty-one patients (28.5%) hadcirrhosis before treatment commencement. For patients withliver biopsy reports available for review (n= 52), 44.2% hadstage 3 or 4 disease. The median dose of UCDA that patientsreceived was 750 mg. The proportions of patients withsuboptimal response to treatment are listed in Table 1b,ranging from 33.3 to 42.4% according to different criteria.Table 1c shows the proportions of patients with suboptimal
Table 1a Baseline characteristics of the study cohort (n= 144)
Variable Whole cohort(n= 144)
Patients with adverseevents (n=30)
Patients without adverseevents (n= 114)
P value
Age (years) 57.8 (48.7–71.5) 59.7 (45.3–71.0) 57.6 (49.0–72.1) 0.678Female sex, n (%) 127 (88.2%) 24 (80.0%) 103 (90.4%) 0.118Duration of follow-up (years) 7.0 (3.6–10.6) 7.4 (4.5–11.8) 7.0 (3.3–10.4) 0.376Ursodeoxycholic acid (mg) 750 (750–750) 750 (750–750) 750 (750–750) 0.491Suboptimal treatment response (Paris I criteria) 52 (36.1%) 21 (70.0%) 31 (27.2%) o0.001Diabetes, n (%) 29 (20.1%) 6 (20.0%) 23 (20.2%) 0.983Smoking, n (%)a 13 (9.5%) 4 (14.3%) 9 (8.3%) 0.303Alcohol, n (%)a 17 (13.7%) 2 (6.9%) 15 (13.4%) 0.525Cirrhosis, n (%) 41 (28.5%) 21 (70.0%) 20 (17.5%) o0.001Histological stages 3 and 4, n (%)b 23 (44.2%) 12 (75.0%) 11 (30.6%) 0.006Platelet (x109/l)a 216 (152–262) 135 (90–202) 234 (182–269) o0.001Creatinine (μmol/l)a 69 (60–82) 75 (62–87) 68 (60–81) 0.210Albumin (g/l)a 40 (36–42) 35 (31–40) 40 (38–43) o0.001Bilirubin (μmol/l)a 14 (10–26) 30 (19–55) 13 (9–22) o0.001ALP (U/l) 284 (196–484) 332 (224–486) 267 (194–483) 0.376ALT (U/l)a 74 (54–130) 88 (54–139) 73 (54–126) 0.540AST (U/l)a 68 (51–115) 89 (62–125) 65 (40–108) 0.079GGT (U/l)a 517 (256–771) 619 (457–776) 436 (219–765) 0.134PT (s) 11.3 (10.5–11.7) 11.7 (11.4–12.8) 11.1 (10.5–11.5) o0.001AMA positivity 119 (82.6%) 22 (73.3%) 97 (85.1%) 0.130Globulin (mg/dl)a 41 (37–46) 44 (38–50) 41 (37–45) 0.161IgM (mg/dl)a 363 (250–502) 462 (289–593) 356 (240–444) 0.044Mayo risk score 4.7 (3.8–5.5) 5.5 (4.8–6.6) 4.4 (3.7–5.2) o0.001MELD score 6 (6–8) 7 (6–9) 6 (6–6) 0.005CPS 5 (5–6) 6 (5–8) 5 (5–6) o0.001CP class B/C 29 (20.1%) 12 (40.0%) 17 (14.9%) o0.001
ALP, alkaline phosphatase; ALT, alanine aminotransferase; AMA, anti-mitochondrial antibody; AST, aspartate aminotransferase; CPS, Child–Pugh score;GGT, γ-glutamyl transferase; IgM, immunoglobulin M; INR, international normalized ratio; MELD, model for end-stage liver disease; PT, prothrombin time.Adverse events were defined as liver transplantation or liver-related death.All continuous variables are expressed in median (interquartile range).aMissing data: smoking (7), alcohol (3), platelet (10), creatinine (1), albumin (2), bilirubin (2), ALT (2), AST (2), GGT (2), globulin (6), and IgM (20).bSixty-two patients had liver biopsies performed with reports available for review in 52.
Validation of PBC prognostic modelsCheung et al.
3
Clinical and Translational Gastroenterology

treatment response according to different age strata. Therates of treatment response did not differ significantly acrossdifferent age strata by using the Rotterdam, Barcelona, orParis I criteria. However, when the Toronto criteria were used,younger patients had significantly lower rates of treatmentresponse. None of the patients in the present cohort receivedfibric acid derivatives.The median follow-up was 7.0 years (interquartile range:
3.6–10.6 years), and the total follow-up was 1,151 patient-years. Forty patients died (liver-related deaths: 21; non-liver-related deaths: 19), 12 patients developed HCC, and 10patients underwent liver transplantations.Sixty-two patients had liver biopsies performed with reports
available for review in 52. Using the Paris II criteria, only 29patients had early PBC according to the histological criteria,whereas 52 patients had early-stage disease according to thebiochemical criteria. As a result of the relatively small samplesize and number of events (n= 4) in this subgroup of patients,Cox regression analysis and determination of AUROCs werenot performed for the Paris II criteria.
Risk factors for adverse events. Table 2a shows theassociation between various factors and adverse events.On univariate analysis, male sex, presence of cirrhosis, lowerplatelet count, lower serum albumin, higher serum bilirubin,longer PT, higher serum globulin and immunoglobulin M(IgM) on presentation, and suboptimal response to UCDA(as defined by the Paris I criteria) were significant risk factorsfor liver transplantation and/or liver-related death. Baselineserum transaminases, ALP, and GGTwere not significant riskfactors. All significant risk factors on univariate analysis werefurther assessed by multivariate analysis. Risk factors thatremained to be significant were older age (hazard ratio (HR)1.05; 95% CI: 1.02–1.08), presence of cirrhosis (HR 8.53;95% CI: 2.80–25.96) and suboptimal treatment response
using the Paris I criteria (HR 3.21; 95% CI: 1.24–8.33).Table 2b shows the HR of suboptimal response as defined bydifferent prognostic models. Multivariate analysis (in whichstatistically significant factors in Table 2a were included) wasperformed separately for each prognostic model. Suboptimaltreatment response was a significant risk factor when theRotterdam criteria (HR 4.05; 95% CI: 1.39–11.84), Barcelonacriteria (HR 3.25; 95% CI: 1.27–8.34), or Paris I criteria(HR 3.21; 95% CI: 1.24–8.33) were adopted, but not for theToronto criteria.Patients were classified into low risk, intermediate risk,
and high risk according to the biochemical response andAPRI-r1 as mentioned in the previous section.12 High-riskpatients (suboptimal biochemical response with APRI-r140.54) had the poorest prognosis compared with low-riskand intermediate-risk patients, with consistent findings usingthe Paris I, Rotterdam, and Toronto criteria (Table 2c).
Survival analysis. The overall 5-, 10-, and 15-year trans-plant-free survival rates were 91.0% (95% CI: 85.8–96.5),78.1% (95% CI: 69.6–87.5), and 58.9% (95% CI: 46.1–75.4),respectively (Figure 2a).Transplant-free survival was significantly better for patients
without baseline cirrhosis than for thosewith cirrhosis (log rankPo0.001; Figure 2b). Among patients without baselinecirrhosis, the 5-, 10-, and 15-year transplant-free survivalrates were 97.1% (95% CI: 93.3–100), 93.5% (95% CI:87.4–99.3), and 86.4% (95% CI: 75.8–98.4). Among patientswith baseline cirrhosis, the 5-, 10-, and 15-year transplant-freesurvival rates were 75.3% (95% CI: 61.7–91.9), 44.9%(95% CI: 29.4–68.6), and 15.7% (95% CI: 4.8–51.3).Survival was also significantly better for patients who
showed response to UCDA according to different treatmentresponse criteria (all log rank Po0.05) (Figure 3a–c), exceptfor the Toronto criteria (log rank P=0.159). The classificationof patients into low risk, intermediate risk, and high riskaccording to the biochemical response and APRI-r1 furtherstratified the risks of transplant-free survival, regardless ofwhich treatment response criteria was being used (all log rankPo0.05) (Figure 4a–d).
Validation of various prognostic models. The perfor-mances of the GLOBE and UK-PBC scores were comparablein predicting adverse events in our cohort, with an overlapof the 95% CIs. For the GLOBE score, the AUROCs foradverse events within 5, 10, and 15 years were 0.83 (95% CI:0.74–0.90), 0.85 (95% CI: 0.75–0.92) and 0.85 (95% CI:
Table 1b Number of patients with suboptimal treatment response according todifferent criteria
Criteria Number of patientswith suboptimaltreatment response (%)
Rotterdam criteria 61 (42.4%)Barcelona criteria 48 (33.3%)Paris I criteria 52 (36.1%)Toronto criteriaa 50 (38.8%)
aFifteen patients had missing data on the ALP level at 2 years after treatment.
Table 1c Number and proportions of patients with suboptimal treatment response according to different criteria among various age strata
Age o40 years(n= 7)
Age 40–49.9 years(n= 35)
Age 50–59.9 years(n=36)
Age 60–69.9years (n=25)
Age ≥70 years(n= 41)
P value
Rotterdam criteria 4 (57.1%) 11 (31.4%) 11 (30.6%) 11 (44.0%) 24 (58.5%) 0.063Barcelona criteria 2 (28.6%) 7 (20%) 11 (30.6%) 14 (56.0%) 14 (34.1%) 0.070Paris I criteria 4 (57.1%) 14 (40%) 13 (36.1%) 8 (32.0%) 13 (31.7%) 0.719Toronto criteria 6 (85.7%) 19 (57.6%)a 11 (35.5%)b 6 (27.3%)c 8 (22.2%)d 0.002
aTwo patients had missing data on the ALP level at 2 years after treatment.bFive patients had missing data on the ALP level at 2 years after treatment.cThree patients had missing data on the ALP level at 2 years after treatment.dFive patients had missing data on the ALP level at 2 years after treatment.
Validation of PBC prognostic modelsCheung et al.
4
Clinical and Translational Gastroenterology

0.73–0.95), respectively. For the UK-PBC score, theAUROCs for adverse events within 5, 10, and 15 years were0.89 (95% CI: 0.77–0.98), 0.83 (95% CI: 0.73–0.91), and0.79 (95% CI: 0.65–0.91), respectively. In comparison, theAUROCs by using other prognostic models within 5, 10, and15 years were as follows: (Rotterdam=0.82, 0.76, 0.80;Barcelona= 0.69, 0.60, 0.68; Paris I=0.72, 0.70, 0.67;Toronto= 0.55, 0.52, 0.51; APRI= 0.61, 0.69, 0.40; APRI-r1= 0.80, 0.83, 0.77). With regard to non-PBC-specificscores, the AUROCs within 5, 10, and 15 years were 0.67,0.69, 0.71 for model for end-stage liver disease score and0.84, 0.69, 0.70 for Child–Pugh score (CPS).Table 3 summarizes the predictive performances of various
models. Among the criteria based on treatment responseonly, the sensitivity and negative predictive value (NPV) werehighest using the Rotterdam criteria. Values of sensitivity,specificity, positive predictive value (PPV), and NPV were not
available for the UK-PBC, GLOBE, APRI, APRI-r1, MELD, andCPS as these scores were on a continuous scale.
DISCUSSION
The present study recruited 144 Chinese PBC patients whohad received UDCA for at least 1 year. The median age atdiagnosis was 57.8 years in our cohort, which was similar tothat described in studies from other Asian countries (includingTaiwan, Singapore, and South Korea), ranging from 55.6 to57.4 years.24–26 With the mean age of diagnosis of 54.5 yearsin the western population,3 Asian patients appear to be diag-nosed with PBC at a slightly older age. Females accounted forthe majority of our cohort (88%), and 43% of our patients hadstage 3 or 4 disease at the time of diagnosis. The femalepreponderance and proportion of patients with advancedhistologic disease are similar to those reported in the West.2,8
Table 2a HRs and 95% CIs for the association between variables and adverse events (liver-related death or liver transplantation)
Variables Univariate analysis Multivariate analysis
HR 95% CI P value HR 95% CI P value
Age (years) 1.02 1.00–1.05 0.079 1.05 1.02–1.08 o0.001Male 3.26 1.28–8.33 0.014 0.81 0.25–2.61 0.721Smoking 2.23 0.76–6.59 0.146Alcohol 0.73 0.17–3.12 0.674Diabetes mellitus 0.78 0.31–1.92 0.583Cirrhosis 9.64 4.23–22.00 o0.001 8.53 2.80–25.96 o0.001Platelet (x109/l) 0.99 0.986–0.997 0.001 1.00 0.99–1.01 0.755Creatinine (μmol/l) 1.01 0.98–1.03 0.600Albumin (g/l) 0.83 0.77–0.89 o0.001 0.95 0.85–1.08 0.452Bilirubin (μmol/l)a 1.02 1.01–1.03 0.001ALP (U/l) 1.00 0.997–1.001 0.291ALT (U/l) 1.00 0.992–1.002 0.245AST ( U/l) 1.00 0.995–1.005 0.863GGT (U/l) 1.00 0.999–1.001 0.697PT (s) 1.31 1.05–1.63 0.018 1.04 0.74–1.45 0.829AMA positivity 0.70 0.31–1.60 0.400Globulin (mg/dl) 1.06 1.01–1.11 0.023 1.04 0.97–1.12 0.298IgM (mg/dl) 1.001 1.000–1.002 0.035 1.00 0.999–1.001 0.281Suboptimal treatment response (Paris I criteria)a 4.55 2.01–10.28 o0.001 3.21 1.24–8.33 0.017
ALP, alkaline phosphatase; ALT, alanine aminotransferase; AMA, anti-mitochondrial antibody; AST, aspartate aminotransferase; 95% CI, 95% confidence interval;GGT, γ-glutamyl transferase; HR, hazard ratio; IgM, immunoglobulin M; INR, international normalized ratio; PT, prothrombin time.P values o0.05 are highlighted in bold.aIn the multivariate analyses, bilirubin was not included as this variable was already included in the Paris I criteria.
Table 2b HRs and 95% CIs for the association between suboptimal treatment response (as defined by various prognostic models) and adverse events (liver-relateddeath or liver transplantation)
Criteria Univariate analysis aMultivariate analysis
HR 95% CI P value HR 95% CI P value
Rotterdam 9.07 3.44–23.88 o0.001 4.05 1.39–11.84 0.011Barcelona 3.75 1.72–8.20 o0.001 3.25 1.27–8.34 0.014Paris I 4.55 2.01–10.28 o0.001 3.21 1.24–8.33 0.017Toronto 1.54 0.72–3.32 0.265 1.62 0.57–4.57 0.362
95% CI, 95% confidence interval; HR, hazard ratio.P values o0.05 are highlighted in bold.aThe adjusted HR for suboptimal response was derived by multivariate analysis with other significant variables in Table 2a (age, male sex, cirrhosis, platelet, albumin,bilirubin, prothrombin time, globulin and immunoglobulin M) included. Separate multivariate analysis was performed for each criteria in defining suboptimal response.In the multivariate analyses, bilirubin was not included for the Paris I criteria, whereas both bilirubin and albumin were not included for the Rotterdam criteria, as thesevariables were already included in the criteria.
Validation of PBC prognostic modelsCheung et al.
5
Clinical and Translational Gastroenterology

The treatment response rate was also comparable, ~ 33–42%according to different criteria. In addition, the survival rates ofour cohort were similar to those reported in a meta-analysis,3
with the 5-, 10-, and 15-year transplant-free survival ratesbeing 91%, 78%, and 59% vs. 88%, 77%, and 63%, respec-
tively. Overall, the characteristics of our cohort of Chinesepatients were similar to those of the Western population.Our study validated different prognostic models and
compared their performances in Chinese PBC patientsreceiving UDCA. In our study, both the recently developed
Table 2c Prediction of adverse events (liver-related death or liver transplantation) by suboptimal treatment response in combination with APRI-r1
Criteria Univariate analysis aMultivariate analysis
HR 95% CI P value HR 95% CI P value
Rotterdamb
Low risk Reference — — Reference — —Intermediate risk 1.59 0.27–9.51 0.613 1.05 0.16–7.07 0.956High risk 11.80 2.76–50.36 o0.001 5.30 1.03–27.34 0.046
Barcelonab
Low risk Reference — — Reference — —Intermediate risk 5.94 0.75–47.01 0.091 2.29 0.24–21.82 0.473High risk 22.33 2.91–171.26 0.003 8.38 0.96–73.17 0.055
Paris I b
Low risk Reference — — Reference — —Intermediate risk 3.96 0.77–20.46 0.100 1.94 0.32–11.55 0.469High risk 10.02 2.33–43.10 0.002 5.48 1.09–27.60 0.039
TorontoLow risk Reference — — Reference — —Intermediate risk 9.58 1.20–76.88 0.033 9.73 0.84–112.80 0.069High risk 12.60 1.66–95.68 0.014 18.67 1.49–234.17 0.023
APRI-r1, AST/platelet ratio index at 1 year; 95% CI, 95% confidence interval; HR, hazard ratio.P values o0.05 are highlighted in bold.aThe adjusted HR for suboptimal response was derived by multivariate analysis with other significant variables in Table 2a (age, male sex, cirrhosis, platelet, albumin,bilirubin, prothrombin time, globulin and immunoglobulin M) included. Separate multivariate analysis was performed for each criteria in defining suboptimal response.In the multivariate analyses, bilirubin was not included for the Paris I criteria, whereas both bilirubin and albumin were not included for the Rotterdam criteria, as thesevariables were already included in the criteria.bMissing data: 6 (Paris I, Rotterdam and Barcelona criteria in combination with APRI-r1), 20 (Toronto criteria in combination with APRI-r1).
Figure 2 Baseline cirrhosis was associated with poorer transplant-free survival. (a) Kaplan–Meier survival plot for overall survival of the whole cohort. (b) Kaplan–Meiersurvival plot stratified by baseline cirrhosis.
Validation of PBC prognostic modelsCheung et al.
6
Clinical and Translational Gastroenterology

models (the GLOBE and UK-PBC scores) had betterpredictability (AUROCs close to or 40.80 for predictingadverse events within 5, 10, and 15 years) than othercriteria based only on treatment response (except for theRotterdam criteria), the results of which were consistent withstudies of the western population.13,14 There are severalpossible reasons to explain this. First, a number of importantindependent factors are included in the GLOBE and UK-PBC
scores, e.g., age,21 bilirubin,3,27 ALP,5,8,10 albumin,28 and plateletcount,12 while the other criteria are based only on treatmentresponse, and therefore cirrhosis may not be taken intoconsideration. Second, dichotomization of continuous variablesin previous criteria will affect the robustness of the model.29
The overall performance (in terms of AUROC) of theGLOBEscore in the validation cohort from the Global PBC StudyGroup was 0.82,14 while that of the UK-PBC score in the
Figure 3 Suboptimal treatment response was associated with poorer transplant-free survival. (a) Kaplan–Meier survival plot stratified by treatment response (Rotterdamcriteria). (b) Kaplan–Meier survival plot stratified by treatment response (Barcelona criteria). (c) Kaplan–Meier survival plot stratified by treatment response (Paris I criteria).
Validation of PBC prognostic modelsCheung et al.
7
Clinical and Translational Gastroenterology

validation cohort from the UK-PBC Research Cohort was asfollows: AUROCs of 0.96, 0.95, and 0.94 within 5, 10, and 15years, respectively.13 APRI-r1 was another prognostic modelwith a good performance (AUROUC of ~ 0.80)12
Our study showed that the performances of these two newlydeveloped models were comparable in terms of predictingadverse events in theChinese population, as evidenced by the
overlapping of the 95% CIs across different periods. Theperformances of the GLOBE score were similar in the westernand Chinese patients, while the UK-PBC score performedbetter in the western population. However, these resultsshould be interpreted with caution as the number of patientsrecruited in our study was less than the Global PBC StudyGroup and UK-PBC Research Cohort.
Figure 4 Treatment response criteria in combination with APRI-r1 further stratified risks of transplant-free survival. (a) Kaplan–Meier survival plot stratified by treatmentresponse (Rotterdam criteria) and APRI-r1. (b) Kaplan–Meier survival plot stratified by treatment response (Barcelona criteria) and APRI-r1. (c) Kaplan–Meier survival plotstratified by treatment response (Paris I criteria) and APRI-r1. (d) Kaplan–Meier survival plot stratified by treatment response (Toronto criteria) and APRI-r1. APRI-r1, AST/plateletratio index at 1-year; low risk (biochemical response with APRI-r1≤ 0.54), intermediate risk (suboptimal biochemical response with APRI-r1≤ 0.54; or biochemical response withAPRI-r1 40.54) and high risk (suboptimal biochemical response with APRI-r1 40.54).
Validation of PBC prognostic modelsCheung et al.
8
Clinical and Translational Gastroenterology

As for the other prognostic models, the Rotterdam criteriaand the APRI-r1 had overall better performances for predictionof adverse events, followed by the Paris I criteria and theBarcelona criteria, whereas the Toronto criteria did not havesatisfactory performance. A previous study also showed thatthe Rotterdam and the Paris I criteria had better performanceamong criteria based on treatment response.14
All of these criteria had high NPV (490% at 5 years,475%at 10 years) but low PPV (o23% at 5 years, o53% at10 years) in predicting adverse events. Overall, with increasingyears, the sensitivity and NPV decreased, while the specificityand PPV increased. These results suggest that treatmentresponse criteria, particularly the Rotterdam and the Paris Icriteria, were accurate at recognizing patients with goodprognosis.One of the strengths of our study is the case recruitment
process, in which cases were identified via electronic searchof the hospital medical registry, with subsequent verificationby reviewing case notes and electronic medical records. Thisensures the completeness of case recruitment. Moreover, therelatively long duration of follow-up (a median duration of7 years with the longest duration up to 26 years) allowed formoremeaningful comparison of the hazards of adverse eventswith regard to different predictive variables, despite the longlag time for the development of adverse events from diagnosisthat was typical of PBC.There are some limitations of our study. First, the sample
size was relatively small. However, the results obtained fromthis study appear to be valid, as evidenced by the sharedpatient characteristics between our cohort and other studies,as well as the consistency in terms of the performance ofvarious prognostic models. Second, as our hospital is atertiary center in the territory, the study cohort may represent aselected group of patients (which explains the relatively largenumber of events including HCC, transplantation and deathsin this study). Therefore, the findings of this study may not beapplicable to all Asian PBC patients. Third, we could notascertain whether UCDA was prescribed by a weight-basedapproach at a dose of 13–15 mg/kg per day,30 because data ofthe baseline body weight were missing in some patients in thisretrospective study. However, the survival rates of our cohortwere similar to those reported in a meta-analysis,3 indicatingthat the bias related to theUCDAdosewasminimal. In fact, thepatients in the UK-PBC Research Cohort also received alower median dose of 12 mg/kg per day (interquartile range:9–14 mg/kg per day).13
In conclusion, our study validated the usefulness of theGLOBE, UK-PBC scores, Rotterdam criteria and APRI-r1 inpredicting the prognosis of long-term survival in Chinese PBCpatients treated with UDCA. These prognostic models canpotentially stratify the risks of individual patients, henceidentifying those who require closer follow-up and at need ofalternative therapies, such as obeticholic acid.31 Furtherstudies with larger sample sizes are warranted to confirmour findings.
CONFLICT OF INTEREST
Guarantors of the article: Ka-Shing Cheung, MBBS, MPHand Man-Fung Yuen, MD, PhD.Ta
ble
3Predictivepe
rforman
cesof
prog
nostic
mod
elsforad
verseev
ents
Rotterdam
Barce
lona
Paris
ITo
ronto
UK-PBC
GLOBE
APRI
APRI-r1
MELD
CPS
Eve
ntwith
in5ye
ars
AUROC(95%
CI)
0.82
(0.77–
0.86
)0.69
(0.54–
0.85
)0.72
(0.57–
0.84
)0.55
(0.34–
0.74
)0.89
(0.77–
0.98
)0.83
(0.74–
0.90
)0.61
(0.33–
0.86
)0.80
(0.62–
0.93
)0.67
(0.52–
0.81
)0.84
(0.69–
0.95
)Sen
sitivity
100%
70.0%
80.0%
50.0%
——
——
——
Spe
cificity
63.5%
68.8%
35.4%
58.9%
——
——
——
PPV
22.2%
18.9%
19.0%
9.3%
——
——
——
NPV
100%
95.7%
96.9%
93.5%
——
——
——
Eve
ntwith
in10
years
AUROC(95%
CI)
0.76
(0.65–
0.85
)0.60
(0.48–
0.72
)0.70
(0.58–
0.80
)0.52
(0.40–
0.65
)0.83
(0.73–
0.91
)0.85
(0.75–
0.92
)0.69
(0.54–
0.83
)0.83
(0.72–
0.92
)0.69
(0.56–
0.83
)0.69
(0.56–
0.82
)Sen
sitivity
81.8%
54.5%
72.7%
52.6%
——
——
——
Spe
cificity
70.4%
66.7%
66.7%
51.9%
——
——
——
PPV
52.9%
40.0%
47.1%
27.8%
——
——
——
NPV
90.5%
78.3%
85.7%
75.7%
——
——
——
Eve
ntwith
in15
years
AUROC(95%
CI)
0.80
(0.67–
0.92
)0.68
(0.54–
0.82
)0.67
(0.52–
0.80
)0.51
(0.36–
0.66
)0.79
(0.65–
0.91
)0.85
(0.73–
0.95
)0.40
(0.19–
0.62
)0.77
(0.61–
0.92
)0.71
(0.55–
0.84
)0.70
(0.54–
0.85
)Sen
sitivity
81.5%
63.0%
70.4%
58.3%
——
——
——
Spe
cificity
78.9%
73.7%
63.2%
42.1%
——
——
——
PPV
84.6%
77.3%
73.1%
56.0%
——
——
——
NPV
75.0%
58.3%
60.0%
44.4%
——
——
——
APRI,ASTto
platelet
ratio
inde
xat
base
line;
APRI-r1,A
PRIa
t1ye
ar;A
UROC,a
reaun
derrece
iver
operatingcu
rve;
CPS,C
hild–Pug
hsc
ore;
MELD
,mod
elforen
d-stag
eliver
dise
ase;
NPV,
nega
tivepred
ictiveva
lue;
PPV,
positivepred
ictiveva
lue.
Adv
erse
even
tswerede
fined
asliver
tran
splantationor
all-c
ause
mortality(G
LOBEscore)
andliver
tran
splantationor
liver-related
death(other
prog
nostic
scores
).
Validation of PBC prognostic modelsCheung et al.
9
Clinical and Translational Gastroenterology

Specific author contributions: Ka-Shing Cheung andWai-Kay Seto were involved with study concept and design;acquisition of data; analysis and interpretation of data; draftingof manuscript. James Fung was involved with analysis andinterpretation of data; critical revision of the manuscript forimportant intellectual content. Ching-Lung Lai and Man-FungYuen were involved with the study concept and design;analysis and interpretation of data; drafting of manuscript;critical revision of the manuscript for important intellectualcontent; and study supervision. The corresponding author hadfull access to all data, and was fully responsible for the dataintegrity and statistical analysis. All authors revised themanuscript and approved the final version of this article.Financial support: None.Potential competing interests: WK Seto is an advisoryboard member of Bristol-Myers Squibb and Gilead Sciences,and received speaker fees from Bristol-Myers Squibb, GileadSciences, and Novartis. J Fung received research fundingfromNovartis. CL Lai received speaker fees and is an advisoryboardmember of Bristol-Myers andGilead Sciences.MFYuenreceived speaker fees and research funding and is anadvisory board member of Bristol-Myers Squibb, Novartis,Gilead Sciences, and Roche Diagnostics. The remainingauthors declare no conflict of interest.
Study HighlightsWHAT IS CURRENT KNOWLEDGE✓ Primary biliary cholangitis (PBC) can lead to hepatocellular
carcinoma (HCC) and death.
✓ Studies on prognostic models predicting the long-termsurvival in PBC patients are lacking in Chinese population.
WHAT IS NEW HERE✓ UK-PBC and GLOBE scores had good prognostic
prediction values among Chinese PBC patientsreceiving ursodeoxycholic acid (UCDA).
✓ Rotterdam criteria and APRI-r1 also had satisfactoryprognostic prediction values.
✓ The 5-, 10- and 15-year transplant-free survival rates weresimilar between Chinese and western patients.
1. Carey EJ, Ali AH, Lindor KD. Primary biliary cirrhosis. Lancet 2015; 386: 1565–1575.2. Lindor KD, Gershwin ME, Poupon R et al. Primary biliary cirrhosis.Hepatology 2009; 50: 291–308.3. Lammers WJ, van Buuren HR, Hirschfield GM et al. Levels of alkaline phosphatase and
bilirubin are surrogate end points of outcomes of patients with primary biliary cirrhosis: aninternational follow-up study. Gastroenterology 2014; 147: 1338–49.e5; quiz e15.
4. Heathcote EJ, Cauch-Dudek K, Walker V et al. The Canadian Multicenter Double-blindRandomized Controlled Trial of ursodeoxycholic acid in primary biliary cirrhosis. Hepatology1994; 19: 1149–1156.
5. Pares A, Caballeria L, Rodes J. Excellent long-term survival in patients with primary biliary cirrhosisand biochemical response to ursodeoxycholic acid. Gastroenterology 2006; 130: 715–720.
6. Poupon RE, Lindor KD, Cauch-Dudek K et al. Combined analysis of randomized controlled trialsof ursodeoxycholic acid in primary biliary cirrhosis. Gastroenterology 1997; 113: 884–890.
7. Lee J, Belanger A, Doucette JT et al. Transplantation trends in primary biliary cirrhosis.Clin Gastroenterol Hepatol 2007; 5: 1313–1315.
8. Corpechot C, Abenavoli L, Rabahi N et al. Biochemical response to ursodeoxycholic acidand long-term prognosis in primary biliary cirrhosis. Hepatology 2008; 48: 871–877.
9. Kuiper EM, HansenBE, de Vries RA et al. Improved prognosis of patientswith primary biliary cirrhosisthat have a biochemical response to ursodeoxycholic acid.Gastroenterology 2009; 136: 1281–1287.
10. Corpechot C, Chazouilleres O, Poupon R. Early primary biliary cirrhosis: biochemicalresponse to treatment and prediction of long-term outcome. J Hepatol 2011; 55: 1361–1367.
11. Kumagi T, Guindi M, Fischer SE et al. Baseline ductopenia and treatment response predictlong-term histological progression in primary biliary cirrhosis. Am J Gastroenterol 2010; 105:2186–2194.
12. Trivedi PJ, Bruns T, Cheung A et al. Optimising risk stratification in primary biliary cirrhosis:AST/platelet ratio index predicts outcome independent of ursodeoxycholic acid response.J Hepatol 2014; 60: 1249–1258.
13. Carbone M, Sharp SJ, Flack S et al. The UK-PBC risk scores: derivation and validation of ascoring system for long-term prediction of end-stage liver disease in primary biliarycholangitis. Hepatology 2016; 63: 930–950.
14. Lammers WJ, Hirschfield GM, Corpechot C et al. Development and validation of a scoringsystem to predict outcomes of patients with primary biliary cirrhosis receivingursodeoxycholic acid therapy. Gastroenterology 2015; 149: 1804–1812.e4.
15. Trivedi PJ, Corpechot C, Pares A et al. Risk stratification in autoimmune cholestatic liverdiseases: Opportunities for clinicians and trialists. Hepatology 2016; 63: 644–659.
16. Yang F, Yang Y, Wang Q et al. The risk predictive values of UK-PBC and GLOBE scoringsystem in Chinese patients with primary biliary cholangitis: the additional effect of anti-gp210.Aliment Pharmacol Ther 2017; 45: 733–743.
17. Chazouilleres O, Wendum D, Serfaty L et al. Primary biliary cirrhosis-autoimmune hepatitisoverlap syndrome: clinical features and response to therapy. Hepatology 1998; 28: 296–301.
18. Ludwig J, Dickson ER, McDonald GS. Staging of chronic nonsuppurative destructivecholangitis (syndrome of primary biliary cirrhosis). Virchows Arch A 1978; 379: 103–112.
19. Bruix J, Sherman M. Management of hepatocellular carcinoma: an update. Hepatology2011; 53: 1020–1022.
20. Corpechot C, Carrat F, Poujol-Robert A et al. Noninvasive elastography-based assessment of liverfibrosis progression and prognosis in primary biliary cirrhosis. Hepatology 2012; 56: 198–208.
21. Carbone M, Mells GF, Pells G et al. Sex and age are determinants of the clinical phenotypeof primary biliary cirrhosis and response to ursodeoxycholic acid. Gastroenterology 2013;144: 560–569.e7; quiz e13-4.
22. Trivedi PJ, Lammers WJ, van Buuren HR et al. Stratification of hepatocellular carcinoma riskin primary biliary cirrhosis: a multicentre international study. Gut 2016; 65: 321–329.
23. White IR, Royston P. Imputing missing covariate values for the Cox model. Stat Med 2009;28: 1982–1998.
24. Kim KA, Ki M, Choi HY et al. Population-based epidemiology of primary biliary cirrhosis inSouth Korea. Aliment Pharmacol Ther 2016; 43: 154–162.
25. Wong RK, Lim SG, Wee A et al. Primary biliary cirrhosis in Singapore: evaluation ofdemography, prognostic factors and natural course in a multi-ethnic population. JGastroenterol Hepatol 2008; 23: 599–605.
26. Su CW, Hung HH, Huo TI et al. Natural history and prognostic factors of primary biliarycirrhosis in Taiwan: a follow-up study up to 18 years. Liver Int 2008; 28: 1305–1313.
27. Bonnand AM, Heathcote EJ, Lindor KD et al. Clinical significance of serum bilirubin levelsunder ursodeoxycholic acid therapy in patients with primary biliary cirrhosis. Hepatology1999; 29: 39–43.
28. ter Borg PC, Schalm SW, Hansen BE et al. Prognosis of ursodeoxycholic acid-treatedpatients with primary biliary cirrhosis. Results of a 10-yr cohort study involving 297 patients.Am J Gastroenterol 2006; 101: 2044–2050.
29. Royston P, Altman DG, Sauerbrei W. Dichotomizing continuous predictors in multipleregression: a bad idea. Stat Med 2006; 25: 127–141.
30. European Association for the Study of the Liver. EASL Clinical Practice Guidelines:management of cholestatic liver diseases. J Hepatol 2009; 51: 237–267.
31. Nevens F, Andreone P, Mazzella G et al. A placebo-controlled trial of obeticholic acid inprimary biliary cholangitis. N Engl J Med 2016; 375: 631–643.
Clinical and Translational Gastroenterology is an open-access journal published by Nature Publishing Group.
This work is licensed under a Creative Commons Attribution-NonCommercial-NoDerivs 4.0 International License. The images orother third party material in this article are included in the article’sCreative Commons license, unless indicated otherwise in the credit line;if the material is not included under the Creative Commons license,users will need to obtain permission from the license holder toreproduce the material. To view a copy of this license, visit http://creativecommons.org/licenses/by-nc-nd/4.0/
r The Author(s) 2017
Supplementary Information accompanies this paper on the Clinical and Translational Gastroenterology website (http://www.nature.com/ctg)
Validation of PBC prognostic modelsCheung et al.
10
Clinical and Translational Gastroenterology