prognosis of chronic lymphocytic leukemia in iraqi patients
TRANSCRIPT

International Journal of Science and Research (IJSR) ISSN (Online): 2319-7064
Index Copernicus Value (2013): 6.14 | Impact Factor (2015): 6.391
Volume 5 Issue 6, June 2016
www.ijsr.net Licensed Under Creative Commons Attribution CC BY
Assessment of Biochemical and Molecular
Biomarkers for Diagnosis\Prognosis of Chronic
Lymphocytic Leukemia in Iraqi Patients
AL- Dahery H.S.1, Dr. Alwan A.F.
2, Dr. Shabeeb Z.A.
3
1Department Medical biotechnology, College of Applied Biotechnology, AL-Nahrain University – IRAQ
2Professor, FICMS (int.med), FICMS (clin.hem), National Center of Hematology
3Assistant Professor, Clinical Immunology, National Center of Hematology
Abstract: Assessment of biochemical and molecular biomarkers for diagnosis\prognosis of Chronic Lymphocytic Leukemia in Iraqi
patients. Background: Glutathione (GSH) is an important non-enzymatic antioxidant preventing damage to important cellular
components caused by reactive oxygen species such as free radicals and peroxides (Humphries, et al., 2013). GSH protect cells against
toxic free radicals involved in the synthesis and repair of DNA, and serves as a reductant antioxidant in oxidation reduction resulting in
the formation of oxidized GSH (Wu et al, 2004). Malondialdehyde (MDA) is made up by free radicals during tissue damage when (ROS)
degrade polyunsaturated lipids, and used in the measurement of oxidative stress (Halliwell, 2007). ROS-related damages in lymphocytes
from patients with monoclonal B-lymphocytosis and CLL reported increased levels of oxidatively modified DNA and lipids in the sera of
untreated CLL patients due to increased oxidative phosphorylation in CLL cells (Jitschin, et. al., 2014). Objectives: To assess the
hematological profile in CLL patients and healthy subjects. Moreover, to detect the antioxidant defense mechanisms in serum of CLL
patients and healthy subjects such as glutathione (GSH), and malondialdehyde (MDA). Finally, to determine the IGHV mutational
status using Rt-PCR and DNA sequencing. Methodology: This study was conducted on randomly selected 55 CLL patients referred to
the National Center of hematology\AL-Mustansiyria University. CLL patients included (18) newly diagnosed untreated patients (12
males and 6 females), with a mean age of (55±12) yr and age range of (40-80)yr. This study includes (37) already diagnosed CLL
patients who are currently receiving treatment. They included (28) males and (9) females, with a mean age of (57±9) yr and on age
range of (45-71) yr. Nineteen (19) apparently healthy subjects were also involved in this study. They included (9) males and (10) females,
with a mean age of (61 ± 17) yr. and an age range of (30-90) yr. Results: Serum levels of the major antioxidant, glutathione (GSH)
showed a significant decline and serum levels of malondialdehyde (MDA) were significantly elevated in untreated CLL patients. Real
Time-PCR results showed the presence of mutated in IgVH in 3/8 untreated and 4/8 treated CLL patients, while healthy controls did not
show any mutation in IgVH. Conclusion: CLL patients of the present study showed various biochemical, and molecular changes.
Keywords: Chronic Lymphocytic Leukemia, Glutathione (GSH), Malondialdehyde (MDA), IgVH
1. Introduction
Chronic lymphocytic leukemia (CLL) is the most common
type of leukemia in the Western world accounting for 40%
of all leukemia characterized by the clonal proliferation and
accumulation of B-lymphocytes. It affects mainly elderly
patients as the median age of diagnosis is about 72 years and
the male to female ratio is 2 : 1. The symptoms of the
disease arise from a clonal excess of B- cells caused mainly
by defects that prevent programmed cell death (apoptosis).
In symptomatic patients the presence of unmutated Ig heavy
chain variable region, the presence of ZAP-70, and CD-38
expression predict worse clinical outcome (Kyrtsonis, et al.,
2013). This genetic diversity of cancer cells is essential for
progression of the disease (Calin, et al., 2005). On the other
hand, accumulation of reactive oxygen species (ROS) from
antioxidant deficiency, mitochondrial dysfunction,
inflammation, phagocytosis (myeloperoxidase activity),
exogenous stress (exogenous oxidants, redox cycling agents,
UV irradiation, chemicals, endotoxins, and hyperoxia) result
in a state of redox imbalance known as oxidative stress.
ROS alter biological macromolecules (DNA, carbohydrates,
proteins, and lipids). which contributes to genomic
instability. Previous analyses have demonstrated an
impairment in the antioxidant defense system and an
enhancement in the damaged DNA base 8-oxo-2-
deoxyguanosine (8-oxo-dG) in both the preleukemic state of
monoclonal B-cell lymphocytosis and CLL (Oltra, et al.,
2001; Collado, et al., 2012).
In normal B-cells, any immune complex or antigen induced
germinal center GC enlargement formation of new ones as
small B-cells surrounding GC, appearance of memory B-cells
and development of Ig production cells of high affinity.
During this particularly frenetic bout of cell division, somatic
hypermutation of B-cell Ig genes occurs encoded by
unmutated germ-line genes represent a form of evolutionary
memory so-called 'natural antibody'. Randomly, some
mutated daughter cells will have higher affinity for antigen,
some the same or lower and others perhaps none at all.
Similarly, mutations in the framework regions may be 'silent'
or, if they disrupt the folding of the protein, give rise to
nonfunctional molecules (Küppers, 2004; Dooley, et al.,
2006). Clones use either mutated or unmutated IGHV genes
(Damle, et al., 1999), with distinct clinical courses, the IGHV
repertoire in CLL is not random and differs between U-CLL
and M-CLL as well as between CLL cells and normal B cells
(kipps, et al., 2000).
Paper ID: NOV164454 http://dx.doi.org/10.21275/v5i6.NOV164454 1562
International Journal of Science and Research (IJSR) ISSN (Online): 2319-7064
Index Copernicus Value (2013): 6.14 | Impact Factor (2015): 6.391
Volume 5 Issue 6, June 2016
www.ijsr.net Licensed Under Creative Commons Attribution CC BY
2. Subjects, Materials and Methods
This study was conducted on 55 adult Iraqi patients referred
to the National Center of hematology, AL-Mustansiyria
university for evaluation and treatment during the period
extending from Oct. 2013 to Sept. 2015. They were
diagnosed as having CLL based on physical examination by
a specialist, morphological assessment of peripheral blood
films and bone marrow smear by aspirate (BSA)
examination ( in difficult cases), as well as flow cytometric
immunophenotypic profile.
CLL patients included (18) newly diagnosed, untreated
patients (12 males and 6 females), with a mean age of
(55±12) yr. and an age range of(40-80)yr. Nineteen (19)
patients, apparently healthy subjects were also involved in
this study. They included (9) males and (10) females, with a
mean age of (61 ± 17) yr. and an age range of (30-90) yr.
A male patient at the age of 25 yrs was excluded from the
study because of his young age. This patient died five days
after admission to the hospital. It is not unusual to diagnoses
CLL in younger individuals at an age range from 30 to 39
years (Hernández, et.al., 1995).
Another male patient was excluded from the study. He was
the only patient with stage A among all patients of the present
study.
The treatment given to CLL patients consist of the following
combination therapy Rituximab, Fludarabine and
Cyclophosphamide ( RFC), Rituximab was given at 375
mg/m2 on day one (or over 2 days), Fludarabine given at 30
mg/m 2
on day one to day three, , and Cyclophosphamide at
300 mg/m 2
on day one to day five (Hallek et al., 2008;
Catovsky, et al., 2011; Pettitt et al., 2012).
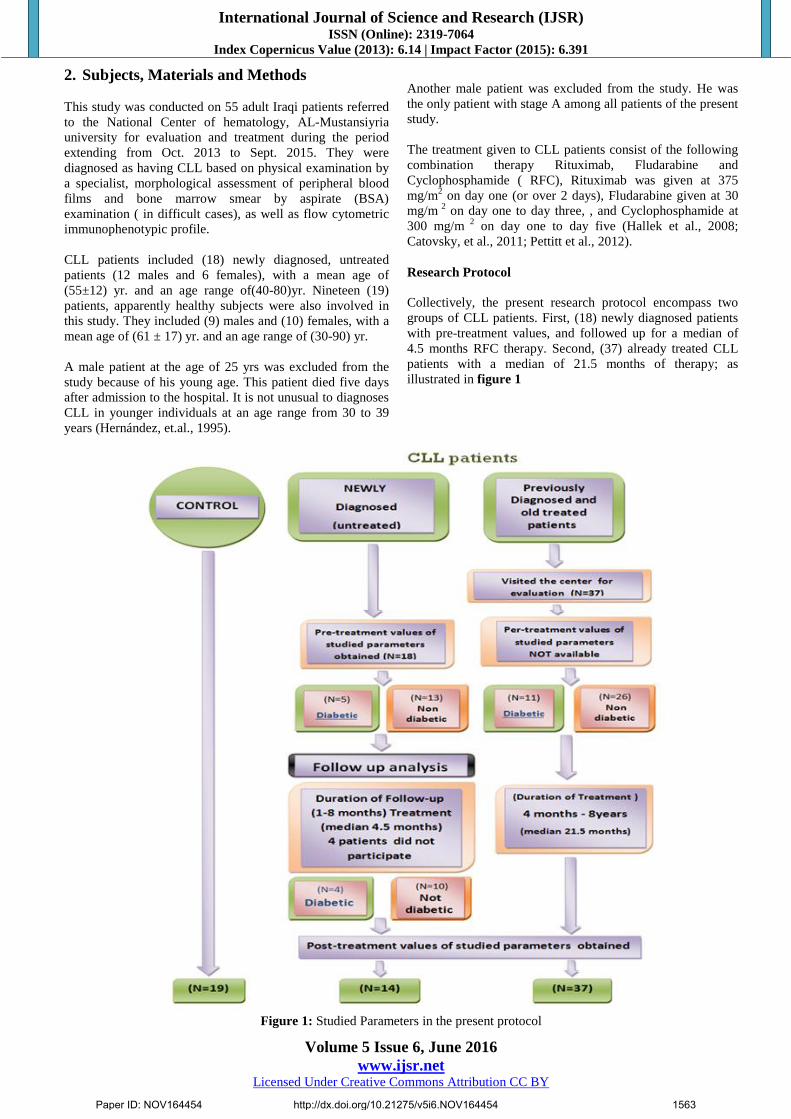
Research Protocol
Collectively, the present research protocol encompass two
groups of CLL patients. First, (18) newly diagnosed patients
with pre-treatment values, and followed up for a median of
4.5 months RFC therapy. Second, (37) already treated CLL
patients with a median of 21.5 months of therapy; as
illustrated in figure 1
Figure 1: Studied Parameters in the present protocol
Paper ID: NOV164454 http://dx.doi.org/10.21275/v5i6.NOV164454 1563

International Journal of Science and Research (IJSR) ISSN (Online): 2319-7064
Index Copernicus Value (2013): 6.14 | Impact Factor (2015): 6.391
Volume 5 Issue 6, June 2016
www.ijsr.net Licensed Under Creative Commons Attribution CC BY
Studied Parameters in the present protocol:
1) Biochemical Profile: Antioxidant status; Glutathione
(GSH) /Malondialdehyde (MDA).
2) Molecular Profile: (IGHV mutational status and DNA
sequencing).
Antioxidant enzymes
Glutathione (GSH)
GSH Assay Procedure (Cusabio, U.S.A.) All reagents and samples were brought to room temperature
before use. The sample was centrifuged again after thawing
before the assay. All samples and standards were assayed in
duplicate.
All reagents, working standards, and samples were prepared
as directed in the previous sections. The number of wells to
be used was determined according to the Assay Layout
Sheet and put any remaining wells and the desiccant were
put back into the pouch, ziplocwas sealed, stored unused
wells at 4°C. 100µl of standard and serum per well were
added, covered with the adhesive strip provided, and
incubated for 2 hours at 37°C. A plate lay out is provided to
record standards and samples assayed.The liquid of each
well was removed without washing. 100µl of Biotin-
antibody (1x) was added to each well. covered with a new
adhesive strip. Then incubated for 1 hour at 37°C. Each well
was aspirated and washed, repeating the process two times
for a total of three washes. Washing was done by filling
each well with Wash Buffer (200µl) using a squirt bottle,
multi-channel pipette, manifold dispenser, or autowasher,
and let it stand for 2 minutes, complete removal of liquid at
each step is essential to good performance. After the last
wash, any remaining wash Buffer was removed by
aspirating ordecanting. The plate was inverted and blotted it
against clean paper towels.100µl of HRP-avidin (1x) was
added to each well. The microtiter plate was covered with a
new adhesive strip and incubated for 1 hour at 37°C.The
aspiration/wash was processed for five times as in step 6.
90µl of TMB Substrate was added to each well, incubated
for 15-30 minutes at 37°C, and protected from light. 50µl of
Stop Solution was added to each well, and the plate was
gently tapped to ensure a thorough mixing. The optical
density of each well was determined within 5 minutes, using
a microplate reader set to 450 nm. If a wavelength correction
is available, set to 540 nm or 570 nm. The readings at 540
nm or 570 nm were subtracted from the readings at 450 nm.
This subtraction will correct the optical imperfections in the
plate.
Malondialdehyde (MDA)
MDA Assay Procedure (Cusabio, U.S.A.):
All reagents were brought and samples to room temperature
before use. All samples, standards, and controls were
assayed in duplicate. 100µl of Standard, Blank, or serum
Sample were added per well, covered with the adhesive strip
and incubated for 2 hours at 37° C. The liquid was removed
from each well without washing. 100µl of Biotin-antibody
working solution was added to each well and incubated for 1
hour at 37°C. Each well was aspirated and washed three
times for a total of three washes. The wash was done by
filling each well with Wash Buffer (200µl) using a squirt
bottle. Complete removal of liquid at each step is essential to
good performance. After the last wash, any remaining Wash
Buffer was removed by aspirating or decanting. The plate was
inverted and blotted it against clean paper towels. 100µl of
HRP-avidin working solution was added to each well. The
microtiter plate was covered with a new adhesive strip, and
incubated for 1 hour at 37°C. The aspiration and washing was
repeated three times. 90µl of TMB Substrate was added to
each well and incubated for 30 minutes at 37°C. 50µl of Stop
Solution was added to each well. The optical density of each
well was determined within 30 minutes, using a microplate
reader set to 450 nm.
Molecular study
Separation of monocular cells ( Meltinyl Biotech)
The mononuclear cells (MNCs) were separated from blood
sample by density gradient centrifugation according to the
protocol described by Moreton, et al. (2005). Fresh EDTA
blood was diluted 1:1 in normal saline; mixed gently until it
was homogenous. The cell suspension was centrifuged in
cooling centrifuge (at 4o C
,2000 rpm for 10 min) on equal
volume of Ficoll-Paque. The upper layer was drawn off using
a clean Pasteur pipette, the MNCs rich zone called (Buffy
coat) was isolated, transferred into a new 10 ml tube and
washed twice with normal saline through centrifugation at
2000 rpm for 8 min and 1000 rpm for 10 min, respectively.
The final pellet was re-suspended with normal saline and was
considered ready for isolation of DNA and determination of
IGHV mutational status using RT-PCR and DNA sequencing.
One hundred μl of lymphocytes were added to the RNA Lysis
Buffer. 175μl of RNA Lysis Buffer were added to the cells.
The cells were suspended and by pipetting. 350μl of RNA
Dilution Buffer was added and mixed by inverting 3–4
times.The tubes were placed in a water bath at 70°C for 3
minutes. Then centrifuged at 14000 rpm for 10 min. The
cleared lysate was transferred to a sterile tube by pipetting.
200μl of 95% ethanol was added to the cleared lysate, and
mixed by pipetting 3–4 times. The mixture was transferred to
the Spin Column Assembly. Centrifuged at 12,000–14,000 ×
g for one minute. Spin Basket was taken from the Spin
Column Assembly, and discarded the liquid was discarded in
the Collection Tube. The Spin Basket was then back into the
Collection Tube. 600μl of RNA Wash Solution was added to
the Spin Column Assembly, centrifuged at 12,000–14,000 × g
for 1 minute. The collection Tube was emptied as before and
placed it in a rack. For each isolation to be performed, DNase
incubation was prepared by mix combining 40μl Yellow Core
Buffer, 5μl 0.09M MnCl 2 and 5μl of DNase I enzyme per
sample in a sterile tube (in this order). Only the amount of
DNase incubation mix required was prepared and pipetted
carefully, and mixed by gentle pipetting; without vortex. The
DNase I on ice was kept while it is thawed. 50μl of this
freshly prepared DNase incubation mix was applied directly
to the membrane inside the Spin Basket, and incubated for 15
minutes at 20–25°C. After incubation, 200μl of DNase Stop
Solution was added to the Spin Basket, and centrifuged at
12,000–14,000 × g for 1 minute.600μl RNA Wash Solution
(with ethanol added) was added and centrifuged at12,000–
14,000 ×g for 1 minute. 250μl RNA Wash Solution was
added and centrifuged at high speed for 2 minutes. For each
sample, one capped 1.5ml Elution Tube were removed. The
Paper ID: NOV164454 http://dx.doi.org/10.21275/v5i6.NOV164454 1564

International Journal of Science and Research (IJSR) ISSN (Online): 2319-7064
Index Copernicus Value (2013): 6.14 | Impact Factor (2015): 6.391
Volume 5 Issue 6, June 2016
www.ijsr.net Licensed Under Creative Commons Attribution CC BY
Spin Basket from the Collection Tube was transferred to the
Elution Tube, and 100μl Nuclease-Free Water was added to
the membrane. The Spin Basket Assemblies were placed in
the centrifuge with the lids of the Elution Tubes facing out
then centrifuged at 12,000–14,000 × g for 1 minute. The
Spin Basket was removed and discarded. The Elution Tube
containing the purified RNA was capped and stored at –
70°C.
Determination of RNA Purity and concentration
This method is used to estimate the purity of the RNA by
using a NanoDrope Spectrometer.
Partial IgVH Region Amplification and Sequencing
The partial IgVH Region was amplified using of specific
primer pair using in RT-PCR reactions which provide a
simple and rapid method for preparation of a specific region
of cDNA for sequencing. This part of research was done in
ASCO Learning Center/Al-Harthia/Baghdad.
Primers
Lyophilized primers were dissolved in a nuclease free water
to give a primary concentration of (100 µM) (as stock
solution). For working solution, 10µl of stock was diluted
with 90µl of nuclease free water to get (10 µM) as a final
concentration. The sequence of these primer was explained
in Table: (1).
Table 1: Primer Sequence used for GSTM1 deletion
detections. Primer Size Sequence
VH FR2 200
TGGRTCCGMCAGSCYYCNGG
JH JHE ACCTGAGGAGACGGTGACC
RT PCR (Marasca, et al., 2005),
One Step Reverse Transcription PCR and specific primers
were used as the following calculation and programming:
Table 2: Mixture A component Component Volume (µl)
qPCR Mix 12.5
RT mix 0.5
VH FR2 1
JH JHE 1
Nuclease free water 8
DNA sample 2
Final volume 25
Table 3: PCR program for mixture A
No Steps Temperature Time No. Of cycles
1 DNA synthesis 37 15min
2 Initial Denaturation 95C° 5min 1 cycle
3
Denaturation 94C° 30sec
35cycles Annealing 60C° 30sec
Extension 1 72C° 30sec
4 Final Extension 72C° 7min 1 cycle
5 Holding 4 C° - 1 cycle
Agarose of Gel Electrophoresis (Sambrook et al., 1989)
After DNA extraction and PCR amplification, Agarose gel
electrophoresis was adopted to confirm the presence and
integrity of the extracted DNA or amplification. PCR was
completely dependable on the extracted DNA criteria.
Preparation of agarose
100 ml of 1X TBE was taken in a beaker. 1 gm (for 1%)
agarose was added to the buffer. The solution was heated to
boiling (using water bath) until all the gel particles were
dissolved. 1μl of Ethidium Bromide (10mg/ml) was added to
the agarose. The agarose was stirred in order to get mixed and
to avoid bubbles.The solution was allowed to cool down at
50-60C°.
Casting of the horizontal agarose gel
The agarose solution was poured into the gel tray after both
the edges were sealed with cellophane tapes and the agarose
was allowed to gel at room temperature for 30 minutes. The
comb was carefully removed and the gel was placed in the gel
tray. The tray was filled with 1X TBE-electrophoresis buffer
until the buffer reached 3-5 mm over the surface of the gel.
DNA loading
2μl of loading buffer was applied to each 5μl DNA sample,
and samples were added carefully to the individual wells.
PCR products were loaded directly. Electrical power was
turned on at 7v/cm for 1-2 h. DNA moved from Cathode to
plus Anode poles. The Ethidium bromide stained bands in gel
were visualized using Gel imaging system.
DNA Sequencing
PCR products were performed and sent for sequencing by
Macrogen Company/Korea. Data were analysed using
immunoglobulins and T cell receptor sequences (IgBLAST).
3. Results and Discussion
Antioxidant profile
The serum level of the antioxidant glutathione (GSH) was
significantly lowered, and that of the lipid peroxidation
byproduct, malondialdehyde (MDA) was significantly
elevated in the untreated newly diagnosed (followed up for a
median of 4.5 months ( range 1-8 months)) and old treated
CLL patients (range 4 months - 8.5 years and median of (21.5
months)) compared with healthy controls (Table 4) and
(Table 5).
Table 4: Antioxidant profile in control and newly diagnosed
(untreated and treated) CLL patients: A follow up study. Parameters
Control
(n=19)
Newly diagnosed CLL Patients
untreated
(n=18)
Treated
(4.5months)
(n=14)
Glutathione (GSH) (µg/ml)
26.45±3.78 (a) 6.45±2.85 (b) 7.52±1.78 (b)
Malondialdehyde
MDA (nmol/ml) 2.09±0.94 (a) 4.09±1.08 (b) 3.55±0.80 (c)
Values are expressed as mean ± standard deviation (SD).
Values with different letters within each parameter are
significantly different (P<0.05(
Paper ID: NOV164454 http://dx.doi.org/10.21275/v5i6.NOV164454 1565

International Journal of Science and Research (IJSR) ISSN (Online): 2319-7064
Index Copernicus Value (2013): 6.14 | Impact Factor (2015): 6.391
Volume 5 Issue 6, June 2016
www.ijsr.net Licensed Under Creative Commons Attribution CC BY
Table 5: Antioxidant profile in control, untreated newly
diagnosed and old treated CLL patients (for a median 21.5
months)
Parameters
Control (n=19)
CLL Patients
untreatednewly
diagnosed
(n=18)
Old treated
(21.5 months)
(n=37)
Glutathione (GSH) (µg/ml)
26.45±3.78 (a) 6.45±2.85 (b) 7.52±1.78 (b)
Malondialdehyde
MDA (nmol/ml) 2.09±0.94 (a) 4.09±1.08 (b) 3.24±1.78 (c)
Values are expressed as mean ± standard deviation (SD)
Values with different letters within each parameter are
significantly different (P<0.05(
Follow-up analysis of untreated CLL patients for a median
of 4.5 months of RFC therapy failed to normalize both GSH
and MDA levels, suggesting the persistence of endogenous
oxidative stress in the treated CLL patients on one hand, and
the lack of antioxidant activity of RFC combination therapy
on the other hand. To the best of our knowledge, there is no
evidence in the available literature suggesting that these
anti-leukemic drugs possess any antioxidant activities.
Furthermore, evidence is available demonstrating that
rituximab (De Rosa et al., 2015), fludarabine +
cyclophosphamide (Goncalves et al., 2009) are capable of
inducing ROS-induced oxidative stress in biological
systems.
Therefore, the observed decreased GSH levels in CLL
subjects may reflect depletion of non-enzymatic antioxidant
reserve and the presence of endogenous oxidative stress.
Evidence in available suggesting the presence of increased
oxidative stress in CLL (Zhou et al., 2003; Collado et al.,
2012; Gaman et al., 2014).
The decreased serum levels of reduced GSH in the present
study agrees with that of Bakan et al., (2003) who reported a
lower serum GSH levels in patients with CLL compared
with controls.
Recently Jitschin et al., (2014) identified altered
mitochondrial metabolism (notably, increased oxidative
phosphorylation) in untreated CLL cells as the key source
for the abundant ROS. Also, they demonstrated that CLL
cells adapted to intrinsic oxidative stress through mechanisms
involving promoting mitochondrial biogenesis (which in turn
may enhance mitochondrial ROS output), suggesting that
ROS adaptations to ROS, and mitochondria biogenesis appear
to form a self-amplifying feedback loop in CLL cells.
On the other hand, Conklin (2004) suggested that the use of
antioxidants during cancer chemotherapy, may enhance
therapy by reducing the generation of oxidative stress-
induced electrophilic aldehydes that can attack many cellular
targets and diminish the efficacy of the treatment. Recently,
Mut-Salud, et al., (2016) demonstrated that the convenience
of administration of antioxidants during cancer therapy still
remains a very controversial issue, because the final effect
will depend on the type of cancer, the mechanism of action of
the drug(s) used, and the type of antioxidant. Accordingly,
they concluded that the supplementation (or restriction) of
exogenous antioxidants during cancer therapy, when
appropriate, could contribute to improving its efficacy.
The finding of elevated serum levels of MDA in the untreated
newly diagnosed and old treated CLL patients agrees with
that of Zelen et al., (2010) who reported significantly higher
plasma MDA level in the CLL patients compared with
controls, suggesting the presence of over production of ROS-
induced oxidative stress in the untreated CLL patients.
Elevated MDA level were also observed in supernatants of
lymphocytes cultures of untreated CLL patients, suggesting
that oxidative stress in CLL lymphocytes could be one of the
potential mechanisms in the pathogenesis of abnormal
apoptosis (Djurdjevic et al., 2009).
Molecular Profile in CLL patients
This part of research has been conducted on the partial IgVH
region with amplified 240 bp using specific primers VH FR2
and JH JHE, after converted RNA being extracted from
MNCs to cDNA in one step RT-PCR, for preparation the
specific region for sequencing. Twenty subjects were
randomly selected and involved in this experiment, eight
newly diagnosed CLL patients (4 males and 4 females) and
eight old treated CLL patients who are currently receiving
treatment, (4 males and 4 females), and four healthy control
(2 males and 2 females), which they are one from male and
female. (Figure 2 ).
Figure 2: Gel electrophoresis for PCR amplification of IGHV gene showing band with molecular size (240bp).
Electrophoresis was performed on 1.5 % agarose gel and run with a 100-volt current for 2 hrs. Lane M:100 bp ladder. From 1
to 15 lane were patients and control samples. -ve: negative control.
Paper ID: NOV164454 http://dx.doi.org/10.21275/v5i6.NOV164454 1566

International Journal of Science and Research (IJSR) ISSN (Online): 2319-7064
Index Copernicus Value (2013): 6.14 | Impact Factor (2015): 6.391
Volume 5 Issue 6, June 2016
www.ijsr.net Licensed Under Creative Commons Attribution CC BY
Mutations of VH genes of Ig are identified by comparing
DNA sequences of genes in B cells with corresponding
genes in the germline. DNA sequences of B cells differing
by 2% from its germline counterpart are considered mutated
(Schroeder ,et al., 1994).
Extensive molecular investigations of the B cell receptor
(BCR) indicated that 60%–65% of CLLs carry
immunoglobulin heavy-chain variable (IGHV) genes with
evidence of somatic hypermutation in their variable regions,
a process that occurs in the germinal center and may modify
BCR affinity for antigens (Klein, et. al., 2008).
IGHV unmutated CLL cells are typically BCR signaling
competent whereas IGHV mutated CLL cells respond
weakly or not at all to BCR crosslinking induced by anti
IgM antibodies (Tsimberidou, et al., 2009).
The mutational status of IgVH is also associated with
specific genomic aberrations; for instance, del (17p13) or del
(11q23) occurs more frequently in patients with
unmutatedIgVH CLL (unmut-IgVH), whereas mutations
such as 13q- as sole aberrancy are generally associated with
mutated IgVH (mut-IgVH) CLL (Kröber, et al., 2006).
DNA Sequencing
Evaluation of biological prognosticators was centralized in
few reference laboratories, IGHV mutational status was
performed as previously reported (Bomben, et al., 2009).
The immunoglobulins expressed by CLL B cells are highly
restricted, suggesting they are selected for binding either self
or foreign antigen of the immunoglobulin heavy-chain
variable (IGHV) genes expressed in CLL (Mauerer, et al.,
2005). In general, CLL patients that express unmutated Ig
heavy chain (IGHV) genes have a worse prognosis than those
who express mutated IGHV genes (Tsimberidou, et al., 2009)
For DNA sequencing, PCR products were performed and
send to Macrogen Company/Korea. Data were analysed using
immunoglobulins and T cell receptor sequences database
provided from NCBI using IgBLAST tool. Results of
sequencing reveled that healthy controls showed unmutated
IGVH, figure (3).
Figure 3: Mutated and unmutated IGVH in CLL patients and control.
Furthermore, figure (4) showed that healthy controls have sequencing of IGVH completely identical to immunoglobulin and
T-cell receptor (IgBLAST).
Paper ID: NOV164454 http://dx.doi.org/10.21275/v5i6.NOV164454 1567

International Journal of Science and Research (IJSR) ISSN (Online): 2319-7064
Index Copernicus Value (2013): 6.14 | Impact Factor (2015): 6.391
Volume 5 Issue 6, June 2016
www.ijsr.net Licensed Under Creative Commons Attribution CC BY
Figure 4: Sequence analysis summary of IGVH in the healthy control (IgBLAST)
Results of IGVH sequencing the newly diagnosed untreated
CLL patients revealed that, 3 (37.5%) out of (8) have
mutated IGHV genes, at the position (FR3-IMGT) with
identity (99.1%) (Figure 4, 5). As following:
A-Mismatch one base from fragment length (207)bp at a
total identity (99.4%).
B-Mismatch one base from fragment length (203)bp at a
total identity (99.4%).
C- Mismatch one base from fragment length (191)bp at a
total identity (99.3%).
Figure 5: Sequence analysis summary of IGVH in the newly diagnosed untreated CLL patients (IgBLAST)
Paper ID: NOV164454 http://dx.doi.org/10.21275/v5i6.NOV164454 1568

International Journal of Science and Research (IJSR) ISSN (Online): 2319-7064
Index Copernicus Value (2013): 6.14 | Impact Factor (2015): 6.391
Volume 5 Issue 6, June 2016
www.ijsr.net Licensed Under Creative Commons Attribution CC BY
DNA sequence in the treated CLL patients revealed that,
four of them (50%) have mutated IGHV genes, at the
position (FR3-IMGT) with identity (99.1%)( Figure 6). As
following:
A-Mismatch one base from fragment length (185)bp at a
total identity (99.4%).
B-Mismatch one base from fragment length (198)bp at a total
identity (99.4%).
C- Mismatch one base from fragment length (180)bp at a
total identity (99.4%).
D- Mismatch one base from fragment length (186)bp at a
total identity (99.3%).
Figure 6: Sequence analysis summary of IGVH in the treated CLL patients (IgBLAST)
CLL could be divided into two prognostic subtypes based on
the degree of mutation of the immunoglobulin heavy-chain
variable region (IgVH) genes (Hamblin, et al., 1999).
Molecular analysis of genetic using RT-PCR
Because these studies have focused on different prognostic
factors, it is not surprising that they have identified
independent sets of potential biomarkers. Novel biologic and
genetic markers are providing tools to aid in the better
prediction of responses, disease progression, and survival in
patients with CLL. Unmut-IgVH is clearly an independent
predictor of outcome in CLL patients. The correlation
between unmut-IgVH and an increased risk for clonal
evolution suggests that the presence of unmut-VH is
required to induce karyotypic instability (Tobin, et al.,
2003). Unmut-IgVH does not appear to independently
predict for chemoresistance, but patients with unmut-IgVH
CLL are reported to have shorter remissions, the prognosis
of unmut-IgVH patients remains poor, even after high dose
chemotherapy. (Lin, et al., 2007).
4. Conclusions
The present study reached the following conclusions:
The reduction in the serum levels of glutathione, along with
the elevation in serum MDA levels of CLL patients suggest
the presence of an increased endogenous oxidative stress in
CLL patients. The inability of (RFC) chemotherapy to
normalize both serum GSH and MDA levels in treated CLL
patients is suggestive of a lack of an antioxidant activity of
these drugs, and the persistence of endogenous oxidative
stress in treated CLL patients. Sequence analysis of IGVH
gene revealed that 3 out of the 8 tested newly diagnosed CLL
patients and 4 out 8 tested treated CLL patients had mutated
IGVH, while none of the 4 tested healthy controls showed
mutated IGVH.
References
[1] Bakan N, Taysis S, Yailmaz O, et al. Glutathione
peroxidase, glutathione reductase, CU-Zn superoxide
Paper ID: NOV164454 http://dx.doi.org/10.21275/v5i6.NOV164454 1569
International Journal of Science and Research (IJSR) ISSN (Online): 2319-7064
Index Copernicus Value (2013): 6.14 | Impact Factor (2015): 6.391
Volume 5 Issue 6, June 2016
www.ijsr.net Licensed Under Creative Commons Attribution CC BY
dismutase activities, glutathione, nitric oxide, and
MDA concentrations in serum of patients with CLL.
Clin chim Acta. 2003: 338 143-9.
[2] Bomben R, et al., : Molecular and clinical features of
chronic lymphocytic leukaemia with stereotyped B cell
receptors: results from an Italian multicentre study. Br
J Haematol 2009, 144(4):492-506.
[3] Calin GA, Ferracin M, Cimmino A, et al. : A
microRNA signature associated with prognosis and
progression in chronic lymphocytic leukemia. N Engl J
Med 2005, 353:1793-1801.
[4] Catovsky D, Montserrat E. Chronic lymphocytic
leukaemia and other B-cell disorders. In: Hoffbrand
AV,Catovsky D, et al (ed). Postgraduate Haematology.
6th
edition.UK: Blackwell Publishing; 2011.p:530-556.
[5] Collado, R. Oliver, I. Tormos C. et al., ―Early ROS-
mediated DNA damage and oxidative stress
biomarkers in Monoclonal B Lymphocytosis,‖ Cancer
Letters, vol. 317, no. 2, pp. 144–149, 2012. [PubMed:
22115963].
[6] Conklin KA. Chemotherapy-associated oxidative
stress: impact on chemotherapeutic effectiveness.
Integr Cancer Ther. 2004; 3: 294-300.
[7] Damle RN, Wasil T, Fais F, et al. Ig V gene mutation
status and CD38 expression as novel prognostic
indicators in chronic lymphocytic leukemia. Blood.
1999; 94:1840–1847. [PubMed: 10477712]. 16.
[8] De Rosa A, Zappavigna S, Villa MR, et al. Prognostic
role of translocator protein and oxidative stress
markers in CLL patients treated with bendamustine
plus rituximab. Oncology Lett. 2015: 9: 1327-32.
[9] DJurdjevic P, Zelen I, Ristic P, et al. Oxidative stress
accelerates spontaneous apoptosis of B-CLL
lymphocyte. J BOUN. 2009: 14: 281-7. [PMID:
19650179].
[10] Dooley, H., and Flajnik, M. F. Antibody repertoire
development in cartilaginous fish. Dev. Comp.
Immunol. (2006). 30, 43–56.
[11] Gaman AM, Buga AM, et al. the role of oxidative
stress and the effects of antioxidants on the incidence
of infectious complications of CLL. Oxidative Med.
Cell. Longevity 2014: Article ID 158135:1-6.
[12] Goncalves T, Benvegnu DM, Bonfanti G, et al.
Oxidative stress and delta-ALA-D activity in different
conditioning regimens in allogeneic bone marrow
transplantation patients. Clin Biochem. 2009: 42: 602-
10. [PMID: 19109938].
[13] Hallek M, Cheson BD, et al. Guidelines for the
diagnosis and treatment of chronic lymphocytic
leukemia: a report from the International Workshop on
Chronic Lymphocytic Leukemia updating the National
Cancer Institute–Working Group 1996
guidelines,Blood. June 15, 2008; vol. 111 (no12):
page 5446-5456.
[14] Halliwell, B. Biochemistry of oxidative stress .J.
Biochemical Society Transfections, (2007). 35: 1147-
1150.
[15] Hamblin T, Davis Z, Gardiner A, Oscier Det al.
Unmutated Ig V(H) genes are associated with a more
aggressive form of chronic lymphocytic leukemia.
Blood. 1999; 94:1848–1854. [PubMed: 10477713].
[16] Hernández JA, Land KJ, McKenna RW. Leukemias,
myeloma, and other lymphoreticular neoplasms,
Cancer.1995; 75:381.
[17] Humphries C. Adoptive cell therapy: Honing that killer
instinct. Nature. 2013; 504:S13-15.
[18] Jitschin R, Hofmann AD, Bruns H, et al. :
Mitochondrial metabolism contributes to oxidative
stress and reveals therapeutic targets in chronic
lymphocytic leukemia. Blood 2014, 123:2663–2672.
[19] Kipps TJ. Chronic lymphocytic leukemia. Curr Opin
Hematol. 2000; 7:223–34. [PubMed: 10882178].
[20] Klein U, Dalla-Favera R. Germinal centres: role in B-
cell physiology and malignancy, Nat Rev Immunol.
2008;8(1):22–33.
[21] Kröber A, Bloehdorn J, Hafner S, et al.: Additional
genetic high-risk features such as 11q deletion, 17p
deletion, and V3-21 usage characterize discordance of
ZAP-70 and VH mutation status in chronic lymphocytic
leukemia, J ClinOncol . 2006; 24 (6): 969.
[22] Küppers R, Rajewsky K. Developmental and functional
biology of B lymphocytes. In: Mauch PM, Armitage JO,
Coiffier B, Dalla- Favera R, Harris NL, eds. Non-
Hodgkin’s Lymphomas. Philadelphia, PA: Lippincott
Williams & Wilkins; 2004:771-786.
[23] Kyrtsonis, E. Koulieris, V. Bartzis et al., ―Monoclonal
immunoglobulin,‖ in Multiple Myeloma—A Quick
Reflection on the Fast Progress, R. Hajek, Ed., 2013.
[24] Lin KI, Tam CS, Abruzzo LV, et al. IgVH mutational
status does not affect complete remission rate but is
associated with reduced remission duration in CLL
patients treated with fludarabine, cyclophosphamide and
rituximab (FCR)- based therapy [abstract]. Blood.
2007;110:232a. Abstract 753.
[25] Mauerer K, Zahrieh D, Gorgun G, et al.
Immunoglobulin gene segment usage, location and
immunogenicity in mutated and unmutated chronic
lymphocytic leukaemia. Br J Haematol. (2005), 129:
499–510.
[26] Moreton P, Kennedy B, et al. Eradication of Minimal
Residual Disease in B-Cell Chronic Lymphocytic
Leukemia After Alemtuzumab Therapy Is Associated
With Prolonged Survival, Journal of clinical
oncology.2005 May 1;23(13):2971-9.
[27] Mut-Salud N, Alvarez PJ, Garrido JM, et al.
Antioxidant intake and antitumor therapy: Toward
Nutritional recommendations for optimal results. Oxid
Med. Cell. Longevity 2016: volume 2016: Article ID
6719534: 1-19.
[28] Oltra, F. Carbonell, C. Tormos, A. Iradi, and G. T. Saez,
´ ―Antioxidant enzyme activities and the production of
MDA and 8-oxo-dG in chronic lymphocytic leukemia,‖
Free Radical Biology & Medicine, vol. 30, no. 11, pp.
1286–1292, 2001.
[29] Pettitt AR, Dreger P, et al. Chronic lymphocytic
leukaemia, Lymphoma Association .Produced
03.02.2012.
[30] Schroeder HW Jr, Dighiero G. The pathogenesis of
chronic lymphocytic leukemia: analysis of the antibody
repertoire. Immunol Today. 1994;15:288-294.
[31] Tobin G, Thunberg U, Johnson A, et al. Chronic
lymphocytic leukemias utilizing the VH3-21 gene
display highly restricted Vlambda2–14 gene use and
homologous CDR3s: implicating recognition of a
Paper ID: NOV164454 http://dx.doi.org/10.21275/v5i6.NOV164454 1570
International Journal of Science and Research (IJSR) ISSN (Online): 2319-7064
Index Copernicus Value (2013): 6.14 | Impact Factor (2015): 6.391
Volume 5 Issue 6, June 2016
www.ijsr.net Licensed Under Creative Commons Attribution CC BY
common antigen epitope. Blood. 2003; 101:4952–
4957. [PubMed: 12586612].
[32] AM Tsimberidou, Wen S, McLaughlin P, et al. Other
malignancies in chronic lymphocytic leukemia/small
lymphocytic lymphoma. J Clin Oncol. 2009; 27:904–
910. [PubMed: 19114699].
[33] Wu G, Fang YZ, Yang S, Lupton JR, Turner ND.
(2004). Glutathione Metabolism and Its Implications
for Health. J Nutr; 134:489-92.
[34] www.partec.com/applications.html accessed at
July,10,2013. [35] Zelen I, Djurdjevic P, Popovic S, et al. Antioxidant
enzymes activities and plasma levels of oxidative
stress markers in B-CLL. J BOUN. 2010: 15:330-6.
[PMID: 20658731].
[36] Zhou Y, Hileman EO, Plunkett W, et al. Free radical
stress in chronic lymphocytic leukemia cells and its
role in cellular sensitivity to ROS-generating
anticancer agents. Blood. 2003;101(10):4098-4104.
Paper ID: NOV164454 http://dx.doi.org/10.21275/v5i6.NOV164454 1571