profit analysis of international defence industry event 5 deakin university cricos provider code:...
TRANSCRIPT
Profit Analysis of International Defence
Industry
Event 5
Deakin University CRICOS Provider Code: 00113B

5.1 Canadian military spending (1980-81 to 2012-13)
2

5.2 Australian military spending

5.3 Definitions
Return on sales (ROS):• percentage of profit extracted from the
revenue gathered from sales
Return on shareholder equity (ROE):• how well the company is using its invested
capital and assets
4

5.4 Calculating the ratios
Return on sales (ROS):
Earnings before interest and taxTotal sales
Return on equity (ROE):
Net profit before taxOrdinary shareholders’ equity
5

5.5 Pre-Tax Accounting ProfitSample Canadian Listed Defence Companies (as Percentage of Equity, Assets and Sales)
6
Weighted Ave= 21.6%
Weighted Ave= 13.8%
Weighted Ave= 10.7%
0%
5%
10%
15%
20%
25%
2006 2007 2008 2009
Year
Ret
urn
Equity
Sales
Assets

5.6 Defence Materiel ContractorsAverage Return on Sales (pre-tax) 2006-09
7
8.8
10.7 10.9
13.8
15.0
13.114.2
9.5
0%
4%
8%
12%
16%
2006 2007 2008 2009
Year
Retu
rn o
n S
ale
sCanada (Listed Sample)
Internationals (5 USA; 2 EU)

5.7 Defence Materiel ContractorsAverage Return on Equity (pre-tax) 2006-09
8
12.6
17.8 17.7
21.6
44.5
34.3 34.135.2
0%
15%
30%
45%
2006 2007 2008 2009
Year
Ret
urn
on
Eq
uit
yCanada (Listed Sample)
Internationals (5 USA; 2 EU)

Defence Comparedto Other Sectors
Event 5

5.8 Pre-Tax Accounting ProfitPercentage Return on Sales for Comparative Groups 2006-09
10
Ave = 9.5%
Ave = 13.8%
Ave = 6.1%
Ave = 5.7%
0%
2%
4%
6%
8%
10%
12%
14%
16%
2006 2007 2008 2009
Year
Re
turn
on
Sa
les
International Defence (5 USA; 2 EU)Canada Defence (Listed Sample)Total, Non-Financial IndustriesManufacturing
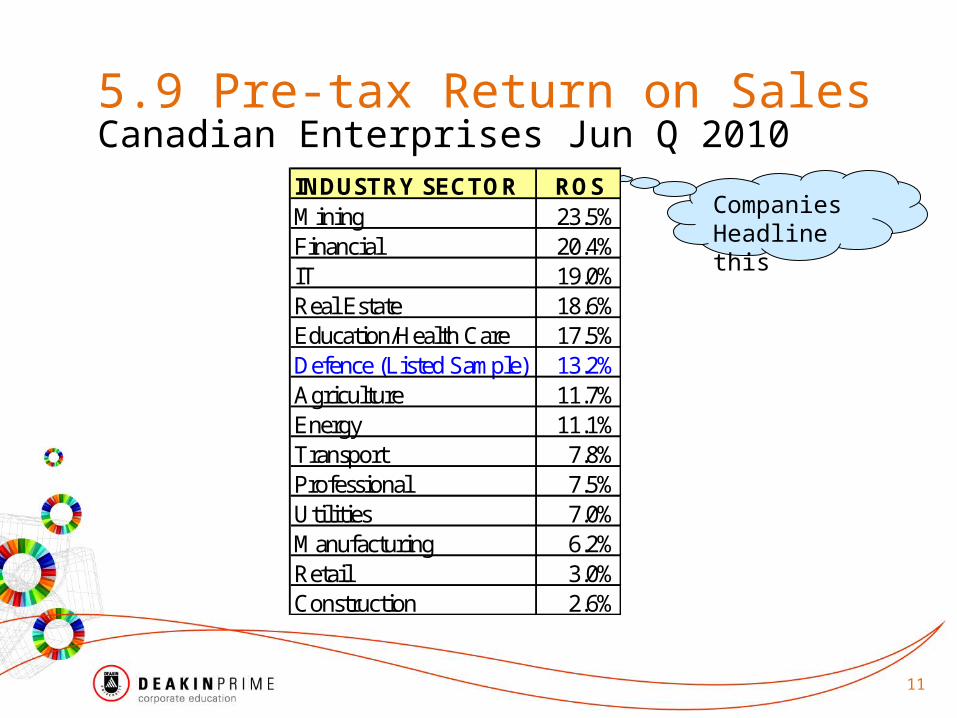
5.9 Pre-tax Return on SalesCanadian Enterprises Jun Q 2010
11
Companies Headline this
INDUSTRY SECTOR ROSMining 23.5%Financial 20.4%IT 19.0%Real Estate 18.6%Education/Health Care 17.5%Defence (Listed Sample) 13.2%Agriculture 11.7%Energy 11.1%Transport 7.8%Professional 7.5%Utilities 7.0%Manufacturing 6.2%Retail 3.0%Construction 2.6%

5.10 Pre-tax Return on EquityCanadian Enterprises Jun Q 2010
12
Investors want this
INDUSTRY SECTOR ROEEducation/Health Care 29.5%IT 24.8%Defence (Listed Sample) 18.9%Agriculture 17.2%Retail 15.2%Real Estate 13.9%Transport 13.3%Construction 12.7%Manufacturing 11.1%Mining 9.5%Financial 9.3%Utilities 7.5%Professional 7.5%Energy 7.2%

5.11 Key messages
• The defence industry is one of the better industries in which to invest
• Yearly profit and the return on investment capital are good
• Profit is goodness provided capability is delivered on time
13