profiling tools 1 profiling tools by vitaly kroivets for software design seminar
TRANSCRIPT

Profiling Tools 1
Profiling tools
By Vitaly Kroivets for Software Design Seminar
Profiling Tools 2
Contents
Introduction Software optimization process , optimization traps and
pitfalls Benchmark
Performance tools overview Optimizing compilers System Performance monitors
Profiling tools GNU gprof INTEL VTune Valgrind
What does it mean to use system efficiently
Profiling Tools 3
The Problem
PC speed increased 500 times since 1981, but today’s software is more complex and still hungry for more resources
How to run faster on same hardware and OS architecture? Highly optimized applications run tens times faster
than poorly written ones. Using efficient algorithms and well-designed
implementations leads to high performance applications
Profiling Tools 4
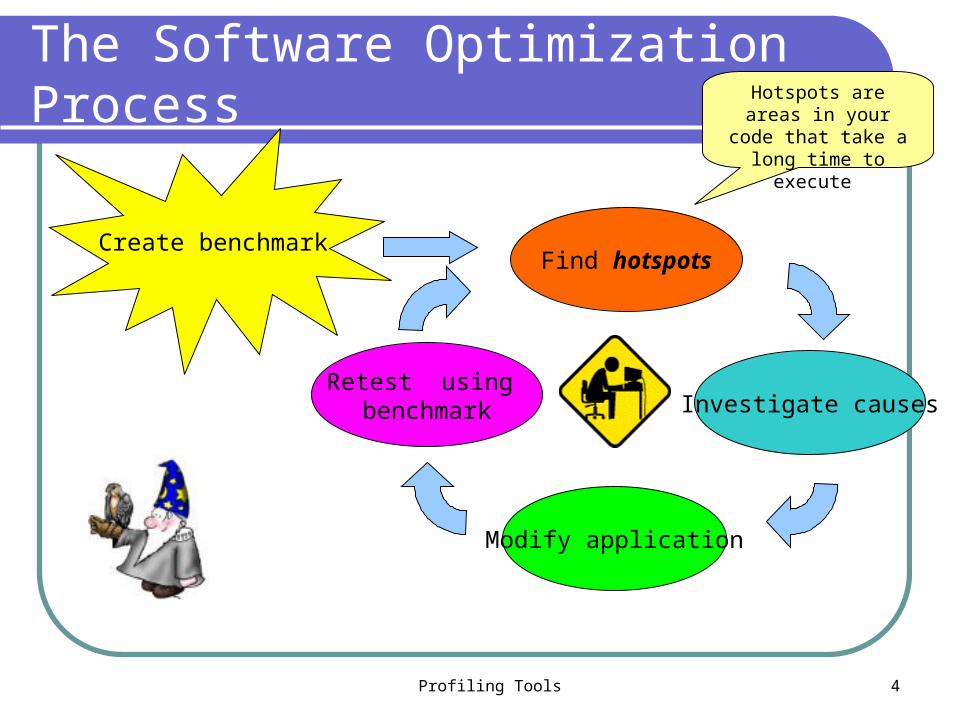
The Software Optimization Process
Find hotspots
Modify application
Retest using benchmark Investigate causes
Create benchmark
Hotspots are areas in your code that take a long time to execute

Profiling Tools 5
Extreme Optimization Pitfalls
Large application’s performance cannot be improved before it runs
Build the application then see what machine it runs on
Runs great on my computer… Debug versus release builds Performance requires assembly language
programming Code features first then optimize if there is
time leftover
Profiling Tools 6
Key Point:
Software optimization doesn’tbegin where coding ends –
It is ongoing process that starts at design stage and
continues all the way through development
Profiling Tools 7
The Benchmark
The benchmark is program that used to Objectively evaluate performance of an application Provide repeatable application behavior for use with
performance analysis tools Industry standard benchmarks :
TPC-C 3D-Winbench http://www.specbench.com/ Enterprise Services Graphics/Applications HPC/OMP Java Client/Server Mail Servers Network File System Web Servers
Profiling Tools 8
Attributes of good benchmark
Repeatable (consistent measurements)
Remember system tasks , caching issues “incoming fax” problem : use minimum
performance numberRepresentative
Execution of typical code path, mimic how customer uses the application
Poor benchmarks : Using QA tests

Profiling Tools 9
Benchmark attributes (cont.)
Easy to runVerifiable
need QA for benchmark!Measure Elapsed Time vs. other numberUse benchmark to test functionality
Algorithmic tricks to gain performance may break the application…
Profiling Tools 10
How to find performance bottlenecks
Determine how your system resources, such as memory and processor, are being utilized to identify system-level bottlenecks
Measure the execution time for each module and function in your application
Determine how the various modules running on your system affect the performance of each other
Identify the most time-consuming function calls and call sequences within your application
Determine how your application is executing at the processor level to identify microarchitecture-level performance problems
Profiling Tools 11
Performance Tools Overview
Timing mechanisms Stopwatch : UNIX time tool
Optimizing compiler (easy way) System load monitors
vmstat , iostat , perfmon.exe, Vtune Counter
Software profiler Gprof, VTune, Visual C++ Profiler, IBM Quantify
Memory debugger/profiler Valgrind , IBM Purify, Parasoft Insure++

Profiling Tools 12
Using Optimizing Compilers
Always use compiler optimization settings to build an application for use with performance tools
Understanding and using all the features of an optimizing compiler is required for maximum performance with the least effort
Profiling Tools 13
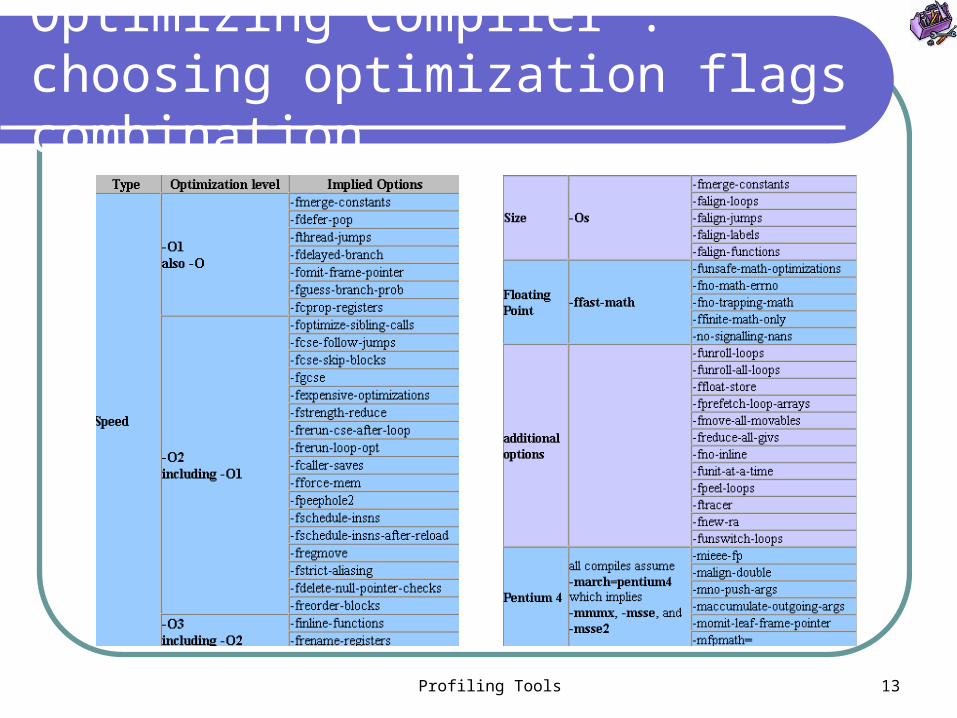
Optimizing Compiler : choosing optimization flags combination
Profiling Tools 14
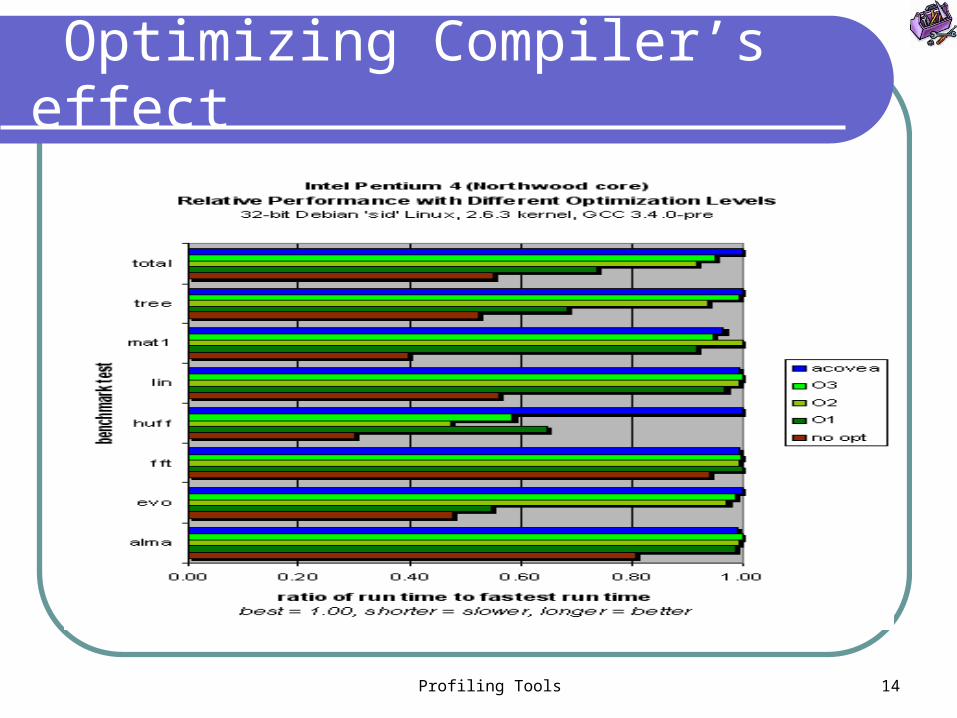
Optimizing Compiler’s effect
Profiling Tools 15
Optimizing Compilers: Conclusions
Some processor-specific options still do not appear to be a major factor in producing fast code
More optimizations do not guarantee faster code
Different algorithms are most effective with different optimizations
Idea : using statistics gathered by profiler as input for compiler/linker

Profiling Tools 16
Windows Performance Monitor
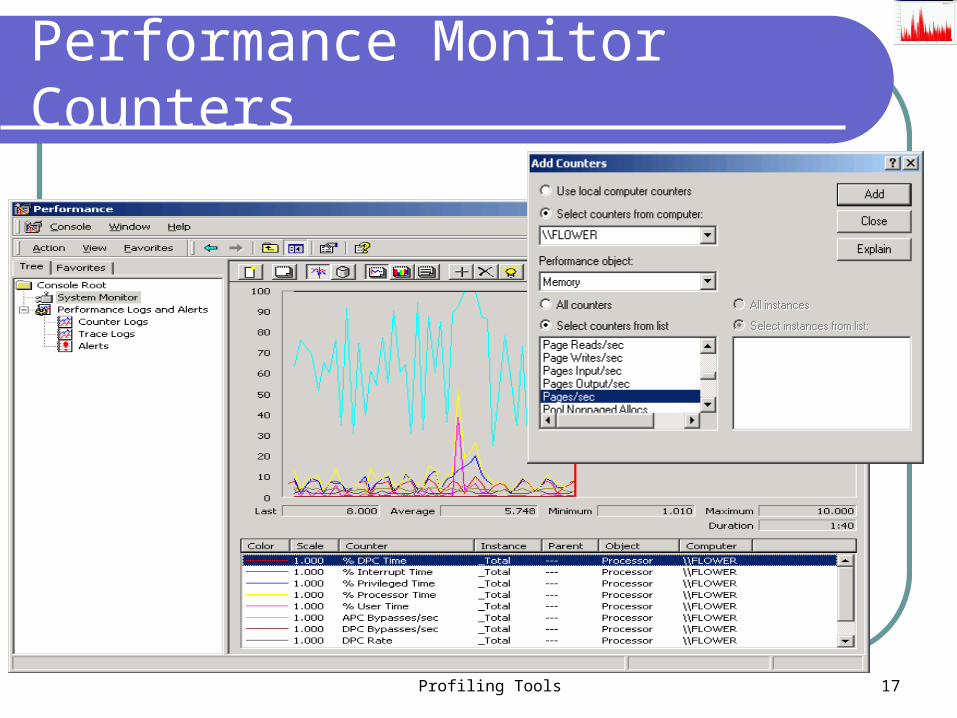
Sampling “profiler” Uses OS timer interrupt to wake up and record
the value of software counters – disk reads, free memory
Maximum resolution : 1 sec Cannot identify piece of code that caused
event to occur Good for finding system issues Unix tools : vmstat, iostat, xos, top, oprofile,
etc.
Profiling Tools 17
Performance Monitor Counters
Profiling Tools 18
Profilers
Profiler may show time elapsed in each function and its descendants number of calls , call-graph (some)
Profilers use either instrumentation or sampling to identify performance issues
Profiling Tools 19
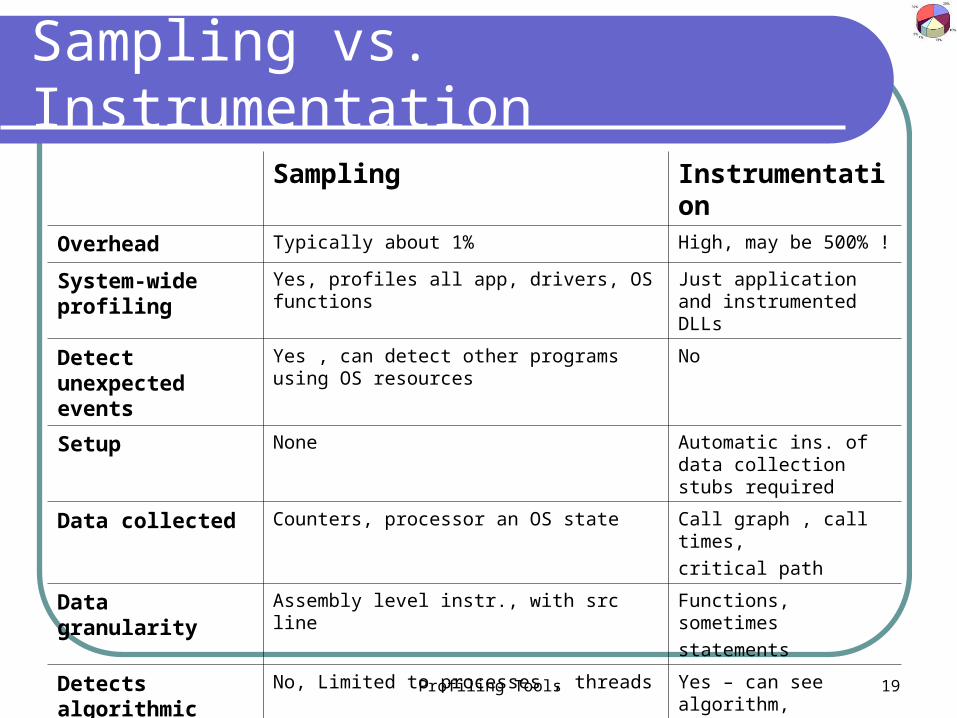
Sampling vs. Instrumentation
Sampling InstrumentationOverhead Typically about 1% High, may be 500% !
System-wide profiling
Yes, profiles all app, drivers, OS functions Just application and instrumented DLLs
Detect unexpected events
Yes , can detect other programs using OS resources
No
Setup None Automatic ins. of data collection stubs required
Data collected Counters, processor an OS state Call graph , call times,
critical path
Data granularity Assembly level instr., with src line Functions, sometimes
statements
Detects algorithmic issues
No, Limited to processes , threads Yes – can see algorithm,
call path is expensive
Profiling Tools 20
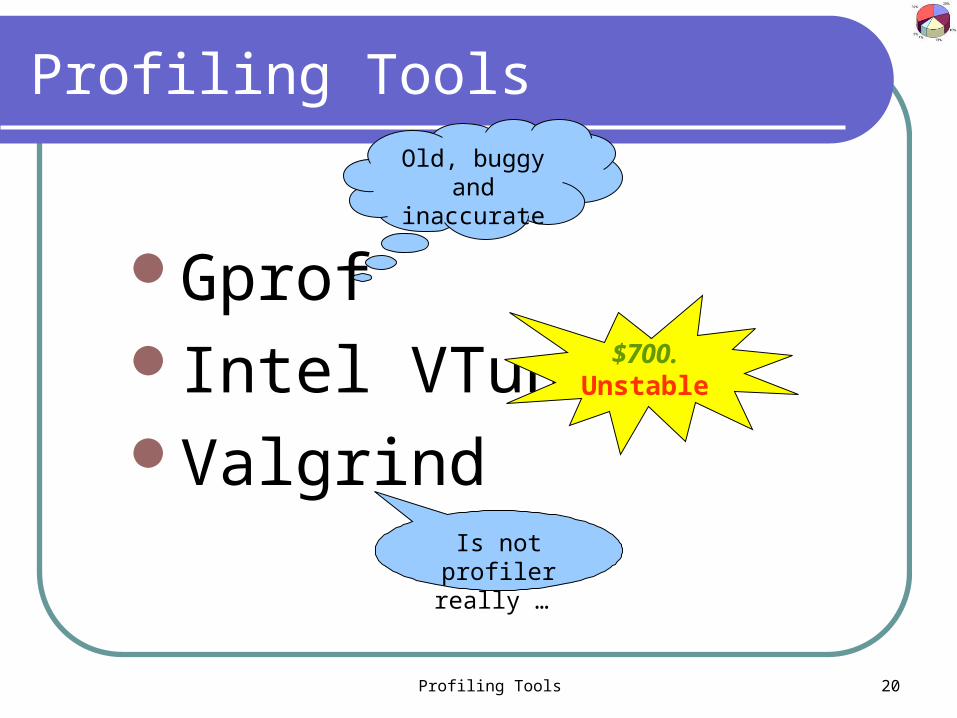
Profiling Tools
GprofIntel VTuneValgrind
Old, buggy and inaccurate
$700.Unstable
Is not profiler really …

Profiling Tools 21
GNU gprof
Instrumenting profiler for every UNIX-like system
Profiling Tools 22
Using gprof GNU profiler
Compile and link your program with profiling enabledcc -g -c myprog.c utils.c -pg cc -o myprog myprog.o utils.o -pg
Execute your program to generate a profile data file Program will run normally (but slower) and will write
the profile data into a file called gmon.out just before exiting
Program should exit using exit() function Run gprof to analyze the profile data
gprof a.out
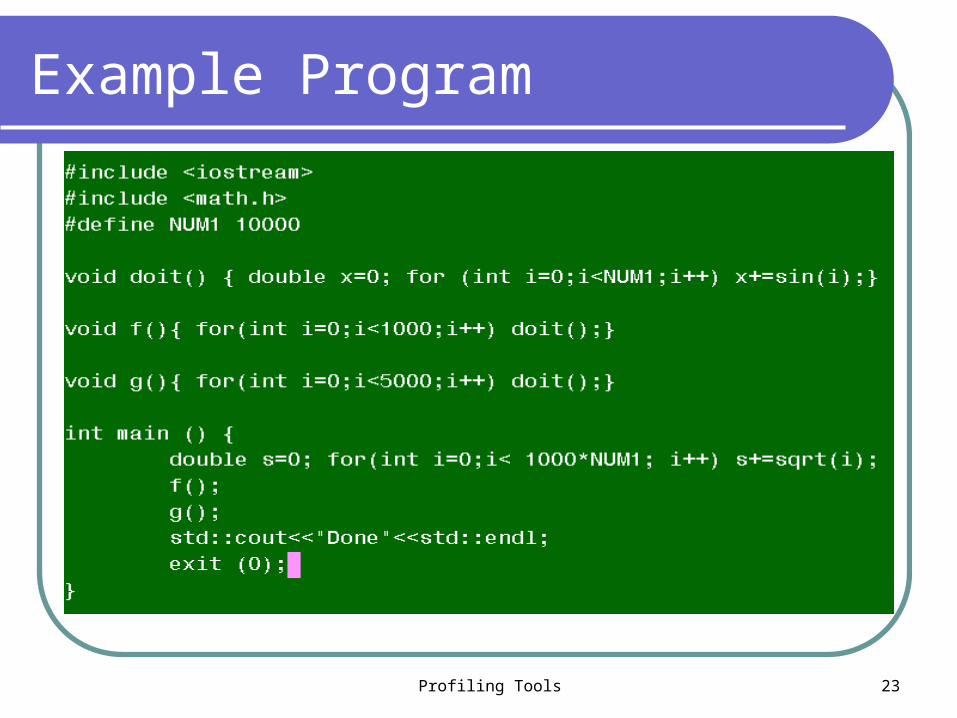
Profiling Tools 23
Example Program
Profiling Tools 24
The flat profile shows the total amount of time your program spent executing each function.
If a function was not compiled for profiling, and didn't run long enough to show up on the program counter histogram, it will be indistinguishable from a function that was never called
Understanding Flat Profile
Profiling Tools 25
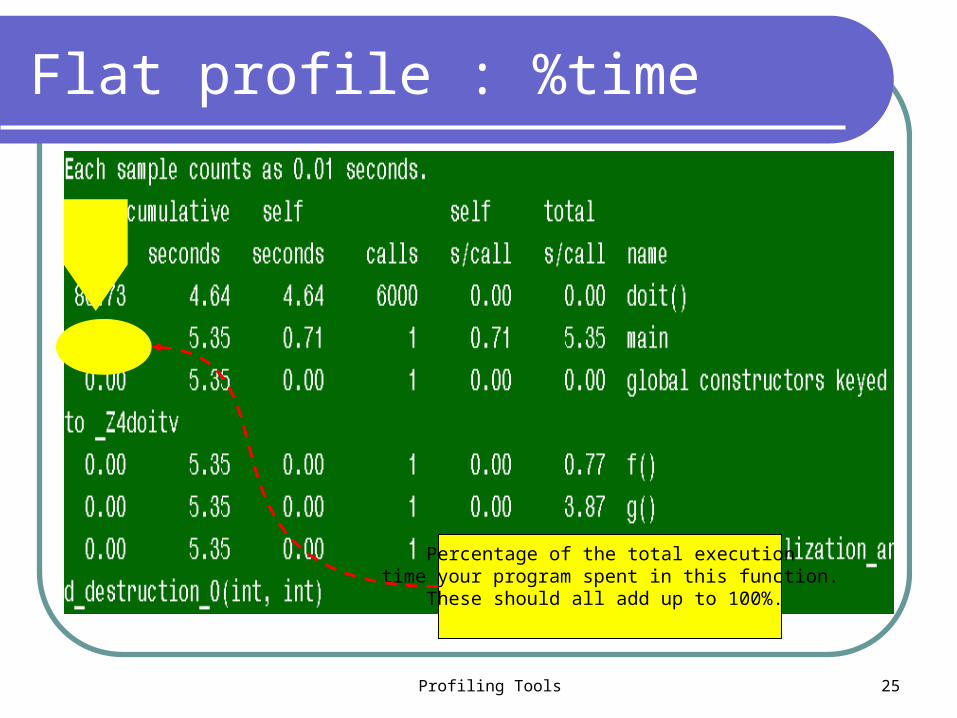
Flat profile : %time
Percentage of the total execution time your program spent in this function.
These should all add up to 100%.
Profiling Tools 26
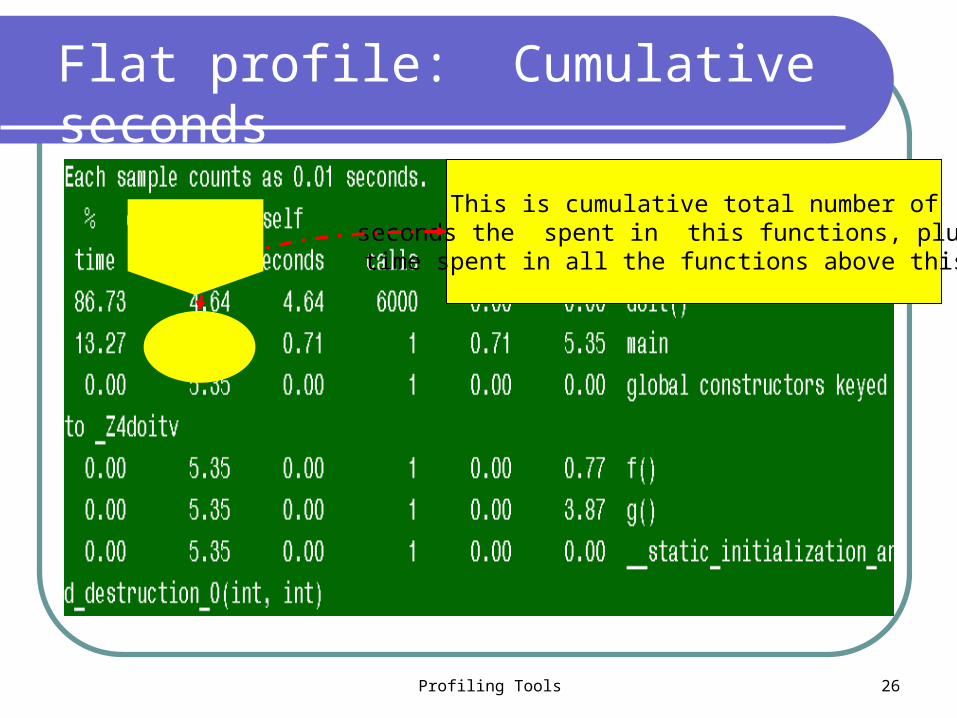
Flat profile: Cumulative seconds
This is cumulative total number of seconds the spent in this functions, plus the time spent in all the functions above this one
Profiling Tools 27
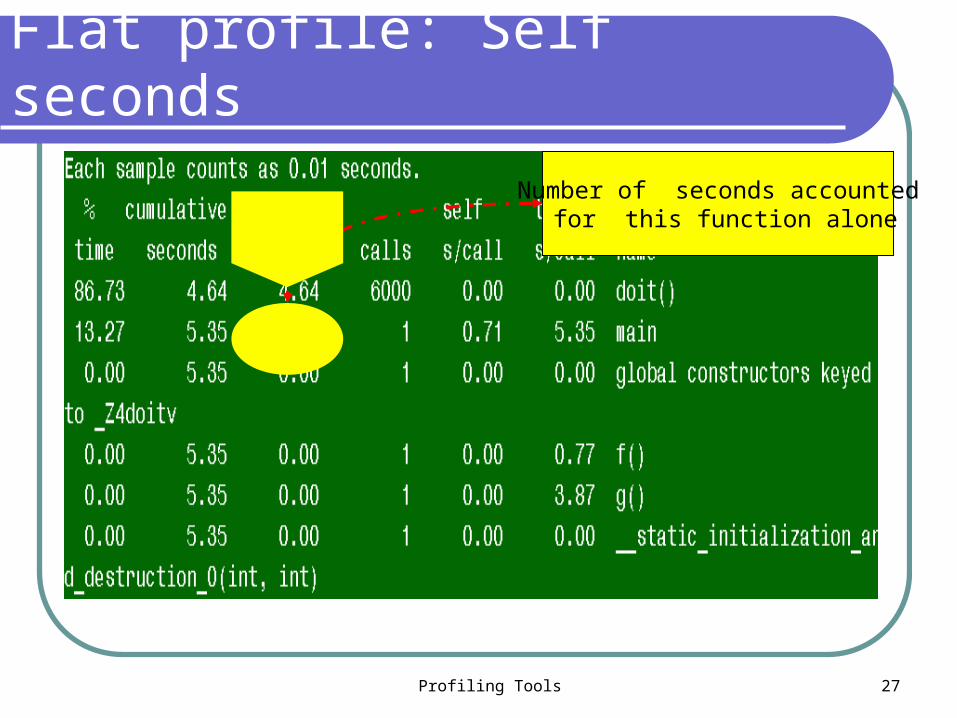
Number of seconds accounted for this function alone
Flat profile: Self seconds
Profiling Tools 28
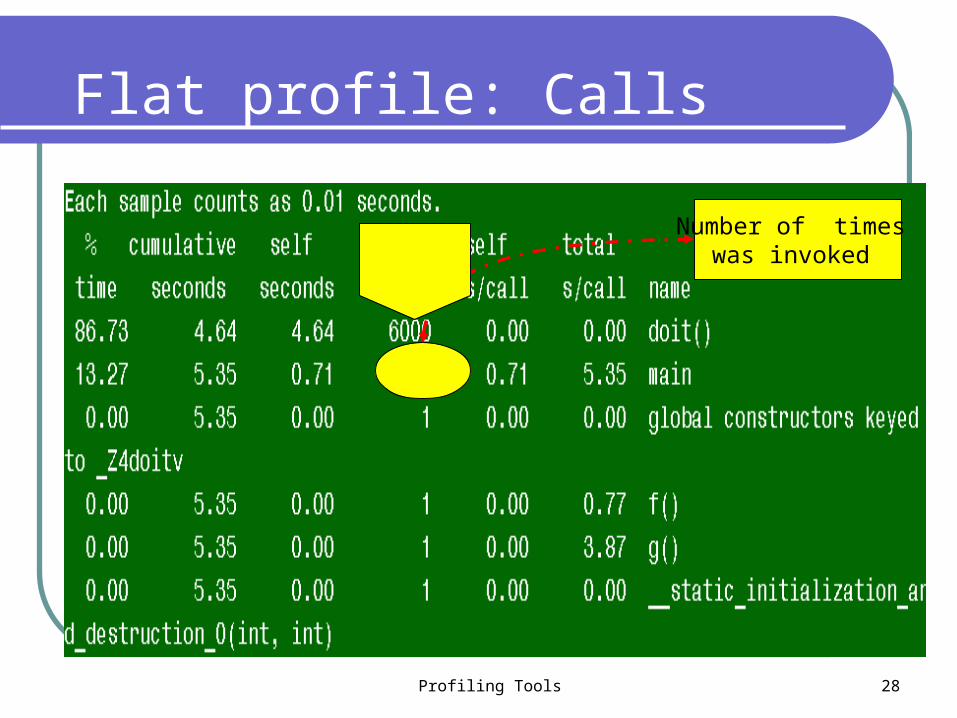
Number of times was invoked
Flat profile: Calls
Profiling Tools 29
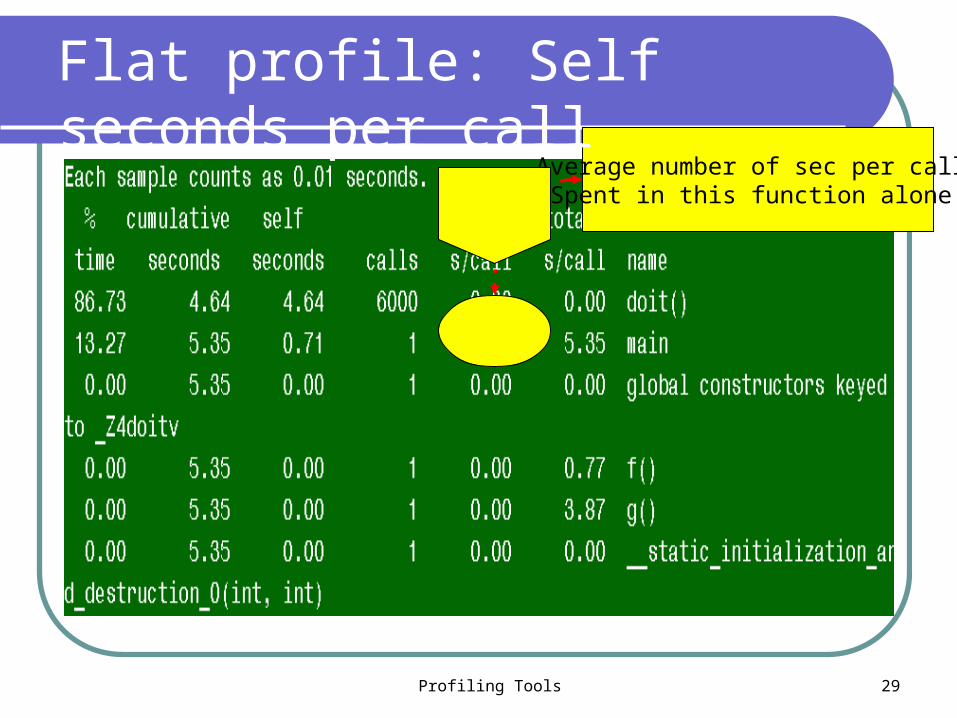
Average number of sec per call Spent in this function alone
Flat profile: Self seconds per call
Profiling Tools 30
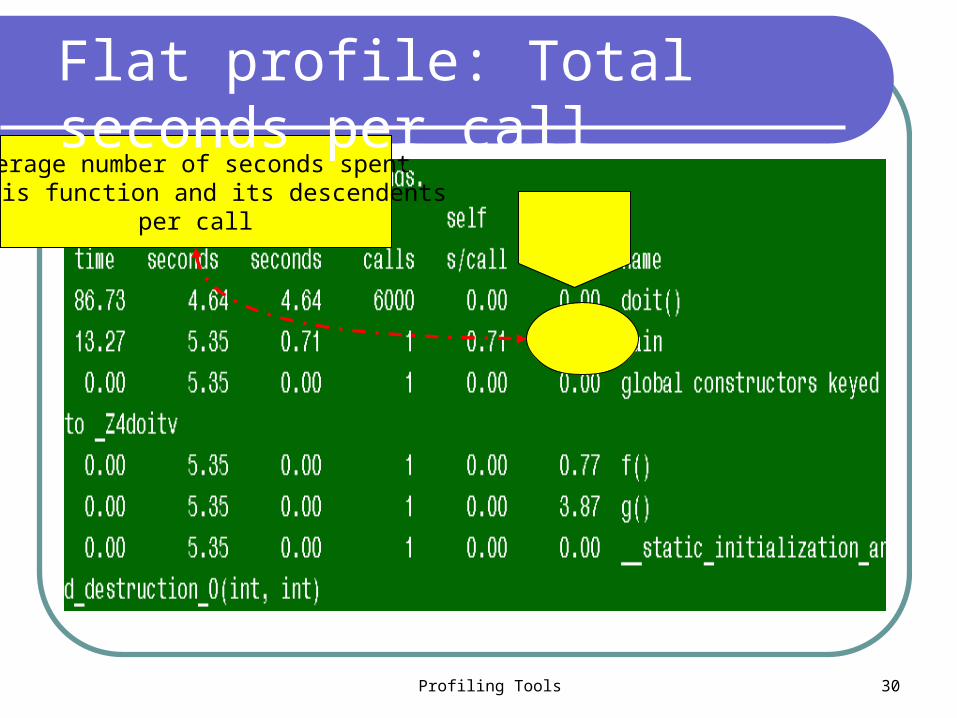
Average number of seconds spent in this function and its descendents
per call
Flat profile: Total seconds per call

Profiling Tools 31
Call Graph : call tree of the program
Current Function:
g( )
Called by :main ( )
Descendants: doit ( )
Profiling Tools 32
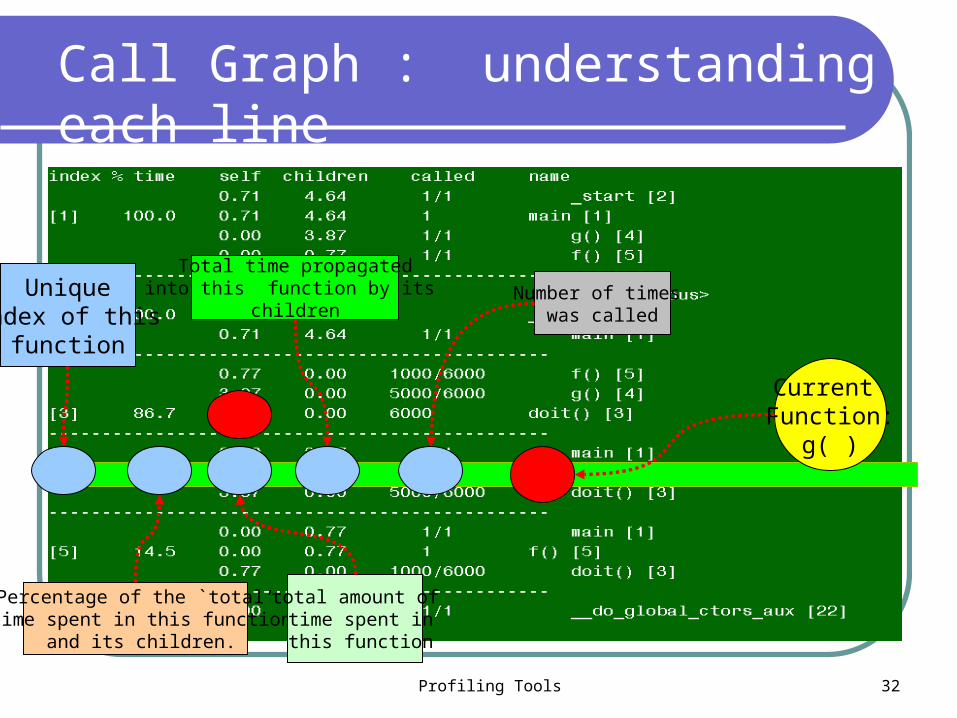
Call Graph : understanding each line
Current Function:
g( )
Unique index of this
function
Percentage of the `total‘ time spent in this function
and its children.
Total time propagatedinto this function by its
children
total amount of time spent in this function
Number of times was called
Profiling Tools 33
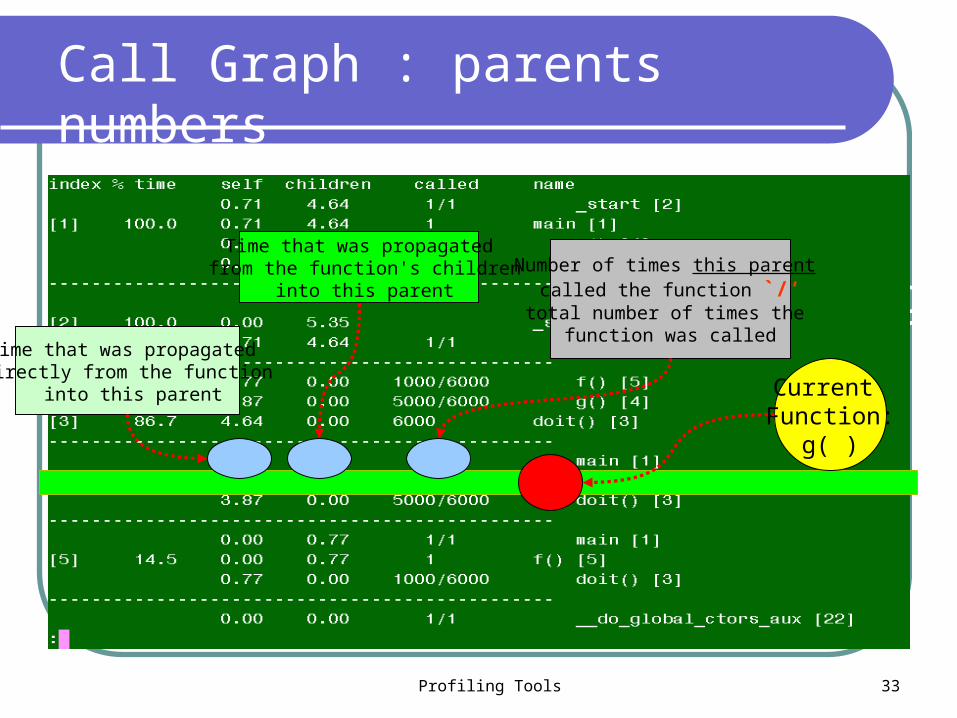
Call Graph : understanding each lineCurrent Function:
g( )
Time that was propagated from the function's children
into this parent
Time that was propagated directly from the function
into this parent
Number of times this parent called the function `/‘
total number of times the function was called
Call Graph : parents numbers
Profiling Tools 34
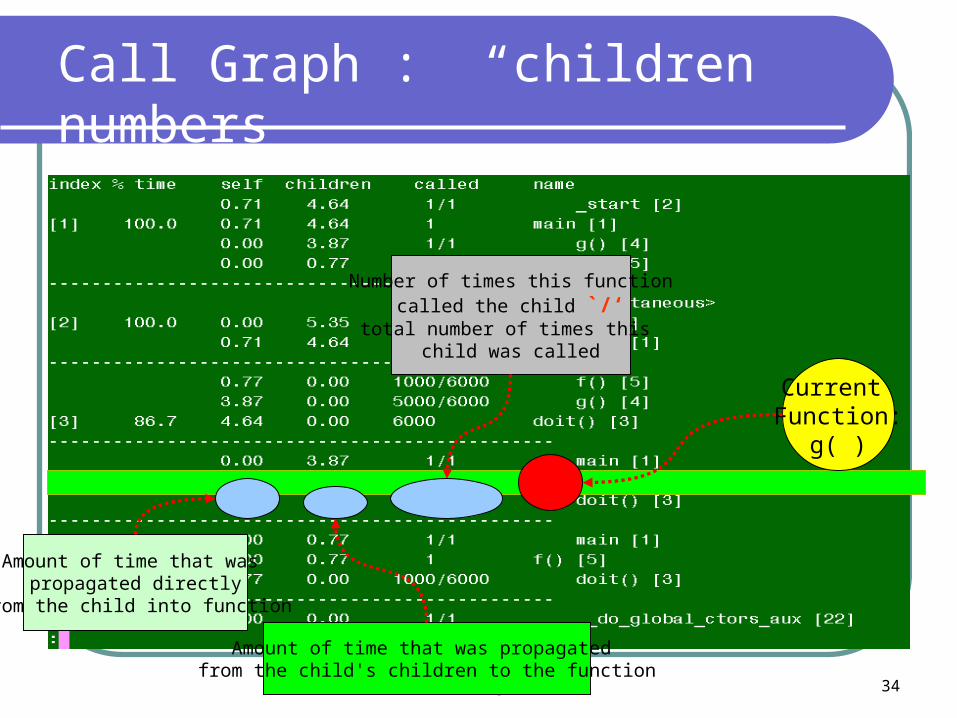
Call Graph : “children” numbers
Current Function:
g( )
Amount of time that was propagated from the child's children to the function
Amount of time that was propagated directly
from the child into function
Number of times this functioncalled the child `/‘
total number of times this child was called
Profiling Tools 35
How gprof works Instruments program to count calls Watches the program running, samples the PC every 0.01
sec Statistical inaccuracy : fast function may take 0 or 1
samples Run should be long enough comparing with sampling
period Combine several gmon.out files into single report
The output from gprof gives no indication of parts of your program that are limited by I/O or swapping bandwidth. This is because samples of the program counter are taken at fixed intervals of run time
number-of-calls figures are derived by counting, not sampling. They are completely accurate and will not vary from run to run if your program is deterministic
Profiling with inlining and other optimizations needs care
Profiling Tools 36
VTune performance analyzer
To squeeze every bit of power out of Intel architecture !
Profiling Tools 37
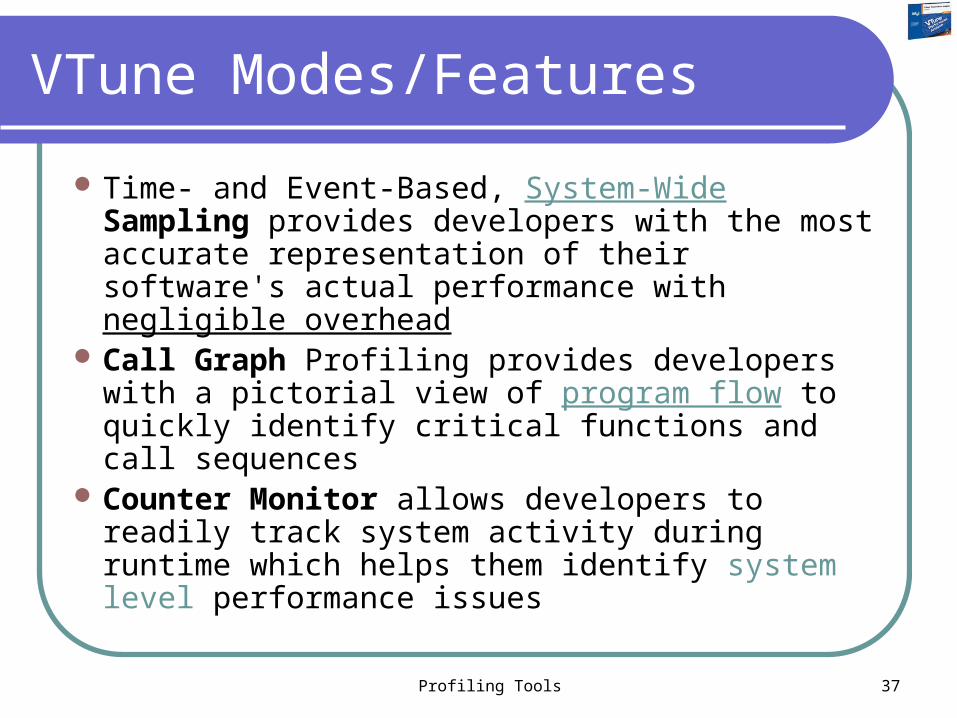
VTune Modes/Features
Time- and Event-Based, System-Wide Sampling provides developers with the most accurate representation of their software's actual performance with negligible overhead
Call Graph Profiling provides developers with a pictorial view of program flow to quickly identify critical functions and call sequences
Counter Monitor allows developers to readily track system activity during runtime which helps them identify system level performance issues

Profiling Tools 38
Sampling mode
Monitors all active software on your system including your application, the OS , JIT-
compiled Java* class files, Microsoft* .NET files, 16-bit applications, 32-bit applications, device drivers
Application performance is not impacted during data collection
Profiling Tools 39
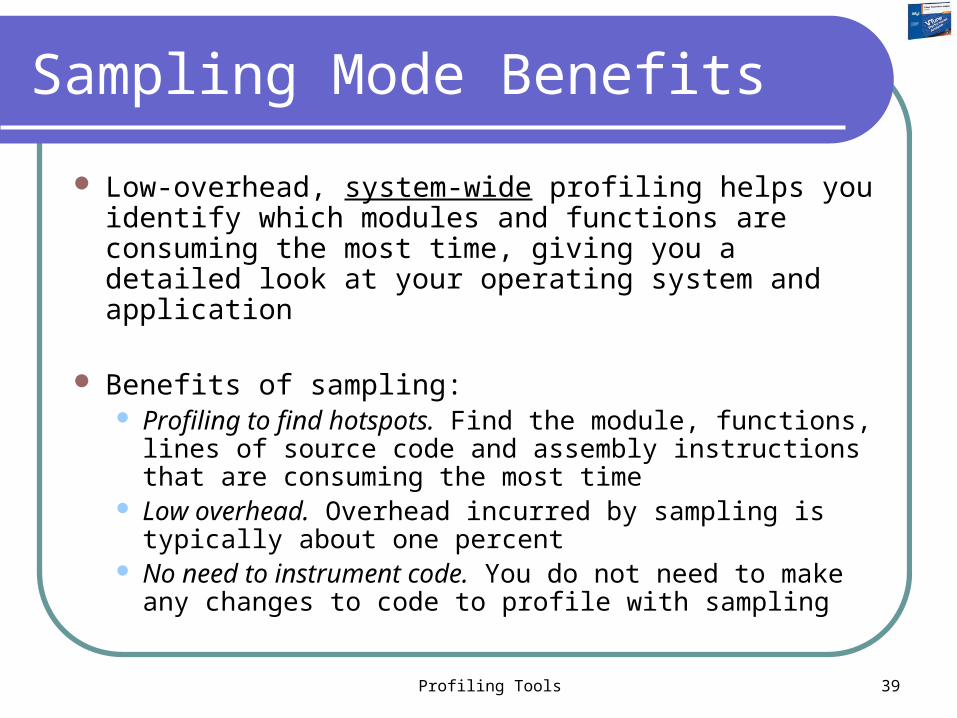
Sampling Mode Benefits
Low-overhead, system-wide profiling helps you identify which modules and functions are consuming the most time, giving you a detailed look at your operating system and application
Benefits of sampling: Profiling to find hotspots. Find the module, functions,
lines of source code and assembly instructions that are consuming the most time
Low overhead. Overhead incurred by sampling is typically about one percent
No need to instrument code. You do not need to make any changes to code to profile with sampling
Profiling Tools 40
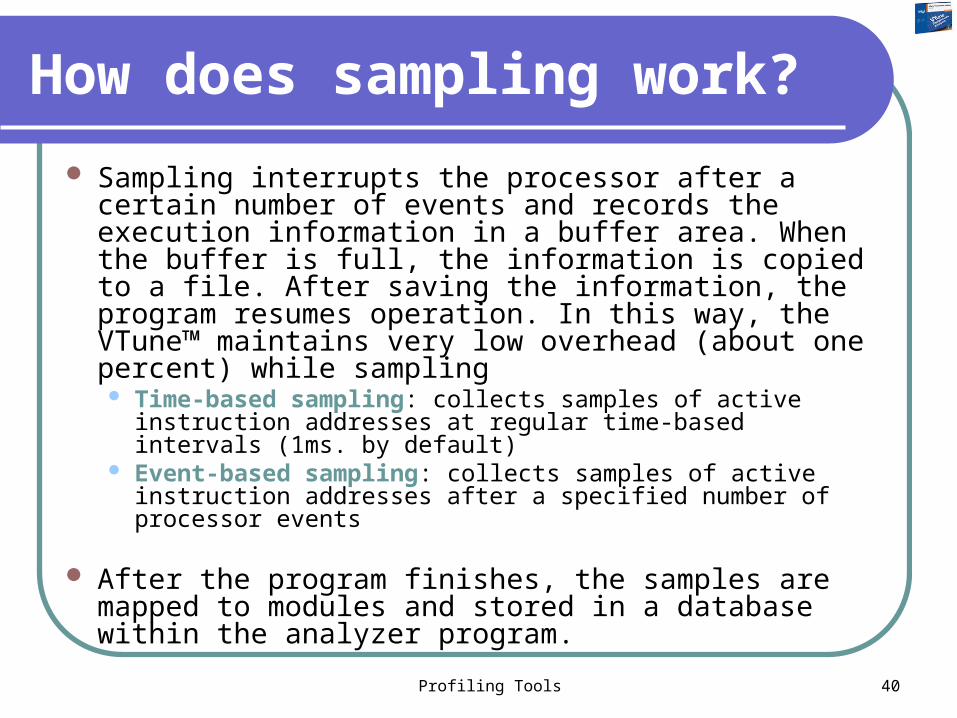
How does sampling work?
Sampling interrupts the processor after a certain number of events and records the execution information in a buffer area. When the buffer is full, the information is copied to a file. After saving the information, the program resumes operation. In this way, the VTune™ maintains very low overhead (about one percent) while sampling Time-based sampling: collects samples of active instruction
addresses at regular time-based intervals (1ms. by default) Event-based sampling: collects samples of active
instruction addresses after a specified number of processor events
After the program finishes, the samples are mapped to modules and stored in a database within the analyzer program.
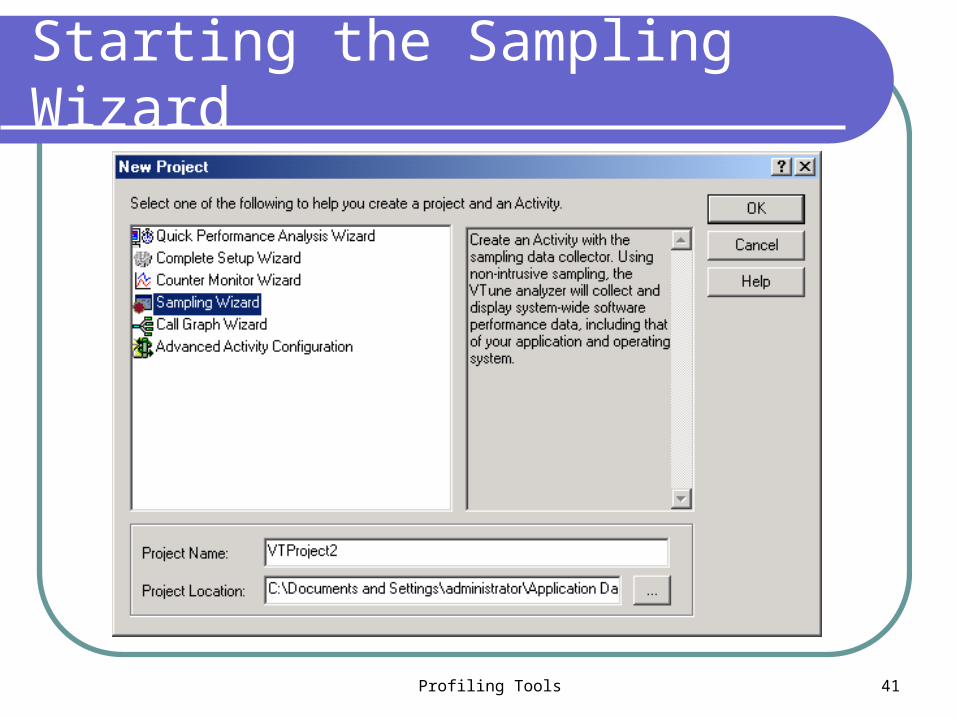
Profiling Tools 41
Starting the Sampling Wizard
Profiling Tools 42
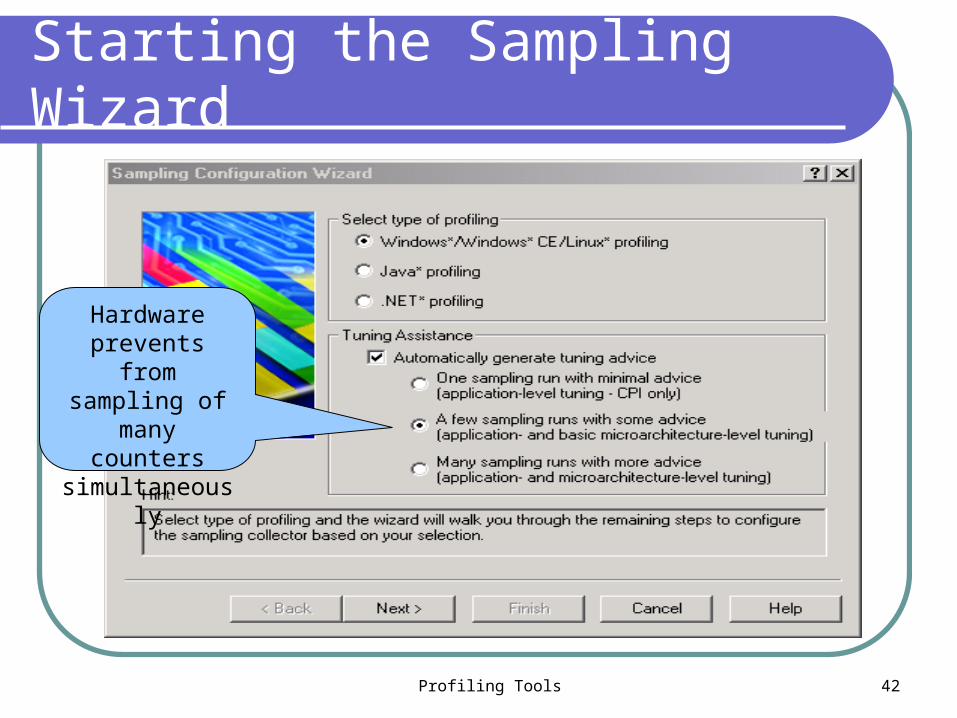
Starting the Sampling Wizard
Hardware prevents from sampling of
many counters simultaneously
Profiling Tools 43
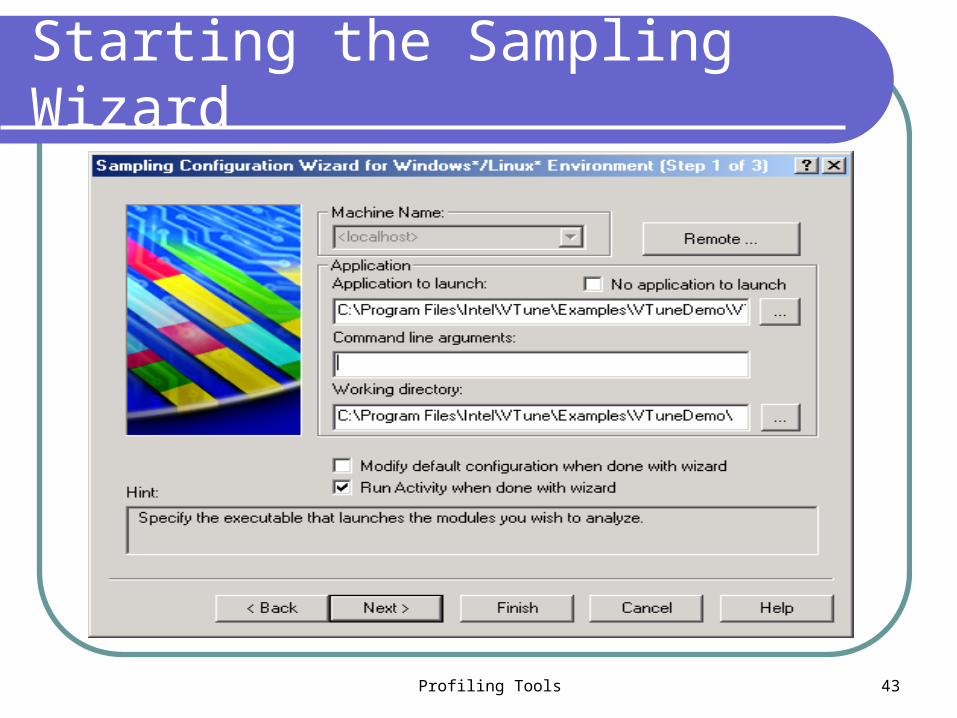
Starting the Sampling Wizard

Profiling Tools 44
Starting the Sampling Wizard
Unsupported CPU ?
Ha-ha-ha…
Profiling Tools 45
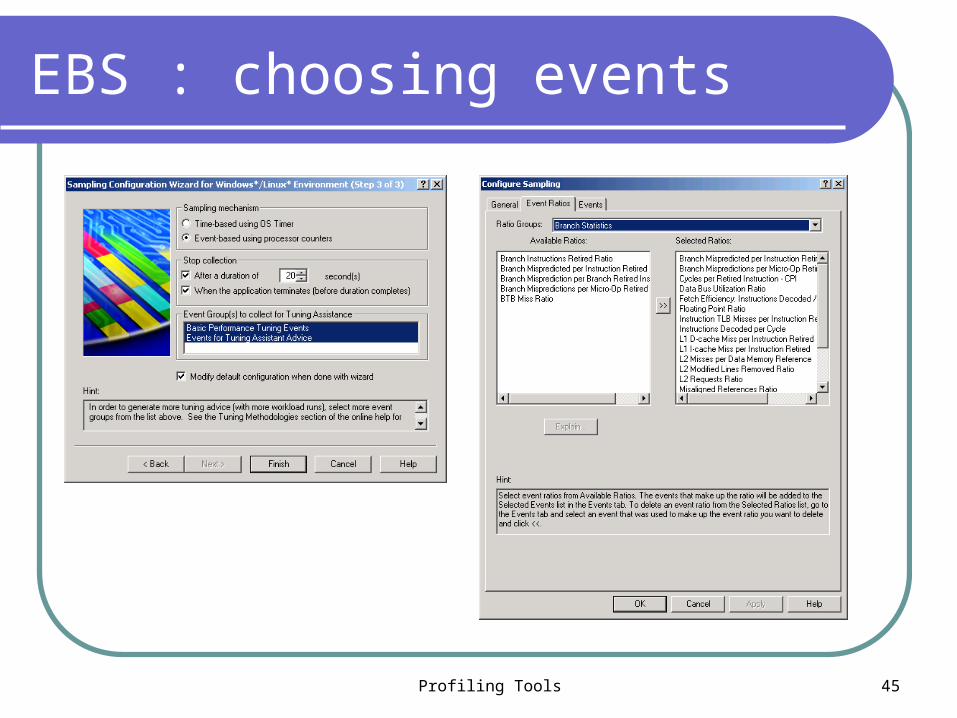
EBS : choosing events
Profiling Tools 46
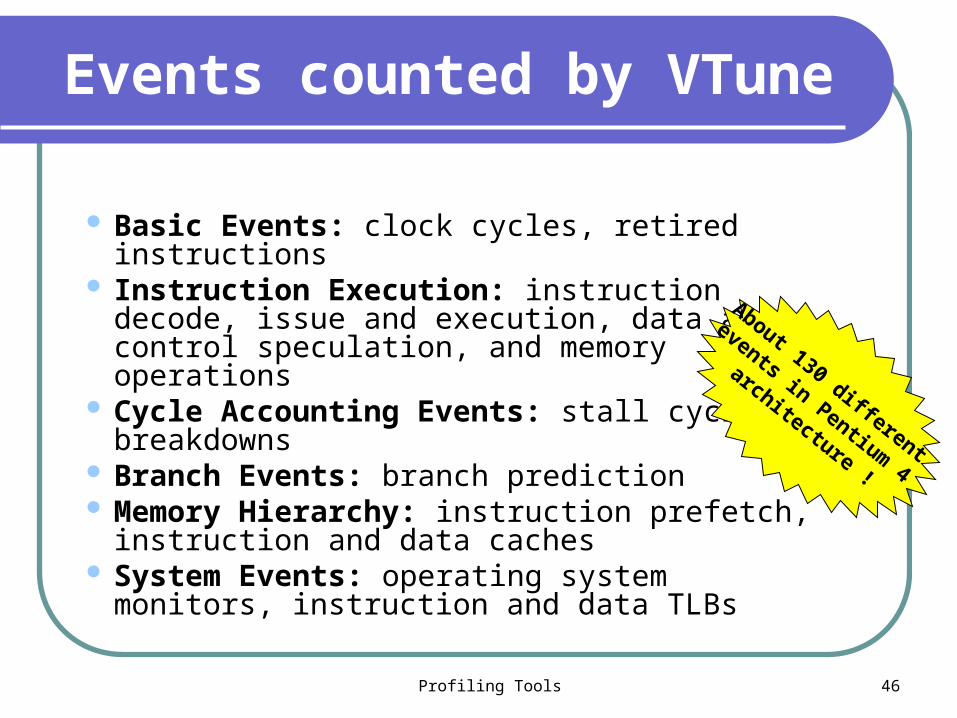
Events counted by VTune
Basic Events: clock cycles, retired instructions Instruction Execution: instruction decode,
issue and execution, data and control speculation, and memory operations
Cycle Accounting Events: stall cycle breakdowns
Branch Events: branch prediction Memory Hierarchy: instruction prefetch,
instruction and data caches System Events: operating system monitors,
instruction and data TLBs
About 130 different
events in Pentium 4
architecture !
Profiling Tools 47
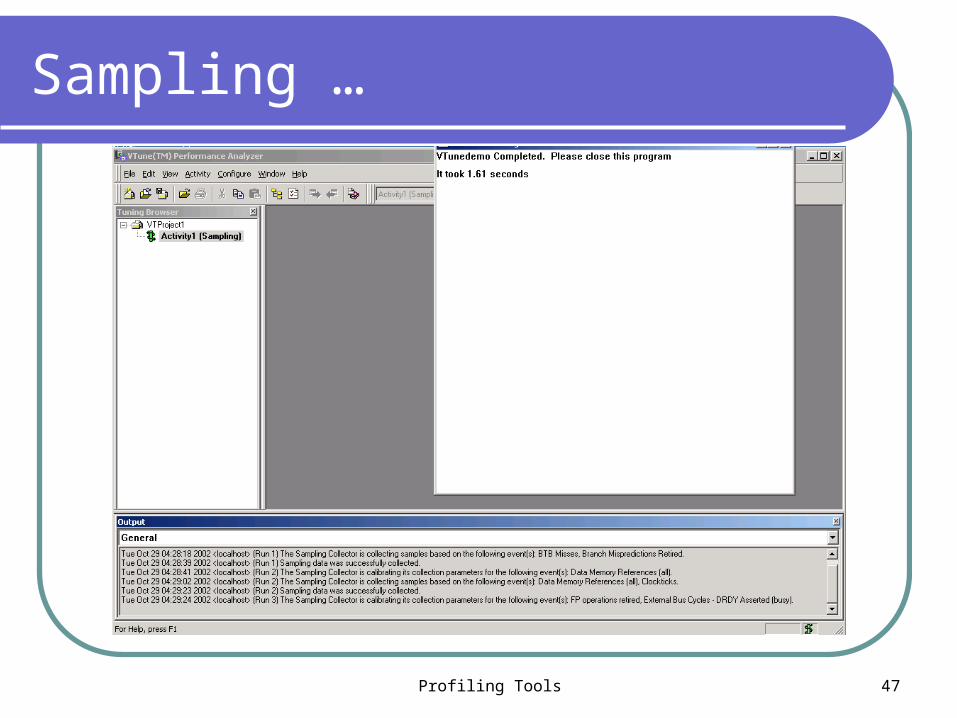
Sampling …

Profiling Tools 48
Viewing Sampling Results
Process view all the processes that ran on the system during data
collection Thread view
the threads that ran within the processes you select in Process view
Module view the modules that ran within the selected processes
and threads Hotspot view
the functions within the modules you select in Module view
Profiling Tools 49
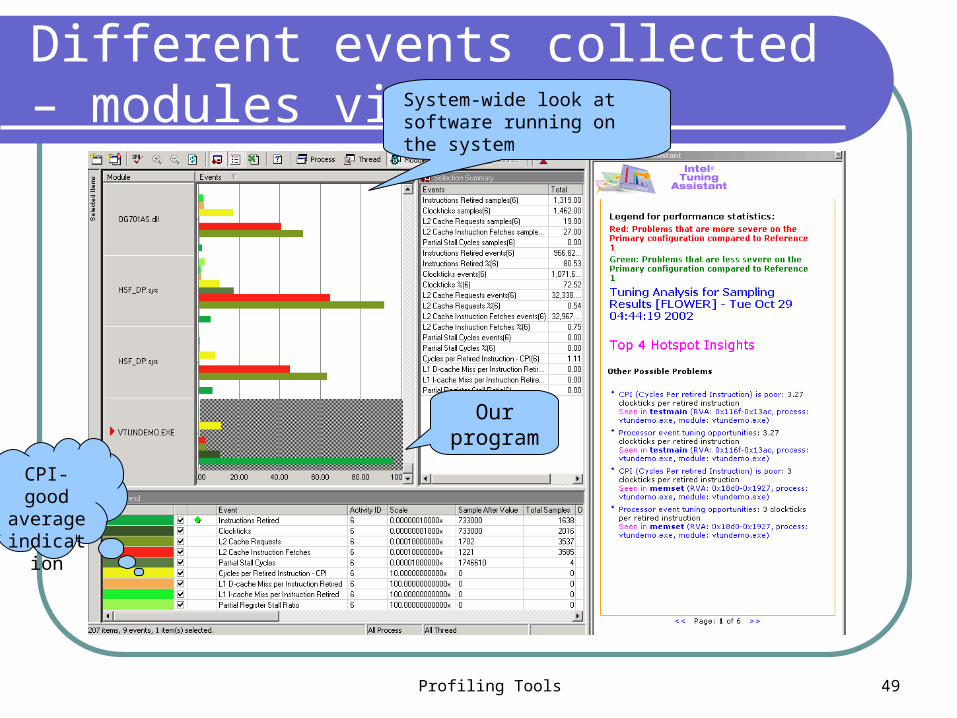
Different events collected – modules view
Our program
System-wide look at software running on the system
CPI- good
average indication
Profiling Tools 50
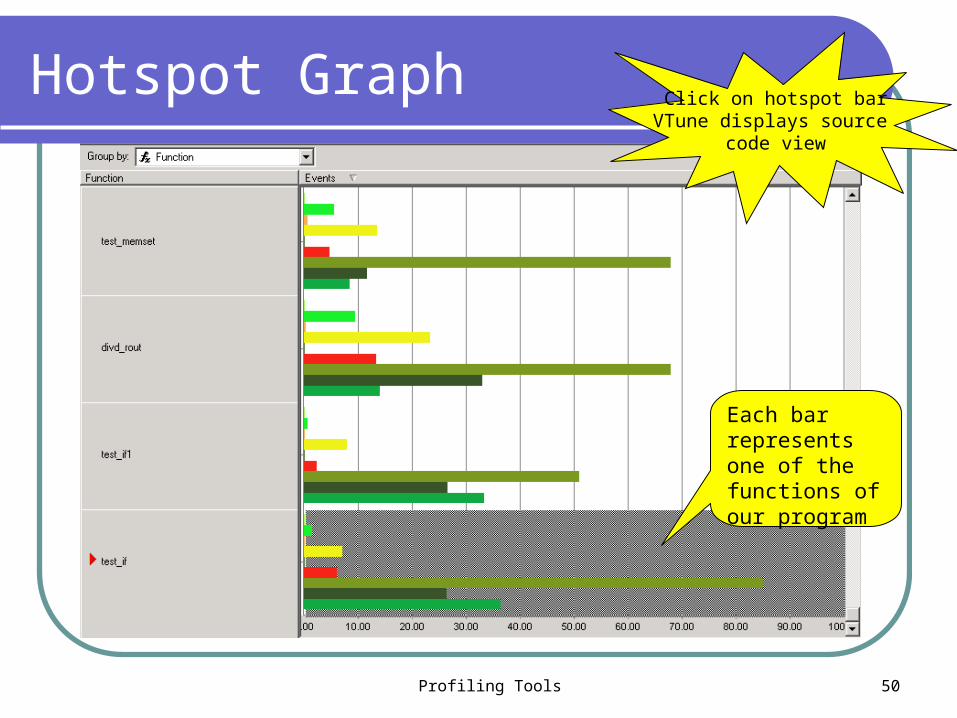
Hotspot Graph
Each bar represents one of the functions of our program
Click on hotspot barVTune displays source
code view
Profiling Tools 51
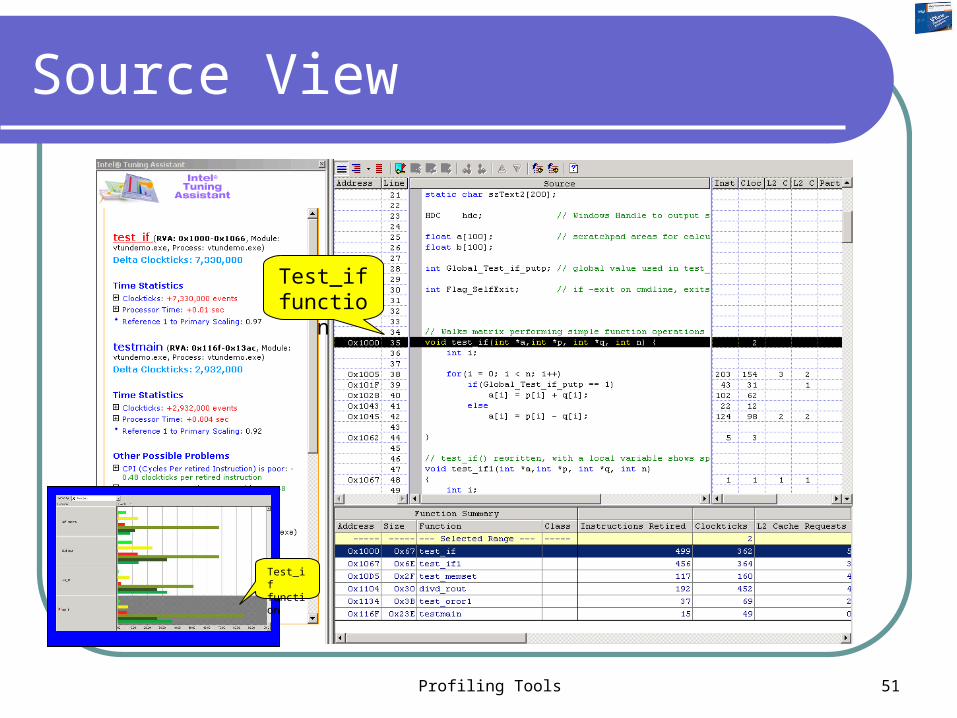
Source View
Test_if function
Test_if function
Profiling Tools 52
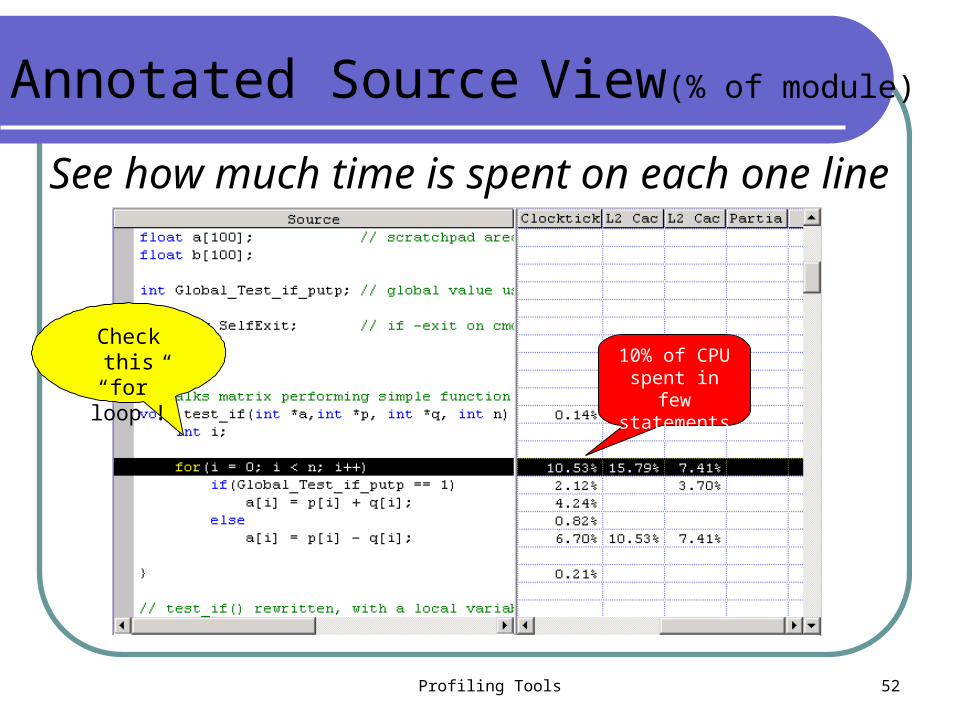
See how much time is spent on each one line
Annotated Source View(% of module)
Check this “for” loop ! 10% of CPU
spent in few statements

Profiling Tools 53
VTune Tuning assistant
In few clicks we reached to the performance problem! Now, how to solve it ?
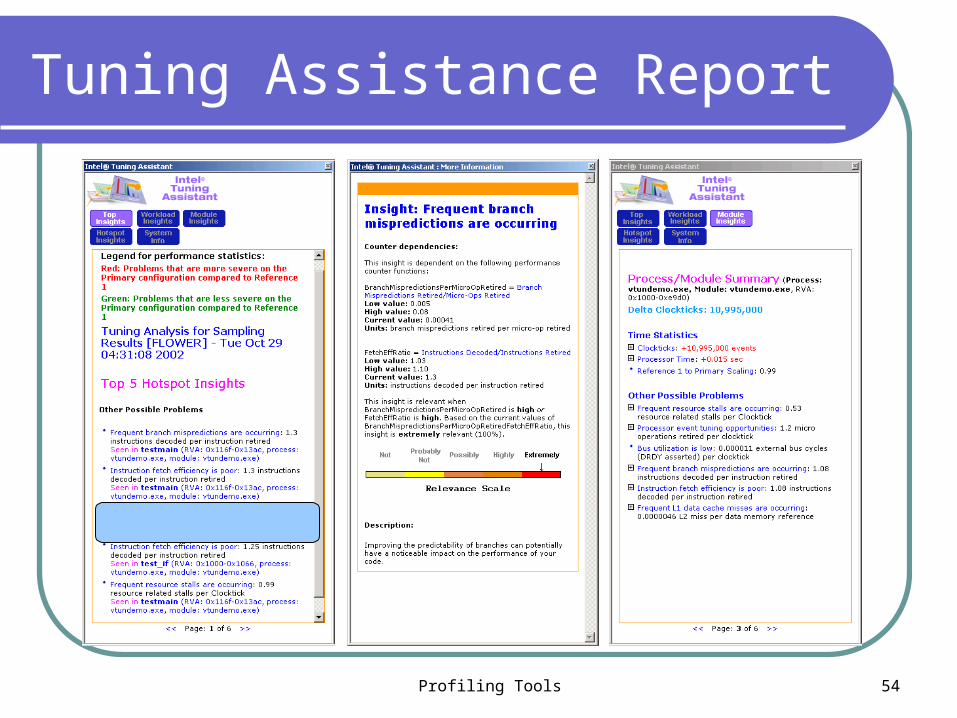
Tuning Assistant highlights performance problems Provides approximate time lost by each performance
problem Database contains performance metrics based on
Intel’s experience of tuning hundreds of applications Analyzes the data gathered by our application Generates tuning recommendations for each “hotspot” Gives user idea what might be done to fix the problem
Profiling Tools 54
Tuning Assistance Report
Profiling Tools 55
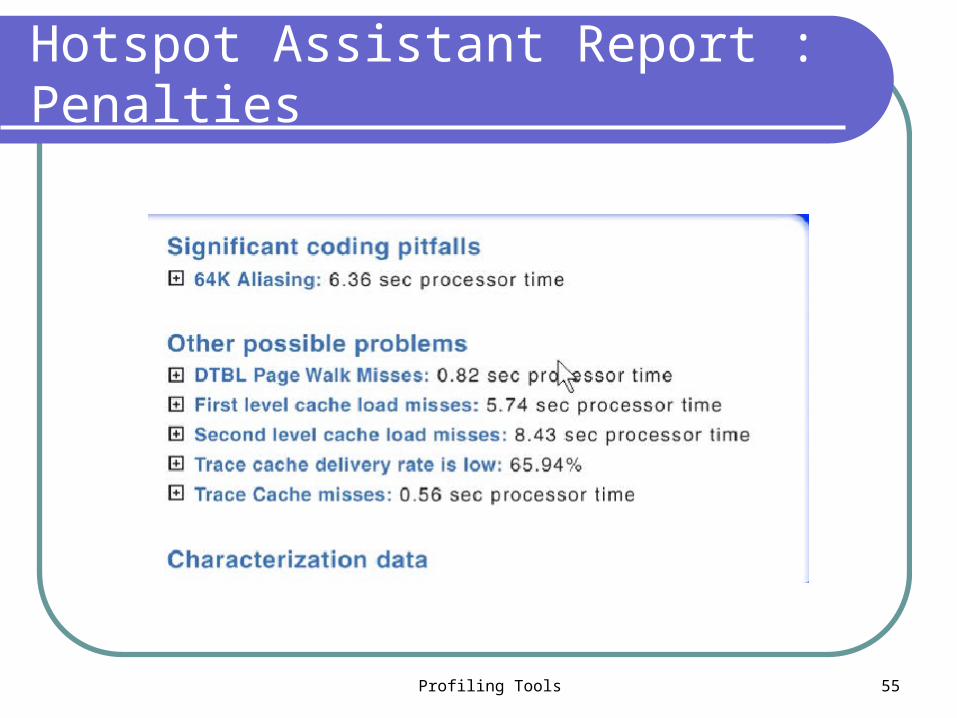
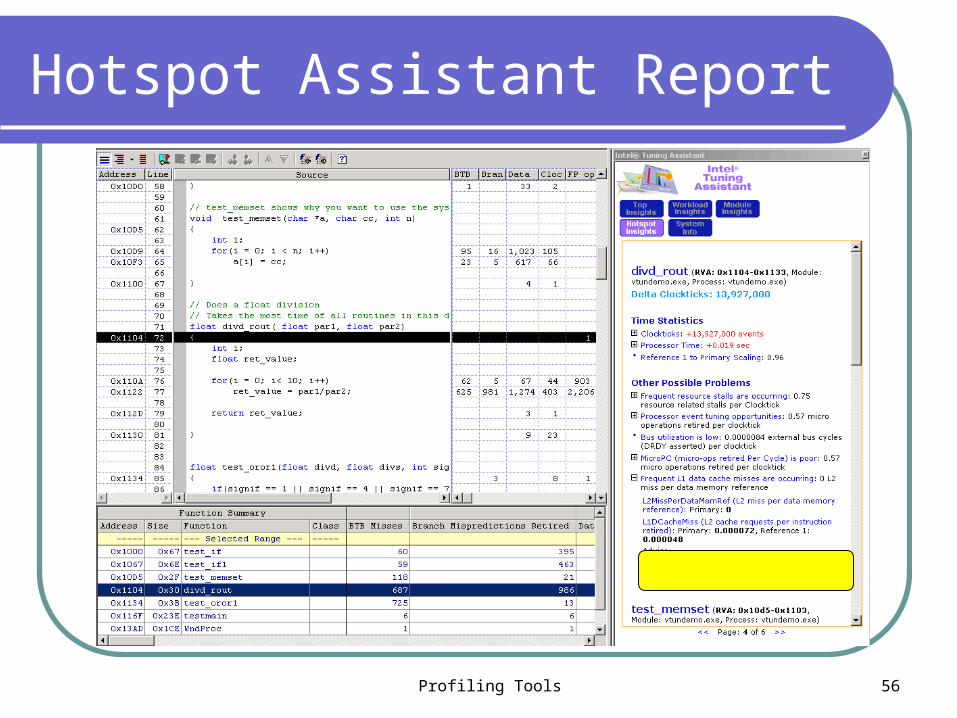
Hotspot Assistant Report : Penalties
Profiling Tools 56
Hotspot Assistant Report
Profiling Tools 57
Call Graph Mode
Provides with a pictorial view of program flow to quickly identify critical functions and call sequences
Call graph profiling reveals: Structure of your program on a function level Number of times a function is called from a
particular location The time spent in each function Functions on a critical path.
Profiling Tools 58
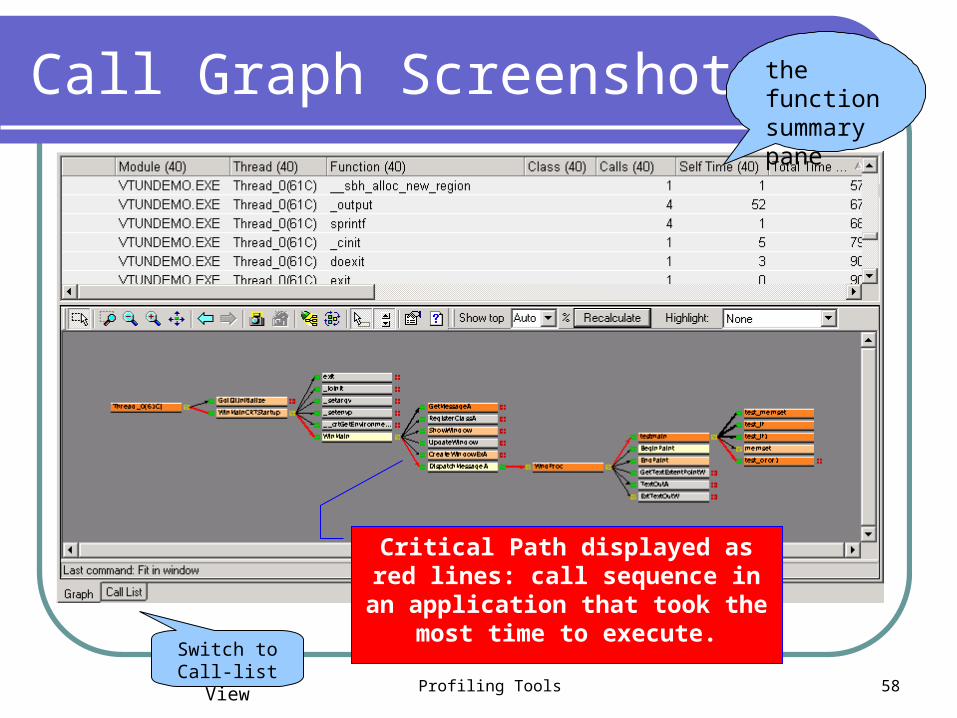
Call Graph Screenshot
Critical Path displayed as red lines: call sequence in an application that
took the most time to execute.
the function summary pane
Switch to Call-list View
Profiling Tools 59
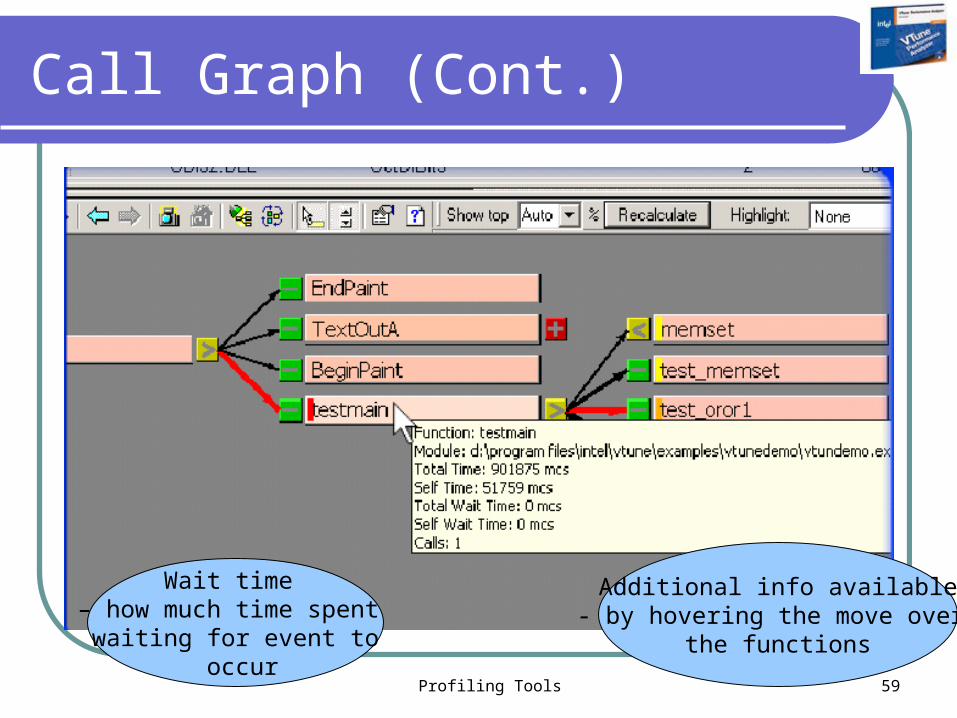
Call Graph (Cont.)
Wait time – how much time spent
waiting for event to occur
Additional info available- by hovering the move over
the functions

Profiling Tools 60
Jump to Source view
Profiling Tools 61
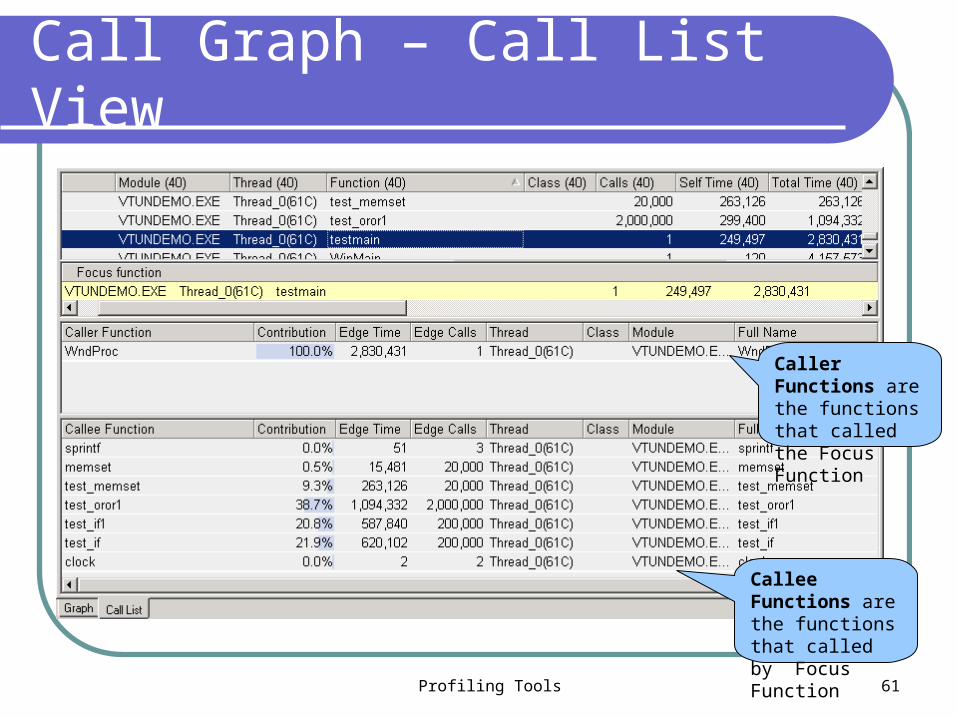
Call Graph – Call List View
Caller Functions are the functions that called the Focus Function
Callee Functions are the functions that called by Focus Function

Profiling Tools 62
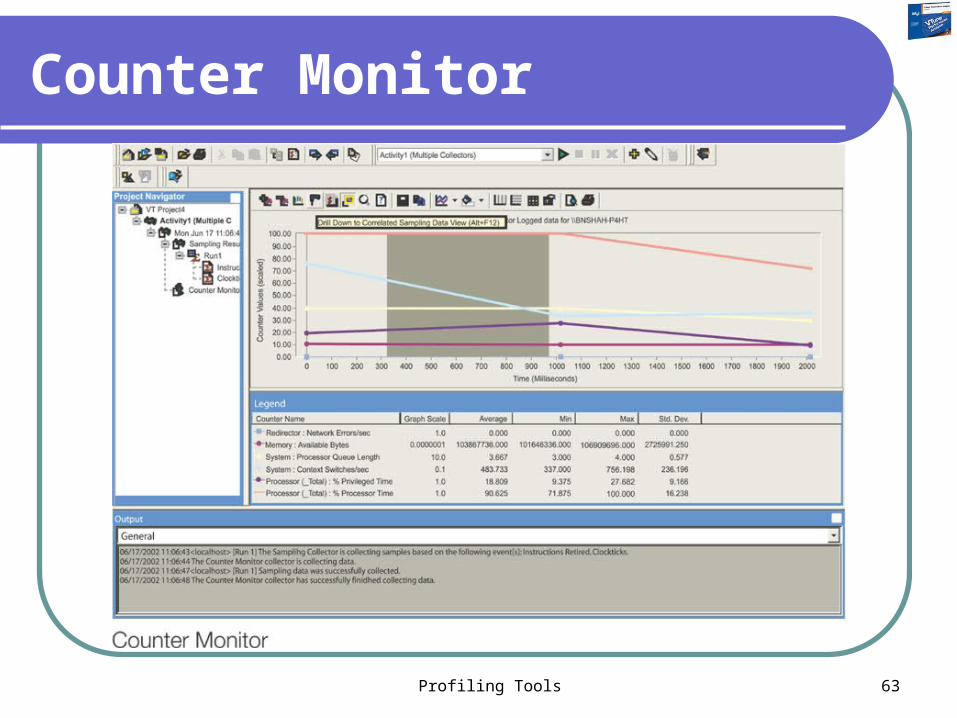
Counter Monitor
Use the Counter Monitor feature of the VTune™ to collect and display performance counter data. Counter monitor selectively polls performance counters, which are grouped categorically into performance objects.
With the VTune analyzer, you can: Monitor selected counters in performance objects. Correlate performance counter data with data
collected by other features in the VTune analyzer, such as sampling.
Trigger the collection of counter data on events other than a periodic timer.
Profiling Tools 63
Counter Monitor
Profiling Tools 64
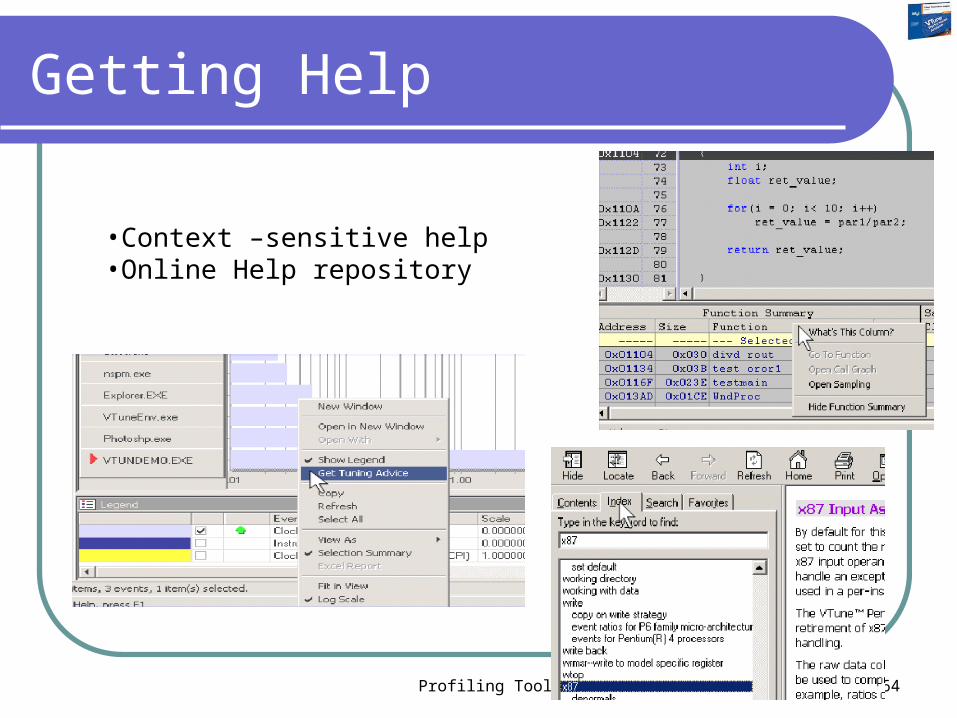
Getting Help
•Context –sensitive help•Online Help repository
Profiling Tools 65
VTune Summary
Pros: Allows to get best possible performance out of Intel architecture
Cons: Extreme tuning requires deep understanding of processor and OS internals
Profiling Tools 66
Valgrind
Multi-purpose Linux x86 profiling tool
Profiling Tools 67
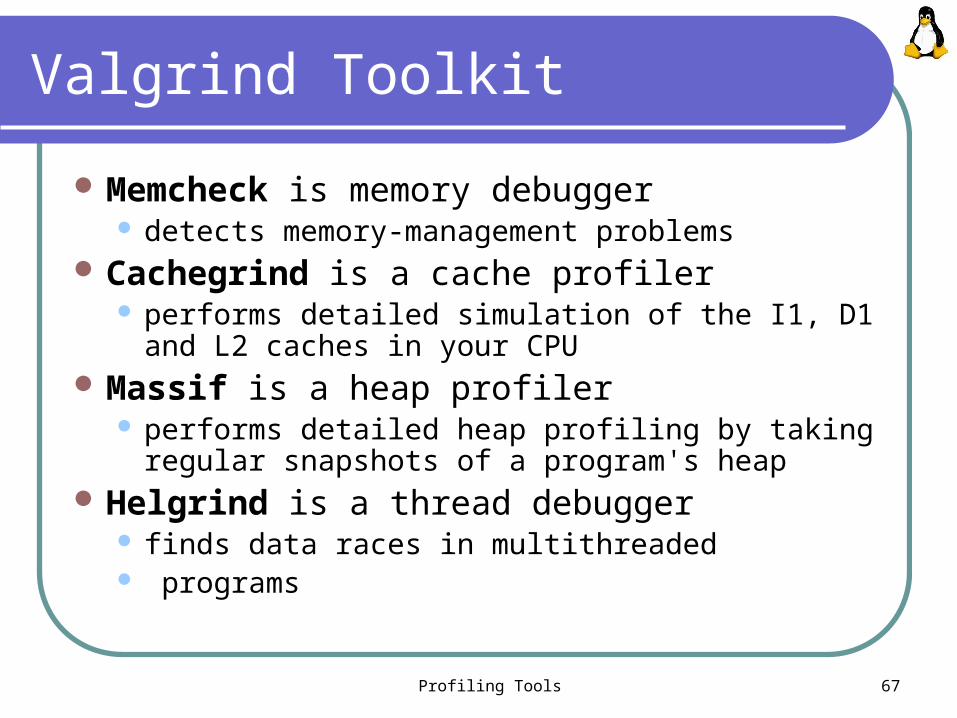
Valgrind Toolkit
Memcheck is memory debugger detects memory-management problems
Cachegrind is a cache profiler performs detailed simulation of the I1, D1 and L2
caches in your CPU Massif is a heap profiler
performs detailed heap profiling by taking regular snapshots of a program's heap
Helgrind is a thread debugger finds data races in multithreaded programs
Profiling Tools 68
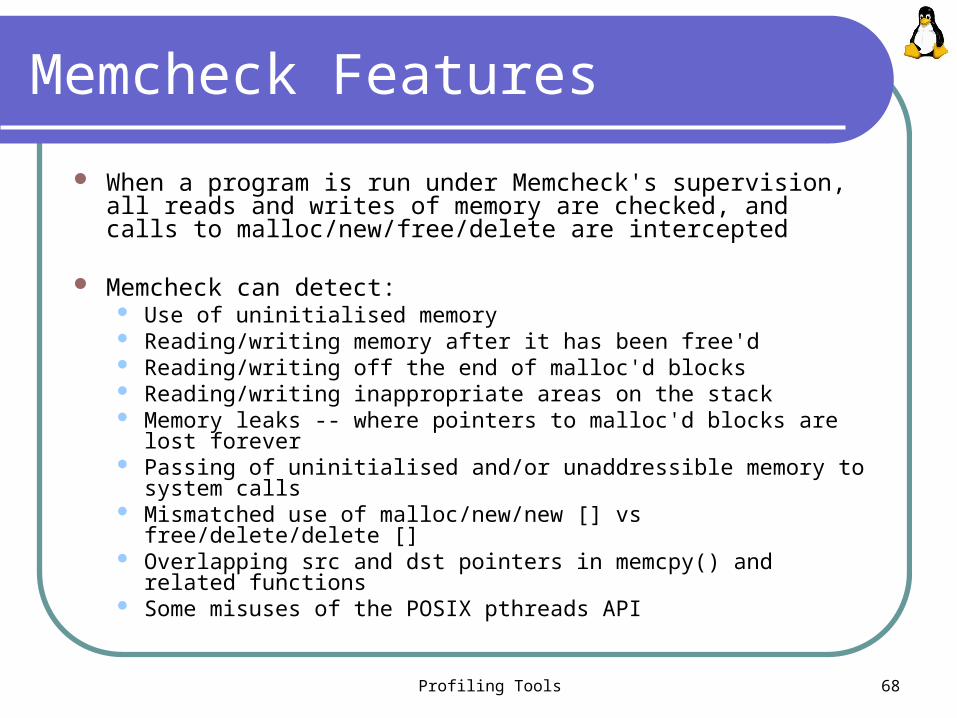
Memcheck Features
When a program is run under Memcheck's supervision, all reads and writes of memory are checked, and calls to malloc/new/free/delete are intercepted
Memcheck can detect: Use of uninitialised memory Reading/writing memory after it has been free'd Reading/writing off the end of malloc'd blocks Reading/writing inappropriate areas on the stack Memory leaks -- where pointers to malloc'd blocks are lost forever Passing of uninitialised and/or unaddressible memory to system
calls Mismatched use of malloc/new/new [] vs free/delete/delete [] Overlapping src and dst pointers in memcpy() and related functions Some misuses of the POSIX pthreads API
Profiling Tools 69
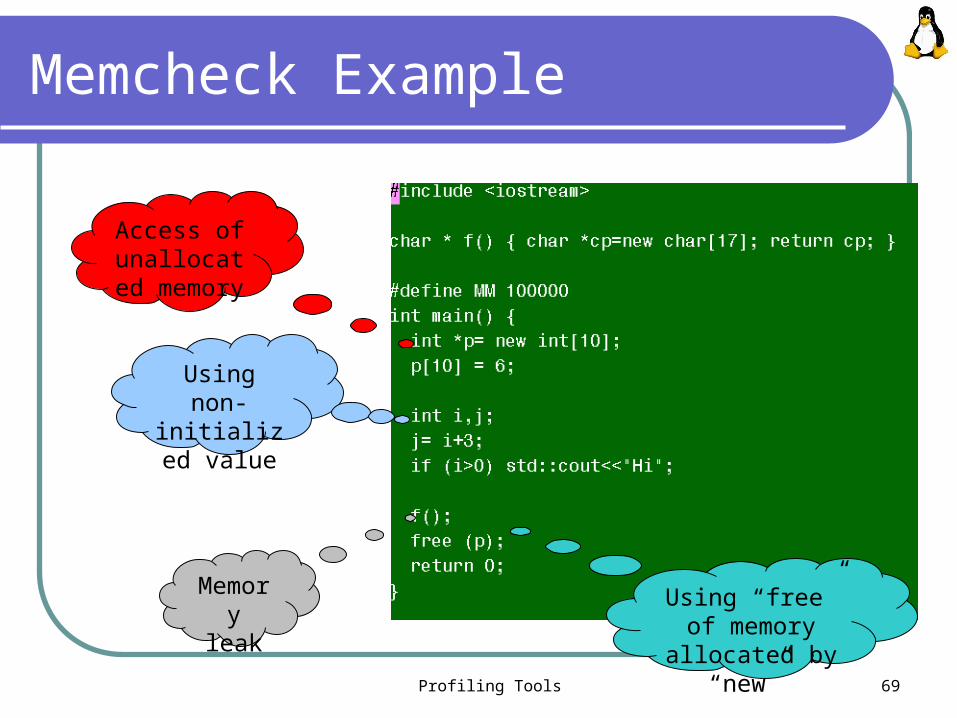
Memcheck Example
Using non-initialized
value
Using “free” of memory
allocated by “new”
Access of unallocated
memory
Memory leak
Profiling Tools 70
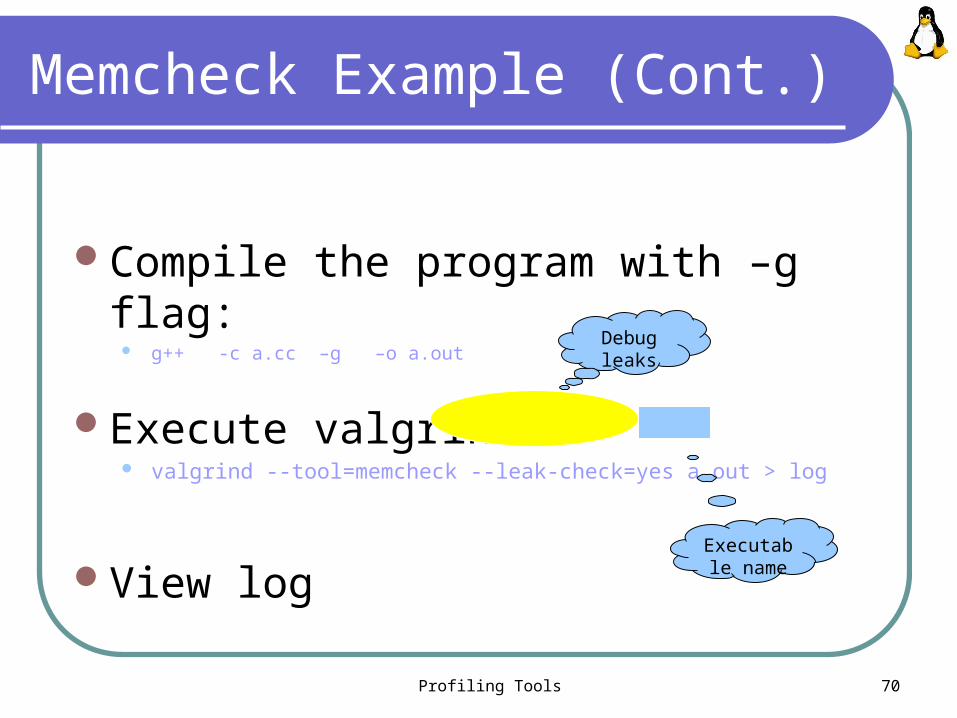
Memcheck Example (Cont.)
Compile the program with –g flag: g++ -c a.cc –g –o a.out
Execute valgrind : valgrind --tool=memcheck --leak-check=yes a.out > log
View log
Debug leaks
Executable name

Profiling Tools 71
Memcheck report
Profiling Tools 72
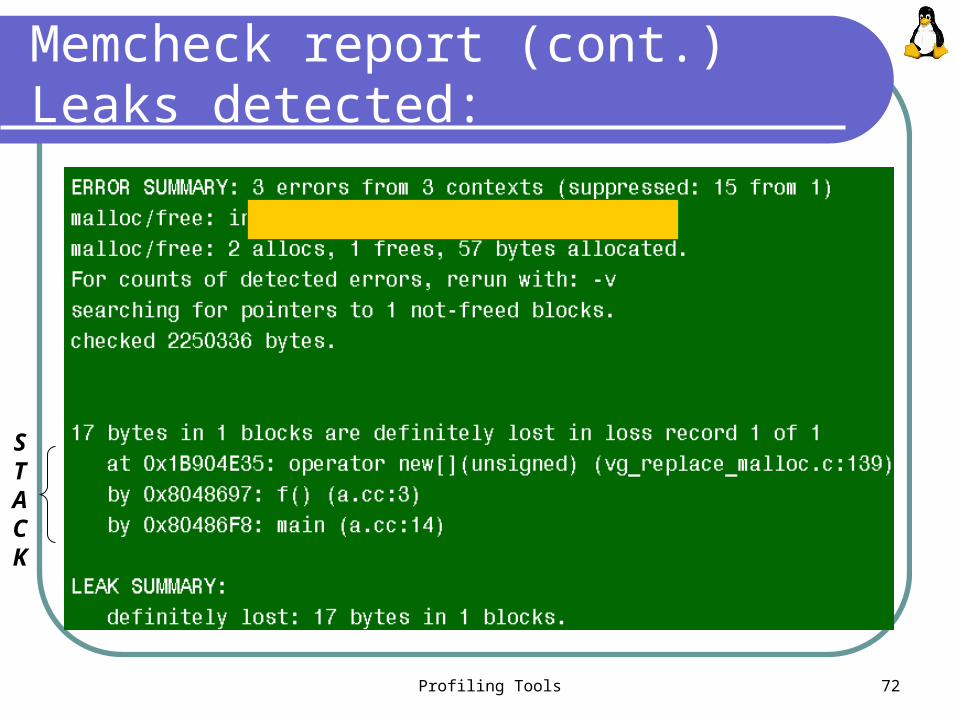
Memcheck report (cont.)Leaks detected:
STACK

Profiling Tools 73
Cachegrind
Detailed cache profiling can be very useful for improving the performance of the program On a modern x86 machine, an L1 miss will cost around 10
cycles, and an L2 miss can cost as much as 200 cycles Cachegrind performs detailed simulation of the I1, D1
and L2 caches in your CPU Can accurately pinpoint the sources of cache misses in
your code Identifies number of cache misses, memory references
and instructions executed for each line of source code, with per-function, per-module and whole-program summaries
Cachegrind runs programs about 20--100x slower than normal
Profiling Tools 74
How to run
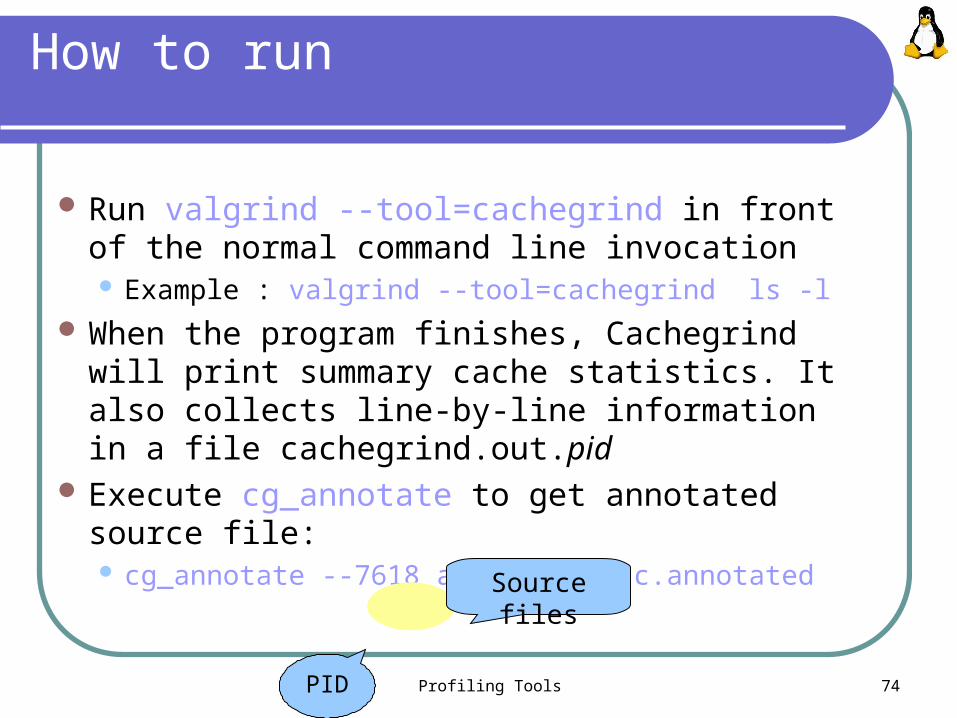
Run valgrind --tool=cachegrind in front of the normal command line invocation Example : valgrind --tool=cachegrind ls -l
When the program finishes, Cachegrind will print summary cache statistics. It also collects line-by-line information in a file cachegrind.out.pid
Execute cg_annotate to get annotated source file: cg_annotate --7618 a.cc > a.cc.annotated
PID
Source files
Profiling Tools 75
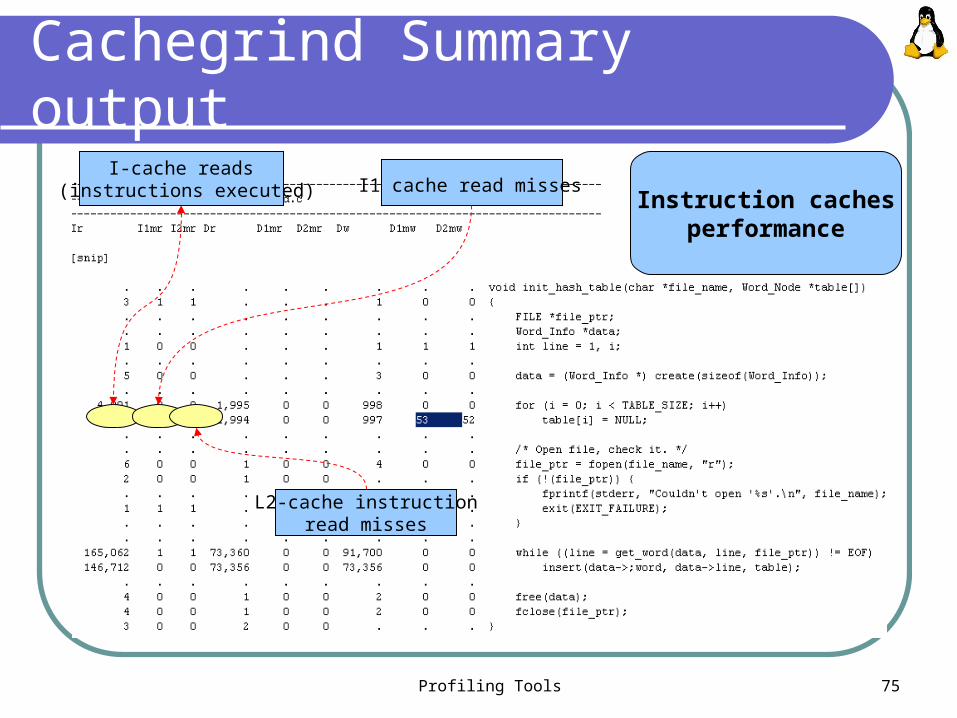
Cachegrind Summary output
I-cache reads (instructions executed) I1 cache read misses
L2-cache instruction read misses
Instruction cachesperformance
Profiling Tools 76
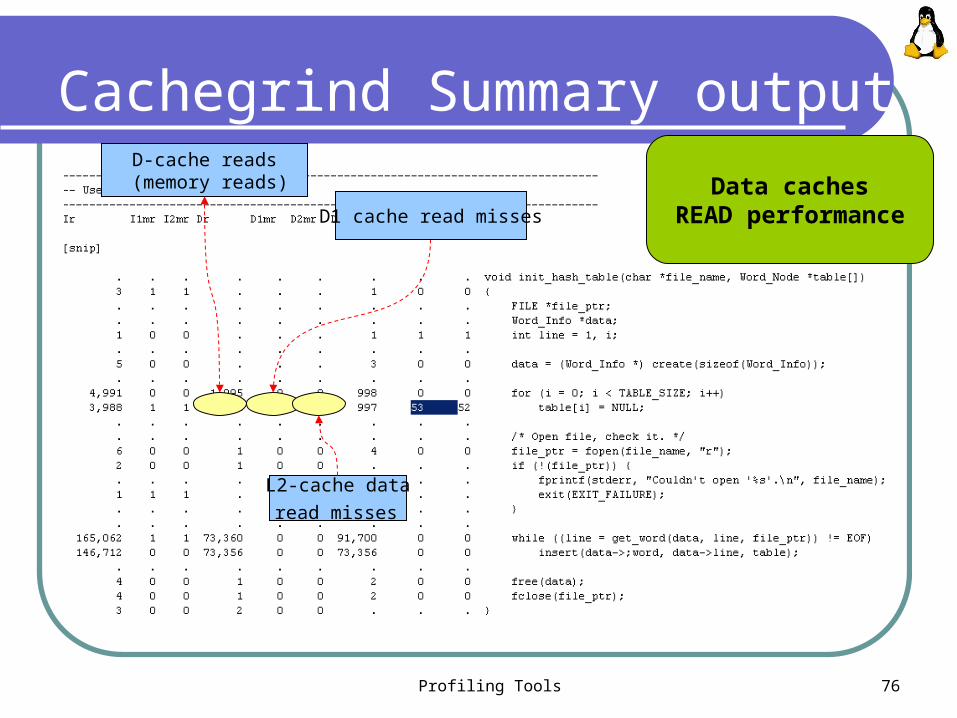
Cachegrind Summary outputD-cache reads
(memory reads)
L2-cache data
read misses
Data cachesREAD performance D1 cache read misses
Profiling Tools 77
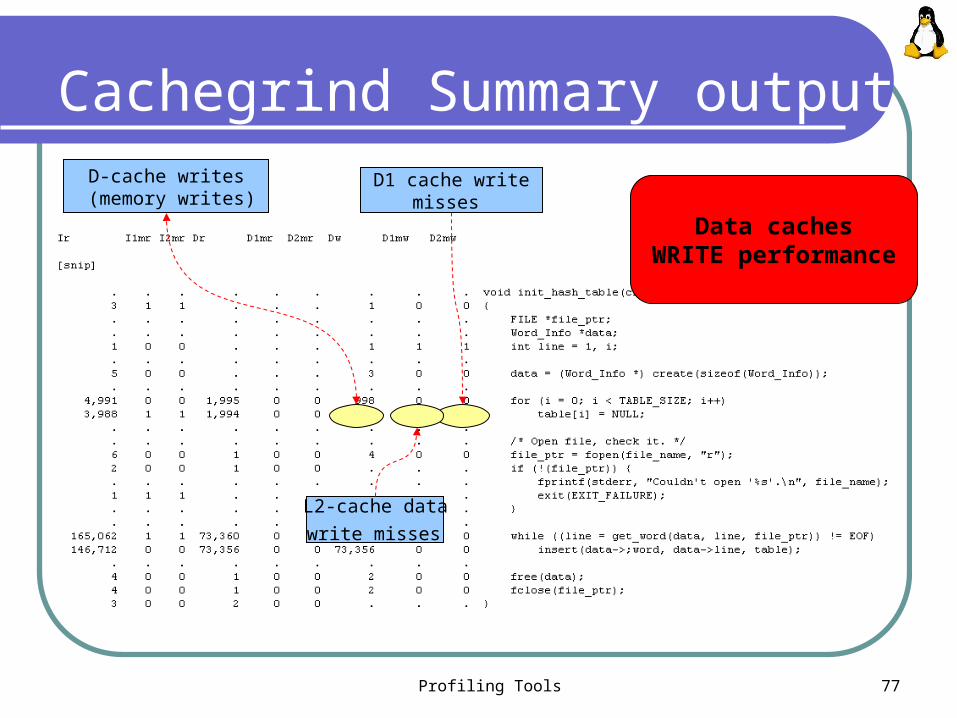
Cachegrind Summary outputD-cache writes
(memory writes) D1 cache write
misses
L2-cache data
write misses
Data cachesWRITE performance
Profiling Tools 78
Cachegrind Accuracy
Valgrind's cache profiling has a number of shortcomings: It doesn't account for kernel activity -- the effect of
system calls on the cache contents is ignored It doesn't account for other process activity
(although this is probably desirable when considering a single program)
It doesn't account for virtual-to-physical address mappings; hence the entire simulation is not a true representation of what's happening in the cache
Profiling Tools 79
Massif tool
Massif is a heap profiler - it measures how much heap memory programs use. It can give information about: Heap blocks Heap administration blocks Stack sizes
Help to reduce the amount of memory the program uses smaller program interact better with caches, avoid
paging Detect leaks that aren't detected by traditional leak-
checkers, such as Memcheck That's because the memory isn't ever actually lost - a
pointer remains to it - but it's not in use anymore
Profiling Tools 80
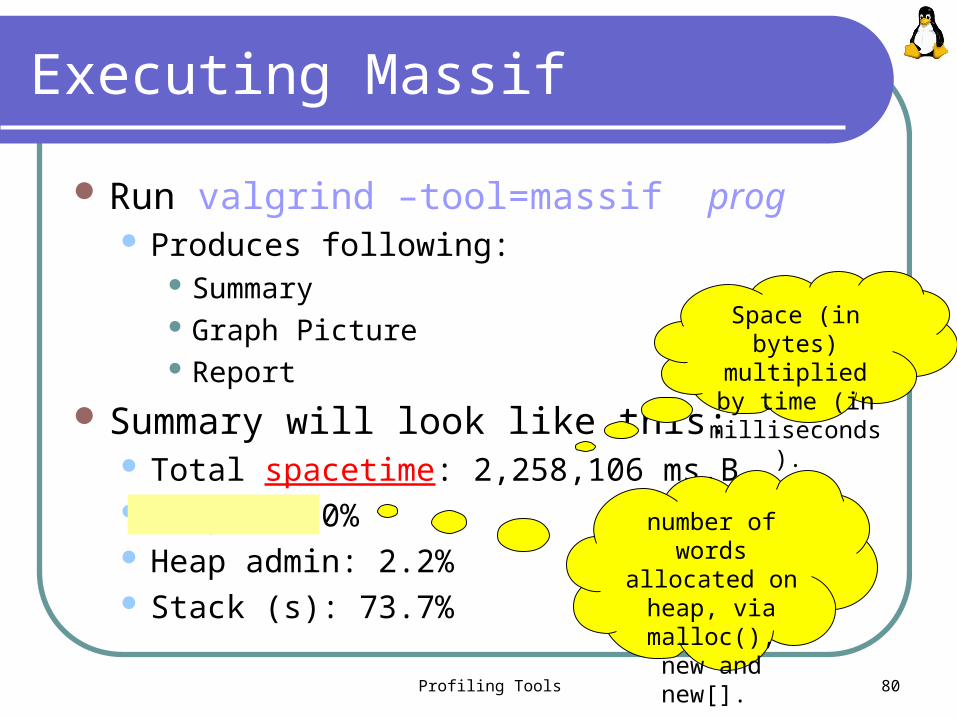
Executing Massif
Run valgrind –tool=massif prog Produces following:
Summary Graph Picture Report
Summary will look like this: Total spacetime: 2,258,106 ms.B Heap: 24.0% Heap admin: 2.2% Stack (s): 73.7%
number of words allocated on
heap, via malloc(), new and new[].
Space (in bytes) multiplied by
time (in milliseconds).
Profiling Tools 81
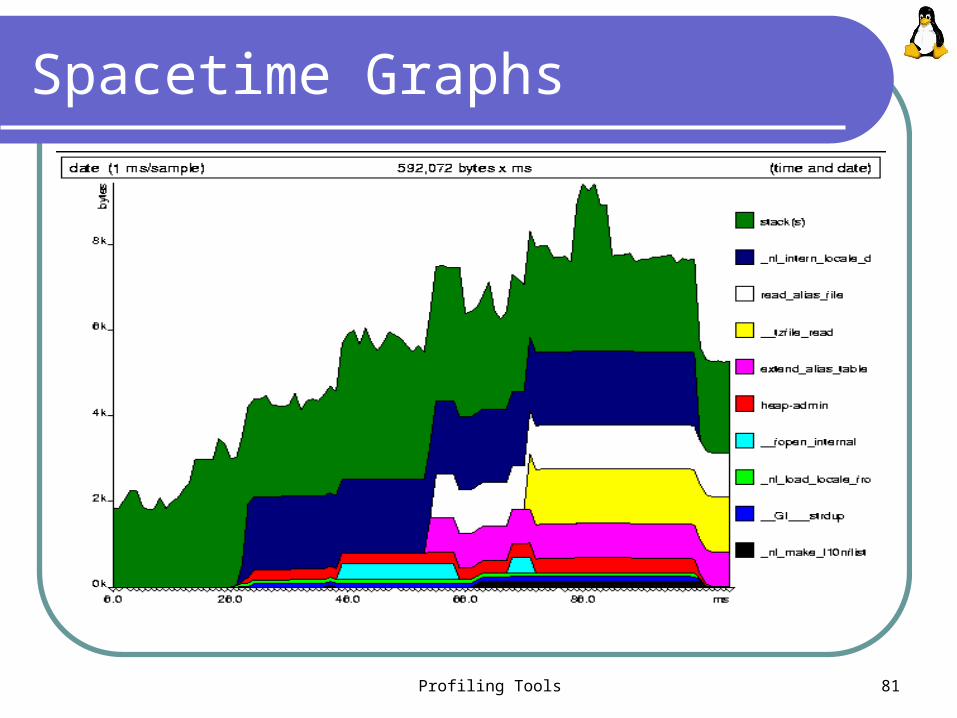
Spacetime Graphs
Profiling Tools 82
Spacetime Graph (Cont.)
Each band represents single line of source code
It's the height of a band that's important Triangles on the x-axis show each point at
which a memory census was taken Not necessarily evenly spread; Massif only takes a
census when memory is allocated or de-allocated The time on the x-axis is wall-clock time
not ideal because can get different graphs for different executions of the same program, due to random OS delays
Profiling Tools 83
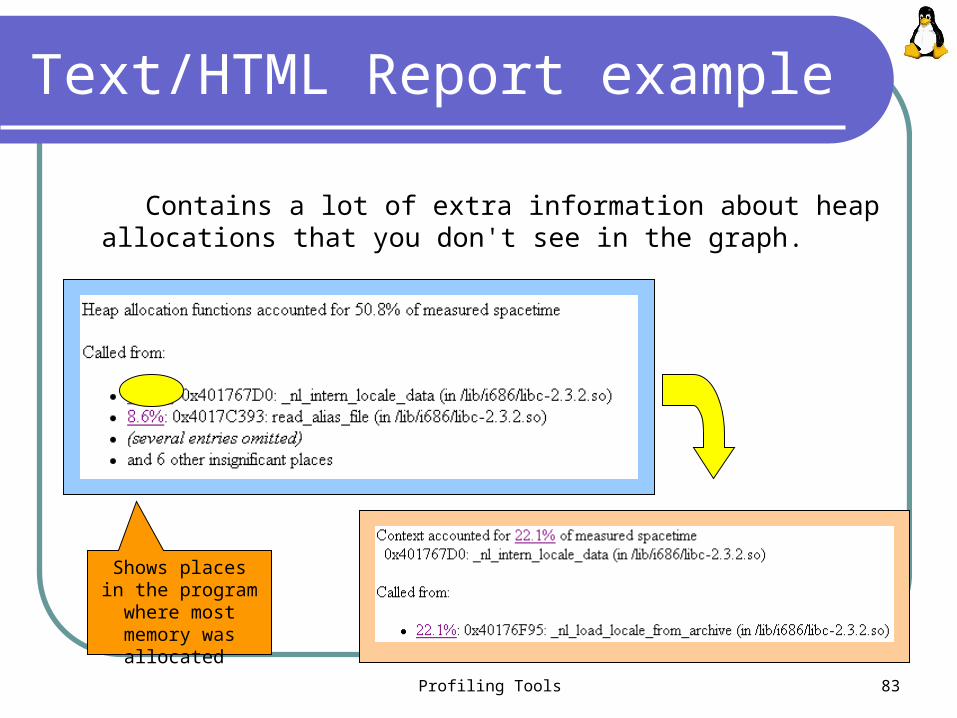
Text/HTML Report example
Contains a lot of extra information about heap allocations that you don't see in the graph.
Shows places in the program where most memory was
allocated

Profiling Tools 84
Valgrind – how it works
Valgrind is compiled into a shared object, valgrind.so. The shell script valgrind sets the LD_PRELOAD environment variable to point to valgrind.so. This causes the .so to be loaded as an extra library to any subsequently executed dynamically-linked ELF binary
The dynamic linker allows each .so in the process image to have an initialization function which is run before main(). It also allows each .so to have a finalization function run after main() exits
When valgrind.so's initialization function is called by the dynamic linker, the synthetic CPU to starts up. The real CPU remains locked in valgrind.so until end of run
System call are intercepted; Signal handlers are monitored

Profiling Tools 85
Valgrind Summary
Valgrind will save hours of debugging time Valgrind can help speed up your programs Valgrind runs on x86-Linux Valgrind works with programs written in any language
Valgrind is actively maintained Valgrind can be used with other tools (gdb) Valgrind is easy to use
uses dynamic binary translation, so no need to modify, recompile or re-link applications. Just prefix command line with valgrind and everything works
Valgrind is not a toy Used by large projects : 25 millions lines of code
Valgrind is free
Profiling Tools 86
Other Tools
Tools not included in this presentation: IBM PurifyParasoft InsureKCachegrindOprofileGCC’s and GLIBC’s debugging hooks
Profiling Tools 87
Writing Fast Programs
Select right algorithm Implement it efficiently
Detect hotspots using profiler and fix them Understanding of target system architecture is often
required – such as cache structure Use platform-specific compiler extensions – memory
pre-fetching, cache control-instruction, branch prediction, SIMD instructions
Write multithreaded applications (“Hyper Threading Technology”)
Profiling Tools 88
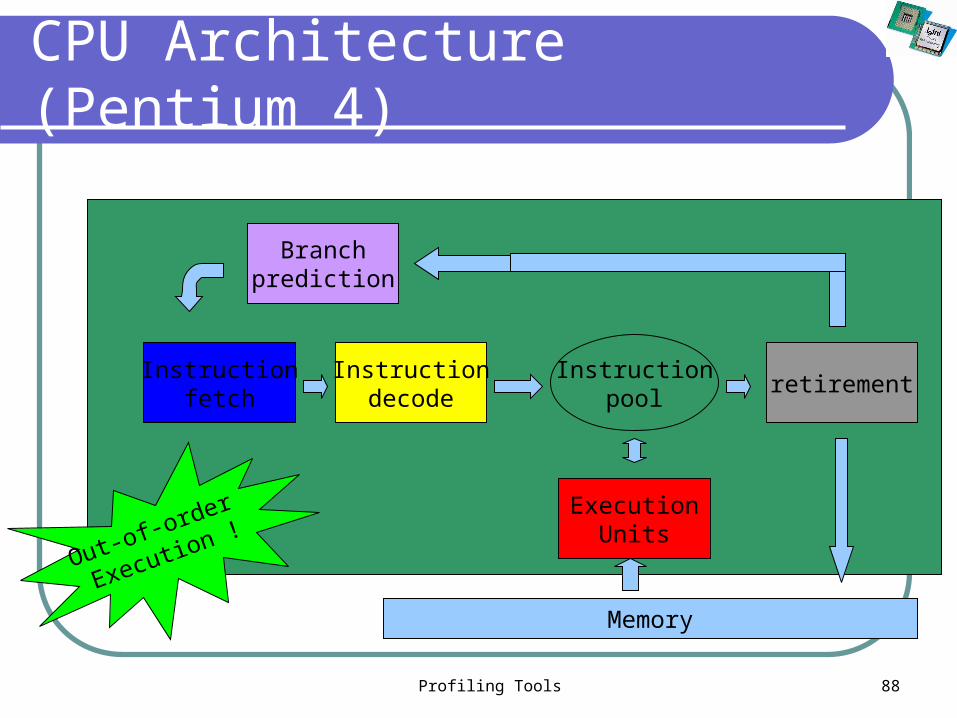
CPU Architecture (Pentium 4)
Instructionfetch
Instructiondecode
Branchprediction
ExecutionUnits
retirementInstruction
pool
Memory
Out-of-order
Execution !
Profiling Tools 89
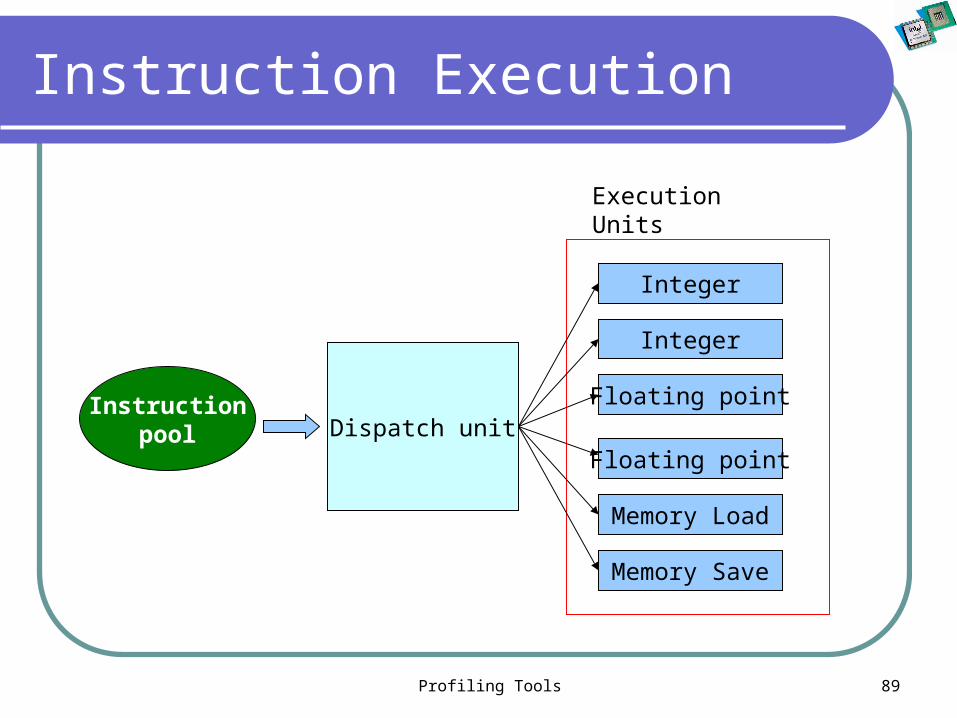
Instruction Execution
Instructionpool Dispatch unit
Integer
Integer
Memory Save
Memory Load
Floating point
Floating point
Execution Units
Profiling Tools 90
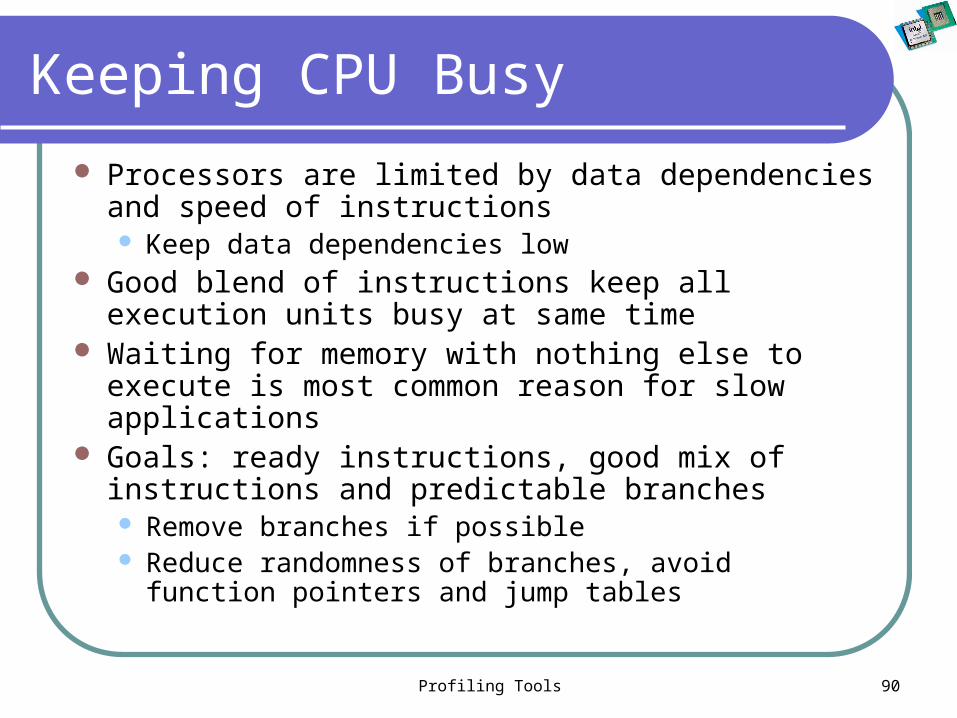
Keeping CPU Busy
Processors are limited by data dependencies and speed of instructions Keep data dependencies low
Good blend of instructions keep all execution units busy at same time
Waiting for memory with nothing else to execute is most common reason for slow applications
Goals: ready instructions, good mix of instructions and predictable branches Remove branches if possible Reduce randomness of branches, avoid function
pointers and jump tables
Profiling Tools 91
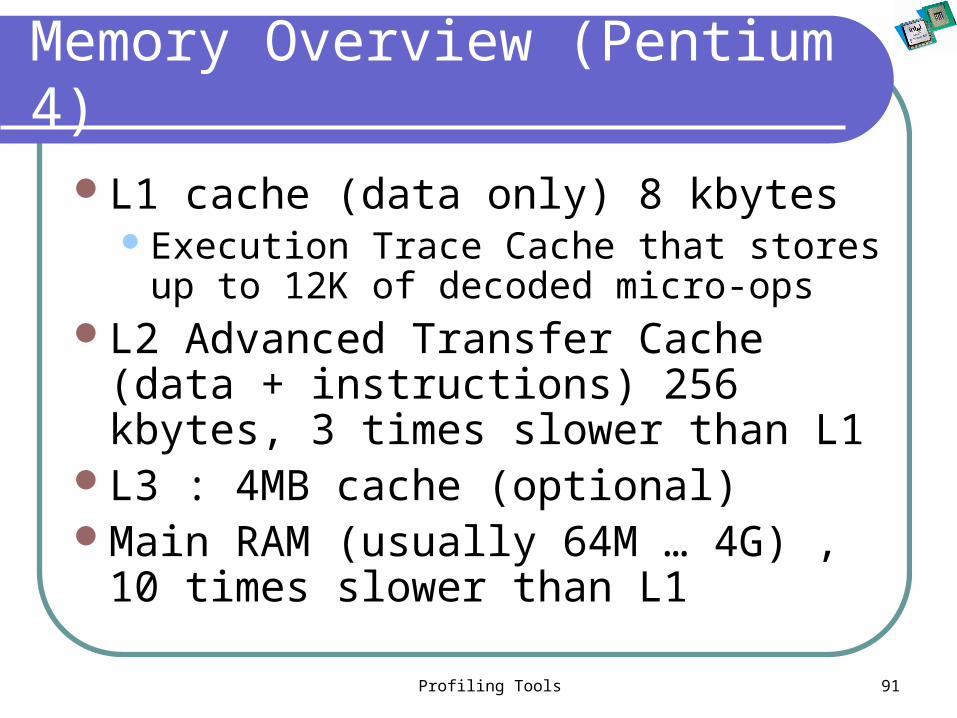
Memory Overview (Pentium 4)
L1 cache (data only) 8 kbytesExecution Trace Cache that stores up to
12K of decoded micro-ops L2 Advanced Transfer Cache (data +
instructions) 256 kbytes, 3 times slower than L1
L3 : 4MB cache (optional)Main RAM (usually 64M … 4G) , 10
times slower than L1
Profiling Tools 92
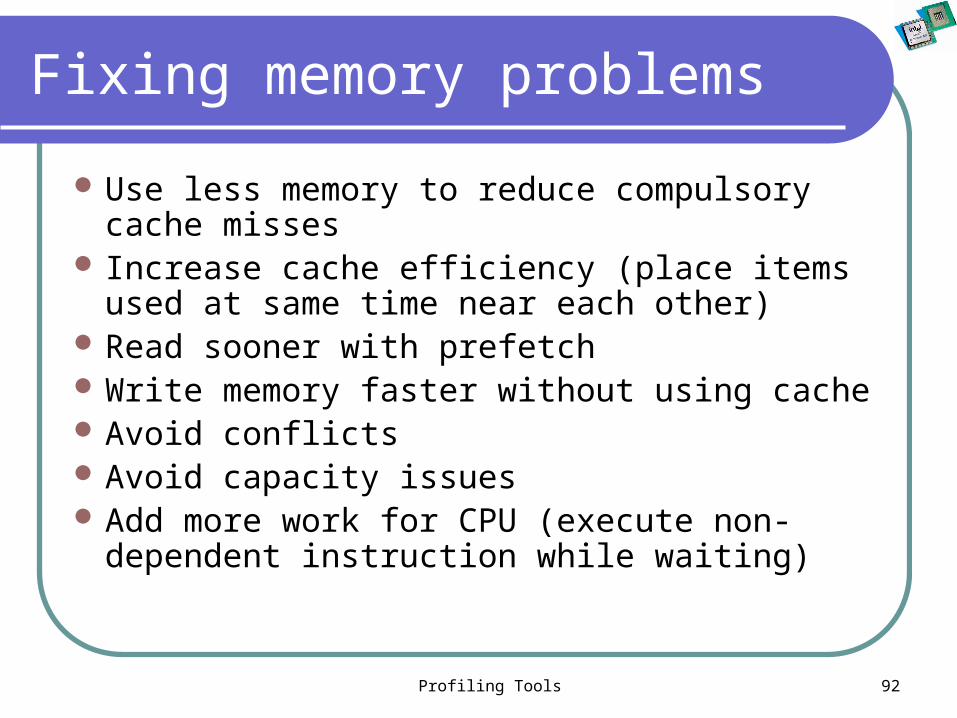
Fixing memory problems
Use less memory to reduce compulsory cache misses
Increase cache efficiency (place items used at same time near each other)
Read sooner with prefetch Write memory faster without using cache Avoid conflicts Avoid capacity issues Add more work for CPU (execute non-
dependent instruction while waiting)
Profiling Tools 93
References
SPEC website http://www.specbench.org
The Software Optimization CookbookHigh-Performance Recipes for the Intel® Architecture
by Richard Gerber GCC Optimization flags
http://gcc.gnu.org/onlinedocs/gcc/Optimize-Options.html Valgrind Homepage http://valgrind.kde.org
An Evolutionary Analysis of GNU C Optimizations Using Natural Selection to Investigate Software Complexities by Scott Robert Ladd
Intel VTune Performace Analyzer webpagehttp://www.intel.com/software/products/vtune/
Gprof man page http://www.gnu.org/software/binutils/manual/gprof-2.9.1/html_mono/gprof.html
Profiling Tools 94
Questions?