profiling energy consumption of smartphone users for …€¦ · profiling energy consumption of...
TRANSCRIPT

PROFILING ENERGY CONSUMPTION OF SMARTPHONE USERS FORENVIRONMENTALLY EFFICIENT BUSINESS DECISIONS
William Z. Bernstein∗,†, Devarajan Ramanujan†
School of Mechanical Engineering†
Purdue UniversityWest Lafayette, Indiana, 47906Email: [email protected]
Fu Zhao†,z, Karthik Ramani†,‡
School of Mechanical Engineering†
zDivision of Environmental and Ecological Engineering‡School of Electrical and Computer Engineering (by courtesy)
Purdue UniversityWest Lafayette, Indiana 47907
ABSTRACTThe recent proliferation of electronic products has led to a
strong unmet need for understanding environmental implicationsof new technologies. According to Nielsen, 66% of Americansages 24-35 own a smartphone, providing strong evidence thatthis technology can be considered ubiquitous. However, a ma-jority of users and service providers are not sensitive to energyimplications of data usage. As parameters affecting data deliv-ery and usage are primarily driven by user behavior, this studyis focused on using empirical data to investigate its correspon-dence to energy footprint. A large cohort of smartphone users(n = 21,853) and the means for which data is accessed, i.e. via3G/LTE or WiFi, is examined to develop a model for estimat-ing the energy cost of the various modes of data usage. Finally,alternate business scenarios are developed through simulatingbehavior change in cohorts based on existing data and then as-sessed with regards to economic and environmental efficiencies.
INTRODUCTIONOver the last decade, the world has seen an unprecedented
proliferation of electronic products. From tablet computing de-vices to televisions, electronics have become easily and readilyavailable to a great number of people around the world. Mobilephones, in particular, have strongly exhibited this trend. Accord-
∗Address all correspondence to this author.
ing to the International Telecommunication Union (ITU), therewere six billion mobile subscriptions at the end of 2011. Inter-estingly, both China and India, two rapidly growing economies,each accounted for about one billion subscriptions [1]. Whenalso considering 3G penetrance, or third generation mobiletelecommunications technology, the numbers remain significant.Currently, it is estimated that 3G technologies account for an es-timated 15% of all cellular subscriptions worldwide, including70% in some countries, e.g. Japan (99%), Spain (85%), Italy(83%) and the United States (81%) [2]. All in all, the ITU esti-mates that there were 1.1 billion mobile Web users in the worldin 2011. On-demand data via the Web is no longer a commodityor a privilege in many societies but instead it is seen as a right forall people to be able to access. As a result, smartphones, whichcan be defined as “cellular telephones with built-in applicationsand Internet access” [3], have seen a steep increase in sales dueto strong user demand. According to Nielsen, 66% of Americansages 24-35 own a smartphone [4], and smartphone penetrance isexpected to rise.
In turn, the energy consumption of the information commu-nications and technology (ICT) industry has seen a significantrise due to the ubiquity of mobile devices as described above.For example, in the United States alone, the energy consumptionof the network equipment was estimated to have used between 14and 18 TWh in 2008 and is expected have grown to 23 TWh in2012, assuming business-as-usual [5]. Furthermore, the green-
Proceedings of the ASME 2013 International Design Engineering Technical Conferences and Computers and Information in Engineering Conference
IDETC/CIE 2013 August 4-7, 2013, Portland, Oregon, USA
DETC2013-13074
1 Copyright © 2013 by ASME

house gas emissions due to the ICT industry is expected to growfrom 300 Mt CO2 in 2007 in 350 Mt CO2 emitted in 2020 [6].However, it seems that a majority of users and service providersare not sensitive to the energy-related implications of data usage.
In general terms, the trends of smartphone user behaviorhave recently been investigated. Contrary to mobile phone usersin the past, i.e. 2G subscribers, the extended capabilities ofadvanced platforms, e.g. on-board GPS and on-demand e-mailbrowsing, have shifted user behavior. There seems to be a trendthat more time is being spent running apps on smartphones thanchecking mail, placing calls, or any other activity [7]. In general,it has been suggested that user behavior is a hurdle for sustain-able development. However, there has been little work relatedto emerging business models that link user behavior and energyconsumption through various types of ICT infrastructure. For ex-ample, if one suggests that electronic publishing of an article isbeneficial for the environment, the publishers still cannot controlusers from both downloading and printing that article for per-sonal use [8].
This paper focuses on examining empirical data in order tobetter understand user behavior and suggest alternative businessscenarios from the service provider perspective aiming to curbenergy consumption during the product’s use. The paper presentsa case study of smartphones in which empirical data for monthlyuse of over 20,000 smartphone subscribers (n=21,853) is ana-lyzed. As parameters affecting data delivery and usage are pri-marily driven by user behavior, this study is focused on using em-pirical data to investigate its correspondence to energy footprint.Alternate business scenarios are developed through simulatingbehavior change in cohorts based on existing data and then as-sessed with regards to economic and environmental efficiencies.The paper is closed with remarks that consider environmentalimplications of cyber-physical products as a whole.
The data used throughout this manuscript was provided byMobidia Technologies, Inc, a venture-funded corporation, thathas worked with notable ICT-related companies, e.g. Microsoft,Symbian, Motorola, Samsung, LG and PMC-Sierra [9]. Mobidiaoffers a free app, titled “My data manager”, which allows smart-phone users to essentially track their data usage, i.e. WiFi or3G/4G access, in order to avoid additional costs related to over-ages. A summary of data collected can be found in [10], pub-lished as a white paper for the public.
RELATED WORKThe explosion of smartphone use has spurred work related
to user behavior. A recent periodical in the Harvard BusinessReview listed the seven primary motivations for smartphone useas self-expression, discovery, preparation, accomplishing, shop-ping, socializing, and “me time” [11]. One significant finding ofthe HBR study is that 68% of consumers’ smartphone use occursat their home, suggesting that a significant amount of the data ac-
cessed could be via a home WiFi network. One group focused ondeveloping an on-board app that keeps track of data usage withregards to many categories [12], similar to the software devel-oped by Mobidia. Kivi, 2007 also studied the measurement ofmobile user behavior and service usage through surveys [13].
Similar to this manuscript, some of the related researchare targeted towards understanding large-scale smartphone use.Oliver, 2010 conducted a study with a large cohort of Black-Berry users (n=17300) and measured the duration of time spentby users [14]. Falaki et al. investigated user behavior and its ef-fect on phone energy consumption in order to develop predictivemodels that can better help increase battery life [15]. Anotherstudy took a close look at the energy consumption of specifichardware components, e.g. GSM, CPU, RAM, WiFi, etc, dur-ing different power states of the phone in order to make redesignsuggestions of individual hardware components [16].
Modifying user behavior, in general, has been an area of re-search and study for quite some time. Recently, work has beenfocused on changing user behavior through design exploiting hu-man natural behaviors [17]. In the context of web search, re-searchers have shown interest into understanding keywords orentry behavior to quickly retrieve requested information [18]. Asimilar objective has been used for developing rules for strongerpasswords for sensitive information [19]. Shiraishi et al. devel-oped a application that visualize energy costs and emissions oftheir home via virtual avatars to curb user behavior [20]. Onestudy reviewed methods used to change user behavior with re-spect to responsible library treatment [21]. Other studies haveinvestigated changing user behavior to enhance traffic safety[22, 23]
It should be noted that not one of the before-mentioned stud-ies investigated the effect of modifying user behavior in orderto curb the IT industry’s energy consumption. However, therehave been other studies to have mentioned smartphone user be-havior in this context. Radia et al. binned users based on theirmonthly limit of allowable cellular data in order to understandtraffic of particular types, e.g. file sharing, on-line media, andweb browsing, and to formulate suggestions related to devel-oping apps to make users more contextually aware of their us-age [24]. Heinemann et al. grouped users into two behavioralcategories, i.e. users who share everything and ones that sharenothing, in order to suggest data loading schema for dissemina-tion schemes [25]. Others have investigated smartphone chargingbehaviors to understand typical user activity with respect to theenergy consumed by hardware components and subsequent net-work connectivity characteristics [26]. Another study took moreof a marketing approach and measured a typical user’s daily timeallocation on various mobile services, application installations,and communication actions. Interestingly, the study found that44% of those surveyed actively follow cellular data rates andmodify behavior accordingly [27].
To the best of the authors’ knowledge, there have not been
2 Copyright © 2013 by ASME

TABLE 1. NUMBER OF REPORTED USERS PER DATA PLANBUCKET
Data Plan (GB) Population (n)
0.0 0.3 2131
0.3 0.5 43
0.5 1.0 175
1.0 3.0 5757
3.0 5.0 2846
Over 5.0 226
Unlimited 1766
Did not respond 8909
studies yet that present schema for assessing feasible modifica-tions to user behavior through new business models in order tomake users more sensitive to the energy consumption of data ac-quisition. This study, aims to create such scenarios by investigat-ing a large set of empirical data.
SMARTPHONE USER DATA OBSERVATIONSThe provided data from Mobidia was organized primarily
based on the purchased data plan, since it is expected that theceiling of cellular data usage per user would have the most sig-nificant contribution to user behavior in the context of accessingdata. To understand the general trends of smartphone usage, eachuser was binned in groups based on their self-reported data plans.The seven bins for the data plans can be seen below in Table 1.The group with the most amount of users reported a data planlimit of somewhere in the range of 1.0 and 3.0. Most of theseusers have a 2.0 GB limit, as this is a common data plan offeredthroughout the service provider industry. It should be noted thatmany users refrained from providing their data plan information(n = 8909). This sub-population was not included in any anal-ysis throughout the paper. In general, the dataset was consid-ered acceptably representative of an aggregate user population.
The Mobidia app used in this study provides various char-acteristics of each user, such as the user’s operating system (OS)type, phone manufacturer, phone model, service provider, aggre-gate monthly data usage via WiFi, and aggregate monthly datausage via 3G or LTE (i.e. 4G) depending on the phone model.It was assumed that all users are representative of a populationof 3G operating users, i.e. users with LTE access were groupedtogether with smartphone operators using 3G to access cellulardata. It should also be noted that the only data used from themonthly data set is the aggregate cellular and WiFi usage. Re-
FIGURE 1. CUMULATIVE PROBABILITY DISTRIBUTIONSFOR DATA ACCESSED VIA THE CELLULAR NETWORK
gardless of the type of smartphone model, OS type, carrier, etc.,each user was considered to be representative of a large cohortof 3G users in order to make observations of the studied popula-tions.
Figures 1 and 2 organize raw data with respect to data ac-quisition via 3G across the studied data plan buckets. Figure 1represents a plot of the cumulative distribution functions (CDF)of each data plan cohort, excluding the users that abstained fromproviding their data plans. Figure 2 shows triangular kernelsmoothing density estimates for each bucket as in Figure 1. The
FIGURE 2. TRIANGULAR KERNEL SMOOTHING DENSITYESTIMATES FOR DATA ACCESSED VIA THE CELLULAR NET-WORK
3 Copyright © 2013 by ASME

FIGURE 3. CUMULATIVE PROBABILITY DISTRIBUTIONSFOR DATA ACCESSED VIA WIFI
main purpose of observing the CDF is to understand the rela-tive fraction of data usage per user group. However, the densityestimates provide a visualization scheme for understanding fre-quency of data usage. For instance, a tight peak will representa large subset of users behaving in a particular manner. Morespecifically, the triangular kernel smoothing method (i.e. the ks-density function [28]) available in Matlab’s Statistics Toolbox isused to represent corresponding histograms of each dataset [29].For ease of comparison, the color scheme for each respectivebucket shown in Figures 1 and 2 will be the same throughoutthis manuscript. Similarly, Figures 3 and 4 show the cumulative
FIGURE 4. TRIANGULAR KERNEL SMOOTHING DENSITYESTIMATES FOR DATA ACCESSED VIA WIFI
probability distributions and triangular kernel smoothing densityestimates, respectively, of the monthly Wifi usage for each stud-ied data bucket.
As seen in Figures 1 and 2, data accessed via smartphonesfrom 3G varies across data plans. This can be particularly evidentwhen comparing significantly different data plans, e.g. less than300 MB and over 5 GB. From the CDF of the 3G usage in Figure1, it can be seen that almost 50% of users with plans over 5 GBaccess at least 2GB of data via 3G monthly as opposed to some1% of those with plans less than 300 MB. This should not bea surprise considering that users with low limit plans are muchmore sensitive to costs related to exceeding data limit ceilings.Observing Figure 2, it is apparent that those with smaller plans,e.g. between than 300 -500 MB, exhibit similar behavior shownas a tighter peak. As the data plan increases, the smoothing es-timates seem to level out, suggesting that users with high-rangeplans exhibit behavior more difficult to predict.
On the contrary, with respect to data obtained via WiFi,shown in Figures 3 and 4, it seems that WiFi usage is quite simi-lar irregardless of data plan size. From Figure 3, one might thinkthat the group of users that have plans that fall within the rangeof 300 and 500 MB show unique behavior in terms of WiFi us-age, but this seems to be due to the low sample size, as thereare only 43 such users, compared to 5757 users that have a 1-3GB plan, for example. If this is not an artifact of low samplesize, one explanation could be that those with lower cellular dataplans do not necessarily access lower amount of data than oth-ers, but procure a higher percentage of their traffic through WiFirather than 3G. These users, hence, may exhibit higher sensitivityto cost overages, enforced once they exceed their allowable dataceiling. One can also see that the percentage of users that exceed
FIGURE 5. TRIANGULAR KERNEL SMOOTHING DENSITYESTIMATES OF PERCENTAGE OF DATA ACCESSED VIA WIFI
4 Copyright © 2013 by ASME

their data plan for higher data plans, e.g. in the 3-5 GB bucket,compared with lower ones, e.g. 0.3-0.5 GB bucket, seems to beslightly higher. Figure 5 illustrates this idea in more detail byshowing trends of WiFi to 3G usage among groups. Those withlower plans are much more sensitive in keeping their ratio ofWiFi data usage to 3G data usage high, while there is little dis-tinction among users with larger data plans. Other distinctionsbetween user groups and general observations of the data can beseen in the white paper sponsored by Mobidia [10].
DATA LIMITATIONSIt should be noted that the empirical data used throughout
this manuscript is not without limitations. First off, those whodownload the app from Mobidia can be categorized as high-levelusers, simply by the fact that they must possess enough expertiseto download and use an energy-monitoring app. This is not re-flective of all smartphone users, as many novice users may havetrouble downloading such apps or lack motivation. Furthermore,these smartphone users could develop more sensitivity to theirown data use once they have deployed Mobidia’s app on their de-vice. In other words, being provided on-demand access to theirdata usage could modify their behavior. Another limitation is thelarge set of users who abstain from reporting their data plan, cellphone and other characteristics that have been used to analyzethe data. Of the 21,853 users that were analyzed, 8909 of themrefrained from reporting any information to Mobidia. Additionalanalysis, however, illustrates that the abstaining users closely fitbehavior of the others analyzed in total, suggesting that theseusers could be considered good representatives of a populationof smartphone users with mixed data plans. In other words, thecumulative density functions and histograms match closely be-tween the abstaining users and the rest of the studied population.Also, all data collected is reflective of usage within the month ofMay 2012. It is not clear, however, whether the data fluctuationfrom month to month is significant.
MODELING USE PHASE ENERGY CONSUMPTIONTo the authors’ knowledge, the most rigorous life cycle as-
sessment, to date, of the 3G network infrastructure was con-ducted by [30]. Within the study, the authors argued that as 3Gmobile phones become ubiquitous, similar to the current situa-tion, the impact per bit related to network components decreasessignificantly. At the time of the study, the analysis was conductedassuming 3G subscribers were in the range of 1-4 million. Asof Q4 in 2011, there are 208 million 3G subscribers in the USalone [31]. This suggests that the manufacturing and operationof mobile phones themselves is becoming more critical with re-spect to the environmental efficiency of the telecommunicationsindustry as a whole. Hence, here the focus will remain on the op-eration of the devices and the energy they consume while access-
TABLE 2. ENERGY MODEL FOR DOWNLOADING X KB OFDATA OVER 3G AND WiFi ON A SMARTPHONE, ADOPTEDFROM [2]
3G WiFi
Transfer Energy(J) 0.025(x) + 3.5 0.007(x) + 5.9
Tail Energy (J/s) 0.62 N/A
Maintenance (J/s) 0.02 0.05
Tail Time (s) 12.5 N/A
ing data. Furthermore, estimating energy consumption throughthe network infrastructure is infeasible without accessibility tothe infrastructure components themselves. For this reason, muchof the work in regards to estimating energy per bit transfered isfocused on the end user device, i.e. the smartphone itself.
A widely accepted publication in particular, [2], providesa linear energy model based on empirical measurements of asmartphone. The model presented in [2] is illustrated in Table 2.The transfer energy shown in the table estimates the amount ofenergy required to “ramp up” to the required power level as wellas the actual energy expended during transmitting and receivingthe data. For WiFi, the transfer energy includes both transmittingdata as well as the energy required for scanning and association.The tail energy estimation describes the expenditure of energy asthe device lingers at high power states. This value should not beignored since it contributes to some 60% of the total energy withrespect to a single 50K download. The linear energy model herewas used to model the energy consumption of each 3G-operatedsmartphone. As seen in the Table 2, the model requires length intime for each download with specific packet sizes. From the dataused in this study, these numbers cannot be found and estimatingpacket size could introduce additional uncertainty. Therefore, afactor of 2.2 (i.e. 100%/40%) applied to the transfer energy isused to recover a reasonable estimate. If this factor were notincluded, the energy consumption of 3G access would be signif-icantly underestimated.
The cumulative distribution functions and the triangularkernel smoothing density estimates representing the energy con-sumption per user are shown in Figures 6 and 7. These plots werecreated to observe apparent trends. It is interesting to note that,in terms of energy consumption, that the four lowest data plans,(1) less than 300 MB, (2) between 300 and 500 MB, (3) between0.5 and 1.0 GB and (4) between 1.0 and 3.0 GB, exhibit similarbehavior as seen in Fig. 7. The other plans have significant tailsto the right, which represents users with heavy usage needs.
The model can be validated by observing holistic consump-tion. According to the energy model, the estimated total monthlyend-user energy consumption of the studied users (n=12944) is
5 Copyright © 2013 by ASME
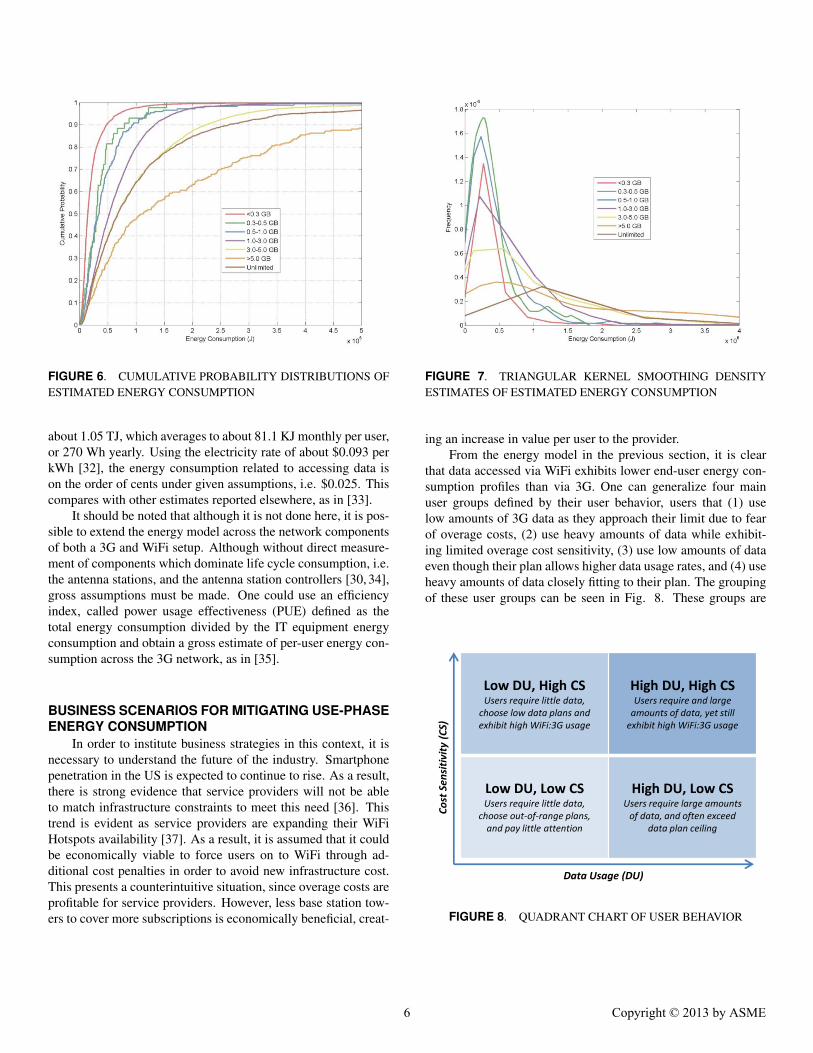
FIGURE 6. CUMULATIVE PROBABILITY DISTRIBUTIONS OFESTIMATED ENERGY CONSUMPTION
about 1.05 TJ, which averages to about 81.1 KJ monthly per user,or 270 Wh yearly. Using the electricity rate of about $0.093 perkWh [32], the energy consumption related to accessing data ison the order of cents under given assumptions, i.e. $0.025. Thiscompares with other estimates reported elsewhere, as in [33].
It should be noted that although it is not done here, it is pos-sible to extend the energy model across the network componentsof both a 3G and WiFi setup. Although without direct measure-ment of components which dominate life cycle consumption, i.e.the antenna stations, and the antenna station controllers [30, 34],gross assumptions must be made. One could use an efficiencyindex, called power usage effectiveness (PUE) defined as thetotal energy consumption divided by the IT equipment energyconsumption and obtain a gross estimate of per-user energy con-sumption across the 3G network, as in [35].
BUSINESS SCENARIOS FOR MITIGATING USE-PHASEENERGY CONSUMPTION
In order to institute business strategies in this context, it isnecessary to understand the future of the industry. Smartphonepenetration in the US is expected to continue to rise. As a result,there is strong evidence that service providers will not be ableto match infrastructure constraints to meet this need [36]. Thistrend is evident as service providers are expanding their WiFiHotspots availability [37]. As a result, it is assumed that it couldbe economically viable to force users on to WiFi through ad-ditional cost penalties in order to avoid new infrastructure cost.This presents a counterintuitive situation, since overage costs areprofitable for service providers. However, less base station tow-ers to cover more subscriptions is economically beneficial, creat-
FIGURE 7. TRIANGULAR KERNEL SMOOTHING DENSITYESTIMATES OF ESTIMATED ENERGY CONSUMPTION
ing an increase in value per user to the provider.From the energy model in the previous section, it is clear
that data accessed via WiFi exhibits lower end-user energy con-sumption profiles than via 3G. One can generalize four mainuser groups defined by their user behavior, users that (1) uselow amounts of 3G data as they approach their limit due to fearof overage costs, (2) use heavy amounts of data while exhibit-ing limited overage cost sensitivity, (3) use low amounts of dataeven though their plan allows higher data usage rates, and (4) useheavy amounts of data closely fitting to their plan. The groupingof these user groups can be seen in Fig. 8. These groups are
Low DU, High CS Users require little data,
choose low data plans and exhibit high WiFi:3G usage
High DU, High CS Users require and large
amounts of data, yet still exhibit high WiFi:3G usage
Low DU, Low CS Users require little data,
choose out-of-range plans, and pay little attention
High DU, Low CS Users require large amounts
of data, and often exceed data plan ceiling
Data Usage (DU)
Co
st S
ensi
tivi
ty (
CS)
FIGURE 8. QUADRANT CHART OF USER BEHAVIOR
6 Copyright © 2013 by ASME
< 0.3 GB 0.3-0.5 GB 0.5-1.0 GB
> 5.0 GB 3.0-5.0 GB 1.0-3.0 GB
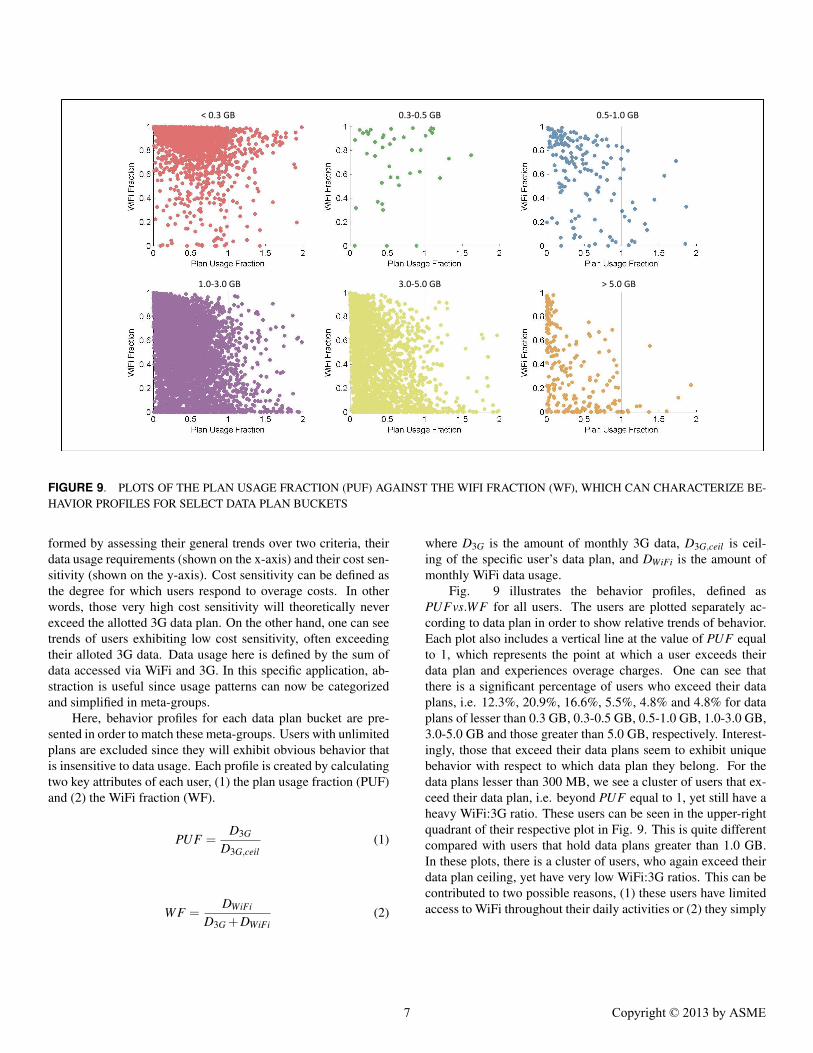
FIGURE 9. PLOTS OF THE PLAN USAGE FRACTION (PUF) AGAINST THE WIFI FRACTION (WF), WHICH CAN CHARACTERIZE BE-HAVIOR PROFILES FOR SELECT DATA PLAN BUCKETS
formed by assessing their general trends over two criteria, theirdata usage requirements (shown on the x-axis) and their cost sen-sitivity (shown on the y-axis). Cost sensitivity can be defined asthe degree for which users respond to overage costs. In otherwords, those very high cost sensitivity will theoretically neverexceed the allotted 3G data plan. On the other hand, one can seetrends of users exhibiting low cost sensitivity, often exceedingtheir alloted 3G data. Data usage here is defined by the sum ofdata accessed via WiFi and 3G. In this specific application, ab-straction is useful since usage patterns can now be categorizedand simplified in meta-groups.
Here, behavior profiles for each data plan bucket are pre-sented in order to match these meta-groups. Users with unlimitedplans are excluded since they will exhibit obvious behavior thatis insensitive to data usage. Each profile is created by calculatingtwo key attributes of each user, (1) the plan usage fraction (PUF)and (2) the WiFi fraction (WF).
PUF =D3G
D3G,ceil(1)
WF =DWiFi
D3G +DWiFi(2)
where D3G is the amount of monthly 3G data, D3G,ceil is ceil-ing of the specific user’s data plan, and DWiFi is the amount ofmonthly WiFi data usage.
Fig. 9 illustrates the behavior profiles, defined asPUFvs.WF for all users. The users are plotted separately ac-cording to data plan in order to show relative trends of behavior.Each plot also includes a vertical line at the value of PUF equalto 1, which represents the point at which a user exceeds theirdata plan and experiences overage charges. One can see thatthere is a significant percentage of users who exceed their dataplans, i.e. 12.3%, 20.9%, 16.6%, 5.5%, 4.8% and 4.8% for dataplans of lesser than 0.3 GB, 0.3-0.5 GB, 0.5-1.0 GB, 1.0-3.0 GB,3.0-5.0 GB and those greater than 5.0 GB, respectively. Interest-ingly, those that exceed their data plans seem to exhibit uniquebehavior with respect to which data plan they belong. For thedata plans lesser than 300 MB, we see a cluster of users that ex-ceed their data plan, i.e. beyond PUF equal to 1, yet still have aheavy WiFi:3G ratio. These users can be seen in the upper-rightquadrant of their respective plot in Fig. 9. This is quite differentcompared with users that hold data plans greater than 1.0 GB.In these plots, there is a cluster of users, who again exceed theirdata plan ceiling, yet have very low WiFi:3G ratios. This can becontributed to two possible reasons, (1) these users have limitedaccess to WiFi throughout their daily activities or (2) they simply
7 Copyright © 2013 by ASME

TABLE 3. SUMMARY OF POTENTIAL ENERGY SAVINGS FOR ALTERNATE BUSINESS SCENARIOS
Business Scenario Potential Savings of Studied Users Percent of Total Consumption Potential Savings Over Entire US
1 16.5 MJ 1.6% 0.86 GWh
2 22.5 MJ 2.1% 1.13 GWh
3 46.4 MJ 4.4% 2.39 GWh
are not sensitive to overage costs. From a business perspective,the potential of energy savings lies within users in large plansthat exceed data plans, yet exhibit a moderate WiFi:3G ratio. Itshould be noted that an appropriate WiFi:3G ratio indicator forusers who have limited WiFi access is not very clear. Neverthe-less, the following three business scenario projections aim to takeadvantage of these user types.
Business Scenario 1 investigates the potential of changingbehavior of those with a moderate WiFi:3G ratio, defined as0.1 < WF < 0.9. Assuming that service providers institute costpenalties for exceeding their data plan, users would became moresensitive to overages. In this case, it is assumed that existing 3Goverages be converted to WiFi data access. The energy modelwas simulated by swapping overage 3G usage with WiFi and po-tential energy savings were calculated to be about 16.5 MJ, or1.6% of the total energy consumption.
Business Scenario 2 presents a similar situation as the pre-vious scenario. Here, additional users on the WiFi:3G spectrum,i.e. 0.05 < WF < 0.95, are included. The potential savings inthis scenario were estimated to be 22.5 MJ, or 2.1% of the totalenergy consumption. Again, this could be achieved with moresignificant cost penalties.
Business Scenario 3 investigates opportunity of modifyingbehavior of the users with unlimited data plans and instituting therules of Business Scenario 2. It is assumed that those with un-limited plans change to data plans of 3 GB, and exhibit high sen-sitivity to overages. Here, a more significant savings is recorded,i.e. 46.4 MJ or 4.4% savings.
In total, if smartphone users across the US fit within thesecharacteristics of the data presented in this paper, a significantamount of potential energy savings exist. Assuming 200 million3G smartphone users, a rate of 270 Wh per year, a low percentsavings estimate of 1.6% and a high percent savings estimate of4.4%, a potential energy savings exists of between 0.86 GWh and2.39 GWh yearly, just from end-user energy consumption on thedevice itself. In order to understand the scale, 1 GWh can meetthe yearly energy demand of about 100 US homes. These resultsare summarized in Table 3.
The numbers presented in this section dictate that even with-out shifting actual user behavior in terms of the amount of dataaccessed, there is significant potential savings in providing addi-
tional WiFi access to users. Of course, in order to understand thebusiness implications of these changes, a full cost analysis nec-essary. All relevant factors such as total monthly cost to the user,including basic and overage costs, would have to be included tovalidate that instituting cost penalties as viable strategies.
TOWARDS UNDERSTANDING ENVIRONMENTALFOOTPRINTS OF CYBER-PHYSICAL SYSTEMS
This paper presents a scenario for which user behavior playsa key role in determining a product system’s energy footprint.The smartphone example can be related to a more general groupof products, namely smart products. A smart product can be de-fined as a networked physical (or cyber-physical) device that hasmeans of acquiring, processing and delivering contextualized in-formation in order to enable behavior modification of itself orits user. In this sense, smart products can be viewed as a sub-category of cyber-physical systems (CPS), as CPS use computa-tional, often distributed resources in order to enhance some phys-ical entity. In general, environmental or energy analyses of CPShave been scarce. One major reason is the fact that the mediumsfor deploying CPS lack control and are used differently amongstakeholders and user groups, making it difficult to define sys-tem boundaries. In other words, a system boundary of a CPScan be considered dynamic and unpredictable since, among otherreasons, (1) users may access distributed systems differently de-pending on their demand, (2) elements of smart products evolveand advance (e.g. Apple’s AppStore) and (3) the supply chains ofsmart products are affected by uncertainties similar to any otherconsumer product. Evidence of these trends can clearly be seenthroughout the results of this paper as user groups behave differ-ently depending on consumer attributes, e.g. data plans.
Furthermore, this study uses a bottom-up approach with em-pirical data from users and assessing the energy footprint of aparticular technology. In order to extend this approach to a net-work level assessment, more transparency from the technologiesthemselves, e.g. power consumption of network infrastructure,must be provided. Till now, we only have estimates across theentire network over a given period of time, as in [34, 35]. Break-ing these grandiose numbers into per byte transmitted estimateswould provide a means of understanding impact per user. This
8 Copyright © 2013 by ASME

will allow the use of a dynamic life cycle assessment (LCA), inwhich user populations can be simulated to be representative ofan actual smart technology deployed in a real-world scenario. Inother smart products, e.g. tablets, video game consoles, an ap-propriate framework for procuring such data is clearly needed.
Additionally, in order to reach meaningful conclusions withregards to environmental foot-printing of ubiquitous technolo-gies, rare earth metals, end-of-life implications human healthrisks, and other ecological risk categories must be closely in-vestigated. This paper does not attempt to extend the analysisto encapsulate these issues, as this study only focuses on energyconsumption. Other studies have tackled these issues from anindustry-wide point of view [38–41], but have lacked the gran-ularity and precision necessary to understand one specific de-ployed smart device. Also, in the past LCA practitioners mayhave used economic input-output life cycle analysis (EIO-LCA)in order to use industry-wide assessment to draw conclusionsabout a particular product [42]. The basis of EIO-LCA lieswithin the economic correlations between industries, and sub-industries. This makes it particularly useful when exact lifecycleinventories are near impossible to collect in a timely fashion. Un-fortunately, the results gathered from EIO-LCA have significantuncertainty in scaling down to a smartphone, for example.
CONCLUSIONSThis paper used empirical data of a large cohort of smart-
phone users to make user-group specific observations regardingbehavior. Using an existing energy model of smartphone data ac-cess, the role of behavior in energy consumption was particularlyinvestigated. New business scenarios were presented that do notcurb user data usage but, at the same time, alleviate a significantfraction of the total energy consumption (i.e. 0.86-2.39 GWhyearly), and provide economic leverage for service providers. In-sight into how this work could be applied to the emerging fieldof cyber-physical systems was also discussed.
ACKNOWLEDGMENTThe authors would like to thank Mobidia Technologies Inc.
for providing the raw data that made this work possible. Weare also grateful to Senthil Chandrasegaran for his helpful com-ments. The authors gratefully acknowledge the NSF IGERT onSustainable Electronics (DGE 1144843) as well as another NSFAward (MANU 100619) for support of this research. The con-tents of this manuscript do not necessarily reflect the views andopinions of the NSF.
REFERENCES[1] OECD/International Telecommunications Union, 2011. M-
government: Mobile technologies for responsive govern-
ments and connected societies.[2] Balasubramanian, N., Balasubramanian, A., and
Venkataramani, A., 2009. “Energy consumption inmobile phones: a measurement study and implicationsfor network applications”. In Proceedings of the 9thACM SIGCOMM conference on Internet measurementconference, ACM, pp. 280–293.
[3] PCmag, 2013. Pc magazine encyclopedia. URL:http://www.pcmag.com/encyclopedia/.
[4] Elmer-DeWitt, P., 2012. Nielsen: 66% percent ofamericans ages 24-35 own a smartphone. URL:http://tech.fortune.cnn.com/2012/02/20/nielsen-66-of-americans-ages-24-35-own-a-smartphone.
[5] Lanzisera, S., Nordman, B., and Brown, R., 2012. “Datanetwork equipment energy use and savings potential inbuildings”. Energy Efficiency, 5(2), pp. 149–162.
[6] Chan, C., Gygax, A., Wong, E., Leckie, C., Nirmalathas,A., and Kilper, D., 2012. “Methodologies for assessing theuse-phase power consumption and greenhouse gas emis-sions of telecommunications network services”. Environ-mental Science & Technology.
[7] Xu, Q., Erman, J., Gerber, A., Mao, Z., Pang, J., andVenkataraman, S., 2011. “Identifying diverse usage behav-iors of smartphone apps”. In Proceedings of the 2011 ACMSIGCOMM conference on Internet measurement confer-ence, ACM, pp. 329–344.
[8] Watson, R., Boudreau, M., and Chen, A., 2010. “Informa-tion systems and environmentally sustainable development:energy informatics and new directions for the is commu-nity”. MIS quarterly, 34(1), p. 23.
[9] Mobidia, 2013. URL: http://www.mobidia.com/.[10] Wehmeier, T., 2012. Understanding today’s smartphone
user: Demystifying data usage trends on cellular & wi-finetworks.
[11] HBR, 2013. “Vision statement: How people really use mo-bile”. Harvard Business Review: The Magazine, 91(1),pp. 30–31.
[12] Verkasalo, H., 2010. “Analysis of smartphone user behav-ior”. In Mobile Business and 2010 Ninth Global MobilityRoundtable (ICMB-GMR), 2010 Ninth International Con-ference on, IEEE, pp. 258–263.
[13] Kivi, A., 2007. “Measuring mobile user behavior and ser-vice usage: methods, measurement points, and future out-look”. Proceedings of the 6th Global Mobility Roundtable,pp. 1–2.
[14] Oliver, E., 2010. “The challenges in large-scale smartphoneuser studies”. In Proceedings of the 2nd ACM Interna-tional Workshop on Hot Topics in Planet-scale Measure-ment, ACM, p. 5.
[15] Falaki, H., Mahajan, R., Kandula, S., Lymberopoulos, D.,Govindan, R., and Estrin, D., 2010. “Diversity in smart-phone usage”. In Proceedings of the 8th international
9 Copyright © 2013 by ASME

conference on Mobile systems, applications, and services,ACM, pp. 179–194.
[16] Carroll, A., and Heiser, G., 2010. “An analysis of powerconsumption in a smartphone”. In Proceedings of the 2010USENIX conference on USENIX annual technical confer-ence, USENIX Association, pp. 21–21.
[17] Tromp, N., Hekkert, P., and Verbeek, P.-P., 2011. “Designfor socially responsible behavior: a classification of influ-ence based on intended user experience”. Design Issues,27(3), pp. 3–19.
[18] Agichtein, E., Brill, E., Dumais, S., and Ragno, R.,2006. “Learning user interaction models for predicting websearch result preferences”. In Proceedings of the 29th an-nual international ACM SIGIR conference on Research anddevelopment in information retrieval, ACM, pp. 3–10.
[19] Campbell, J., Kleeman, D., and Ma, W., 2007. “The goodand not so good of enforcing password composition rules”.Information Systems Security, 16(1), pp. 2–8.
[20] Shiraishi, M., Washio, Y., Takayama, C., Lehdonvirta, V.,Kimura, H., and Nakajima, T., 2009. “Using individual,social and economic persuasion techniques to reduce co 2emissions in a family setting”. In Proceedings of the 4thInternational Conference on Persuasive Technology, ACM,p. 13.
[21] Perez, C., Cuadrado, M., and Cervera, A., 2009. “Under-standing university library users’ mistreatment of books”.The Journal of Academic Librarianship, 35(2), pp. 177–183.
[22] Wildervanck, C., 2000. “Driving the message home”. InTransportation, Traffic Safety, and Health: Prevention andhealth: Third International Conference, Washington, USA,1997, Vol. 3, Springer Verlag, p. 51.
[23] Watson, B., and Freeman, J., 2007. “Perceptions and ex-periences of random breath testing in queensland and theself-reported deterrent impact on drunk driving”. TrafficInjury Prevention, 8(1), pp. 11–19.
[24] Radio, N., Zhang, Y., Tatipamula, M., and Madisetti, V.,2012. “Next-generation applications on cellular networks:trends, challenges, and solutions”. Proceedings of theIEEE, 100(4), pp. 841–854.
[25] Heinemann, A., Kangasharju, J., and Muhlhauser, M.,2008. “Opportunistic data dissemination using real-worlduser mobility traces”. In Advanced Information Network-ing and Applications-Workshops, 2008. AINAW 2008.22nd International Conference on, IEEE, pp. 1715–1720.
[26] Shye, A., Scholbrock, B., Memik, G., and Dinda, P.,2010. “Characterizing and modeling user activity on smart-phones: summary”. In ACM SIGMETRICS PerformanceEvaluation Review, Vol. 38, ACM, pp. 375–376.
[27] Verkasalo, H., 2007. “Empirical insights on the evolution ofthe finnish mobile market”. In Telecommunication Techno-Economics, 2007. CTTE 2007. 6th Conference on, IEEE,
pp. 1–9.[28] Bowman, A., and Azzalini, A., 1997. “Applied smoothing
techniques for data analysis”.[29] MATLAB, 2010. version 4.16 (R2011b). The MathWorks
Inc., Natick, Massachusetts.[30] Scharnhorst, W., Hilty, L., and Jolliet, O., 2006. “Life cycle
assessment of second generation (2g) and third generation(3g) mobile phone networks”. Environment international,32(5), pp. 656–675.
[31] Meeker, M., and Wu, L., 2012. “Internet Trends. Presentedat the D10 Conference by Kleiner Perkins Caufield and By-ers”.
[32] Duke Energy, 2006. Rate RS-Schedule for Residen-tial and Farm Electric Service URL: http://www.duke-energy.com/pdfs/DE-IN-Rate-RS.pdf.
[33] Lowensohn, J., 2012. iphone 5 estimated to cost 41 centsper year to charge.
[34] Koutitas, G., and Demestichas, P., 2009. “A review of en-ergy efficiency in telecommunication networks”. In Proc.Inter. Telecommunication Forum (TELFOR), pp. 2–7.
[35] Etoh, M., Ohya, T., and Nakayama, Y., 2008. “Energy con-sumption issues on mobile network systems”. In Appli-cations and the Internet, 2008. SAINT 2008. InternationalSymposium on, IEEE, pp. 365–368.
[36] BBC News, 2013. Data Slowdown looms for smart-phone users URL: http://www.bbc.co.uk/news/technology-21118906.
[37] Stelter, B., 2012. Cable Operators to ExpandTheir Plan to Share Wi-Fi Hot Spots URL:http://mediadecoder.blogs.nytimes.com/2012/05/21/cable-operators-to-expand-their-plan-to-share-wi-fi-hot-spots.
[38] Kohler, A., Hilty, L., and Bakker, C., 2011. “Prospectiveimpacts of electronic textiles on recycling and disposal”.Journal of Industrial Ecology, 15(4), pp. 496–511.
[39] Bottner, H., Schischke, K., and Nissen, N., 2011. “Car-bon footprinting of information technology products basedon iso standards”. In Consumer Electronics-Berlin (ICCE-Berlin), 2011 IEEE International Conference on, IEEE,pp. 291–295.
[40] Fehske, A., Fettweis, G., Malmodin, J., and Biczok, G.,2011. “The global footprint of mobile communications:The ecological and economic perspective”. Communica-tions Magazine, IEEE, 49(8), pp. 55–62.
[41] Tseng, K., 2010. “Implementing and planning ict strategyfor sustainable development in electrical electronics goodsmanufacture”. In Manufacturing Automation (ICMA),2010 International Conference on, IEEE, pp. 30–36.
[42] Matthews, H., and Small, M., 2000. “Extending the bound-aries of life-cycle assessment through environmental eco-nomic input-output models”. Journal of Industrial Ecology,4(3), pp. 7–10.
10 Copyright © 2013 by ASME