profile report - state
TRANSCRIPT

Profile Report - State
Graduating Class 2021
Arkansas
ACT, INC. -- CONFIDENTIAL*070038110*

ACT PROFILE REPORT- State
Graduating Class 2021 Code 049999
Arkansas
Total Students in Report: 32,971
New to your 2021 Profile Report
For 2020-2021, contents of the ACT Profile Report remain consistent with last year.

ACT PROFILE REPORT - State PAGE 1
Graduating Class 2021 Code 049999
Arkansas
Total Students in Report: 32,971
Table of Contents
Section I: Executive Summary Page 5 Section III: College Readiness & Impact of Course Rigor Page 17
Average Composite Scores: 5 Years of Testing Percent of Students Meeting 3 or 4 College Readiness
Percent Meeting 3 or 4 Benchmarks: 5 Years of Testing Benchmarks by Core College Curriculum Status
Percent Meeting STEM Benchmark: 5 Years of Testing Percent of Students in College and Career Readiness Standards (CCRS)
Percent Taking A Core Curriculum: 5 Years of Testing Score Ranges
Five Year Trends—Percent of Students Who Met Percent of Students Who Met ACT College Readiness Benchmark Scores
College Readiness Benchmarks by Gender
Five Year Trends—Average ACT Scores Percent of Students Who Met ACT College Readiness Benchmark Scores
Five Year Trends—Average ACT Scores by Level of Preparation by Race/Ethnicity
Five Year Trends—Percent and Average Composite Score Likely ACT National Career Readiness Certificate (NCRC) Level
by Race/Ethnicity Based Upon ACT Composite Score
Five Year Trends—Achievement in STEM College Readiness Benchmark Percent and Average ACT Scores
Proficiency Toward Understanding Complex Text by Overall High School Curriculum
College Readiness Benchmark Percent and Average ACT Scores
Section II: Academic Achievement Page 11 by Content-Specific Curriculum
Average ACT Composite Scores by Race and Core Curriculum Status College Readiness Benchmark Percent and Average ACT Scores
ACT Score Distributions, Cumulative Percents, and Averages by Common Course Patterns
Subject Area Reporting Categories College Readiness Benchmark Percent and Average ACT Scores
Average ACT Composite Scores for Race/Ethnicity for Gender by Common Course Patterns
by Level of Preparation
Average ACT Scores by Race/Ethnicity Section IV: Career and Educational Aspirations Page 25
Average ACT Composite Scores for Gender by Level of Preparation Average ACT Composite Scores
Average ACT Scores by Gender by Race and Student Postsecondary Aspirations
ACT Score Quartile Values Distribution of Planned Educational Majors for All Students
by College Plans
Average ACT Composite Scores for Racial/Ethnic Groups
by Post-Secondary Educational Aspirations
Students' Score Report Preferences at Time of Testing
Section V: Optional Writing Test Results Page 31
Average ACT Writing Scores by Race/Ethnicity
Average ACT English Language Arts Constituent Scores
by Race/Ethnicity and Gender for Students Who Took ACT Writing
Average ACT English Language Arts Outcomes
by Race/Ethnicity and Gender for Students Who Took ACT Writing

ACT PROFILE REPORT - State PAGE 2
Graduating Class 2021 Code 049999
Arkansas
Total Students in Report: 32,971
This report focuses on:
Performance - student test performance in the context of college readiness
Access - number of your graduates exposed to college entrance testing and the percent of race/ethnicity participation
Course Selection - percent of students pursuing a core curriculum
Course Rigor - impact of rigorous coursework on achievement
College Readiness - percent of students meeting ACT College Readiness Benchmark Scores in each content area
Awareness - extent to which student aspirations match performance
Articulation - colleges and universities to which your students send test results
We are pleased to provide this 2021 Graduating Class ACT Profile Report. This report summarizes the preparation and
performance of your 2021 graduates who took the ACT as sophomores, juniors, or seniors under standard- or extended-
time conditions and achieved a college reportable composite score. The most recent set of test information is used in your
report for students testing more than once.
Each year, test data for a school, district, and the state represents a different cohort of students. ACT encourages
educators to focus on trends (3, 5, 10 years), not year-to-year changes. Such changes can represent normal – even
expected – fluctuations. On the other hand, trend lines offer more insight into what is happening in a school, district, or
the state.
Furthermore, ACT encourages educators to measure student performance in the context of college readiness measures.
The focus should be on the number and percentage of students who met or exceeded ACT’s College Readiness
Benchmark Scores, a measure that is much more meaningful and understandable than an average composite score for a
group of students.

ACT PROFILE REPORT - State PAGE 3
Graduating Class 2021 Code 049999
Arkansas
Total Students in Report: 32,971
The ACT is a curriculum-based measure of college readiness. ACT components include:
Tests of academic achievement in English, math, reading, science, STEM, and (optional) ELA and writing
High school grade and course information
Student Profile Section
Career Interest Inventory
The ACT:
College Course/Course Area ACT Score Benchmark Score
English Composition English 18
Algebra Mathematics 22
Social Sciences Reading 22
Biology Science 23
STEM STEM 26
ELA ELA 20
For more information, go to www.act.org
Every few years, ACT conducts the ACT National Curriculum Survey to ensure its curriculum-based assessment tools accurately
measure the skills high school teachers teach and instructors of entry-level college courses expect. The ACT is the only college
readiness test designed to reflect the results of such a survey.
ACT’s College and Career Readiness Standards are sets of statements intended to help students, parents and educators
understand the meaning of test scores. The standards relate test scores to the types of skills needed for success in high school and
beyond. They serve as a direct link between what students have learned and what they are ready to do next. The ACT is the only
college readiness test for which scores can be tied directly to standards. College and Career Readiness Standards to the Classroom
interpretive guides can be found at www.act.org/content/act/en/education-and-career-planning/college-and-career-readiness-
standards.html.
The ACT reports College Readiness Benchmark Scores – A benchmark score is the minimum score needed on an ACT subject-
area test to indicate a 50% chance of obtaining a B or higher or about a 75% chance of obtaining a C or higher in the corresponding
credit-bearing college courses, which include English Composition, Algebra, Social Science, Biology, STEM and ELA. These scores
were empirically derived based on the actual performance of students in college.
ACT PROFILE REPORT - State PAGE 4
Graduating Class 2021 Code 049999
Arkansas
Total Students in Report: 32,971
How to Improve Scores and Increase College Readiness
#1660
For more information on interpreting data in this report, or to learn how ACT can help your students improve their readiness for college and the
workplace, contact ACT Customer Service at 319-337-1365 or [email protected].
PLAN GUIDANCE ACTIVITIES BASED ON STUDENTS' CAREER AND COLLEGE ASPIRATIONS: Data in Tables 4.1 and 4.2 enable the reader to
determine if aspirations are consistent with academic performance and whether, among students with similar aspirations, academic performance is
consistent across racial/ethnic groups.
EVALUATING RIGOR OF COURSES: Table 3.1 reports the percentage of students falling in each of the ACT College and Career Readiness
Standards score ranges. For example, approximately 69% of the cohort fall into the lowest three Mathematics score ranges. To increase these
students' achievement, identify the standards they should focus on next by accessing ACT's College and Career Readiness Standards at at
www.act.org/content/act/en/education-and-career-planning/college-and-career-readiness-standards.html.
15% of your students met all four ACT College Readiness Benchmark Scores (Table 1.1). To improve students' scores and increase the percentage
of students identified as college ready, ACT suggests:
PROVIDING ACCESS FOR ALL STUDENTS TO TAKE THE ACT: 32,971 of your students are included in this report (the 'cohort'). Increasing
access insures that more students have the opportunity to consider college and allows the reader to use this report to evaluate how well courses and
instructional programs are preparing students for college and work.
MAKING CORE CURRICULUM A PRIORITY: Emphasize the need for all students to develop college and work ready skills, regardless of
postsecondary aspirations. 54% of the students in the cohort reported taking courses that would be considered 'Core or More' (Table 1.4).
MAKING SURE STUDENTS ARE TAKING THE RIGHT KINDS OF COURSES: Table 3.8 reports 4% of the cohort took less than three years of
math courses. Of these students, 5% were college ready. 10% of the cohort reported taking a course sequence of Algebra I, Algebra II, and
Geometry. 6% of these students were college ready. In comparison, 32% of the students who took 3 or more years of math beyond Algebra I,
Algebra II, and Geometry were college ready. Getting more students ready for Algebra prior to 9th grade will increase the chances that students will
be prepared for and take advanced-level math courses.
Similarly, Table 3.8 reports 10% of the cohort took less than three years of natural science courses. 13% of these students were college ready. In
comparison, 32% of students who took at least three years of science coursework were college ready.
ACT PROFILE REPORT - State: SECTION I, EXECUTIVE SUMMARY PAGE 5
Graduating Class 2021 Code 049999
Arkansas
Total Students in Report: 32,971
Section I
Executive Summary

ACT PROFILE REPORT - State: SECTION I, EXECUTIVE SUMMARY PAGE 6
Graduating Class 2021 Code 049999
Arkansas
Total Students in Report: 32,971
Figure 1.1. Average Composite Scores: 5 Years of Testing* Figure 1.2. Percent Meeting 3 or 4 Benchmarks: 5 Years of Testing*
Figure 1.3. Percent Meeting STEM Benchmark: 5 Years of Testing* Figure 1.4. Percent Taking A Core Curriculum: 5 Years of Testing*
* Missing columns in above graphs reflect years in which no students were tested.
19.4 19.4 19.3 19.0 19.0
21.0 20.8 20.7 20.6 20.3
1
6
11
16
21
26
31
36
2016-2017 2017-2018 2018-2019 2019-2020 2020-2021
Avera
ge A
CT
Score
State National
27 27 26 26 25
39 38 37 37 36
0
10
20
30
40
50
60
70
80
90
100
2016-2017 2017-2018 2018-2019 2019-2020 2020-2021
Perc
ent
State National
11 11 11 10 10
21 20 20 20 19
0
10
20
30
40
50
60
70
80
90
100
2016-2017 2017-2018 2018-2019 2019-2020 2020-2021
Perc
ent
State National
75
18
70
18
68
19
62
17
54
17
68
23
63
21
60
21
56
19
46
18
0
10
20
30
40
50
60
70
80
90
100
Core LessThanCore
Core LessThanCore
Core LessThanCore
Core LessThanCore
Core LessThanCore
Perc
ent
State National
2016-2017 2017-2018 2018-2019 2019-2020 2020-2021

ACT PROFILE REPORT - State: SECTION I, EXECUTIVE SUMMARY PAGE 7
Graduating Class 2021 Code 049999
Arkansas
Total Students in Report: 32,971
Table 1.1. Five Year Trends—Percent of Students Who Met College Readiness Benchmarks
Percent Who Met Benchmarks
English Mathematics Reading Science Met All Four
Year State National State National State National State National State National State National
2017 34,451 2,030,038 53 61 27 41 36 47 25 37 16 27
2018 34,468 1,914,817 53 60 27 40 36 46 26 36 17 27
2019 34,193 1,782,820 53 59 26 39 35 45 25 36 16 26
2020 34,260 1,670,497 52 58 24 37 34 45 26 36 15 26
2021 32,971 1,295,349 51 56 23 36 34 44 26 35 15 25
Table 1.2. Five Year Trends—Average ACT Scores
Average ACT Scores
English Mathematics Reading Science Composite
Year State National State National State National State National State National State National
2017 34,451 2,030,038 18.9 20.3 19.0 20.7 19.7 21.4 19.5 21.0 19.4 21.0
2018 34,468 1,914,817 19.1 20.2 18.9 20.5 19.7 21.3 19.4 20.7 19.4 20.8
2019 34,193 1,782,820 19.0 20.1 18.7 20.4 19.6 21.2 19.2 20.6 19.3 20.7
2020 34,260 1,670,497 18.7 19.9 18.4 20.2 19.4 21.2 19.1 20.6 19.0 20.6
2021 32,971 1,295,349 18.6 19.6 18.3 19.9 19.3 20.9 19.2 20.4 19.0 20.3
Table 1.3. Five Year Trends—Average ACT Scores Nationwide
Average ACT Scores
Year English Mathematics Reading Science Composite
2017 2,030,038 20.3 20.7 21.4 21.0 21.0
2018 1,914,817 20.2 20.5 21.3 20.7 20.8
2019 1,782,820 20.1 20.4 21.2 20.6 20.7
2020 1,670,497 19.9 20.2 21.2 20.6 20.6
2021 1,295,349 19.6 19.9 20.9 20.4 20.3
Number of Students
Tested
Number of Students
Tested
Number of Students
Tested

ACT PROFILE REPORT - State: SECTION I, EXECUTIVE SUMMARY PAGE 8
Graduating Class 2021 Code 049999
Arkansas
Total Students in Report: 32,971
Table 1.4. Five Year Trends—Average ACT Scores by Level of Preparation
Average ACT Scores
Number of
Students Tested Percent2
English Mathematics Reading Science Composite
Year
Core or
More1
Less than
Core
Core
or
More
Less
than
Core
Core or
More
Less than
Core
Core or
More
Less than
Core
Core or
More
Less than
Core
Core or
More
Less than
Core
Core or
More
Less than
Core
2017 25,844 6,304 75 18 20.2 15.2 19.9 16.6 20.8 16.5 20.4 17.0 20.4 16.5
2018 24,109 6,316 70 18 20.6 15.7 19.9 16.7 21.1 16.7 20.5 16.9 20.7 16.6
2019 23,317 6,420 68 19 20.7 15.7 19.7 16.6 21.0 16.7 20.4 16.8 20.6 16.6
2020 21,295 5,819 62 17 20.6 15.7 19.6 16.4 21.0 16.8 20.5 16.8 20.6 16.6
2021 17,666 5,677 54 17 20.6 16.5 19.6 16.8 21.0 17.4 20.7 17.6 20.6 17.21"Core or More" results correspond to students taking four or more years of English AND three or more years each of math, social studies, and natural science.
2Percent of all students tested. Numbers will not add up to 100% due to student non-response.
Table 1.5. Five Year Trends—Percent and Average Composite Score by Race/Ethnicity
2017 2018 2019 2020 2021
Race/Ethnicity N % Avg N % Avg N % Avg N % Avg N % Avg
All Students 34,451 100 19.4 34,468 100 19.4 34,193 100 19.3 34,260 100 19.0 32,971 100 19.0
Black/African American 5,609 16 16.3 5,483 16 16.3 5,332 16 16.2 5,334 16 15.8 4,814 15 15.8
American Indian/Alaska Native 218 1 18.3 264 1 17.8 230 1 17.8 217 1 17.2 243 1 17.1
White 20,132 58 20.6 19,657 57 20.7 19,038 56 20.6 19,020 56 20.4 17,937 54 20.3
Hispanic/Latino 3,562 10 18.1 3,771 11 17.8 3,822 11 17.9 4,048 12 17.8 3,961 12 17.7
Asian 564 2 21.8 608 2 22.6 615 2 22.4 582 2 22.4 553 2 22.6
Native Hawaiian/Other Pacific Islander 146 0 15.4 145 0 15.2 121 0 15.2 152 0 15.4 113 0 15.4
Two or more races 1,488 4 19.8 1,578 5 20.0 1,610 5 20.0 1,489 4 19.6 1,541 5 19.2
Prefer not to respond/No response 2,732 8 17.9 2,962 9 17.7 3,425 10 17.5 3,418 10 17.5 3,809 12 17.9

ACT PROFILE REPORT - State: SECTION I, EXECUTIVE SUMMARY PAGE 9
Graduating Class 2021 Code 049999
Arkansas
Total Students in Report: 32,971
Table 1.6. Five Year Trends—Achievement in STEM1
All Tested Students Students Meeting STEM Benchmarks
Number of
Students Tested Avg. STEM Score Percent Meeting STEM Benchmark Avg. Mathematics Score Avg. Science Score
Year State National State National State National State National State National
2017 34,451 2,030,038 19.5 21.1 11 21 27.7 28.7 28.5 28.7
2018 34,468 1,914,817 19.4 20.9 11 20 27.8 28.8 28.6 28.8
2019 34,193 1,782,820 19.2 20.7 11 20 27.9 28.9 28.8 29.0
2020 34,260 1,670,497 19.0 20.6 10 20 27.8 28.9 29.0 29.1
2021 32,971 1,295,349 19.0 20.4 10 19 27.8 28.9 29.0 29.21The STEM score describes students' overall proficiency in mathematics and science.
Table 1.7. Proficiency In Understanding Complex Texts1
Text Complexity Proficiency Level
Below Proficient Proficient Above Proficient
N Percent Avg. Reading N Percent Avg. Reading N Percent Avg. Reading
Year State National State National State National State National State National State National State National State National State National
2017 20,393 999,708 59 49 15.7 16.2 9,064 596,096 26 29 23.0 23.4 4,859 427,075 14 21 30.3 30.8
2018 21,915 1,010,339 64 53 15.9 16.3 7,657 492,937 22 26 23.6 23.6 4,896 411,541 14 21 30.7 31.0
2019 21,238 950,826 62 53 15.8 16.2 8,127 455,611 24 26 23.3 23.6 4,828 376,383 14 21 30.4 31.0
2020 22,329 903,921 65 54 15.7 16.1 6,893 398,982 20 24 23.4 23.6 5,038 367,594 15 22 30.4 31.1
2021 21,570 711,705 65 55 15.6 15.8 6,950 318,182 21 25 23.4 23.8 4,451 265,462 13 20 30.5 31.31The text complexity indicator, beginning in Fall 2015, represents students' progress toward understanding complex written material often encountered in college and careers.

ACT PROFILE REPORT - State: SECTION I, EXECUTIVE SUMMARY PAGE 10
Graduating Class 2021 Code 049999
Arkansas
Total Students in Report: 32,971
This page intentionally left blank.

ACT PROFILE REPORT- State: SECTION II, ACADEMIC ACHIEVEMENT PAGE 11
Graduating Class 2021 Code 049999
Arkansas
Total Students in Report: 32,971
Section II
Academic Achievement
ACT PROFILE REPORT - State: SECTION II, ACADEMIC ACHIEVEMENT PAGE 12
Graduating Class 2021 Code 049999
Arkansas
Total Students in Report: 32,971
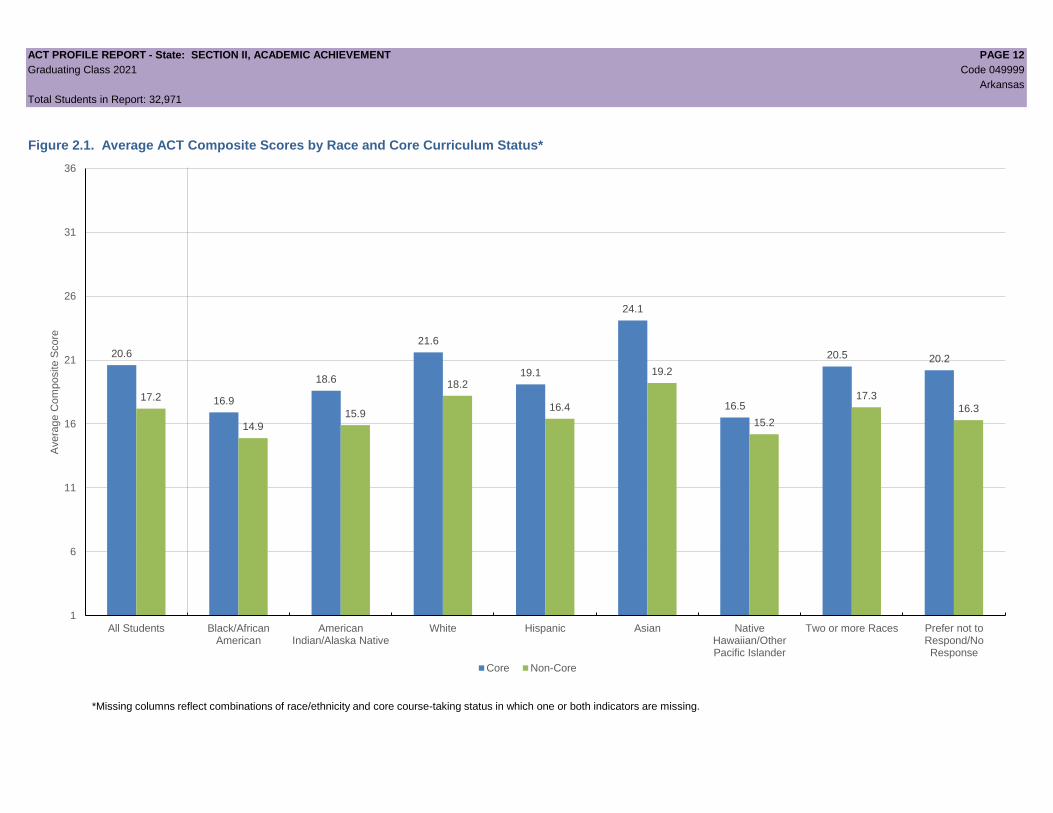
Figure 2.1. Average ACT Composite Scores by Race and Core Curriculum Status*
20.6
16.9
18.6
21.6
19.1
24.1
16.5
20.5 20.2
17.2
14.9
15.9
18.2
16.4
19.2
15.2
17.3
16.3
1
6
11
16
21
26
31
36
All Students Black/AfricanAmerican
AmericanIndian/Alaska Native
White Hispanic Asian NativeHawaiian/OtherPacific Islander
Two or more Races Prefer not toRespond/NoResponse
Avera
ge C
om
posite S
core
Core Non-Core
*Missing columns reflect combinations of race/ethnicity and core course-taking status in which one or both indicators are missing.

ACT PROFILE REPORT- State: SECTION II, ACADEMIC ACHIEVEMENT PAGE 13
Graduating Class 2021 Code 049999
Arkansas
Total Students in Report: 32,971
Table 2.1. ACT Score Distributions, Cumulative Percents (CP1), and Score Averages
English Mathematics Reading Science Composite STEM ELA 2
N CP N CP N CP N CP N CP N CP N CP
36 192 100 26 100 318 100 92 100 32 100 40 100 0 100 36
35 604 99 85 99 415 99 142 99 94 99 71 99 3 100 35
34 423 98 81 99 419 98 185 99 149 99 108 99 4 99 34
33 275 96 103 99 440 97 178 99 236 99 113 99 10 99 33
32 302 95 110 99 500 95 237 98 363 98 185 99 22 98 32
31 300 95 184 99 521 94 306 97 287 97 273 98 31 96 31
30 351 94 216 98 544 92 299 97 344 96 299 98 28 93 30
29 376 93 324 98 465 90 406 96 504 95 397 97 15 90 29
28 618 91 421 97 667 89 320 94 552 94 453 95 23 89 28
27 548 90 777 95 580 87 529 93 721 92 571 94 25 86 27
26 756 88 1,047 93 584 85 679 92 840 90 869 92 38 84 26
25 1,036 86 902 90 892 83 1,289 90 1,030 87 1,094 90 42 80 25
24 1,376 82 1,158 87 1,242 81 1,753 86 1,267 84 1,282 86 53 76 24
23 1,366 78 1,118 84 1,680 77 2,009 81 1,400 81 1,368 83 52 70 23
22 1,387 74 1,017 80 1,809 72 2,128 74 1,535 76 1,471 78 60 65 22
21 2,103 70 1,196 77 1,801 66 1,791 68 1,899 72 1,824 74 58 59 21
20 1,817 64 1,110 73 1,572 61 2,482 63 2,070 66 2,266 68 54 53 20
19 1,536 58 1,726 70 1,969 56 2,416 55 2,282 60 2,554 62 81 48 19
18 1,417 53 2,320 65 1,873 50 2,424 48 2,215 53 2,928 54 70 39 18
17 1,424 49 3,260 58 1,545 45 2,552 40 2,423 46 3,266 45 60 32 17
16 2,005 45 5,027 48 1,932 40 2,618 33 2,569 39 3,384 35 57 26 16
15 2,441 39 4,954 33 1,565 34 1,814 25 2,667 31 3,069 25 58 21 15
14 2,280 31 3,298 18 2,485 29 1,957 19 2,723 23 2,554 15 59 15 14
13 1,640 24 1,700 8 2,230 22 1,511 13 2,547 14 1,582 8 25 9 13
12 1,623 19 530 2 2,014 15 1,096 9 1,546 7 678 3 25 6 12
11 2,053 14 146 1 1,622 9 941 5 532 2 209 1 18 4 11
10 1,570 8 65 1 682 4 500 2 108 1 41 1 7 2 10
9 619 3 35 1 332 2 181 1 24 1 14 1 3 1 9
8 298 2 20 1 142 1 63 1 6 1 4 1 7 1 8
7 164 1 7 1 71 1 44 1 3 1 1 1 1 1 7
6 42 1 1 1 36 1 18 1 1 1 2 1 0 1 6
5 13 1 3 1 12 1 7 1 1 1 0 1 0 1 5
4 9 1 0 1 3 1 1 1 1 1 0 1 0 1 4
3 5 1 2 1 4 1 2 1 0 1 1 1 0 1 3
2 0 1 0 1 4 1 0 1 0 1 0 1 0 1 2
1 2 1 2 1 1 1 1 1 0 1 0 1 0 1 1
Avg (SD) 18.6 (6.6) 18.3 (4.7) 19.3 (6.5) 19.2 (5.2) 19.0 (5.3) 19.0 (4.7) 20.6 (5.7) Avg (SD)1 CP is the cumulative percent of students at or below a score point.
2 ELA scores are derived only for students with a valid writing score.
Note: Shaded portions of columns identify the students who met/exceeded the ACT College Readiness Benchmark Scores.
ACT Scale
Score
ACT Scale
Score

ACT PROFILE REPORT - State: SECTION II, ACADEMIC ACHIEVEMENT PAGE 14
Graduating Class 2021 Code 049999
Arkansas
Total Students in Report: 32,971
Figure 2.2. English Reporting Categories Figure 2.3. Math Reporting Categories
Figure 2.4. Reading Reporting Categories
Figure 2.5. Science Reporting Categories
47
55
48
54
56
54
0 10 20 30 40 50 60 70 80 90 100
Production of Writing
Knowledge of Language
Conventions of Standard English
Percent in ACT Readiness RangeState National
21
29
27
25
23
32
26
25
34
37
39
36
35
39
36
36
0 10 20 30 40 50 60 70 80 90 100
Preparing for Higher Math (PHM)
PHM-Number and Quantity
PHM-Algebra
PHM-Functions
PHM-Geometry
PHM-Statistics and Probability
Integrating Essential Skills
Modeling
Percent in ACT Readiness RangeState National
The charts on this page show the percent of students whose reporting category scores fall within associated ACT Readiness Ranges. ACT Readiness Ranges reflect where a student who has met a particular subject area's ACT College Readiness Benchmark would typically perform within the associated reporting category.
34
34
40
44
46
49
0 10 20 30 40 50 60 70 80 90 100
Key Ideas and Details
Craft and Structure
Integration of Knowledge and Ideas
Percent in ACT Readiness RangeState National
28
27
26
37
35
35
0 10 20 30 40 50 60 70 80 90 100
Interpretation of Data
Scientific Investigation
Evaluation of Models/Inferences
Percent in ACT Readiness RangeState National

ACT PROFILE REPORT- State: SECTION II, ACADEMIC ACHIEVEMENT PAGE 15
Graduating Class 2021 Code 049999
Arkansas
Total Students in Report: 32,971
Table 2.2. Average ACT Composite Scores for Race/Ethnicity by Level of Preparation
Student Number of Percent Taking Average ACT Composite Score
Group Race/Ethnicity Students Tested Core or More1
Core or More Less Than CoreAll Students 32,971 54 20.6 17.2
Black/African American 4,814 46 16.9 14.9
American Indian/Alaska Native 243 47 18.6 15.9
White 17,937 62 21.6 18.2
Hispanic/Latino 3,961 51 19.1 16.4
Asian 553 70 24.1 19.2
Native Hawaiian/Other Pacific Islander 113 24 16.5 15.2
Two or More Races 1,541 59 20.5 17.3
Prefer not/No Response 3,809 22 20.2 16.3
All Students 1,295,349 46 22.5 19.2
Black/African American 153,641 39 17.9 15.8
American Indian/Alaska Native 10,094 38 18.6 16.1
White 698,565 53 23.3 20.3
Hispanic/Latino 181,958 42 20.3 17.5
Asian 54,272 63 26.7 23.4
Native Hawaiian/Other Pacific Islander 3,450 34 19.9 16.2
Two or More Races 58,528 48 22.5 19.5
Prefer not/No Response 134,841 21 23.7 19.11 "Core or More" results correspond to students taking four or more years of English AND three or more years each of math, social studies, and natural science.
Table 2.3. Average ACT Scores by Race/Ethnicity
Student
Group Race/Ethnicity N Percent English Mathematics Reading Science Composite STEMAll Students 32,971 100 18.6 18.3 19.3 19.2 19.0 19.0
Black/African American 4,814 15 14.8 15.7 15.7 16.3 15.8 16.3
American Indian/Alaska Native 243 1 16.4 16.9 17.1 17.4 17.1 17.4
White 17,937 54 20.2 19.2 20.7 20.3 20.3 20.0
Hispanic/Latino 3,961 12 17.0 17.5 17.8 18.2 17.7 18.1
Asian 553 2 22.3 22.6 22.3 22.6 22.6 22.9
Native Hawaiian/Other Pacific Islander 113 0 14.3 16.0 14.7 15.8 15.4 16.2
Two or More Races 1,541 5 18.9 18.4 19.5 19.5 19.2 19.2
Prefer not/No Response 3,809 12 17.2 17.5 18.1 18.3 17.9 18.2
All Students 1,295,349 100 19.6 19.9 20.9 20.4 20.3 20.4
Black/African American 153,641 12 15.2 16.3 16.6 16.7 16.3 16.8
American Indian/Alaska Native 10,094 1 15.4 16.8 17.3 17.3 16.9 17.3
White 698,565 54 21.1 21.0 22.4 21.7 21.7 21.6
Hispanic/Latino 181,958 14 17.1 18.2 18.7 18.6 18.3 18.6
Asian 54,272 4 24.5 25.1 24.9 24.5 24.9 25.0
Native Hawaiian/Other Pacific Islander 3,450 0 16.0 17.4 17.3 17.5 17.2 17.7
Two or More Races 58,528 5 19.8 20.0 21.4 20.7 20.6 20.6
Prefer not/No Response 134,841 10 18.2 19.0 19.6 19.4 19.2 19.4
National
State
National
State

ACT PROFILE REPORT- State: SECTION II, ACADEMIC ACHIEVEMENT PAGE 16
Graduating Class 2021 Code 049999
Arkansas
Total Students in Report: 32,971
Table 2.4. Average ACT Composite Scores for Gender by Level of Preparation
Number of Percent Taking Average ACT Composite Score
Students Tested Core or More 2
Core or More Less Than Core
Males 14,764 52 20.7 17.0
Females 15,147 62 20.6 17.5
Other Responses 3,060 18 19.8 16.5
Males 589,971 46 22.8 18.9
Females 635,458 51 22.3 19.5
Other Responses 69,920 12 21.7 18.5
Table 2.5. Average ACT Scores by Gender
Student Group Gender 1 N Percent English Mathematics Reading Science Composite STEM
Males 14,764 45 18.1 18.6 18.8 19.3 18.8 19.2
Females 15,147 46 19.4 18.2 19.9 19.4 19.3 19.0
Other Responses 3,060 9 17.3 17.4 18.3 18.3 17.9 18.1
Males 589,971 46 19.1 20.4 20.6 20.6 20.3 20.8
Females 635,458 49 20.2 19.7 21.5 20.4 20.6 20.3
Other Responses 69,920 5 17.4 18.2 19.0 18.8 18.5 18.8
Table 2.6. ACT Score Quartile Values
Quartile English Mathematics Reading Science Composite
Q3 (75th Percentile) 23 21 23 23 22
Q2 (50th Percentile) 18 17 18 19 18
Q1 (25th Percentile) 14 15 14 16 15
1 'Other Responses' include 'Another Gender', 'Prefer Not to Respond', and missing values.
2 "Core or More" results correspond to students taking four or more years of English AND three or more years each of math, social studies, and natural science.
National
Student Group Gender 1
State
National
State

ACT PROFILE REPORT - State: SECTION III, COLLEGE AND CAREER READINESS & THE IMPACT OF COURSE RIGOR PAGE 17
Graduating Class 2021 Code 049999
Arkansas
Total Students in Report: 32,971
Section III
College and Career Readiness
and the Impact of Course Rigor

ACT PROFILE REPORT - State: SECTION III, COLLEGE AND CAREER READINESS AND THE IMPACT OF COURSE RIGOR PAGE 18
Graduating Class 2021 Code 049999
Arkansas
Total Students in Report: 32,971
Figure 3.1. Percent of Students Meeting 3 or 4 College Readiness Benchmarks by Core College Curriculum Status*
35
10
22
41
24
58
11
33 32
13
3
6
18
9
22
0
13
10
0
10
20
30
40
50
60
70
80
90
100
All Students Black/AfricanAmerican
AmericanIndian/Alaska Native
White Hispanic Asian NativeHawaiian/OtherPacific Islander
Two or more Races Prefer not toRespond/NoResponse
Perc
ent
Core Non-Core
*Missing columns reflect combinations of race/ethnicity and core course-taking status in which one or both indicators are missing.

ACT PROFILE REPORT - State: SECTION III, COLLEGE AND CAREER READINESS & THE IMPACT OF COURSE RIGOR PAGE 19
Graduating Class 2021 Code 049999
Arkansas
Total Students in Report: 32,971
Table 3.1. Percent of Students in College and Career Readiness Standards (CCRS) Score Ranges
Student English Mathematics Reading Science
Group N % N % N % N %
33 to 36 1,494 5 295 1 1,592 5 597 2
28 to 32 1,947 6 1,255 4 2,697 8 1,568 5
24 to 27 3,716 11 3,884 12 3,298 10 4,250 13
20 to 23 6,673 20 4,441 13 6,862 21 8,410 26
16 to 19 6,382 19 12,333 37 7,319 22 10,010 30
13 to 15 6,361 19 9,952 30 6,280 19 5,282 16
01 to 12 6,398 19 811 2 4,923 15 2,854 9
33 to 36 95,817 7 41,465 3 117,422 9 54,198 4
28 to 32 98,959 8 107,737 8 151,693 12 104,928 8
24 to 27 164,383 13 213,588 16 154,489 12 210,189 16
20 to 23 258,585 20 187,249 14 273,249 21 320,781 25
16 to 19 222,968 17 416,094 32 245,336 19 335,008 26
13 to 15 220,647 17 301,109 23 197,215 15 164,313 13
01 to 12 233,990 18 28,107 2 155,945 12 105,932 8
Table 3.2. Percent of Students Who Met College Readiness Benchmark Scores by Gender
Percent of Students Met
English Mathematics Reading Science All Four
Males 47 25 32 27 17
Females 56 22 37 25 15
Other Responses 41 17 28 21 11
Males 53 38 42 37 27
Females 60 34 46 34 25
Other Responses 43 23 33 25 151 'Other Responses' include 'Another Gender', 'Prefer Not to Respond', and missing values.
National
Student Group
CCRS
Range
State
National
Gender 1
State

ACT PROFILE REPORT - State: SECTION III, COLLEGE AND CAREER READINESS & THE IMPACT OF COURSE RIGOR PAGE 20
Graduating Class 2021 Code 049999
Arkansas
Total Students in Report: 32,971
Table 3.3. Percent of Students Who Met ACT College Readiness Benchmark Scores by Race/Ethnicity
Student English Mathematics Reading Science All Four STEM
Group Race/Ethnicity N % % % % % %
All Students 32,971 51 23 34 26 15 10
Black/African American 4,814 25 6 12 7 3 1
American Indian/Alaska Native 243 40 14 21 14 7 2
White 17,937 62 30 43 33 21 14
Hispanic/Latino 3,961 41 16 24 17 9 5
Asian 553 69 53 50 48 35 31
Native Hawaiian/Other Pacific Islander 113 25 8 8 6 3 1
Two or More Races 1,541 54 23 35 27 15 10
Prefer Not to Respond 3,809 40 18 27 21 12 9
All Students 1,295,349 56 36 44 35 25 19
Black/African American 153,641 28 10 18 11 6 3
American Indian/Alaska Native 10,094 30 13 22 14 7 5
White 698,565 67 44 53 44 31 24
Hispanic/Latino 181,958 41 22 31 22 14 10
Asian 54,272 76 67 64 61 52 48
Native Hawaiian/Other Pacific Islander 3,450 33 18 23 16 11 8
Two or More Races 58,528 58 35 46 36 25 19
Prefer Not to Respond 134,841 46 29 36 29 20 16
Table 3.4. Likely ACT National Career Readiness Certificate (NCRC) Level Based Upon ACT Composite Score1
Student Average
Group ACT NCRC Level N % Composite
Platinum 3,282 10 29.8
Gold 6,072 18 23.7
State Silver 10,889 33 18.9
Bronze 10,506 32 14.5
Needs Improvement 2,222 7 11.6
Platinum 225,006 17 30.3
Gold 277,376 21 23.8
National Silver 381,864 29 18.9
Bronze 328,553 25 14.5
Needs Improvement 82,550 6 11.51
The ACT Composite scores associated with at least a 50% chance of earning each ACT NCRC level or higher are: 13 for Bronze, 17 for Silver,
22 for Gold, and 27 for Platinum. Based on those cut scores, students who earned an ACT Composite score of less than 13 are classified as
‘Needs improvement’ as they are unlikely to obtain an ACT NCRC. Students with an ACT Composite score of 13 to 16 are classified as ‘Bronze’
as they are likely to obtain a Bronze NCRC, 17 to 21 as ‘Silver’, 22 to 26 as ‘Gold’, and 27 or above as ‘Platinum’.
Visit www.act.org/NCRC-indicator to learn more.
State
National

ACT PROFILE REPORT - State: SECTION III, COLLEGE AND CAREER READINESS & THE IMPACT OF COURSE RIGOR PAGE 21
Graduating Class 2021 Code 049999
Arkansas
Total Students in Report: 32,971
Table 3.5. College Readiness Benchmark Percent and Average ACT Scores by Overall High School Curriculum
Student Curriculum English Mathematics Reading Science Composite4
STEM
Group Taken1 % Avg % Avg % Avg % Avg % Avg % Avg
Core or More2
17,666 65 20.6 32 19.6 44 21.0 35 20.7 22 20.6 15 20.4
Less than Core 5,677 37 16.5 11 16.8 22 17.4 15 17.6 7 17.2 4 17.5
Missing3
9,628 34 16.2 13 16.8 22 17.1 15 17.5 8 17.0 5 17.4
Core or More 599,682 72 22.1 49 21.8 57 23.2 48 22.4 36 22.5 28 22.4
Less than Core 229,759 48 18.4 27 18.8 36 19.8 27 19.4 18 19.2 13 19.3
Missing 465,908 39 16.8 22 18.1 30 18.5 22 18.5 14 18.1 10 18.51 "Curriculum Taken" reflects overall high school curriculum in this table.
2 "Core or More" results correspond to students taking four or more years of English AND three or more years each of math, social studies, and natural science.
3 Zero years or no coursework information reported in one or more content areas.
4 Composite College Readiness Benchmark % results reflect students who met all four subject-area benchmarks.
Table 3.6. College Readiness Benchmark Percent and Average ACT Scores by Content-Specific Curriculum
Student Curriculum English Mathematics Reading Science
Group Taken1 N % Avg N % Avg N % Avg N % Avg
Core or More2
21,879 59 19.8 22,437 28 19.1 21,608 40 20.4 20,301 32 20.3
Less than Core 1,983 34 16.1 1,157 5 15.5 2,019 16 16.2 3,307 13 17.2
Missing3
9,109 35 16.3 9,377 13 16.8 9,344 22 17.2 9,363 15 17.6
Core or More 789,281 67 21.3 793,620 45 21.2 738,095 53 22.6 705,623 46 22.1
Less than Core 56,980 38 16.6 44,627 9 16.0 99,996 36 19.8 131,559 22 18.5
Missing 449,088 39 16.8 457,102 22 18.1 457,258 30 18.5 458,167 23 18.51
"Curriculum Taken" reflects content-specific curriculum in this table.2 "Core or More" results correspond to students taking four or more years of English or three or more years of math, social studies, or natural science, respectively.
For instance, Reading "Core or More" results correspond to students taking three or more years of social studies, regardless of courses taken in other content areas.3 Zero years or no coursework information reported in the specified content area.
National
N
State
National
State

ACT PROFILE REPORT - State: SECTION III, COLLEGE AND CAREER READINESS & THE IMPACT OF COURSE RIGOR PAGE 22
Graduating Class 2021 Code 049999
Arkansas
Total Students in Report: 32,971
Table 3.7. College Readiness Benchmark (CRB) Percent and Average ACT Scores by Common Course PatternsCourse Pattern State National
ENGLISH COURSE PATTERN N
Percent Taking
Pattern
Avg ACT
English
Percent Who Met
Benchmark N
Percent Taking
Pattern
Avg ACT
English
Percent Who Met
Benchmark
Eng 9, Eng 10, Eng 11, Eng 12, & Other English 4,322 13 21.4 69 165,958 13 22.3 72
Eng 9, Eng 10, Eng 11, Eng 12 17,557 53 19.4 57 623,323 48 21.1 65
Less than 4 years of English 1,983 6 16.1 34 56,980 4 16.6 38
Zero years / no English courses reported 9,109 28 16.3 35 449,088 35 16.8 39
MATHEMATICS COURSE PATTERN N
Percent Taking
Pattern
Avg ACT
Math
Percent Who Met
Benchmark N
Percent Taking
Pattern
Avg ACT
Math
Percent Who Met
Benchmark
Alg 1, Alg 2, Geom, Trig, & Calc 641 2 20.5 40 41,584 3 23.2 61
Alg 1, Alg 2, Geom, Trig, & Other Adv Math 1,186 4 21.3 48 58,940 5 21.4 49
Alg 1, Alg 2, Geom, & Trig 832 3 18.2 21 38,353 3 18.8 26
Alg 1, Alg 2, Geom, & Other Adv Math 7,641 23 18.3 20 179,211 14 19.1 28
Other comb of 4 or more years of Math 7,120 22 21.3 47 326,953 25 24.1 66
Alg 1, Alg 2, & Geom 3,338 10 16.1 6 98,409 8 16.5 9
Other comb of 3 or 3.5 years of Math 1,679 5 17.5 16 50,170 4 19.5 32
Less than 3 years of Math 1,157 4 15.5 5 44,627 3 16.0 9
Zero years / no Math courses reported 9,377 28 16.8 13 457,102 35 18.1 22
SOCIAL SCIENCE COURSE PATTERN N
Percent Taking
Pattern
Avg ACT
Reading
Percent Who Met
Benchmark N
Percent Taking
Pattern
Avg ACT
Reading
Percent Who Met
Benchmark
US Hist, World Hist, Am Gov, & Other Hist 163 0 19.5 35 25,929 2 22.6 53
Other comb of 4 or more years Social Science 12,996 39 21.3 46 400,925 31 23.3 57
US Hist, World Hist, & Am Gov 574 2 17.3 21 63,786 5 19.9 37
Other comb of 3 or 3.5 years of Social Science 7,875 24 19.3 33 247,455 19 22.1 50
Less than 3 years of Social Science 2,019 6 16.2 16 99,996 8 19.8 36
Zero years / no Social Science courses reported 9,344 28 17.2 22 457,258 35 18.5 30
NATURAL SCIENCE COURSE PATTERN N
Percent Taking
Pattern
Avg ACT
Science
Percent Who Met
Benchmark N
Percent Taking
Pattern
Avg ACT
Science
Percent Who Met
Benchmark
Gen Sci1, Bio, Chem, & Phys 7,024 21 20.8 37 326,363 25 22.9 52
Bio, Chem, Phys 771 2 22.4 49 109,874 8 24.0 60
Gen Sci1, Bio, Chem 11,286 34 20.0 29 244,298 19 20.4 33
Other comb of 3 years of Natural Science 1,220 4 19.6 29 25,088 2 19.2 26
Less than 3 years of Natural Science 3,307 10 17.2 13 131,559 10 18.5 22
Zero years / no Natural Science courses reported 9,363 28 17.6 15 458,167 35 18.5 231Includes General, Physical and Earth Sciences.

ACT PROFILE REPORT - State: SECTION III, COLLEGE AND CAREER READINESS & THE IMPACT OF COURSE RIGOR PAGE 23
Graduating Class 2021 Code 049999
Arkansas
Total Students in Report: 32,971
Table 3.8. College Readiness Benchmark (CRB) Percent and Average ACT Scores for Gender by Common Course Patterns
Course Pattern Males Females Other Responses 1
ENGLISH COURSE PATTERN N Percent
ACT
English
% Who Met
Benchmark N Percent
ACT
English
% Who Met
Benchmark N Percent
ACT
English
% Who Met
Benchmark
Eng 9, Eng 10, Eng 11, Eng 12, & Other English 1,773 12 21.0 65 2,461 16 21.6 71 88 3 21.5 75
Eng 9, Eng 10, Eng 11, Eng 12 8,040 54 18.9 54 8,791 58 19.9 60 726 24 18.0 45
Less than 4 years of English 1,013 7 15.6 31 826 5 16.9 40 144 5 15.3 27
Zero years / no English courses reported 3,938 27 15.6 30 3,069 20 16.7 38 2,102 69 17.0 39
MATHEMATICS COURSE PATTERN N Percent
ACT
Math
% Who Met
Benchmark N Percent
ACT
Math
% Who Met
Benchmark N Percent
ACT
Math
% Who Met
Benchmark
Alg 1, Alg 2, Geom, Trig, & Calc 285 2 21.7 48 338 2 19.6 33 18 1 19.7 33
Alg 1, Alg 2, Geom, Trig, & Other Adv Math 437 3 21.6 51 718 5 21.2 47 31 1 21.0 48
Alg 1, Alg 2, Geom, & Trig 360 2 18.6 24 434 3 18.0 20 38 1 17.4 13
Alg 1, Alg 2, Geom, & Other Adv Math 2,907 20 18.5 23 4,438 29 18.1 19 296 10 18.1 21
Other comb of 4 or more years of Math 3,549 24 21.9 52 3,417 23 20.7 42 154 5 20.4 38
Alg 1, Alg 2, & Geom 1,624 11 16.3 7 1,503 10 15.9 4 211 7 15.6 4
Other comb of 3 or 3.5 years of Math 890 6 17.7 17 705 5 17.3 14 84 3 16.6 11
Less than 3 years of Math 629 4 15.5 5 421 3 15.5 5 107 3 15.4 6
Zero years / no Math courses reported 4,083 28 16.7 12 3,173 21 16.5 10 2,121 69 17.3 17
SOCIAL SCIENCE COURSE PATTERN N Percent
ACT
Reading
% Who Met
Benchmark N Percent
ACT
Reading
% Who Met
Benchmark N Percent
ACT
Reading
% Who Met
Benchmark
US Hist, World Hist, Am Gov, & Other Hist 93 1 19.0 32 65 0 20.3 40 5 0 17.6 20
Other comb of 4 or more years Social Science 5,452 37 20.9 44 7,120 47 21.7 48 424 14 20.3 43
US Hist, World Hist, & Am Gov 320 2 17.4 23 219 1 17.2 18 35 1 16.9 17
Other comb of 3 or 3.5 years of Social Science 3,747 25 19.2 33 3,778 25 19.4 33 350 11 18.3 28
Less than 3 years of Social Science 1,079 7 16.1 15 810 5 16.6 17 130 4 15.5 13
Zero years / no Social Science courses reported 4,073 28 16.5 19 3,155 21 17.5 23 2,116 69 18.0 26
NATURAL SCIENCE COURSE PATTERN N Percent
ACT
Science
% Who Met
Benchmark N Percent
ACT
Science
% Who Met
Benchmark N Percent
ACT
Science
% Who Met
Benchmark
Gen Sci2, Bio, Chem, & Phys 3,468 23 21.2 41 3,349 22 20.5 33 207 7 19.5 28
Bio, Chem, Phys 331 2 22.8 51 417 3 22.1 47 23 1 21.4 43
Gen Sci1, Bio, Chem 4,531 31 20.0 30 6,342 42 20.0 28 413 13 19.2 24
Other comb of 3 years of Natural Science 676 5 20.1 34 478 3 19.0 24 66 2 18.0 23
Less than 3 years of Natural Science 1,677 11 17.1 14 1,396 9 17.3 12 234 8 16.8 12
Zero years / no Natural Science courses reported 4,081 28 17.3 15 3,165 21 17.5 13 2,117 69 18.2 201 'Other Responses' include 'Another Gender', 'Prefer Not to Respond', and missing values.
2 Includes General, Physical and Earth Sciences.

ACT PROFILE REPORT - State: SECTION III, COLLEGE AND CAREER READINESS & THE IMPACT OF COURSE RIGOR PAGE 24
Graduating Class 2021 Code 049999
Arkansas
Total Students in Report: 32,971
This page intentionally left blank.

ACT PROFILE REPORT - State: SECTION IV, CAREER AND EDUCATIONAL ASPIRATIONS PAGE 25
Graduating Class 2021 Code 049999
Arkansas
Total Students in Report: 32,971
Section IV
Career and Educational Aspirations

ACT PROFILE REPORT - State: SECTION IV, CAREER AND EDUCATIONAL ASPIRATIONS PAGE 26
Graduating Class 2021 Code 049999
Arkansas
Total Students in Report: 32,971
Figure 4.1. Average ACT Composite Scores by Race and Student Postsecondary Aspirations*
13.8
15.3
16.6
15.4
17.1
14.714.2
14.9
16.8
15.8
17.817.0
16.3
18.0
20.5
18.6
20.9
16.6
18.3
19.3
23.6
20.9
26.8
14.0
18.3
20.5
23.6
20.7
26.4
21.5
1
6
11
16
21
26
31
Black/African American American Indian/Alaska Native White Hispanic/Latino Asian Native Hawaiian/Other PacificIslander
Avera
ge C
om
posite S
core
Voc-Tech 2-yr College Degree Bachelors Degree Graduate Study Prof. Level Degree
*Missing columns reflect combinations of race/ethnicity and postsecondary aspiration in which one or both indicators are missing.

ACT PROFILE REPORT - State: SECTION IV, CAREER AND EDUCATIONAL ASPIRATIONS PAGE 27
Graduating Class 2021 Code 049999
Arkansas
Total Students in Report: 32,971
Table 4.1. Distribution of Planned Educational Majors for All Students by College Plans
All Students Plan on 2 Years or Less of College Plan on 4 Years or More of College
Planned Educational Major N1
Percent2
Avg ACT
Comp N Percent
Avg ACT
Comp N Percent
Avg ACT
Comp
Agriculture & Natural Resources Conservation 634 2 18.4 96 4 15.8 481 3 19.2
Architecture 259 1 20.2 25 1 16.3 220 1 20.8
Area, Ethnic, & Multidisciplinary Studies 23 0 18.6 2 0 15.0 19 0 19.2
Arts: Visual & Performing 1,254 4 19.9 184 7 16.6 979 5 20.7
Business 1,987 6 19.7 222 9 16.3 1,664 9 20.3
Communications 239 1 20.9 18 1 16.6 218 1 21.3
Community, Family, & Personal Services 665 2 17.4 147 6 15.6 454 3 18.1
Computer Science & Mathematics 728 2 22.6 51 2 18.8 641 4 23.1
Education 1,281 4 19.6 47 2 15.9 1,183 7 19.9
Engineering 1,417 4 21.6 158 6 15.8 1,177 7 22.7
Engineering Technology & Drafting 278 1 18.8 74 3 15.7 186 1 20.2
English & Foreign Languages 168 1 22.7 13 1 17.3 151 1 23.3
Health Administration & Assisting 809 2 17.6 106 4 16.1 676 4 17.9
Health Sciences & Technologies 4,251 13 20.2 235 9 16.3 3,885 22 20.5
Philosophy, Religion, & Theology 93 0 21.0 6 0 16.0 85 0 21.4
Repair, Production, & Construction 601 2 16.4 355 14 16.1 167 1 17.7
Sciences: Biological & Physical 1,324 4 22.7 23 1 16.6 1,254 7 22.9
Social Sciences & Law 1,401 4 21.4 57 2 16.7 1,289 7 21.7
Undecided 3,334 10 19.8 358 14 16.3 2,518 14 20.7
No Response 12,140 37 17.1 292 12 14.9 579 3 17.312-Year and 4-Year "N" counts do not reflect "Missing" and "Other" college plans, therefore they may not add up to the N count for All Students.
2Percent of students tested within College Plan groups (All Students, 2-Year, 4-Year).

ACT PROFILE REPORT - State: SECTION IV, CAREER AND EDUCATIONAL ASPIRATIONS PAGE 28
Graduating Class 2021 Code 049999
Arkansas
Total Students in Report: 32,971
Table 4.2. Average ACT Composite Scores for Racial/Ethnic Groups by Post-Secondary Educational Aspirations
All Racial/Ethnic Groups
Combined Black/African American American Indian/ Alaska Native White Hispanic/Latino
N Average N Average N Average N Average N Average
Voc-Tech 876 15.9 133 13.8 12 15.3 491 16.6 119 15.4
2-yr College Degree 1,625 16.1 248 14.2 9 14.9 884 16.8 270 15.8
Bachelors Degree 11,089 19.5 1,495 16.3 82 18.0 6,918 20.5 1,353 18.6
Graduate Study 2,624 22.6 279 18.3 14 19.3 1,781 23.6 219 20.9
Prof. Level Degree 4,153 22.5 540 18.3 23 20.5 2,601 23.6 423 20.7
Other 711 16.2 95 14.5 5 15.2 396 16.7 79 15.6
No Response 11,893 17.2 2,024 14.8 98 15.6 4,866 18.2 1,498 16.3
All Racial/Ethnic Groups
Combined Asian
Native Hawaiian/
Other Pacific Islander Two or more races
Prefer not to respond/
No Response
N Average N Average N Average N Average N Average
Voc-Tech 876 15.9 7 17.1 3 14.7 37 17.4 74 15.6
2-yr College Degree 1,625 16.1 13 17.8 6 17.0 80 16.5 115 15.4
Bachelors Degree 11,089 19.5 197 20.9 14 16.6 533 19.5 497 18.9
Graduate Study 2,624 22.6 60 26.8 1 14.0 128 22.3 142 20.7
Prof. Level Degree 4,153 22.5 145 26.4 2 21.5 208 22.2 211 22.1
Other 711 16.2 4 18.5 2 13.0 38 17.7 92 15.7
No Response 11,893 17.2 127 19.7 85 15.0 517 17.5 2,678 17.5
Educational Degree
Aspirations
Educational Degree
Aspirations

ACT PROFILE REPORT - State: SECTION IV, CAREER AND EDUCATIONAL ASPIRATIONS PAGE 29
Graduating Class 2021 Code 049999
Arkansas
Total Students in Report: 32,971
Table 4.3. Students' Score Report Preferences at Time of Testing
Percent of Students in
Number of Students College Readiness Standards Ranges
Name State Total 1st Choice
2nd-6th
Choice 01-12 13-15 16-19 20-23 24-27 28-32 33-36
UNIVERSITY OF ARKANSAS Arkansas 7,332 3,023 4,309 2 14 28 26 17 11 2
UNIVERSITY OF CENTRAL ARKANSAS Arkansas 6,210 1,966 4,244 3 17 30 26 16 7 1
ARKANSAS TECH UNIVERSITY Arkansas 4,471 1,755 2,716 3 18 31 26 15 6 1
ARKANSAS STATE UNIVERSITY Arkansas 4,026 1,855 2,171 4 19 30 26 14 6 1
UNIVERSITY OF ARKANSAS AT LITTLE ROCK Arkansas 2,369 606 1,763 7 27 32 20 9 4 0
STATE-NO COLLEGE PLANS Iowa 1,879 1,879 0 17 42 27 10 3 0 0
HENDERSON STATE UNIVERSITY Arkansas 1,561 471 1,090 6 23 33 23 12 3 0
UNIV OF ARKANSAS-FORT SMITH Arkansas 1,534 526 1,008 4 20 31 25 14 5 1
SOUTHERN ARKANSAS UNIVERSITY Arkansas 1,288 450 838 5 22 32 25 11 5 1
OUACHITA BAPTIST UNIVERSITY Arkansas 1,027 236 791 2 15 24 28 19 11 1
NORTHWEST ARKANSAS COMMUNITY COLLEGE Arkansas 1,008 396 612 3 23 36 25 10 3 0
HARDING UNIVERSITY Arkansas 945 276 669 2 13 26 28 17 11 3
ARKANSAS STATE UNIVERSITY-BEEBE Arkansas 883 464 419 5 24 35 25 10 2 0
PULASKI TECHNICAL COLLEGE Arkansas 797 280 517 7 27 36 19 8 2 0
UNIV OF ARKANSAS AT PINE BLUFF Arkansas 745 209 536 13 43 31 10 2 1 0
HENDRIX COLLEGE Arkansas 727 172 555 2 13 24 23 20 15 3
UNIV OF ARKANSAS AT MONTICELLO Arkansas 724 245 479 6 29 34 20 8 3 0
UNIV OF ARKANSAS COMM COLL-MORRILTON Arkansas 620 202 418 5 27 36 22 8 2 0
LYON COLLEGE Arkansas 519 122 397 4 17 32 26 15 4 1
UNIVERSITY OF THE OZARKS Arkansas 515 83 432 6 23 33 24 9 4 0
JOHN BROWN UNIVERSITY Arkansas 460 119 341 3 13 30 25 17 10 2
SOUTHERN ARKANSAS UNIVERSITY TECH Arkansas 443 126 317 8 37 36 13 5 2 0
UNIVERSITY OF MEMPHIS Tennessee 431 94 337 4 21 36 23 10 6 0
NCAA ELIGIBILITY CENTER Indiana 413 206 207 9 35 26 18 8 4 1
WILLIAMS BAPTIST COLLEGE Arkansas 405 105 300 4 22 33 25 11 4 0
LOUISIANA ST UNIV/A&M-BATON ROUGE Louisiana 392 85 307 6 23 29 24 10 6 2
UNIV OF ARKANSAS FOR MEDICAL SCIENCES Arkansas 387 57 330 4 17 36 26 14 3 0
ARKANSAS STATE UNIVERSITY-NEWPORT Arkansas 357 108 249 6 30 38 19 5 2 0
NATIONAL PARK COLLEGE Arkansas 356 152 204 7 25 40 20 5 2 0
UNIV OF ARKANSAS COMM COLL-BATESVILLE Arkansas 341 126 215 6 27 35 22 9 1 0
All Other Institutions 20,344 5,014 15,330 5 21 27 20 14 10 3
Total 63,509 21,408 42,101 5 21 29 23 13 7 2

ACT PROFILE REPORT - State : SECTION IV, CAREER AND EDUCATIONAL ASPIRATIONS PAGE 30
Graduating Class 2021 Code 049999
Arkansas
Total Students in Report: 32,971
This page intentionally left blank.

ACT PROFILE REPORT - State: SECTION V, OPTIONAL WRITING TEST RESULTS PAGE 31
Graduating Class 2021 Code 049999
Arkansas
Total Students in Report: 32,971
Section V
Optional Writing Test Results

ACT PROFILE REPORT - State: SECTION V, OPTIONAL WRITING TEST RESULTS PAGE 32
Graduating Class 2021 Code 049999
Arkansas
Total Students in Report: 32,971
Figure 5.1. Average ACT Writing Scores by Race/Ethnicity*
6.7
6.2
5.3
6.7 6.6
8.3
5.5
6.6
6.3
5.3 5.3
6.5
6.0
7.5
5.8
6.4
2
3
4
5
6
7
8
9
10
11
12
All Students Black/African American American Indian/AlaskaNative
White Hispanic/Latino Asian Native Hawaiian/OtherPacific Islander
Two or More Races
Avera
ge W
ritin
g S
core
State National
*Missing columns reflect race/ethnicity groupings that are missing.

ACT PROFILE REPORT - State: SECTION V, OPTIONAL WRITING TEST RESULTS PAGE 33
Graduating Class 2021 Code 049999
Arkansas
Total Students in Report: 32,971
Table 5.1. Average ACT English Language Arts Constituent Scores by Race/Ethnicity and Gender1 for Students Who Took ACT Writing
Average ACT Scores
N English Reading Writing
State National State National State National State National
All Students 989 463,733 21.8 19.3 22.3 20.9 6.7 6.3
Black/African American 116 57,714 16.7 14.7 17.7 16.4 6.2 5.3
American Indian/Alaska Native 8 4,031 17.1 14.8 17.8 16.9 5.3 5.3
White 598 222,801 22.8 21.0 23.2 22.6 6.7 6.5
Hispanic/Latino 128 79,176 19.3 16.7 19.9 18.4 6.6 6.0
Asian 40 27,716 30.9 24.7 29.3 25.2 8.3 7.5
Native Hawaiian/Other Pacific Islander 2 1,944 19.0 15.2 13.0 16.6 5.5 5.8
Two or More Races 56 24,007 21.4 19.6 21.8 21.3 6.6 6.4
Prefer not/No Response 41 46,344 23.1 18.4 24.3 19.9 6.8 6.0
Males 407 211,057 21.6 18.9 22.2 20.5 6.4 6.0
Females 573 226,886 21.9 20.0 22.2 21.4 6.9 6.6
Other Responses 9 25,790 27.4 17.3 28.2 18.9 7.4 5.8
Table 5.2. Average ACT English Language Arts Outcomes by Race/Ethnicity and Gender1 for Students Who Took ACT Writing
Average ACT Scores
Average Percent Who Met
N ELA Score ELA Benchmark
State National State National State National
All Students 989 463,733 20.6 18.8 52 43
Black/African American 116 57,714 16.8 14.6 25 16
American Indian/Alaska Native 8 4,031 16.1 14.8 13 16
White 598 222,801 21.2 20.3 58 53
Hispanic/Latino 128 79,176 18.9 16.8 39 29
Asian 40 27,716 27.8 23.4 98 69
Native Hawaiian/Other Pacific Islander 2 1,944 15.5 15.5 0 20
Two or More Races 56 24,007 20.2 19.2 43 45
Prefer not/No Response 41 46,344 21.6 17.9 63 37
Males 407 211,057 20.2 18.1 50 39
Females 573 226,886 20.8 19.6 54 48
Other Responses 9 25,790 25.2 16.9 100 311 'Other Responses' include 'Another Gender', 'Prefer Not to Respond', and missing values.
