profile of the practice 2013 – executive summary. reports/profile of the... · characteristics of...
TRANSCRIPT
Advancing from the coreProfile of the Practice 2013 – Executive Summary

1 Profile of the Practice 2013 – Executive Summary
Introduction
Key findingsIncreased responsibility at the topAlmost 60% of companies have an executive leading corporate citizenship. This is a 74% increase over what was reported in 2010. Close to one-third of corporate citizenship leaders are within one level of the chief executive.
More money budgeted for corporate citizenship Almost 100% of companies have a corporate citizen-ship budget today, while just 81% reported being budgeted in 2010.
Leaders are more engagedThe chief executive is more involved in developing strategy, setting goals, and communicating corporate citizenship than reported in both 2008 and 2010. More than 25% indicate that their chief executive is highly involved in corporate citizenship program evaluation.
Reputation enhancement is an important business goalMore than 70% of companies cited enhanced reputation among the top three business goals they are trying to achieve through their corporate citizenship efforts. The next most frequently cited goals are improving employee retention (45%), improving employee recruitment (41%), attracting new customers (33%), and improving risk management (22%).
Characteristics of above-average industry performers Above-average industry performers are more likely to have a formal corporate citizenship department, a program led at the executive level, and higher corporate citizenship and charitable giving budgets than average/below-average industry performers.
The Profile of the Practice 2013 explores how the environmental, so-cial, and governance (ESG) dimensions of business—corporate citizenship—are managed in today’s business world, and how these prac-tices have evolved since the last report in 2010. In the fall of 2013, a survey of 231 companies was conducted and their corporate citizenship strategies, operational structures, and business practices were analyzed.

2 Profile of the Practice 2013 – Executive Summary
Of the 231 companies surveyed, close to 60% have a formal corporate citizenship department.
In 2013, one-quarter of companies had a formal department for more than 10 years. Fifty-five percent of companies have had a corporate citizenship department for more than five years. In 2010, 51% of companies had a formal corporate citizenship function for more than five years.
Corporate citizenship department
Source: Boston College Center for Corporate Citizenship, Profile of the Practice 2013
Structure of corporate citizenship department
59%
41%
■ Companies with a formal department■ Companies without a formal department 0% 10% 20% 30% 40%
More than 20 years
10.1-20 years
7.1-10 years
5.1-7 years
3.1-5 years
1.1-3 years
1 year or less
The number of years a formal corporate citizenship department has been in place
{55%

3 Profile of the Practice 2013 – Executive Summary
Corporate citizenship has more senior leadership in 2013 compared with 2010. The number of VPs or higher who lead the corporate citizenship department/function increased 74%—from 33% in 2010 to 58% in 2013. Leaders of corporate citizenship are mostly based in corporate citizenship departments (14%), followed by human resources, and corporate communications. Employees with responsibility for corporate citizenship are assigned in a broad array of departments.
Increased responsibility at the top
Source: Boston College Center for Corporate Citizenship, Profile of the Practice 2013
Corporate citizenship leader
0%
10%
20%
30%
40%
50%
Staff
Manag
er
Directo
r
VP and a
bove
60%
■ 2013
■ 2010
Departments where corporate citizenship responsibility is based
0% 20% 40%
Corporate Citizenship Department (CSR, CR)
Corporate Communications
Human Resources
Marketing
Public/Government Affairs
Legal
Community Affairs/Relations/Involvement
Corporate Foundation
Office of the CEO
Environment, Health, and Safety
Compliance/Regulatory Affairs
Supply Chain/Procurement
10% 30%
■ Corporate citizenship leader
■ Employees with responsibility for corporate citizenship 0%
0%

4 Profile of the Practice 2013 – Executive Summary
There has been some progress in getting the practice better resourced. Almost one-half of companies reported that they have five or more employees with corporate citizenship responsibility, compared with 30% of companies reporting staffing at that level in 2010. In 2013, 97% of companies reported being allocated a discreet operating budget for corporate citizenship, compared with 81% in 2010. Thirty percent of companies have a budget of at least $1 million in 2013 compared with 24% in 2010, a 25% in-crease. These figures are exclusive of philanthropy budgets.
Growing resources
Source: Boston College Center for Corporate Citizenship, Profile of the Practice 2013
0% 20% 40%
Fewer than 2 employees
2 to less than 5 employees
5 to less than 8 employees
8 to 10 employees
11 to less than 20 employees
20 to less than 50 employees
50 or more employees
None/Other
10% 30%
Number of employees with corporate citizenship responsibility 2013
50%
Annual operating budget for corporate citizenship function
■ 2013
■ 2010
0% 20% 40%
$0
Less than $500,000
Between $500,000 and $999,999
Between $1 million and $4.99 million
$5 million or more
10% 30% 50%

5 Profile of the Practice 2013 – Executive Summary
Management practice
Management practices for corporate citizenship are similar today to what was reported in 2010. Among the notable developments is the increased involvement among employees and executives. There is a 30% increase in the number of companies that have an executive-level corporate citizenship council. Another notable difference is that the percentage of companies with an informal team of interested employees almost doubled in 2013.
Source: Boston College Center for Corporate Citizenship, Profile of the Practice 2013
Managing corporate citizenship
0% 20% 40%
Cross-functional team with managers and staff
Informal team of interested employees
Executive-level corporate citizenship council
Board of Directors committee
Cross-functional management team
We communicate cross-functionally but do not have a team in place
We do not coordinate cross-functionally
10% 30%
■ 2013 ■ 2010 *Answer choice not provided in 2010
N/A*
6 Profile of the Practice 2013 – Executive Summary
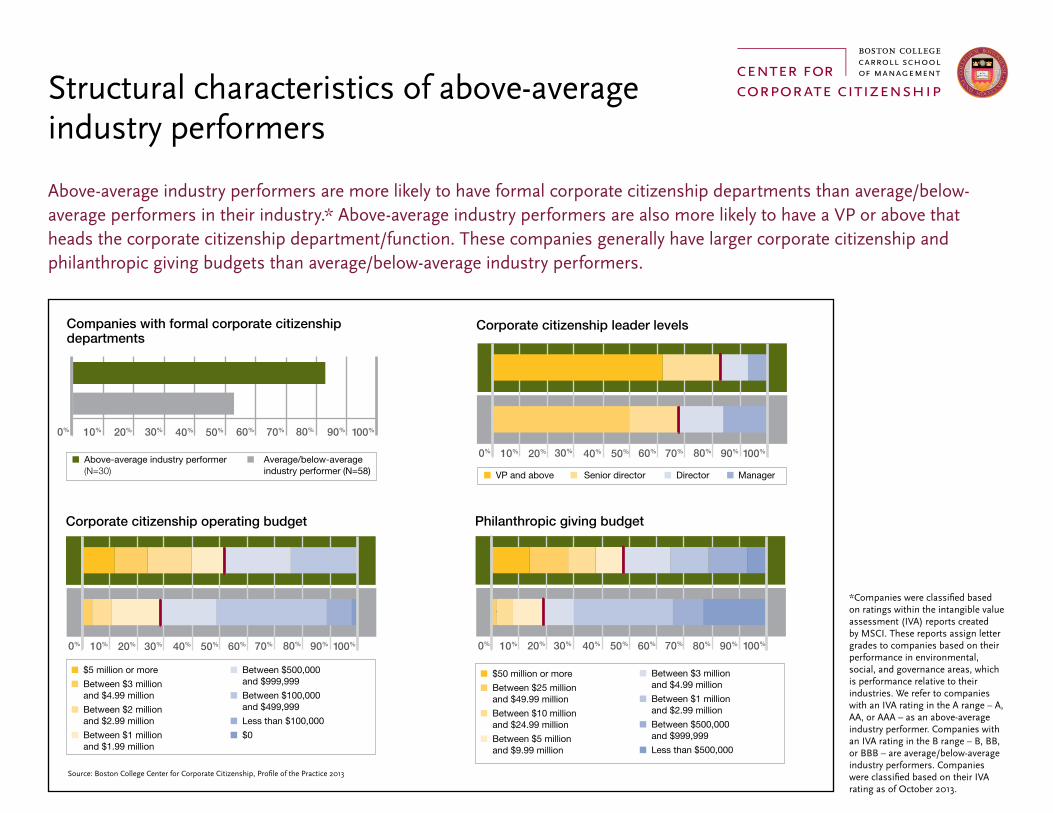
Above-average industry performers are more likely to have formal corporate citizenship departments than average/below- average performers in their industry.* Above-average industry performers are also more likely to have a VP or above that heads the corporate citizenship department/function. These companies generally have larger corporate citizenship and philanthropic giving budgets than average/below-average industry performers.
Structural characteristics of above-average industry performers
*Companies were classified based on ratings within the intangible value assessment (IVA) reports created by MSCI. These reports assign letter grades to companies based on their performance in environmental, social, and governance areas, which is performance relative to their industries. We refer to companies with an IVA rating in the A range – A, AA, or AAA – as an above-average industry performer. Companies with an IVA rating in the B range – B, BB, or BBB – are average/below-average industry performers. Companies were classified based on their IVA rating as of October 2013.
■ Above-average industry performer ■ Average/below-average (N=30) industry performer (N=58)
Companies with formal corporate citizenship departments
Philanthropic giving budget
■ $50 million or more■ Between $25 million
and $49.99 million■ Between $10 million
and $24.99 million■ Between $5 million
and $9.99 million
■ Between $3 million and $4.99 million
■ Between $1 million and $2.99 million
■ Between $500,000 and $999,999
■ Less than $500,000
Corporate citizenship leader levels
0% 20% 40%10% 30% 50% 70% 90%60% 80% 100%
■ VP and above ■ Senior director ■ Director ■ Manager
Corporate citizenship operating budget
■ $5 million or more■ Between $3 million
and $4.99 million■ Between $2 million
and $2.99 million■ Between $1 million
and $1.99 million
■ Between $500,000 and $999,999
■ Between $100,000 and $499,999
■ Less than $100,000■ $0
0% 20% 40%10% 30% 50% 70% 90%60% 80% 100% 0% 20% 40%10% 30% 50% 70% 90%60% 80% 100%
0% 20% 40%10% 30% 50% 70% 90%60% 80% 100%
Source: Boston College Center for Corporate Citizenship, Profile of the Practice 2013

7 Profile of the Practice 2013 – Executive Summary
Almost two-thirds of companies report having a formal corporate citizenship strategy. The most common approach to managing corporate citizenship across multiple global regions continues to be to employ general direction from the top, with local execution and adaption. This distributed approach allows companies to adjust to meet the needs of their diverse local communities.
Strategy
Source: Boston College Center for Corporate Citizenship, Profile of the Practice 2013
Corporate citizenship strategy
63%
28%
■ Companies with a formal corporate citizenship strategy■ Companies without a formal corporate citizenship strategy■ Companies with a formal corporate citizenship
strategy in progress■ Other
8%
1%
0% 10% 20% 30% 60%
Purely domestic
Domestic focus with some global activities
Global strategy
Scope of corporate citizenship strategy
40% 50%
■ 2013■ 2010■ 2008
Approach to managing corporate citizenship
0%
40%
50%
60%
70%
80%
■ 2013
■ 2010
Distribute
d
Centrali
zed
Decentr
alized
10%
20%
30%

8 Profile of the Practice 2013 – Executive Summary
Performance goals
Many companies include quantified performance goals on most measures related to employees, particularly safety (64%), health (57%), and labor practices (44%). At least 50% of companies have some quantified performance goals for every corporate citizenship dimension except responsible involvement with political processes.
Source: Boston College Center for Corporate Citizenship, Profile of the Practice 2013
0% 40% 100%
Employee safety
Environmental sustainability
Employee health
Fair operating practices
Responsibility in the supply chain
Ethics
Consumer data protection and privacy
Community involvement
Labor practices
Consumer issues
Corporate governance
Human rights
Economic development
Responsible involvement with political processes
20% 60%
Focus of corporate citizenship performance goals
80%
■ We have quantified performance goals on most measures■ We have quantified performance goals on some measures■ We have un-quantified performance goals■ We do not have corresponding performance goals

9 Profile of the Practice 2013 – Executive Summary
Companies include their corporate citizenship commit-ments (e.g., protect the environment) in their goals, strategic plan, and communication materials, but most commitments are not quantified. There are differences among industries in how they communicate corporate citizenship.
Communicating performance goals
Source: Boston College Center for Corporate Citizenship, Profile of the Practice 2013
0% 40% 100%
Annual report
Departmental goals
Overall business goals
Strategic plan
Recruitment materials
Investor relations materials
20% 60%
Where are corporate citizenship commitments found
80%
■ Quantified performance goals are included ■ Commitments are included but are not quantified ■ Not included
Source: Boston College Center for Corporate Citizenship, Profile of the Practice 2013
Investor relations materialsAnnual report Recruitment materials
0% 40% 100%
UtilitiesProfessional, scientific, and technical services
Health care and social assistance
Manufacturing
Mining and Construction
Retail and Wholesale trade
Finance and insurance
Information
20% 60% 80%
Manufacturing
UtilitiesProfessional, scientific, and
technical servicesHealth care and social assistance
Information
Finance and insurance
Retail and Wholesale trade
Professional, scientific, and technical services
Information
Manufacturing
Finance and insurance
Health care and social assistance
Utilities
Retail and Wholesale trade
■ Quantified performance goals are included ■ Commitments are included but are not quantified ■ Not included
0% 40% 100%20% 60% 80% 0% 40% 100%20% 60% 80%

10 Profile of the Practice 2013 – Executive Summary
When considering business goals to which corporate citizenship efforts can contribute, 71% of companies cite enhancing reputation among their top three. The next most frequently cited goal is improved employee retention—cited by 45% of com-panies. Forty-one percent of companies cited improved employee recruitment, and one-third included attracting new custom-ers within their top three business goals. Based on the amount of financial expenditures, education and the environment are the areas where companies are making the most significant investments with their corporate citizenship programs.
Business and social goals
0% 40%
Enhancing reputation
Improving ability to retain employees
Improving ability to recruit employees
Attracting new customers
Improving risk management
Developing innovative new products and services
Reducing waste in business operations
Improving access to new markets
Increasing customer intent to purchase
Securing a sustainable supply chain
Attracting new investors
Reducing employee health costs
20% 80%
Top business goals companies are trying to achieve through their corporate citizenship efforts
60%
■ Ranked No. 1■ Ranked No. 2■ Ranked No. 3
Improving STEM training and education
Ensuring environmental sustainability
Education
Eradicating extreme poverty and hunger
Providing relief following natural disasters
Combating noncommunicable diseases
Supporting small business and entrepreneurship
Promoting racial, ethnic, and cultural inclusion
Increasing access to cultural institutions
Top social issues companies are trying to address through their corporate citizenship efforts
■ Ranked No. 1■ Ranked No. 2■ Ranked No. 3
0% 40%20% 80%60%
Source: Boston College Center for Corporate Citizenship, Profile of the Practice 2013

11 Profile of the Practice 2013 – Executive Summary
CEOs are more engaged than ever, from setting strat-egies and establishing corporate citizenship goals to communicating their companies’ efforts. More than 60% of chief executives are highly engaged with supporting events and initiatives.
Overall, there is a high level of engagement at all levels of management. CEOs appear engaged at a higher rate than senior and middle management.
Leadership engagement
Source: Boston College Center for Corporate Citizenship, Profile of the Practice 2013
0% 40% 50%
Supportive of events and initiatives
Communicating internally
Communicating externally
Setting strategy
Establishing goals
Program evaluation
20% 60%
Chief executive is highly engaged in corporate citizenship areas
70%10% 30%
■ 2013■ 2010■ 2008
N/AN/A
N/AN/A
Senior management vs. middle management engagement levels
Chief executive engagement in corporate citizenship areas
Supportive of events and initiatives
Communicating internally
Communicating externally
Setting strategy
Establishing goals
Program evaluation
0% 40% 100%
Supportive of events and initiatives
Communicating internally
Communicating externally
Setting strategy
Establishing goals
Program evaluation
20% 60% 80%
Senior Management ■ Highly engaged ■ Somewhat engaged ■ Not engaged
Middle Management■ Highly engaged■ Somewhat engaged ■ Not engaged
0% 40% 100%20% 60% 80%
CEO/President■ Highly engaged■ Somewhat engaged■ Not engaged
Source: Boston College Center for Corporate Citizenship, Profile of the Practice 2013

12 Profile of the Practice 2013 – Executive Summary
More companies offer corporate citizenship professional development and more have formalized programs. Resources available for participation in external programs increased by 2.5x since 2010. The percentage of companies offering formal internal programs increased by 3x from just 5% in 2010 to 15% in 2013.
Professional development
Source: Boston College Center for Corporate Citizenship, Profile of the Practice 2013
50%0% 40%
Resources available to CC managers for participation
in external programs
Resources available for participation in external programs
Program included as onboarding
Informal internal program
No professional development
Internal program for CC managers
Formal internal program
20%
Professional development
10% 30%
■ 2013■ 2010*Answer choice not provided in 2010
N/A*

13 Profile of the Practice 2013 – Executive Summary
Measuring and reporting
More than 70% of companies collect ESG data to manage corporate citizenship performance. Most employ a centralized approach to data collection. More than half of companies publish corporate citizenship reports. The most common titles applied to these reports are sustainability and corporate social responsibility.
Source: Boston College Center for Corporate Citizenship, Profile of the Practice 2013
Corporate citizenship data collection approach
57%
16%
■ Centralized■ Decentralized■ Not applicable■ Other
25%
2%
Corporate citizenshipreporting
53%
■ Companies that release a corporate citizenship report
■ Companies that do not release a report
■ N/A - do not collect corporate citizenship data
24%
23%
0% 10% 20% 30%
Sustainability
Corporate Social Responsibility (CSR)
Corporate Responsibility (CR)
Corporate Citizenship
Sustainable Development
Social Responsibility
Titles of corporate citizenship reports

14 Profile of the Practice 2013 – Executive Summary
Communicating with stakeholders
More than 90% of companies include information from their corporate citizenship reports on their websites. More than half of companies also are communicating on ESG performance through their annual reports, another sign that corporate citizenship is be-coming integrated into the business. Companies use social media (e.g., Twitter, Facebook) more for external communications.
Source: Boston College Center for Corporate Citizenship, Profile of the Practice 2013
0% 20%
Company website
Annual report
Communication of corporate citizenship report
40% 60% 80% 100%Source: Boston College Center for Corporate Citizenship, Profile of the Practice 2013
90%0% 70%
Company website
Periodic press releases
Corporate citizenship report
Blogs
Investor relations materials
Advertising campaign
No external communication
External communication methods
50%
■ 2013■ 2010*Answer choice not provided in 2010
N/A*
N/A*
N/A*
N/A*
30%
Intranet
Company website
Regular employee communications
Employee ambassadors
Internal meetings
Corporate citizenship report
Informal group of interested employees
Videos
Human resources materials
Employee resource groups
Blogs
Wiki
Internal communication methods
90%0% 70%50%30%

15 Profile of the Practice 2013 – Executive Summary
Profile of companies surveyed
Source: Boston College Center for Corporate Citizenship, Profile of the Practice 2013
0% 10% 20% 30%
Finance and insurance
Manufacturing
Professional, scientific, and technical services
Utilities
Health care and social assistance
Information
Retail and Wholesale trade
Transportation and warehousing
Mining and Construction
Industry
Company type
57%28%
■ Publicly traded for-profit company
■ Private for-profit company
■ Private nonprofit corporation
■ Other■ Governmental and
quasi-governmental corporations
Business type
46%
■ Both B2B and B2C■ Business-to-business
(B2B)■ Business-to-consumer
(B2C)■ Other
3%
36%
6%6%
3%
15%
Company operations
67%
■ Global■ Domestic (headquarters
country only)
33%
0% 10% 20% 40%
Less than $1 billion
$1 billion to less than $5 billion
$5 billion to less than $10 billion
$10 billion to less than $15 billion
$15 billion to less than $20 billion
$20 billion to less than $25 billion
$25 billion and over
Company revenue for prior fiscal year
30%
The Carroll School of Management Center for Corporate Citizenship at Boston College is a membership-based knowledge center. Founded in 1985, the Center has a history of leadership in corporate citizenship research and education. We engage 400 member companies and more than 10,000 individuals annually to share knowl-edge and expertise about the practice of corporate citizenship through the Center’s executive education programs, online community, regional programs, and our annual conference. For more information, visit the Center’s website at BCCorporateCitizenship.org.
About the Center for Corporate Citizenship at Boston College
55 lee road • chestnut hill, ma 02467-3942 • t: 617–552–4545 • f: 617–552–8499 • e-mail: [email protected] • www.BCCorporateCitizenship.org
The 36-page Profile of the Practice 2013 report features: Adobe, Blue Cross Blue Shield of Michigan, CenterPoint Energy, Citrix, Hypertherm, Inc., JM Family Enterprises, Inc., UNUM, and World Wrestling Entertainment, Inc. To view the entire report please visit the Center for Corporate Citizenship website at http://www.bcccc.net/ProfileOfThePractice.
Center for Corporate Citizenship members, please contact Karen Hoff at [email protected], for a customized view of the Profile of the Practice information related to your specific industry or other business demographic.