profile of older americans - corporation for national and ......welcome! kristen robinson kristen...
TRANSCRIPT
Reflecting on the Profile of Older AmericansSenior Corps Tuesday Talks: July 25, 2017
3:30pm ET
Housekeeping
• All lines on mute
• This session is being recorded
• Audio problems? Try calling in.
• Video problems? Try disconnecting and reconnecting.
• Questions

Welcome!
Kristen RobinsonKristen Robinson has worked in the field of aging since 1998, beginning her career as Staff Director for the
Federal Interagency Forum on Aging-Related Statistics at the National Center for Health Statistics in
Hyattsville, MD. As Staff Director, she worked closely with senior officials and program staff from 14 Federal
agencies to facilitate collaboration among agencies that share a common interest in improving aging-related
data. Today, Kristen is a Senior Research Scientist and Project Manager for Social & Scientific Systems in
Silver Spring, MD. She works onsite at the Administration for Community Living (ACL) assisting the Office of
Performance and Evaluation in identifying emerging areas of research, expanding performance and
evaluation activities, and participating in strategic planning to strengthen ACL’s core research and data
collection activities. Kristen received her doctorate degree in sociology and demography from Penn State
University.
Kristen Tracy has worked in the field of gerontology for 22 + years and has a Bachelor of Arts in
Social Work and a Master of Science in Gerontology with an emphasis on creative aging.
Kristen translates the concepts of creative aging into the volunteer sector where she manages
FGP and RSVP. Kristen has a deep passion for anti-poverty programming and the ties between
resiliency and creative development throughout the lifespan. She is the current President of
the National Association of Foster Grandparent Program Directors and Past Chair of Idaho’s
Commission on Volunteer Service.
Kristen Tracy

Agenda
• An Introduction to the Profile of Older Americans
• Spotlighting Key Findings
• Where Can You Find More Data?
• Reflecting on the Profile of Older Americans

July 25, 2017
A Profile of Older Americans: 2016
Kristen Robinson
A Product of the Administration for Community Living
Senior Corps Tuesday TalksPage
Background
• Annual report produced by the Administration for Community Living/HHS
• Data are primarily from the U.S. Census Bureau and National Center for Health Statistics
• Unique report in that it combines the most recent data from several different Federal data sources
6

Number of persons age 65 and over: 1900-2060 (numbers in millions)
3.1 4.99
16.2
25.5
35 36.6
47.856.4
82.3
98.2
1900 1920 1940 1960 1980 2000 2005 2015 2020 2040 2060
7
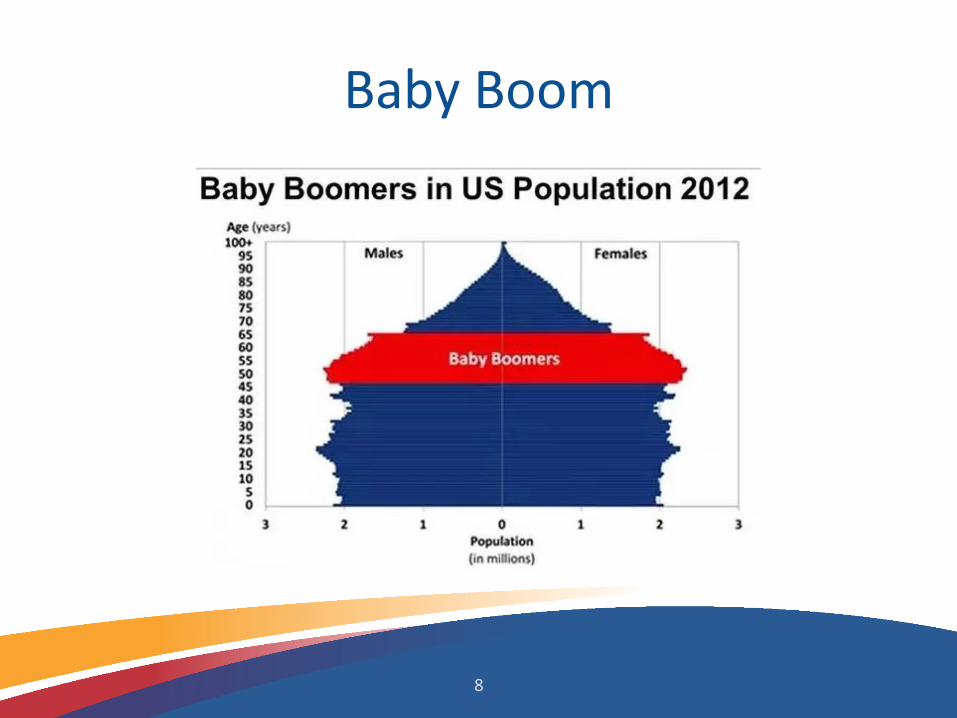
Baby Boom
8
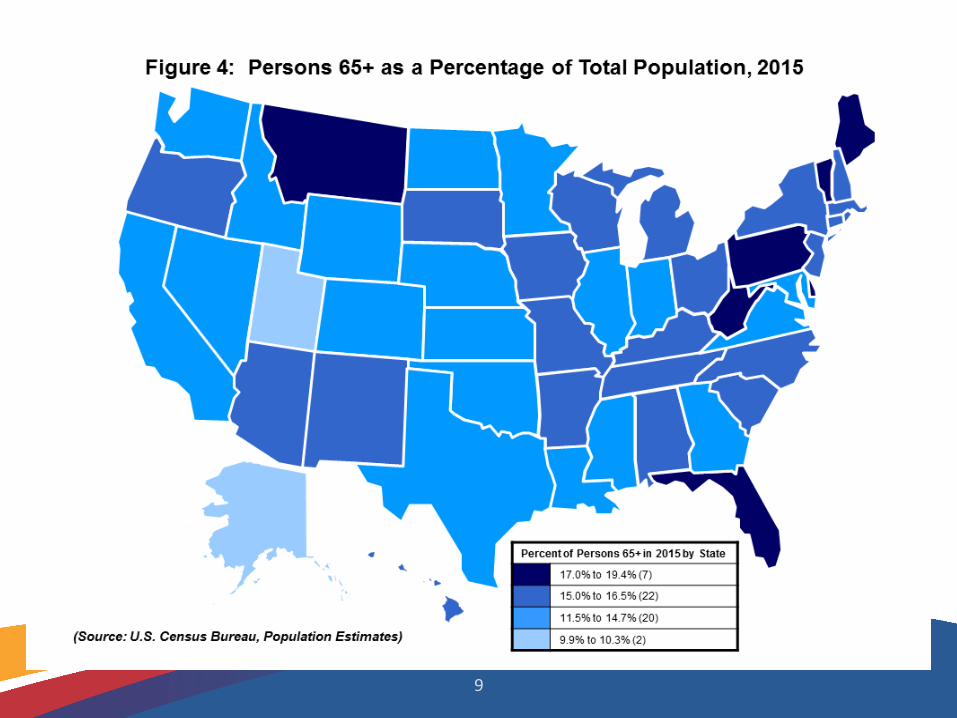
9

10

Projections of growth in older racial and ethnic minority populations
• Between 2015 and 2030 the percentage of
– Older Hispanics will increase by 123%
– Older African Americans will increase by 81%
– Older American Indians will increase by 82%
– Older Asians will increase by 90%
– Older Whites will increase by 43%
11
Life Expectancy
• People reaching age 65 today can expect to live on average an additional 19.4 years.
• The average life expectancy for a child born today is 78.8 years.
• The number of people reaching age 100 in 2015 (76,974) has more than doubled since 1980 (32,194).
12

Chronic Conditions
In 2015, the most frequently occurring chronic conditions among people age 75+ were:
• Arthritis (53%)
• Heart disease (35%)
• Cancer (32%)
• Diabetes (22%)
• Hypertension (men=72%) (women=80%)
13
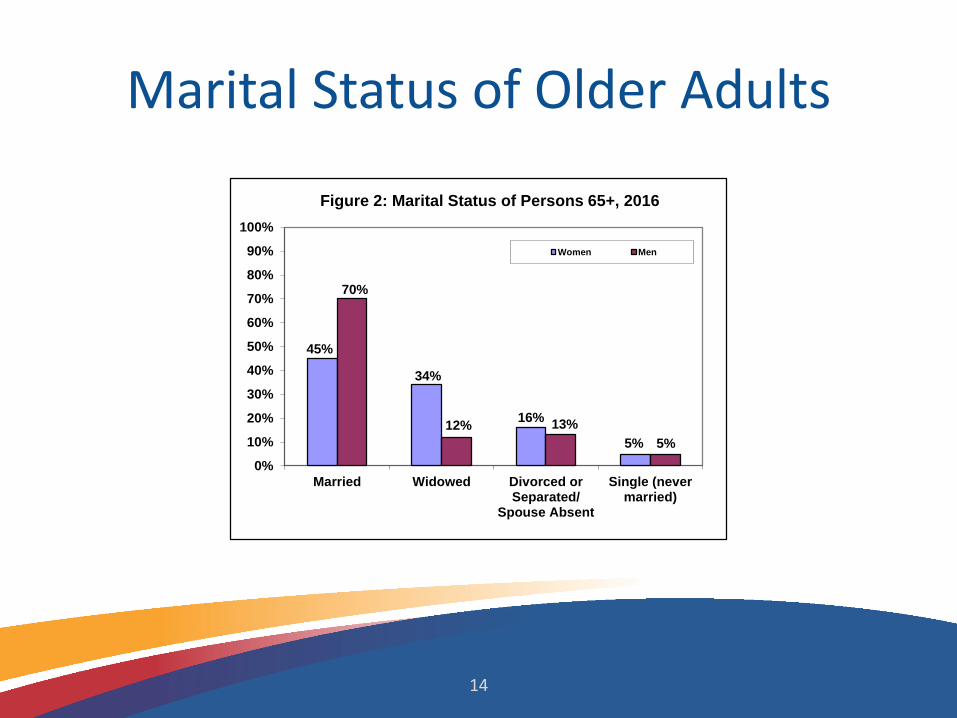
Marital Status of Older Adults
14
45%
34%
16%
5%
70%
12% 13%
5%
0%
10%
20%
30%
40%
50%
60%
70%
80%
90%
100%
Married Widowed Divorced orSeparated/
Spouse Absent
Single (nevermarried)
Figure 2: Marital Status of Persons 65+, 2016
Women Men
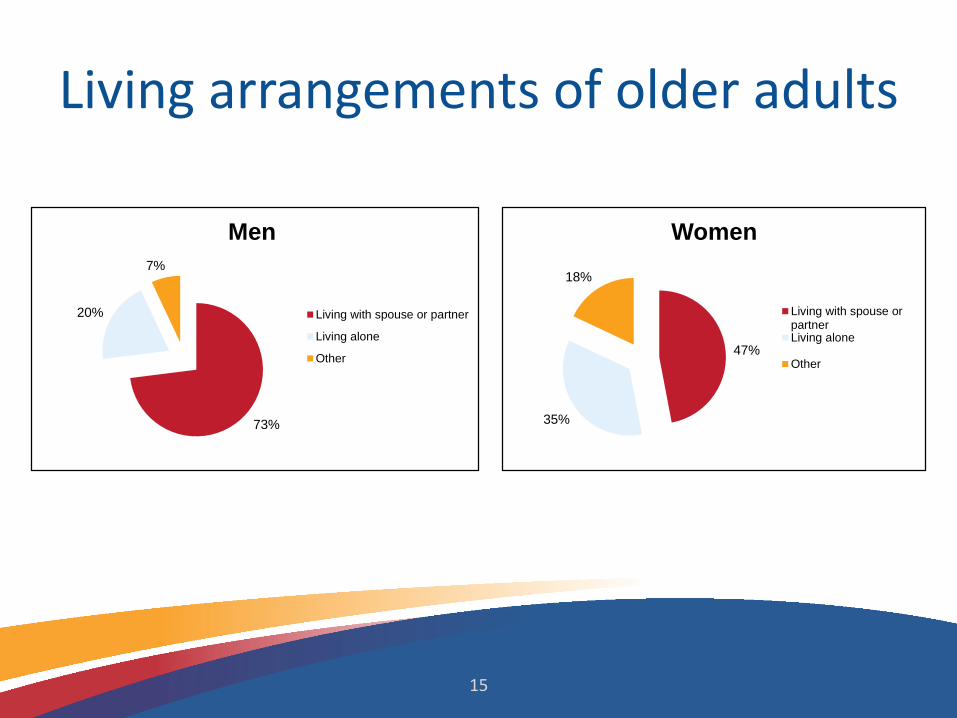
Living arrangements of older adults
15
73%
20%
7%
Men
Living with spouse or partner
Living alone
Other47%
35%
18%
Women
Living with spouse orpartnerLiving alone
Other
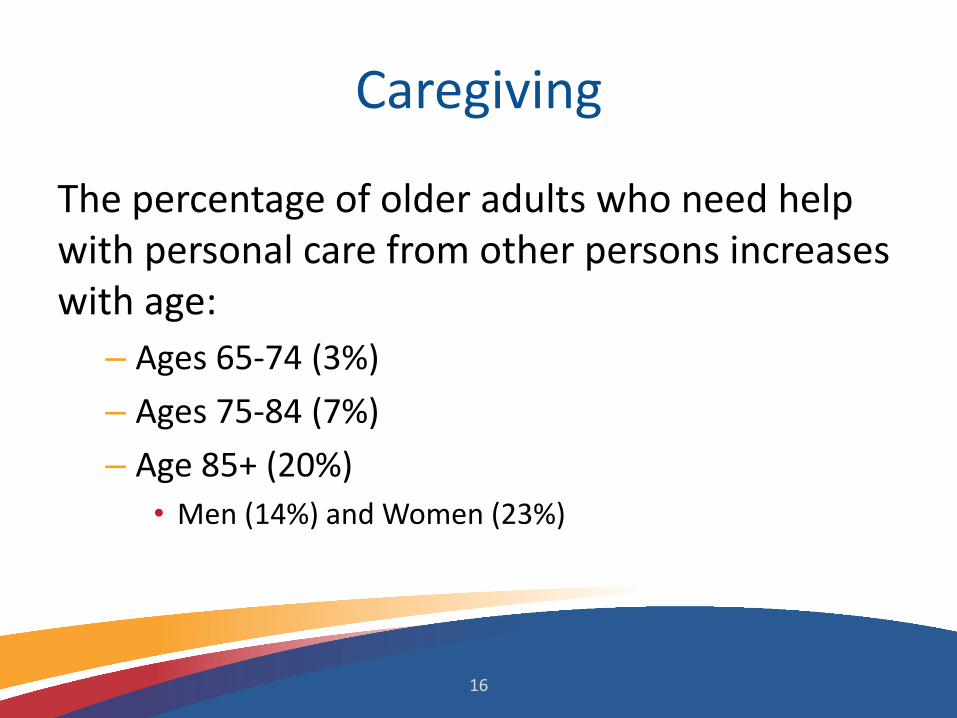
Caregiving
The percentage of older adults who need help with personal care from other persons increases with age:
– Ages 65-74 (3%)
– Ages 75-84 (7%)
– Age 85+ (20%)
• Men (14%) and Women (23%)
16
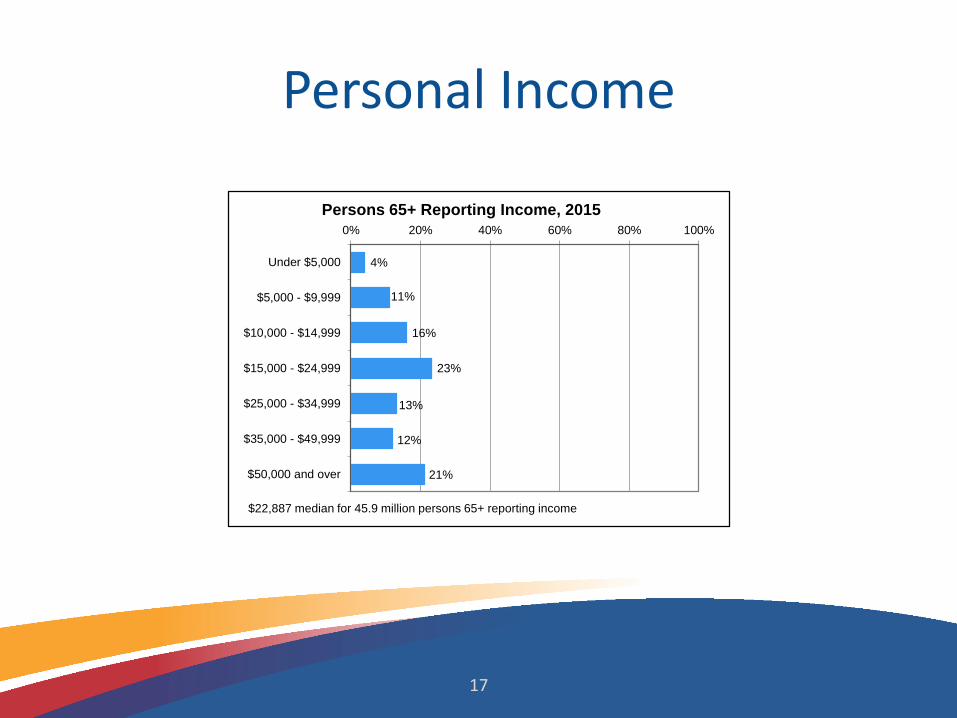
Personal Income
17
4%
11%
16%
23%
13%
12%
21%
0% 20% 40% 60% 80% 100%
Under $5,000
$5,000 - $9,999
$10,000 - $14,999
$15,000 - $24,999
$25,000 - $34,999
$35,000 - $49,999
$50,000 and over
Persons 65+ Reporting Income, 2015
$22,887 median for 45.9 million persons 65+ reporting income
Poverty
• BAD NEWS: In 2015 over 4.2 million people age 65+ lived below the poverty level.
• GOOD NEWS: The percentage of people age 65+ living below poverty decreased from 10% in 2014 to 8.8% in 2015
• LOWEST POVERTY: Older people living with families (5.7%)
• HIGHEST POVERTY: Older Hispanic women living alone (40%)
18
Two Ways to Measure Poverty
• Since 1964, poverty has been measured by comparing pre-tax cash income against a threshold of three times the cost of a minimum food diet in 1963, updated annually for inflation using the CPI.
– People age 65+ living below poverty in 2015 using official measure = 8.8%
• In 2011, the Supplemental Poverty Measure (SPM) was developed to take into account regional variation in the cost of housing, etc.; non-cash benefits (SNAP, WIC, etc.); and non-discretionary expenditures including medical out-of-pocket expenses such as deductibles, coinsurance, and any medical costs not covered by insurance.
– People age 65+ living below poverty in 2015 using SPM = 13.7%– The SPM does not yet replace the official poverty measure.
19

Sources of county level data
• Bureau of Labor Statistics– Local Area Unemployment Statistics
• Census Bureau– American Community Survey– Population Estimates– Small Area Income and Poverty Estimates
• Centers for Disease Control and Prevention– Behavioral Risk Factors: Selected Metropolitan Area
Risk Trends (SMART)
20

Reflecting on the Profile of Older Americans
Image designed by Freepik