profile annual review accounts13 14 opt
DESCRIPTION
Newcastle University Profile Annual Review and Accounts 2013-14TRANSCRIPT

Annual Reviewand Accounts 2013-14
Profile

ContentsIntroduction from the Chair of Council
Introduction from the Vice-Chancellor
Strategic Report
Charity status and public benefit statement
Operational Review
Financial Review
Corporate Governance
Independent Auditor’s Report to Council
Statement of Principal Accounting Policies
Consolidated Income and Expenditure Account
Balance Sheets
Consolidated Cash Flow Statement
Notes to the Accounts
Five-year Summary
4
6
8
29
31
35
39
44
45
48
50
51
52
71
Front cover: the first cohort of medical doctors graduating from our NUMed campus.This page: the University Arches and Armstrong Building set within a beautifully landscaped area.

Front cover: the first cohort of medical doctors graduating from our NUMed campus.This page: the University Arches and Armstrong Building set within a beautifully landscaped area.

Introduction from the Chair of Council
I am pleased to introduce the financial statements for Newcastle University for 2013–14. You will see in the following pages that the University has recorded major achievements across all its strategic objectives and has generated a strong financial surplus in the past year.
Student recruitment in home and international markets was very buoyant in 2013–14. The University’s robust financial position means that we are able to support this growth through sustained investment in both our staff and our academic support. We have continued our programme of campus development, improved the quality of our teaching facilities and invested in the construction of major new student residences.
Our increasing international student population has further enhanced the diversity of our community, and is matched by the increased diversity of the University’s staff. Overseas, our activities go from strength to strength with the first doctors from our NUMed campus in Malaysia graduating in June 2014. Newcastle is the first UK university to establish a fully owned international branch campus for medicine.
As research activity in the UK increasingly focuses on centres of excellence, Newcastle University has once again demonstrated its strength and sustainability. Research income in 2013–14 outstripped the previous year and several major new research grants have contributed to a further significant increase in our research pipeline.
It is essential to our success that we continue to invest in world-class research. During the year, we commenced detailed
planning for a new £58m research centre at Science Central, a unique 24-acre site in the middle of Newcastle. Over time Science Central will grow, bringing together academia, industry, entrepreneurs and communities to develop solutions that will make a difference to people’s lives across the globe.
Another indication of research quality was the conferring of a Queen’s Anniversary Prize, recognising our long-term research and new strategies for the rural economy. The University was delighted to accept this honour, the third such award we have received in recent years.
None of this would have been achieved without the hard work and great dedication of our people. I would like to thank my fellow members of Council, the Vice-Chancellor and his executive team, our incredibly talented staff and, of course, our wonderful students for the many and varied contributions they have made to another successful year for Newcastle University.
Finally, our goals remain challenging. We must continue to raise the bar for all our academic endeavours. Achieving this requires robust finances, available resources for investment, and clear strategic leadership. These financial statements and their supporting narrative confirm that the University is well placed to meet these challenges.
Mark I’AnsonChair of Council and Pro-Chancellor
4

‘We continue to invest in world-class research’
5
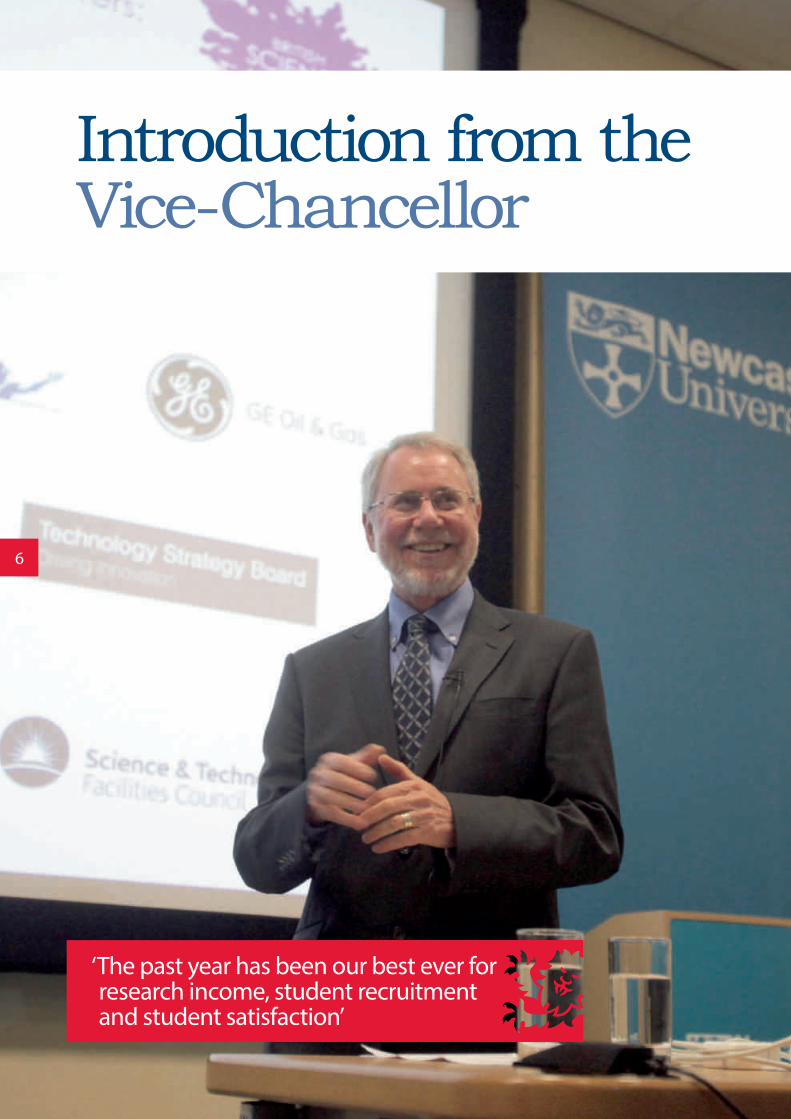
Introduction from theVice-Chancellor
‘The past year has been our best ever for research income, student recruitment and student satisfaction’
6

The fact is that the higher education environment is becoming more competitive all the time – not only in the sense of market forces, but also in the sense of academic quality. We need continuous improvement just to remain level with other universities, and even more to advance. And that holds true not just for the UK, but internationally. Many countries around the world are putting a lot of resource and effort into developing their universities. All the so-called ‘world rankings’ show that the East is rapidly catching up with the West.
September 2013 saw our best ever student recruitment numbers. In a year when the sector in England faced great uncertainty, we recruited 9,066 new students in September 2013 – 1,243 more than 2012. Simultaneously, we have been actively recruiting more academic staff, and will continue to do so, to address staff–student ratios. In the National Student Survey, 91% of our students were satisfied with the quality of their university experience. We also know that almost 94% of our students are in work or further training six months after they graduate. At a joint meeting of Senate and Council in April we plotted a course of moderate growth in student numbers, consistent with being able to provide a top-quality education and student experience.
We have had an exceptionally good year in terms of our research activity. Research income exceeded £100m for the first time, while new awards during the year again totalled £125m. In our second information brochure distributed world-wide with the Times Higher Education we focused on ‘The Impact of a World-Class Civic University’. This brochure concentrated attention on disciplines in which our research can truly be said to have excellence with impact, including liver disease, dementia, smart drugs for cancer treatment, energy, water, human trafficking and education in some of the world’s hardest to reach places.
The interdisciplinary research conducted by our societal challenge theme Institutes for Ageing, Social Renewal and Sustainability continues to gather pace. The University’s Institute for Sustainability secured a major EPSRC grant to establish a Smart Grid demonstrator on Science Central, which will show how energy from renewable sources can be stored and released. Our Institute for Ageing secured funding as part of the NE Dementia Hub to develop support for people with dementia and their families, and our Institute for Social Renewal supported a major project on the Future of Cities, which is a topic of growing interest among policy makers. In September 2013 we hosted the British Science Festival, with 19,000 visitors enjoying 258 different events and exhibitions.
Our contribution to the city and region continues to grow, perhaps most visibly on the Science Central site. The City Council has led on the construction of the first building, called The Core, and our own first building will be next. Called the Urban Sciences building, it will house our research activities on digitally enabled urban sustainability, using our city as a living laboratory. The School of Computing Science will relocate there, with their activities in digital interaction, cloud computing, cybersecurity, and other areas. Last year we won funding for the Neptune National Centre for Offshore and Subsea Engineering, and this facility is now being constructed on the north bank of the Tyne.
I recently returned from Malaysia where we celebrated the first cohort of medical doctors graduating from our NUMed campus. This was a significant milestone as Newcastle was the first UK university to establish a fully owned international branch campus for medicine. We have re-launched undergraduate teaching in physics, with the first intake arriving in September 2015. Our archaeologists have launched the University’s first MOOC (Massive Open Online Course), dealing
with Hadrian’s Wall, and they have had more than 17,300 registrations.
We received funding for a number of Doctoral Training Centres, in open competition. We have had national recognition of our work on the rural economy, with the Queen’s Anniversary Prize for Higher and Further Education going to the Centre for Rural Economy, founded by Professor Philip Lowe. Our Professor Sugata Mitra has had a busy year as the TED prizewinner, and Senate has approved setting up a research centre to pursue his idea of self-organising learning environments. The work done by Professor Doug Turnbull and his group on mitochondrial disease is having national impact, through the government consultation on draft regulations for the use of new techniques developed here at Newcastle.
In terms of finances we have also had a successful year, both in the sense of recording a strong surplus and in the sense of developing clear plans on how that surplus is to be reinvested in the academic environment and student experience. Our financial reserves are good, but are committed to ambitious plans over the next few years.
At the heart of all these successes are our people, so it was very pleasing to be placed in the top five of the Best UK University Workplace survey carried out by the Times Higher Education.
Overall, then, we have had a good year, and I would like to say a big thank you to all our staff and students, Senate, Council and Court, as well as our alumni, donors, benefactors and friends.
Introduction from theVice-Chancellor
In a number of respects the past year has been our best ever: best research income, best student recruitment, best student satisfaction. All of that happened despite the rigours of submitting to the Research Excellence Framework exercise in December 2013, plus all the many projects we have under way.
Professor Chris BrinkVice-Chancellor
7
Newcastle University can trace its origins to a school of medicine and surgery, established in Newcastle in 1834, and to the College of Physical Science, later Armstrong College, founded in the city in 1871. These two colleges formed one division of the federal University of Durham, the Durham Colleges forming the other division. The Newcastle Colleges merged to form King’s College in 1937 and, in 1963, when the federal University was dissolved, King’s College became the University of Newcastle upon Tyne, latterly trading as Newcastle University.
The University is a member of the Russell Group, comprising the UK’s leading research-intensive universities. It has one of the largest European Union research portfolios in the UK
and has research links with many other countries. Our research spans a wide range of activity with a strategy to address major societal challenges.
Over 22,000 students from more than 100 different countries choose to study at Newcastle University. We have over 200 full-time undergraduate degree programmes on offer, in a wide range of subject areas and combinations. Our campus at the heart of Newcastle city centre has some of the best teaching and learning facilities in the country. We have invested significantly in the University’s estate over the last few years to improve the quality of the environment for students, staff and visitors. We are one of the largest employers in the North East of England, with approximately 5,400 staff.
We play a leading role in the economic, social and cultural development of the North East of England and we collaborate with a range of partners and strategic initiatives, helping to extend the University’s influence and reinforce our ties with the city, region and beyond. These include Newcastle City Council, the NHS and the University of Durham via the Angel Alliance.
Our principal competitors are research-intensive universities in the UK and, to a lesser extent, other universities in the North East. However, it is in the nature of the higher education sector that we compete and collaborate at the same time.
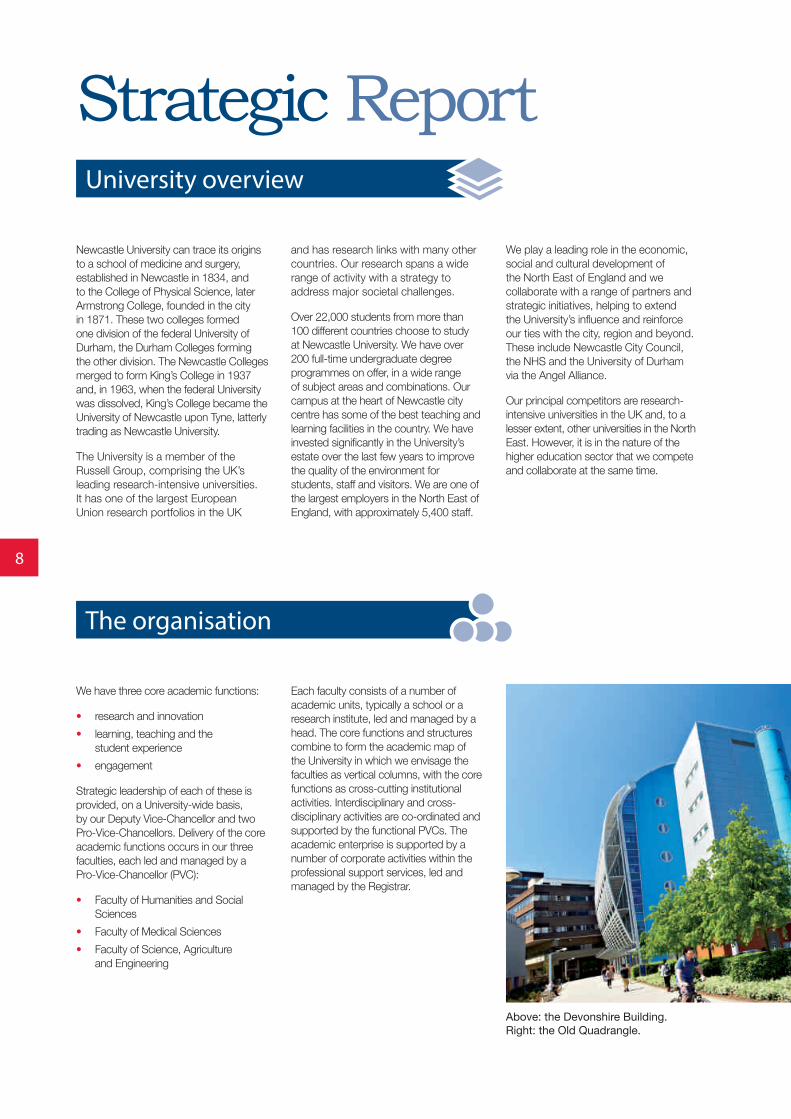
Strategic ReportUniversity overview
We have three core academic functions:
• research and innovation • learning, teaching and the
student experience• engagement
Strategic leadership of each of these is provided, on a University-wide basis, by our Deputy Vice-Chancellor and two Pro-Vice-Chancellors. Delivery of the core academic functions occurs in our three faculties, each led and managed by a Pro-Vice-Chancellor (PVC):
• Faculty of Humanities and Social Sciences
• Faculty of Medical Sciences • Faculty of Science, Agriculture
and Engineering
Each faculty consists of a number of academic units, typically a school or a research institute, led and managed by a head. The core functions and structures combine to form the academic map of the University in which we envisage the faculties as vertical columns, with the core functions as cross-cutting institutional activities. Interdisciplinary and cross-disciplinary activities are co-ordinated and supported by the functional PVCs. The academic enterprise is supported by a number of corporate activities within the professional support services, led and managed by the Registrar.
The organisation
Above: the Devonshire Building.Right: the Old Quadrangle.
8

The University’s key strategic planning document is Vision 2021: A World-class Civic University. The University’s mission is:
• to be a world-class research-intensive university
• to deliver teaching and facilitate learning of the highest quality
• to play a leading role in the economic, social and cultural development of the North East of England
The five key strategic objectives are to achieve and maintain the following:
• top 20 in the UK for research• top 20 in the UK for student
satisfaction• focus on three societal challenge
themes: ageing; social renewal; sustainability
• a significant international, national and regional profile and reputation
• financial and environmental sustainability
University Strategy
9

‘Human–computer interaction: enabling independent living’
10
• Perform high-quality research that is internationally recognised
• Provide a high-quality environment for students and staff
• Develop an innovation culture embedded throughout the University
• Agree and implement plans for international research investment, corporate engagement and raising the profile of our research outputs
• Maximise our EU research funding• Review the University’s research
management systems and particularly ‘MyImpact’; open access publications and open data / data management
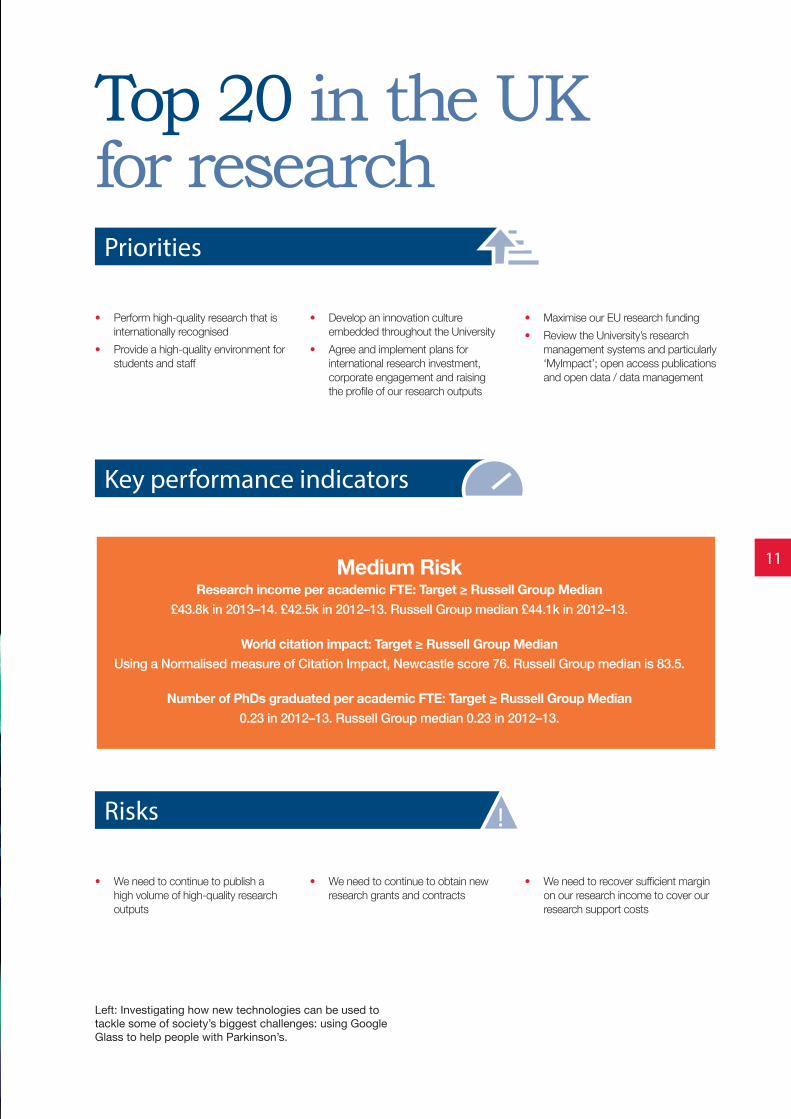
Medium Risk Research income per academic FTE: Target ≥ Russell Group Median
£43.8k in 2013–14. £42.5k in 2012–13. Russell Group median £44.1k in 2012–13.
World citation impact: Target ≥ Russell Group MedianUsing a Normalised measure of Citation Impact, Newcastle score 76. Russell Group median is 83.5.
Number of PhDs graduated per academic FTE: Target ≥ Russell Group Median0.23 in 2012–13. Russell Group median 0.23 in 2012–13.
Priorities
Top 20 in the UK for research
Key performance indicators
• We need to continue to publish a high volume of high-quality research outputs
• We need to continue to obtain new research grants and contracts
• We need to recover sufficient margin on our research income to cover our research support costs
Risks !
Left: Investigating how new technologies can be used to tackle some of society’s biggest challenges: using Google Glass to help people with Parkinson’s.
11

Progress during the past year
Research income increased by 9% from £93.4m in 2012–13 to £102.0m in 2013–14 with increases across almost the entire portfolio of funding sources. Key research income streams are illustrated below:
Research Council income increased for the second successive year from £27.3m in 2012–13 to £30.9m in 2013–14. UK government and health authority income increased from £18.6m in 2012–13 to £20.1m in 2013–14 and research income from EU government sources increased from £11.9m to £12.2m.
New research awards during the year remained impressively high at £124.8m with just a very slight decrease from £125.1m in 2012–13. While Research Council awards have remained flat at £37.6m in comparison to £37.5m the previous year, fluctuations to note across the portfolio of funding sources include an increase in UK government and health authority awards from £21.1m to £37.3m and a decrease in UK industry from £7.3m to £3.6m and non-EU industry from £10.2m to £1.7m.
Notable successes have included interdisciplinary awards such as grants from the Engineering and Physical Sciences Research Council (EPSRC) for the ‘MyPLACE, Mobility and PLace for the Age-Friendly City Environment’ project, involving a team from all three faculties (£1m); and for the purchase of advanced materials research equipment for a cross-faculty group involved in the government’s ‘Great Eight Technologies’ focus (£2.7m). Other sizeable infrastructure awards include the National Institute for Health Research Health Protection Research Unit (£3.8m) and the Medical Research Council (MRC) Maximising the MRC Brain Banks (£1.7m).
The MRC Stratified Medicine in Primary Biliary Cirrhosis award (£5m total with £2.3m to Newcastle) to carry out the largest ever study to develop new treatments and improve existing therapy for patients with this life-threatening liver disease is also particularly worthy of note.
During 2013–14 the University was also successful in securing substantial funding (in total exceeding £25m), to act as the lead institution in Doctoral Training Centres including EPSRC centres in Digital Civics and Cloud Computing for Big Data, the Natural Environment Research Council IAPETUS Centre, funding studentships in environmental and earth sciences and the Arts and Humanities Research Council Northern Bridge Doctoral Training Partnership, offering funding across a range of disciplines in humanities and social sciences.
1
2
3
4
5
6
• Research Councils
• UK charities
• UK government and NHS
• European Union
• Industry and commercial
• Other
Right: A new research programme aims to understand 3D vision in the praying mantis, and compare it to human vision by the use of tiny beeswax glasses.
12

‘New research awards during the year remained impressively high’
13

‘Joint 6th for student satisfaction among UK comparator universities, NSS 2014’
14

Top 20 in the UK for student satisfaction
We aim to deliver research-informed teaching and facilitate applied learning of the highest standard and deliver a fully rounded, enjoyable and formative student experience. Key priorities for the next one to two years are to:
• manage the implications of the removal of student numbers controls
• develop our postgraduate taught (PGT) student offer and recruitment to
PGT programmes for the first cohort of home students affected by £9,000 undergraduate fees
• address capacity and student support implications of increase in student numbers
• manage the impact of Home Office restrictions, student attendance monitoring and the end of post-study work visas on key international recruitment markets
• ensure delivery of a comparable ‘Newcastle University Student Experience’ in transnational, off-campus, distance or online programmes
• ensure a successful Quality Assurance Agency Higher Education Review in 2015
• We need to recognise student expectations and deliver on the student experience
• We need to maintain teaching quality and standards
• We need to achieve widening participation benchmarks and Access Agreement milestones
Priorities
Key performance indicators
Risks !
Good National Student Survey: Target ≥ 90% overall satisfaction and ≤ 5% disagreement
Overall satisfaction 91% in 2014 (90% in 2013).Overall dissatisfaction 4% in 2014 (5% in 2013).
Other satisfaction indicators: Target ≥ 90% satisfaction in each of the following:
Postgraduate Taught Experience Survey (PTES):PTES 2014, 86% (2012, 91%). PTES questions revised in 2014.
Postgraduate Research Experience Survey (PRES):PRES 2013, 83% (2011, 89%). PRES questions revised in 2013.
International Student Barometer (ISB):ISB 2013, 92% (2012, 90%). Average UKISB in 2013 is 90%.
15

Newcastle Sector
2008 86 82
2009 87 82
2010 87 82
2011 89 83
2012 89 85
2013 90 85
2014 91 86
Progress during the past year
The University further improved its strong institutional performance in the National Student Survey (NSS), with 91% of 2014 respondents satisfied with the overall quality of their course (compared with 90% in 2013, and showing sustained improvement from 81% in 2006).
These results reflect the significant impact of the University’s commitment to articulating and delivering the undergraduate ‘student offer’ as well as our investment in upgrading IT facilities, improving library resources, and developing innovative, user-friendly, learning spaces. Whilst improvements in the area of assessment and feedback have been sustained, this is the only area of the NSS where our score continues to be below the sector average. Actions to address this and to share good practice continue to be a high priority. Subject area results were pleasing with 33 out of 46 meeting or exceeding our 90% target for overall student satisfaction (30 out of 48 in 2013).
In the autumn 2013 International Student Barometer (ISB) results, 92% of Newcastle respondents were satisfied overall (90% in 2012). Newcastle University was ranked first out of 15 participating Russell Group universities in registration, living costs, financial support, work experience, careers service, personal tutors and IT support. Areas identified for improvement, including opportunities for the social integration of international students, are being addressed.
Postgraduate Taught Experience Survey results indicated that 86% of respondents in 2014 were satisfied overall (compared with 83% for the sector). Teaching scored a satisfaction rate of 85% (82% for the sector) and the score for Resources was 88% (82% for the sector). Assessment and feedback remains more challenging, with 77% of respondents expressing satisfaction, compared with 72% for the
sector. We participate in this survey and the Postgraduate Research Experience Survey in alternate years.
Excellent employability outcomes reflect our continued focus on the development of our students’ employability skills. The 2013 Destination of Leavers of Higher Education survey employment indicator of 93.7% (2012: 95.2%) places Newcastle in the middle of the 24 Russell Group universities and first in the North East. Whilst our performance is very similar to last year, a general improvement nationally in outcomes means that our overall ranking is lower than in 2012. The proportion of graduates in professional and managerial work is 77% (76% in 2012) and 18% were in further study. Both figures compare favourably with the national picture and our unemployment rate is also 2% lower than the national average.
We continued to focus on delivering our undergraduate student offer, which defines the common principles, elements and opportunities at the core of the learning experience of all undergraduate students. Our commitment to improvement and investment embraces both the academic learning experience and all aspects of a student’s time at Newcastle: academic, social, cultural, sporting, residential and work experience. A key focus for the coming year will be further development of our postgraduate taught provision in a market which is increasingly competitive.
Our support for students to develop skills for learning, life, work and professional
practice continued to include at least 12,000 individual opportunities provided under the ncl+ scheme. Opportunities include volunteering, accredited and paid placements, an entrepreneurship module, the Newcastle Work Experience scheme and the JobsOC (Jobs On Campus) agency which employs students in temporary and casual work on campus. A new ncl+ award will give students the opportunity formally to record their activity and achievements on their academic record.
The Student Voice is an important feature of our governance and strategic planning processes. As active members of the University community, students trained by Newcastle University Students’ Union contribute through our representation system, including course representatives and student chairs of staff–student committees, as well as representation on many key University committees and groups. We will support the initiative by HEFCE and the National Union of Students to provide our student body with better visibility of the University’s financial performance.
Wholly organised and initiated by the Students’ Union, the Teaching Excellence Awards (TEA Awards) recognise and celebrate the outstanding performance of Newcastle University’s academic and support staff. Nominations are invited in a number of categories, and the judging process culminates in a celebration event in which the shortlisted candidates are presented, and the winning submissions are announced. The 2014 event was the most successful ever, with 632
Newcastle Sector
92919089888786858483828180
2008 2009 2010 2011 2012 2013 2014
National Student Survey - Percentage Satisfaction (Q22)
16

nominations for 426 individual members of staff. The event is a popular and influential example of the University and its students working in partnership as members of a thriving academic community.
High-quality, functional facilities that support varied approaches to teaching, learning and assessment are an important feature of Newcastle’s provision. All modules have a presence on the University’s virtual learning environment, Blackboard, which received more than 60m hits in 2013–14. The ReCap lecture capture service attracted more than 510,000 views amounting to nearly 120,000 hours of viewing in 2013–14.
Following major library refurbishments in 2012, further improvements have been made to social learning spaces and facilities for researchers and future developments include expanded library and study space. Social learning opportunities are being enhanced through the refurbishment of spaces and resources in the heart of campus. In summer 2014, student demand for library study space was such that a much-appreciated ‘pop-up library’ was provided in the heart of campus during the peak revision and examination period.
We invested £2.7m in refurbishing the student accommodation stock, with much of this investment underpinning our carbon reduction strategy and Wi-Fi programme. In response to student preference for en-suite accommodation close to campus, we developed the Grand Hotel to create 66 en-suite rooms (£2.3m) with estimated energy savings of £14,000 per year. The capital development at Kensington Terrace and Park Terrace, creating 350 en-suite rooms, opened in September 2014.
Sport continued to enhance the student experience at Newcastle with 9,664 students taking out Sports Centre membership. In performance sport Team Newcastle were ranked 16th out of 152 institutions competing in the British Universities and Colleges Sport (BUCS) programme. Investment in the sporting infrastructure continued with the refurbishment of the fitness suites including new equipment, the reinstatement of the cricket square at Cochrane Park and improved drainage and spectating facilities at Heaton sports ground.
We are committed to promoting our full student offer to prospective students in ways which inform, engage and support
them in their aspiration to study at Newcastle University. We have invested significantly in digital and social media delivery, which is enabling us to amplify the impact of our successful student recruitment and widening participation activities with schools and colleges across the UK. As part of our Access Agreement commitments, we are expanding our activities with schools and colleges across the UK, delivered by a team of trained and highly professional Graduate Ambassadors, and our unique Teachers’ Toolkit (shortlisted for a Times Higher Education Leadership and Management Award in 2014). Our ongoing popularity is reflected in record attendance, approaching 36,000, at our three Visit Days in 2013 (33,000 in 2012).
A University-branded bus brought the University right into the city centre, situated next to the Haymarket Metro during our June Visit Days.
17

Investigating how new technologies can be used to tackle some of societyʼs biggest challenges’
‘
18

• Develop the ‘Future Cities’ initiative working with Newcastle City Council
• Develop the Digital Civics Doctoral Training Centre and look at the potential to develop international relationships
• Complete phase 1 of Newcastle Science Central developments
• Finalise designs for the Urban Sciences building at Science Central
• Continue research activity on smart cities working with partners including Northern Powergrid, Northumbrian Water and Siemens
• Develop the Campus for Ageing and Vitality as a world-leading research location
Focus on three societal challenge themes
• We need to develop Newcastle Science City in a manner consistent with our agreed strategy
• We must ensure institutional delivery of the three societal challenge themes
• We need to secure and exploit intellectual property assets
Priorities
Key performance indicators
Risks !
GoodThe proportion of staff contributing to at least one theme is reflected in growing research awards and income per academic FTE, increased publications and events, and also increased teaching modules relevant to each theme.
The themes provided material for 68 of the 117 case studies for the University’s submission to the Research Excellence Framework.
The University continues to pursue new business opportunities arising from the themes.
Media coverage of all three themes remains very positive.
Left: Professor Phil Taylor, Director of Newcastle University Institute for Sustainability at The Core on the Science Central site.
19

Progress during the past year
Societal challenge themes are a key part of the University’s strategic development and are a clear demonstration of our vision as a world-class civic university with a global reputation for excellence. Each of our three chosen societal challenge themes: ageing, social renewal and sustainability is led by a nominated Faculty Pro-Vice-Chancellor on behalf of the University supported by a Director and a small cross-faculty institute. Each theme is described in more detail below, together with some of the key highlights from the past year.
Two initiatives common to all three themes were the award of Honorary degrees to exemplars in these chosen themes and the visibility of our activity at the 2013 party political conferences. We were
pleased to award Honorary degrees to Lord Stewart Sutherland (ageing), Lord Peter Melchett (sustainability) and Sir Michael Marmot (social renewal). We gave presentations on ageing at the Conservative conference, sustainability at the Liberal Democrat conference and social renewal at the Labour conference – all were well received. All three themes have now won the Queen’s Anniversary Prize for Higher Education.
Ageing
The Newcastle University Institute for Ageing is our response to the societal challenge of ageing. It aims to answer the question ‘how to live better, for longer’ by seeking new ways to make the most of the extensive opportunities associated with increasing human longevity, while at the same time solving some of the problems. Our work focuses on three key, interlinked strands of activity:
• influencing ageing by understanding its causes
• understanding and ameliorating conditions associated with ageing
• engagement, impact and innovation
Highlights during the past year included:
• funding won to create a web-based resource to support the exchange of evidence and practical knowledge to people with dementia, their families, and professionals
• the next generation of wearable computing, Google Glass, was trialled for the first time to evaluate its potential to help people with Parkinson’s disease retain their independence for longer. The next stage of the project will involve using the technology to provide discreet prompts linked to typical behaviour of Parkinson’s, such as reminding the person to speak up, or take medication
• our researchers found that damaged proteins in cells could be used to predict and treat premature ageing
Lord Stewart Sutherland, one of the country’s leading academics in the field of ageing, was awarded an Honorary Doctor of Civil Law.
Professor Ian McKeith leads research that resulted in the first diagnosis and treatment of dementia with Lewy bodies (DLB).
20

Social renewal
The Newcastle University Institute for Social Renewal is the University’s response to the challenges facing society today. By bringing together our research with a social purpose we can make a difference to how individuals and communities thrive in times of rapid transformational change. Our research strengths span many disciplines, from history to new business models, from film and media to geography, from health inequalities to legislative review, and findings are used to inform, influence and involve a variety of sectors of society. The 10 sub-themes are: arts and culture in social renewal; citizenship; digital innovation; enterprise in society; health and inequality; learning for change; the past in the present; people place and
community; social justice and injustice; and wellbeing and resilience.
Highlights during the past year included:
• the University was awarded the Queen’s Anniversary Prize for our work on ‘Places of Possibility: towards sustainable rural economies and societies’ led by the Centre for Rural Economy and including work from across the University
• Professor Sugata Mitra won the internationally renowned TED Prize which has been used to develop Self-Organized Learning Environments (SOLEs) in India and in North East England
• we commissioned film-maker David Campbell to make five short films to capture the stories of asylum seekers and refugees and their experience of finding ‘a sense of belonging’ as they made a home for themselves in the North East
• we organised a public exhibition and ‘city conversation’ on the theme of ‘Newcastle City Futures: People, Place and Change’, which traced the development of Newcastle since 1945 and looked at how the shape and look of the city might develop in the future. This has led to further work between the University and the City Council to develop a Future Cities initiative
Sustainability
The Newcastle University Institute for Sustainability co-ordinates research across traditional discipline boundaries to deliver practical, engaged solutions to real-world issues, under the banner of ‘Enough, for all, forever’. We draw upon our areas of established research excellence and the experience of collaborating partners to make an internationally leading contribution to four global research challenges in the field of sustainability.
• Energy: how to produce energy in an environmentally friendly and sustainable way
• Smart grids and energy storage: how to store renewable energy so that it is released at a time when consumers need it
• Transport (road, rail and marine): Newcastle University has received more transport-related funding than any other university in Europe
• Water: improving waste treatment and access to clean water, as well as predicting future climate change
These challenges have been selected because they are globally important, fit with our areas of research excellence and are contextually relevant to regional, national and international communities. Highlights during the past year included:
• at Cockle Park Farm, industrial funding was secured to undertake a cutting-edge, low-carbon project as well as to optimise its anaerobic digestion facility. Nafferton Farm saw the development of an innovative research platform, which brings together world-class expertise in different fields to investigate multifunctional landscape design
• the transformation of the Science Central site is progressing well with the first building, The Core, due to open in November 2014
• we appointed architects for our £58m Urban Sciences building. This new centre will combine digital ingenuity and sustainability research with social innovation to lead advances in the development of future or ‘smart’ cities
• a £2m grid-scale energy storage test bed is being built in the heart of Newcastle City Centre, on the Science Central site. The test bed, which will be integrated with a full-scale Smart Grid on the site, is the first of its kind in the UK
21

‘Top 1% in the world, QS World University Rankings 2014–15’
22
• Develop the public understanding of Newcastle as a world-class civic university
• Position Newcastle as a recognised leader in the social, cultural and economic development of the North East of England
• Attain national and international recognition for the University as a leading institution in respect of the three societal challenge themes
• Develop the public profile of Newcastle as a City of Science
• Develop and maintain good relations with stakeholders, alumni and the wider public
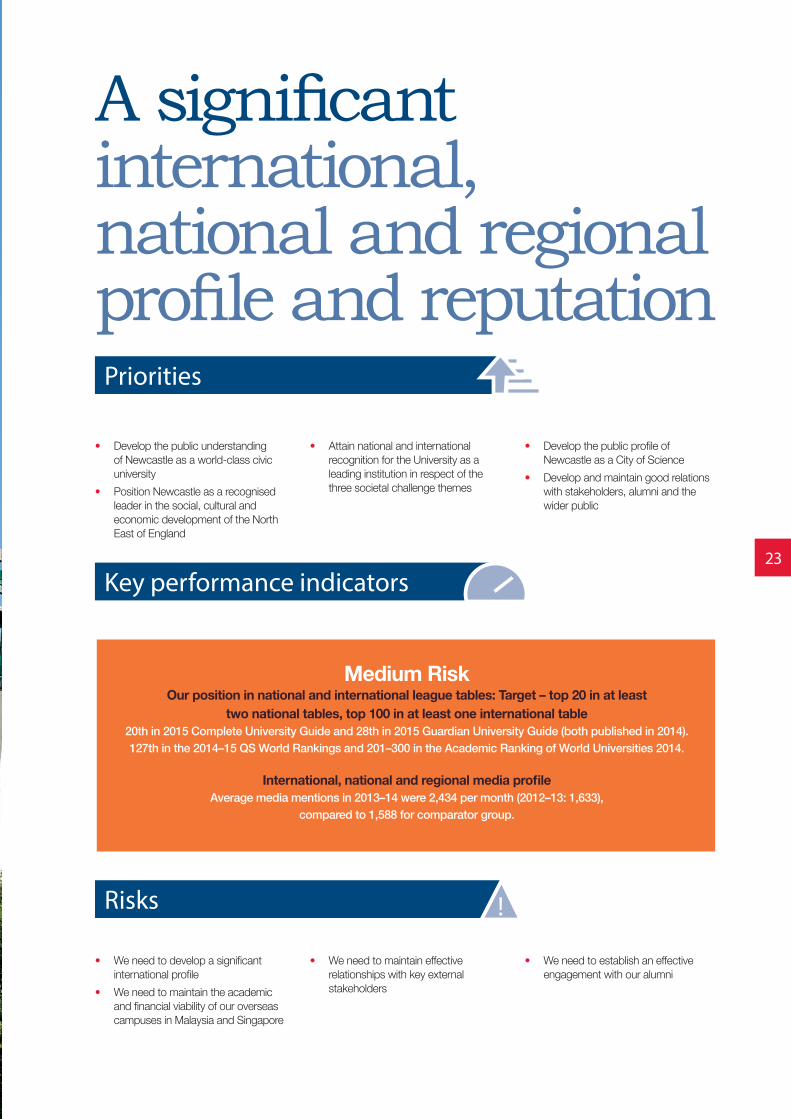
A significant international, national and regional profile and reputation
• We need to develop a significant international profile
• We need to maintain the academic and financial viability of our overseas campuses in Malaysia and Singapore
• We need to maintain effective relationships with key external stakeholders
• We need to establish an effective engagement with our alumni
Priorities
Key performance indicators
Risks !
Medium Risk Our position in national and international league tables: Target – top 20 in at least
two national tables, top 100 in at least one international table 20th in 2015 Complete University Guide and 28th in 2015 Guardian University Guide (both published in 2014).127th in the 2014–15 QS World Rankings and 201–300 in the Academic Ranking of World Universities 2014.
International, national and regional media profileAverage media mentions in 2013–14 were 2,434 per month (2012–13: 1,633),
compared to 1,588 for comparator group.
23

Progress during the past year
Our engagement with schools remains a priority, and the number we work with increases year on year. We continue to lead on the HEFCE-funded Realising Opportunities project (involving 15 institutions), which supports the progression of able young people from under-represented groups to research-intensive universities. Our Teachers’ Toolkit is a searchable online resource for teachers, providing everything we offer for schools and colleges, in one place. Events, projects and resources for use in the classroom, including interactive exercises, images and videos, all developed by University staff, can be accessed through the Toolkit. A new resource available in the Teachers’ Toolkit this year explores the First World War legacy through the lens of the 1914 Christmas truces. The resources, designed by University academics in consultation with teachers, emphasise the truces as a moment of common humanity and a counterpoint to the militarism of the time, and have been very well received by schools, churches and civic institutions around the country. The project is part of a programme of activity commemorating the legacy of Newcastle University awarding Martin Luther King an Honorary degree in 1967.
The quality and diversity of the University’s programme of cultural activity continues to grow and we have supported a number of key partnership projects in the last 12 months. The ‘Hatton Future’ fundraising campaign was launched at the Hatton Gallery in November 2013. This ambitious project will transform the Hatton Gallery into a vibrant gallery space, with a new gallery for the iconic Schwitters’ Merzbarn Wall, a dedicated learning space, and flexible facilities to display the distinctive permanent collection and deliver a high-quality creative programme engaging both public and academic audiences.
We became the first university to be made a member of Investing in Children, a national organisation concerned with the human rights of children and young people, in recognition of our work in consulting young people. We established and donated a collection of ‘must-have reads’ to a new community-run library in the city and through a range of staff and student projects, we furthered our work with local communities on growing food and eating healthily.
Our student-led engagement projects continue to thrive. Our Street Law Ambassadors are undergraduate law students, who deliver awareness sessions to groups of young people on the legal system and how it affects them. In the last year, they have worked with 230 young people, through schools, youth groups and youth-focused criminal justice agencies.
The University’s Street Scientists, a group of trained students who bring science to life though the medium of street performance, delivered thousands of science-based interactions with the public, at a range of events and festivals, and within public spaces such as shopping centres.
Our support for students exploring employability continues to be of value, with 797 students engaging in our employment schemes and over 500 students undertaking a Career Development module or a module in Enterprise, Entrepreneurship and Employability. Rise Up, our enterprise support service for students, has supported 33 start-ups, creating 44 jobs in the past year.
It was an exceptional year for public engagement with science at the University, in part due to our hosting of the British Science Festival. Direct visitor
expenditure during the Festival was in the region of £250,000 and the total advertising equivalent ratio of UK print and broadcast that the Festival attracted was £1,243,808. A range of projects showcased our excellence in science, including a 44-page, newsprint comic of entirely original artwork, commissioned as part of our Festival celebrations. Asteroid Belter: The Newcastle Science Comic aimed to put University research into the hands of children in a way that is meaningful and inspiring and was a unique collaboration between 76 artists, writers and scientists. 10,000 copies of Asteroid Belter have been distributed across the North East region and over 2,500 people have accessed the free online version.
The University hosted its first academic conference overseas at its NUMed campus in Malaysia. Aimed at raising awareness of our South East Asian presence and our world-class strengths in translational medicine, the academic conference attracted researchers and practitioners from Malaysia, Singapore and Indonesia. Plans are underway to stage similar conferences in 2015.
24
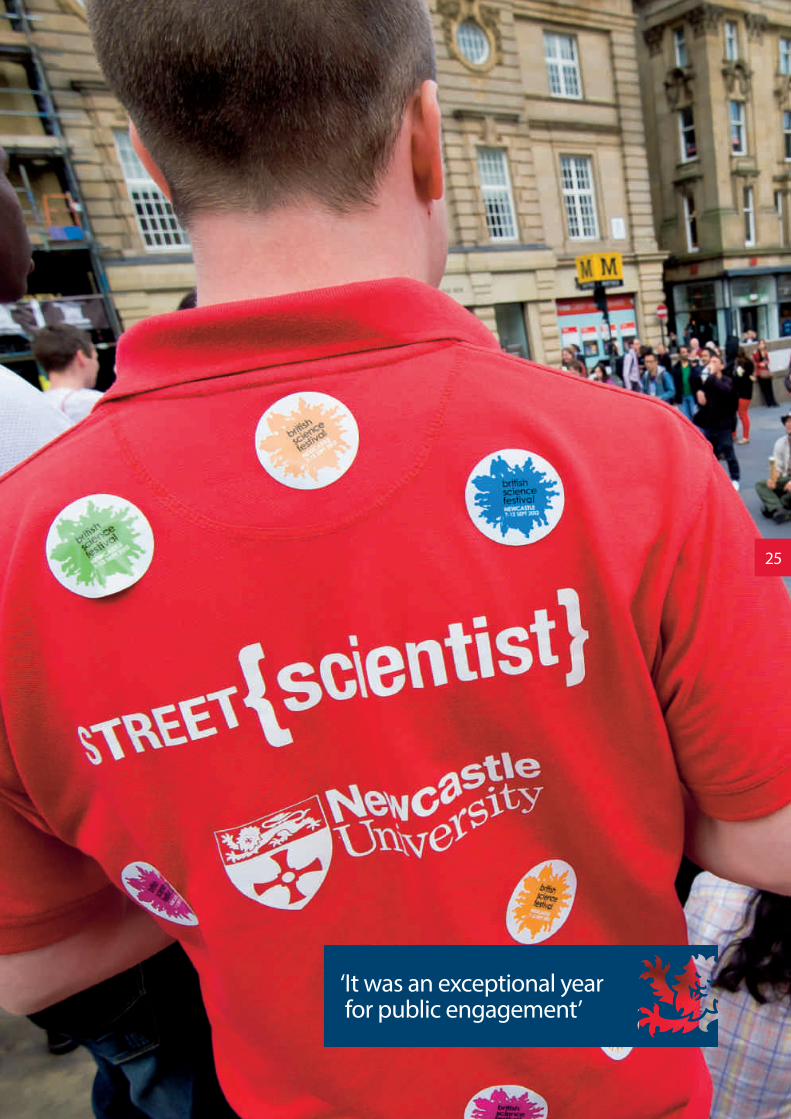
‘It was an exceptional year for public engagement’
25
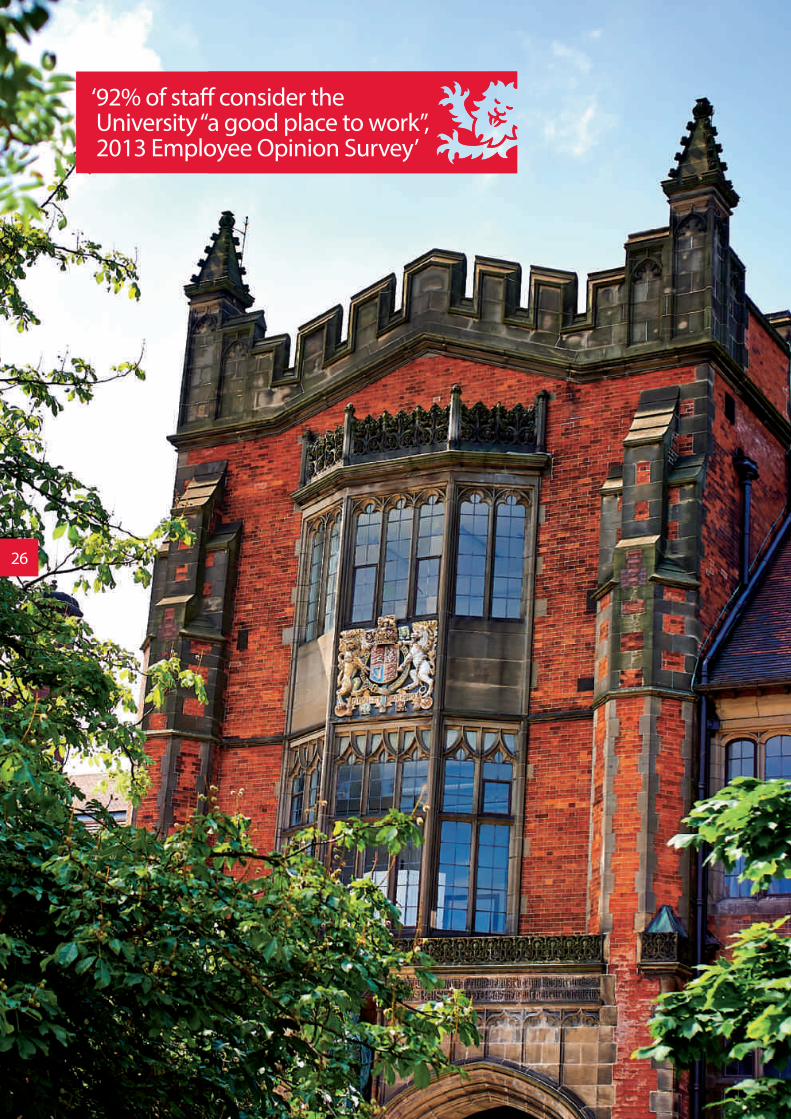
‘92% of staff consider the University “a good place to work”, 2013 Employee Opinion Survey’
26

• Create capacity for strategic development by achieving an average annual historical cost surplus of at least 4% of income, with a minimum of 2% in any financial year
• Maintain a robust balance sheet with sufficient cash reserves to meet our financial obligations
• Deliver value for money in all our activities
• Use the University’s cash reserves and, if necessary, borrowing capacity, to invest in academic and student experience to enhance research quality and reputation, teaching quality and student satisfaction
• Improve our market share of income within the Russell Group
• Provide enterprise resource planning services which are top quartile in higher education and which meet our legal and ethical obligations
Financial and environmental sustainability
• We need to maintain financial viability and in particular a financially robust pensions provision
• We need to meet home and international student recruitment targets
• We need to recruit, develop, retain and reward staff of an appropriate calibre
• We need to manage the University in keeping with the ethos of environmental sustainability
• We need to maintain the estate as functionally suitable and have an appropriate information strategy and control of data
• We must ensure proper conduct of business and be able to respond to severe business disruption events
Priorities
Key performance indicators Risks !
Good Net surplus: Target – 4% of income with a
minimum of 2% in any one year 6.9% in 2013–14. Average of last five years is 4.9%.
Staff costs: Target – ≤ 55% of incomeA significant sustainability measure. 52% in 2013–14.
Net cash balances: Target – > £50mNet cash at 31 July 2014 was £129.7m.
Overall staff satisfaction: Target – staff satisfaction ≥ 90%In the 2013 Employee Opinion Survey,
92% of staff considered the University ‘a good place to work’.
Infrastructure Investment: Target – >3% of insurance replacement value3.1% in 2013–14 confirming commitment to the estate.
Functional suitability of the estate: Target – > 85%recorded as class 1 or 2 in Estates Management Statistics
2013–14, 87%. 2012–13, 84%.
Percentage of waste recycled: Target – ≥ 92%general waste recycled in any one year, with a minimum of 90%
2013–14, 96%. 2012–13, 94%.
CO₂ emissions: Target – decreasing kg CO₂ per m²gross internal areas (non-residential and residential)
2012–13, 98. 2011–12, 103.
27
Council confirms that it has reasonable expectation that the University has adequate resources to continue in operation for the foreseeable future. For this reason, it continues to adopt the going concern basis for preparing the accounts. In reaching this conclusion, it has reviewed the sustainability of the University and is satisfied that the strategies, plans and processes in place will help the University move towards the achievement of its strategy. In particular, it is satisfied that
academic strategies take account of the environment in which the University is operating as an institution and are financially sustainable.
The following are the key elements that give Council assurance in this area:
• it regularly reviews the University’s performance using a number of key performance indicators in areas which are relevant to institutional sustainability
• it has agreed a long-term target EBITDA margin of 6% of income (with a minimum of 4% in any one year) to reflect the need to generate cash to manage the University now and in the future
• it regularly reviews the University’s strategic risk register, which is summarised below, and is assisted in this process by Audit Committee
Going concern
Financial sustainability is discussed in more detail in the Financial Review (pages 35 to 38). In summary, 2013–14 was an excellent year with a total surplus of £30.3m compared to £18.3m in 2012–13. Net income grew by 8% from £405.3m to £438.5m with significant increases in fee income, as a result of the new funding arrangements, and research grants. In contrast, total expenditure increased by 7.9% from £381.8m (excluding exceptional item)to £411.8m, reflecting the investment in staff and facilities to successfully deliver the increased volumes of students and research activity.
At 31 July 2014 the University held gross cash and short-term deposits totalling £167.9m (2013: £143.3m), the equivalent of five months’ (2013: five) recurrent total expenditure. These balances will decline in future years as the University fulfils its commitment to reinvest in the academic environment and student experience. Loan balances, which relate solely to property, were £14.8m, a decrease of £1.0m in the year relating to the repayments of fixed term loans which are due to be repaid by 2029. The Malaysian campus finance lease was brought onto the balance sheet during the year creating a liability of £24.9m.
Significant improvements have been made across a range of environmental sustainability objectives. On sustainable travel, the number of single occupancy car journeys by staff to work is down from 40% in 2004 to 16.5% in 2014, saving circa 2,300 tonnes CO2 to date. Funding from ‘Go Smarter to Work’ has delivered a wide range of engagement opportunities including cycle training, free bicycle MOTs by Dr Bike, and Nordic walking sessions. We have continued to expand our Electric Vehicle (EV) fleet, and have established a new EV taxi contract for business travel. Progress in this area has been recognised by the Green Gown Awards 2014 where the University is shortlisted in the Carbon Reduction category.
A recycling rate of over 90% has been maintained since 2010. A collaborative procurement exercise with the NHS for clinical waste collection has saved £35,000 in the 2013–14 financial year. Further joint procurement for general waste and recycling has been initiated with local universities, which will lead to further cost and efficiency savings.
We have continued to invest in energy efficiency projects; conversion of the heating system at Windsor Terrace accommodation from electrical storage to a gas-heated wet system is saving circa £31,000 and 180 tonnes of CO2 per annum.
Our continuous improvement resulted in retained certification to ISO 14001 and EcoCampus Platinum for our Environmental Management System following a week-long external audit.
Contributions of staff and students towards the University’s sustainability objectives were celebrated in the annual Environment Awards. These included the ‘Big Clear Out’ initiative, which donated 8 tonnes of clothing and 1 tonne of food from student accommodation to local charities. This initiative has since also been shortlisted for a Green Gown award in the Social Responsibility category. Ten catering outlets now have Bronze Food for Life Certification and a new food waste contract has ensured that catering food waste is diverted from landfill and processed via anaerobic digestion.
We are proud to have been awarded a Green Gown Highly Commended award for our smartworking project; improved space efficiency following the relocation of the Estate Support Service and a change in culture and working practices has reduced annual operating costs by at least £57,500 and carbon dioxide emissions by over 46 tonnes of CO2 per annum.
Progress during the past year
Professor Chris BrinkVice-Chancellor
28

Charity status and public benefit statementNewcastle University is an exempt charity under the terms of the Charities Act 2011. In developing and overseeing the University’s strategy and activities, Council has had due regard to the Charity Commission’s guidance on the reporting of public benefit. It also is aware that, because the University is charging high fees, it must make provision for those from lower income backgrounds to have the opportunity to benefit from the services provided. The principal beneficiaries of the University’s services are our students and the public at large.
The Higher Education Funding Council for England (HEFCE) is the principal regulator for most English higher education institutions under the Charities Act 2011 and is the regulator for this University.
Our statutes define the object of the University as ‘for the public benefit, to advance education, learning and research’.
Public benefit is embedded in our strategic aims and objectives set out in Vision 2021: A World-class Civic University. The University takes seriously its commitment to ensure that it satisfies the Charity Commission’s public benefit test that there must be identifiable benefits and the opportunity to benefit must not be unreasonably restricted. We have a range of schemes to encourage participation in our academic programmes by students from under-represented socio-economic groups and those from low income households.
In 2013–14, 1,510 first-year UK and EU undergraduates with low income or widening participation backgrounds, with household income at or below £25,000 per annum or from a designated under-represented group, were awarded scholarships by the University. This constituted 32.7% of our 4,611 2013 full-time home (UK and EU) undergraduate entrants, a significant increase over the 21.8% in the previous year. The eligible students were awarded Opportunity, Access or Promise Scholarships, the first of which were part-funded for those from England by the government through the National Scholarships Scheme.
We alert all prospective and current students to the financial support opportunities, through our website, brochures, talks, workshops, mail shots, student newspaper, e-mail, Twitter, and plasma screen reminders throughout the year. In 2013–14 the University provided £3.4m in means-tested scholarships to support new entrants who may otherwise have been unable to afford the costs of going to university. We also paid a further £3.5m to support 2,487 students continuing their studies. The 2013–14 UK undergraduate financial support of £6.9m
for 3,634 undergraduates represents an increase of £1.2m compared to 2012-13.
Our bursary and scholarship schemes have been reviewed and revised for students entering from 2013, and we have committed more than £35m through our Access Agreement to student financial support over the next five years.
During 2013–14 we awarded more than 7,000 undergraduate and postgraduate degrees.
We are the largest research university in the North East. During the calendar year 2013 our academic staff published 4,130 research articles, books, book chapters and conference proceedings, very similar to the 4,124 figure in 2012. Our total research income in 2013–14 was £102.0m.
To support the charitable work of the University, we received £5.0m of charitable donations during 2013–14. We receive funding from a wide range of benefactors including many of our alumni and we are grateful for their support.
The University expects that useful knowledge acquired through research will be disseminated to the public and others able to benefit from such research. The University normally expects that any private (non-charitable) benefit will be legitimately incidental to the achievement of the University’s charitable aims for public benefit. The terms and conditions of all externally funded research activity is assessed prior to acceptance in terms of the public benefit test for charitable purpose.
More information on the work of the University and the way it fulfils its charitable purpose is included in this review and on our website www.ncl.ac.uk
During 2013–14 we awarded more than 7,000 undergraduate
and postgraduate degrees.
29

30

Total registered students as at 1 December 2013 were 22,874, a 7% increase compared with 1 December 2012. Numbers taught overseas increased by 39%. Following a very buoyant year for applications, undergraduate new intake increased by 16% from 5,226 to 6,063 year on year, postgraduate taught increased by 13% from 2,916 to 3,304 and postgraduate research increased by 7% from 570 to 612.
Students
Operational review for the year ended 31 July 2014
Total students at 1 December 2013 2012 GrowthFull time Part time Total Total %
UndergraduateHome and EU 13,842 48 13,890 13,349 4%Overseas 2,012 5 2,017 1,726 17%Total 15,854 53 15,907 15,075 6%
PostgraduateHome and EU 1,834 1,295 3,129 3,063 2%Overseas 2,670 191 2,861 2,537 13%Total 4,504 1,486 5,990 5,600 7%Taught overseas 972 5 977 703 39%Total 21,330 1,544 22,874 21,378 7%
Over the past four years, since 2009, Home and EU students have increased by 4% from 16,374 to 17,019, and overseas students have increased by 44% from 3,293 to 5,855 with a total headcount increase of 16%.
Undergraduate degrees awarded (Summer 2014) were:
2013–14 2012–13Award Number % of total Number % of totalFirst class 879 21% 763 19%Second class, first division 2,145 51% 2,075 51%Second class, second division 656 15% 704 17%Third class 53 1% 73 2%Other 507 12% 442 11%
Total 4,240 100% 4,057 100%
Note: many of those in the ‘Other’ category are graduates in medicine and dentistry for whom there is no degree classification.
The Newcastle University Medicine Malaysia (NUMed) campus (opened November 2011) delivers undergraduate Medicine (MB BS), a BSc in Biomedical Sciences and a selection of Mastersʼ degrees. In 2013–14, 364 undergraduate students were enrolled at NUMed, and the first MB BS cohort graduated in June 2014.
In collaboration with the Singapore Institute of Technology, the University offers programmes in marine engineering, naval architecture, offshore engineering, mechanical design and manufacturing engineering, chemical engineering, electrical power engineering and food and human nutrition. Additional subject areas, part-time and postgraduate programmes are being considered for future years. In 2013–14 the total number of students was 608.
31

This year has seen a focus on ‘raising the bar’ in terms of our investment in high- quality talent. Overall, full-time equivalent staff increased from 4,853 at 31 July 2013 to 5,081 at 31 July 2014. A key area of investment was in academic staff, increasing over the year by more than 4%. These numbers include 98 full-time equivalent staff employed by our overseas subsidiaries (2013: 84).
Staff costs in 2013–14 were £228.2m, compared to £218.8m in 2012–13. Our long-term objective is to manage staff costs to ensure they remain at approximately 55% of total income (currently 52%). Action will be taken in the coming year to recruit additional staff to ensure we return closer to target.
The major impact on pay growth over the year was the national 1% pay award effective from 1 August 2013. Other factors included incremental progression, contribution-related payments and bonuses and a £300 ex-gratia payment made to over 500 of our lowest paid
employees as part of our programme of action on fair pay.
Newcastle University was successful in achieving accreditation by the Higher Education Academy for our Continuing Professional Development (CPD) scheme designed for all new and existing academic staff. This accreditation assures the quality of the CPD scheme, leading to individual staff recognition against UK Professional Standards, and is open to all staff involved in teaching on Newcastle University degree programmes.
The Athena SWAN Charter recognises commitment to advancing women’s careers in science, technology, engineering, maths and medicine (STEMM) employment in academia. The University achieved re-accreditation of its Bronze award in 2013. At departmental level the Institute of Health and Society and the Institute of Cellular Medicine hold Silver awards and the Institute of Genetic Medicine achieved a Bronze award in 2014. We are awaiting the outcome of
three award applications, and aim to submit a further 10 applications in 2014.
Professor Chris Day, Pro-Vice Chancellor of Medical Sciences and Professor of Liver Medicine, was elected as Vice-President (Clinical) of the Academy of Medical Sciences.
Each year the Merit Awards Committee reviews the performance of professorial staff and recognises those whose performance has been exceptional. This year, for the first time, a new category of Academic Distinction Award has been introduced to reward and recognise the most outstanding professorial contribution. The first recipients of these awards were Professor Waldemar Vollmer and Professor Nikolay Zenkin, both from the Institute of Cell and Molecular Biosciences.
The Royal Society of Chemistry awarded Professor Roger Griffin the George and Christine Sosnovsky Award in Cancer Therapy 2014.
Staff
Sickness absence rates for the University as a whole at 2.0% continue to fall, and are below the higher education sector average (2.8%). The rate varies across staff groups with operational staff being of most concern at a rate of 4.9%. This is, however, a reduction of 2.0% in the last three years. The University continues its proactive approach to staff wellbeing, promoting healthier lifestyles through a range of health and wellbeing campaigns. This work gained external recognition through the achievement of the Gold ‘Better Health at Work’ Award for the University in 2014.
The level of staff and student accident rates reported under Reporting of Injuries, Diseases and Dangerous Occurrences Regulations 2013 (RIDDOR) has decreased during the last 10 years and particularly over the last three years. Improvements in safety performance are due, in part, to the recent initiatives to reduce slips, trips and falls and the sustained focus on health and safety training. Similar improvements are to be noted in the Total Reported Accident Rates for staff and students over this period.
Health, safety and wellbeing
0
10
20
30
40
50
60
2004-‐5
2005-‐6
2006-‐7
2007-‐8
2008-‐9
2009-‐10
2010-‐11
2011-‐12
2012-‐13
2013-‐14
Staff
Students
0
1
2
3
4
5
6
2004-‐5
2005-‐6
2006-‐7
2007-‐8
2008-‐9
2009-‐10
2010-‐11
2011-‐12
2012-‐13
2013-‐14
Staff
Students
Total Reported Accident Rates
Rat
e pe
r 1,0
00 a
t ris
kR
ate
per 1
,000
at r
isk
RIDDOR Accident Rates
32

The University Health and Safety Strategic Action Plan has been agreed with the University Health and Safety Committee and approved by Executive Board and Council. This robust Plan identifies the key
health and safety strategic priorities for the University over five years, commencing in 2013–14. One of the key priority projects during 2013–14 has been the ongoing development of a new incident reporting,
investigation and follow-up process and a new incident database. This project is on target for delivery during 2014–15.
Our estate strategic objectives are to facilitate academic priorities and:
• improve the condition and functional suitability of our buildings• implement the Coherent Campus initiative• ensure effective utilisation of space • deliver full life cycle value for money on all major projects
Our strategy continues to improve the quality and functional suitability of our floor space through investing in maintenance, new build, refurbishment, rationalising the use of floor space and withdrawing from peripheral, less suitable space. We have increased lettings to third parties.
Measure 2009–10 2012–13 Peer Group 2012–13 2013–14Predicted
2014–15
Floor space in condition category A & B 87% 89% 86% (upper quartile) 89% 89%Floor space in functional suitability grade 1 & 2 79% 84% 92% (upper quartile) 87% 89%Net internal area per student FTE (m2) 11.7 11.1 10.5 (lower quartile) 10.2 9.8
Estate
The operational estate area is 208,400m2 (net internal area). We surrendered leases at Close House and Moorbank Botanic Garden and completed disposal of the Bruce Building and Claremont Place. With increased student numbers, space per student FTE has fallen while quality has improved. Currently 95% of our teaching rooms are grade 1 or 2 functional suitability, with frequency of use static against our 60% target.
This year we completed the third phase of refurbishment to the Armstrong Building and the third and final phase of the refurbishment of the Bedson Building, plus the modernisation of the student residences in the Grand Hotel and redevelopment of Cockle Park Farm. Additionally, the conversion of Kensington Terrace and Park Terrace into student residences was virtually complete and the new accommodation was brought into use in September 2014.
We invested £1.2m to improve the student teaching and learning facilities including upgrading of teaching rooms and lecture theatres, refurbishing teaching labs, computer rooms and student-facing areas.
The principal investment in the fifth year of the Coherent Campus initiative involved Campus West landscaping. Additionally, the University made the second and final contribution to a City Council highways improvement scheme for Barras Bridge and Haymarket to improve staff and student safety and connectivity through better crossings and pedestrian areas. Smaller schemes included the upgrading of signage and the continuation of improvements to cycle parking.
Other projects include the development of a hyperbaric chamber at the Neptune Yard on the River Tyne, the provision of a new boiler house for Castle Leazes Halls
of Residence, and the installation of an external lift to increase accessibility to Merz Court. Additionally, a feasibility study was undertaken to develop options for the redevelopment of a 1,295-bed student residence at Richardson Road and this project is being progressed for phased completion from September 2016. A major strategic development through the creation of an Urban Sciences building at Science Central was approved by Council and is in early design stages.
Significant investment is planned for the future. Facilities expansion, significant upgrades and/or new builds are planned to provide high-quality learning, teaching and research spaces (including investment in student accommodation) to ensure that an excellent student and staff experience is maintained or enhanced.
33
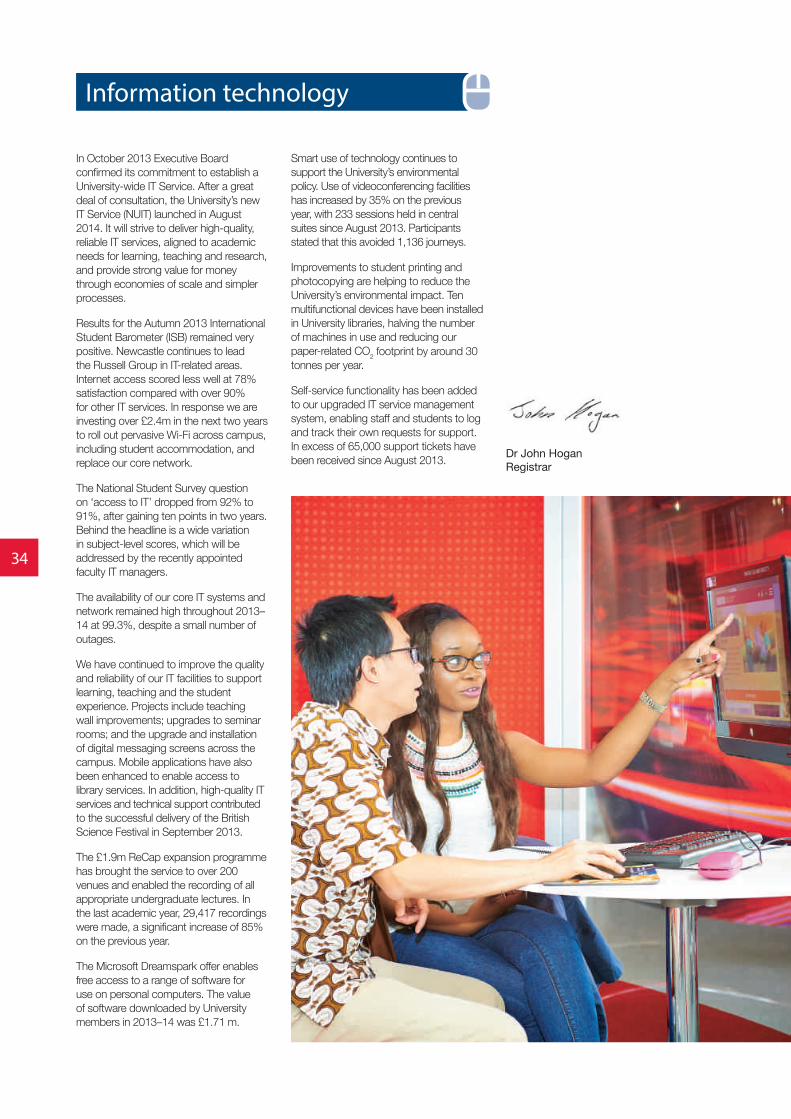
In October 2013 Executive Board confirmed its commitment to establish a University-wide IT Service. After a great deal of consultation, the University’s new IT Service (NUIT) launched in August 2014. It will strive to deliver high-quality, reliable IT services, aligned to academic needs for learning, teaching and research, and provide strong value for money through economies of scale and simpler processes.
Results for the Autumn 2013 International Student Barometer (ISB) remained very positive. Newcastle continues to lead the Russell Group in IT-related areas. Internet access scored less well at 78% satisfaction compared with over 90% for other IT services. In response we are investing over £2.4m in the next two years to roll out pervasive Wi-Fi across campus, including student accommodation, and replace our core network.
The National Student Survey question on ‘access to IT’ dropped from 92% to 91%, after gaining ten points in two years. Behind the headline is a wide variation in subject-level scores, which will be addressed by the recently appointed faculty IT managers.
The availability of our core IT systems and network remained high throughout 2013–14 at 99.3%, despite a small number of outages.
We have continued to improve the quality and reliability of our IT facilities to support learning, teaching and the student experience. Projects include teaching wall improvements; upgrades to seminar rooms; and the upgrade and installation of digital messaging screens across the campus. Mobile applications have also been enhanced to enable access to library services. In addition, high-quality IT services and technical support contributed to the successful delivery of the British Science Festival in September 2013.
The £1.9m ReCap expansion programme has brought the service to over 200 venues and enabled the recording of all appropriate undergraduate lectures. In the last academic year, 29,417 recordings were made, a significant increase of 85% on the previous year.
The Microsoft Dreamspark offer enables free access to a range of software for use on personal computers. The value of software downloaded by University members in 2013–14 was £1.71 m.
Smart use of technology continues to support the University’s environmental policy. Use of videoconferencing facilities has increased by 35% on the previous year, with 233 sessions held in central suites since August 2013. Participants stated that this avoided 1,136 journeys.
Improvements to student printing and photocopying are helping to reduce the University’s environmental impact. Ten multifunctional devices have been installed in University libraries, halving the number of machines in use and reducing our paper-related CO2 footprint by around 30 tonnes per year.
Self-service functionality has been added to our upgraded IT service management system, enabling staff and students to log and track their own requests for support. In excess of 65,000 support tickets have been received since August 2013.
Information technology
Dr John HoganRegistrar
34

Introduction
Financial review
2013–14 was a very good year for Newcastle University. Strong recruitment, the impact of the new fees and funding regime, buoyant research income (with improving market share) and a continued focus on efficiency have all contributed to a strong financial and academic performance. Pipeline indicators suggest this performance will be maintained during 2014–15 and we are reasonably optimistic for 2015–16 despite the significant challenge presented by the Universities Superannuation Scheme (USS) deficit. This has enabled the University to reflect on its plans for the future and to increase significantly its planned investment in academic staff, student experience, research and IT infrastructure and new buildings.
The total surplus in 2013–14 was £30.3m (6.9% of income) compared to £18.3m (4.5% of income) in 2012–13. Excluding the exceptional non-cash charge of £7.5m to the income and expenditure account in 2012–13, relating to an impairment of the freehold value of our share of the Science Central site, the underlying surplus increased by 17% from £25.8m to £30.3m. The average surplus in the last five years has been 4.9% of income, slightly better than our target to achieve an average surplus of 4% of income.
Net funds increased from £128.8m to £129.7m, reflecting the very strong surplus but offset by the impact of the finance lease relating to the Malaysian campus. This is considerably healthier than the baseline position of 2002 when net cash balances were only £18.2m. Our financial and academic strength will ensure the University is well placed to flourish in future years and we are committed to ambitious plans to invest in our estate, our academic staff and our supporting infrastructure to develop the University.
Net income grew by 8% in 2013–14 from £405.3m to £438.5m with significant increases in fee income, as a result of the new funding arrangements, and research grants. Total expenditure increased by 7.9% from £381.8m (excluding exceptional item) to £411.8m, reflecting our investment in staff and facilities to support the growth in student numbers and the increase in research activity.
0
5
10
15
20
25
30
35
04-‐05 05-‐06 06-‐07 07-‐08 08-‐09 09-‐10 10-‐11 11-‐12 12-‐13 13-‐14
University Surplus (£m)
0
20
40
60
80
100
120
140
2005 2006 2007 2008 2009 2010 2011 2012 2013 2014
as at 3
1 July
Net cash balance
35

Income
Net income grew by 8% from £405.3m to £438.5m. Over the past four years, income has increased from £372.5m to £438.5m, an average growth of 4% per annum. Key income streams are summarised below.
Funding Council grants reduced by 15% year on year reflecting the new funding regime for UK and EU undergraduate students. This was a slightly worse decline than we had expected due to in-year reductions in HEFCE grants as a result of total student numbers being higher than expected. Funding Council grants, as a percentage of income, declined year on year from 23.9% to 18.7% and are forecast to reduce to circa 16% in 2014–15.
Academic fees from full-time home and EU students increased from £74.1m to £97.1m, reflecting the significantly higher new student intake in 2013, the continuing impact of the new £9,000 pa undergraduate tuition fee and a shift in the pattern of student financial support from fee waivers to bursary payments. Income for overseas students taught in the UK increased from £52.3m to £63.9m due to a significant increase in both undergraduate and postgraduate students. Fee income at our overseas campuses increased from £9.5m to £12.2m due to a strong fifth year of recruitment in Malaysia and the introduction of our electrical power engineering degree in Singapore.
Research income in 2013–14 was £102.0m, an increase of £8.6m (9%) on 2012–13. Income from UK Research Councils increased by £3.6m (13%) to £30.9m, which reflects the high level of new awards in recent years. UK government and health authority research income increased by £1.5m (8%) to £20.1m, UK industry research income increased by £0.8m (20%) to £5.0m, research income from non-EU organisations increased by £0.7m (16%) to £5.0m, and research income from EU government sources increased by £0.3m (3%) to £12.2m.
Our joint venture with INTO University Partnerships Ltd continued to make good progress in 2013–14 recording 13% growth in income. Residences, catering and conference income grew by 10% reflecting very high occupancy levels, the reopening of the Grand Hotel as student accommodation, and strong growth in our catering business. Interest receivable increased from £3.9m to £5.1m, primarily due to an increase in the pension finance credit required by FRS17.
Other
Endowment income and interest
Health authorities
Residences, catering and conferences
Research income
Academic fees
Funding councils
Funding Council Income as % of Total Income
40
35
30
25
20
15
10
07–08 08–09 09–10 10–11 11–12 12–13 13–14 14–15 15–16
36

Expenditure
Total expenditure, excluding exceptional items, increased by 7.9% from £381.8m (excluding exceptional item) to £411.8m. Over the past four years, expenditure has grown from £352.6m to £411.8m, an average increase of 4% per annum. Key expenditure streams are summarised below:
Staff costs increased by 4% from £218.8m to £228.2m and represented 52% of net income (2012–13: 54%). This is slightly lower than the University’s long-term target of 55% of net income and we are actively recruiting additional academic staff to maintain the staff–student ratio as student numbers increase. UK staff costs increased by 4% from £215.6m to £224.3m and non-UK costs increased from £3.2m to £3.9m, due to the continued expansion of our campuses in Malaysia and Singapore. Our worldwide headcount increased by 4.7% during the year (UK 4.5%, non-UK 16.7%); UK non-clinical staff received a 1% pay rise from 1 August 2013 (there was no general increase for clinical staff) and, as required by FRS17, there was an additional charge of £1.7m for RBP pension costs. Offsetting this, recruitment of new academic and research staff reduced average pay rates due to the impact of incremental progression scales.
Other operating expenses increased by £17.2m (11%) from £152.2m to £169.4m. Direct research costs increased by £2.7m (8%) reflecting the higher levels of research activity. Library materials increased by £0.6m to £5.0m and non-research equipment expenditure increased by £5.2m as we invested in additional facilities to respond to the growth in student numbers. International agents’ fees increased by £0.7m in line with the increase in student numbers. Operating lease rental costs increased by £1.2m to £8.0m due to a provision for the outstanding costs of an onerous lease. Catering and residence running costs increased by £1.3m to £10.5m in line with the increase in activity. Other operating costs in our overseas subsidiaries increased by £0.7m reflecting increased student numbers and levels of non-teaching activity.
Depreciation increased by £1.7m from £9.9m to £11.6m due to the addition of the Malaysian campus finance lease and higher levels of capital expenditure on research equipment during the year.
Pensions
An actuarial loss of £26.4m was recognised in the Statement of Consolidated Total Recognised Gains and Losses, as required by FRS17 (2012–13: a gain of £15.8m). This relates to the RBP, the local pension scheme for support staff, and the basis for the loss is fully documented in note 31 to the accounts. It is primarily due to the reduction in the real discount rate together with asset returns during the year being slightly lower than target, updated membership numbers and changes to expected mortality. The most recent triennial valuation of the RBP as at 1 August 2013 revealed a surplus of £9.8m relative to the technical provisions (6% of liabilities).
The triennial valuation of the Universities Superannuation Scheme (USS) at 31 March 2011 revealed a deficit of £2.9bn relative to the technical provisions (8% of liabilities). The valuation as at 31 March 2014 is expected to show a significantly worse deficit. Universities UK has proposed significant reform of the USS benefit structure to mitigate the impact of this deficit and formal consultations will take place during the coming year. Newcastle University accounts for approximately 1.8% of the total active membership of the USS.
Other
Research grants and contracts
Residences, catering and conferences
Premises
Administrative and central services
Academic services
Academic schools
37

Balance sheet
University capital expenditure in the year was £46.0m, an increase of £24.7m on the previous year. This included £24.1m in relation to the Malaysian campus following the inception of the finance lease during the year. The main building projects during the year were the development of student accommodation on the site of the former University administration offices in Kensington Terrace and Park Terrace (£9.2m), the continued programme to restore the historic Armstrong Building to its former glory (£1.6m), replacement of the Castle Leazes Boilerhouse (£1.4m), and refurbishment of Cockle Park Farm (£0.9m). Expenditure on equipment was
£6.0m, compared to £3.8m in 2012–13 reflecting the focus on developing our research capacity. Capital expenditure (excluding the Malaysian campus) was less than the forecast included in last year’s Operating and Financial Review due to slippage of some of our projects.
There were £17.5m of outstanding capital commitments as at 31 July 2014 (2013: £17.1m) with a further £69.4m authorised but not contracted (2013: £10.9m). Our current financial plans indicate £43m capital expenditure in 2014–15, comprising £23m non-residential development on the main campus,
£8m work on Science Central, £1m residential developments, £2m IT infrastructure and £9m equipment. The key projects proposed for future years are construction of the University’s first academic building on the Science Central site, completion of the Armstrong Building project and redevelopment of the Richardson Road student residences.
Net cash balances increased from £128.8m to £129.7m reflecting the strong surplus recorded in 2013–14 offset by the inclusion of the Malaysian campus finance lease.
Treasury
At 31 July 2014, the University had £167.9m cash and short-term cash investments (2013: £143.3m). The level of deposits fluctuates throughout the year with materially higher cash balances between September and December and between May and July due to the timing of tuition fees and HEFCE grants. This volatility is increasing as we become more dependent on receipts from the Student Loans Company. Although this does not create short-term liquidity issues for the University, it does restrict our flexibility on optimising investment returns. Our investments are controlled by our counterparty policy, which is agreed
by Finance Committee with advice from brokers. We only place our money with UK banks and building societies which we consider to be secure based on external benchmarks. A wide portfolio of banks is chosen to spread risk, although events in 2007 and 2008 led us to focus on a smaller number of more secure banks. We regularly review our investments and take rapid action if we believe there is any deterioration in risk. Our policy was agreed in full recognition that we may reduce potential interest income to mitigate the high level of risk in the financial services sector.
At 31 July 2014, the University had £57.6m of endowments (2013: £55.2m). Endowments are primarily invested in equities. The University uses Majedie, Baillie Gifford and Black Rock to manage its investments. Finance Committee meets formally with Majedie and Baillie Gifford once a year, and the Executive Director of Finance meets quarterly with them to review progress. In addition, we receive monthly performance reports.
Outlook
We expect continuing strong financial performance in 2014–15, in line with strong recruitment trends – both for home and overseas students.
We expect research income to remain buoyant and to see continued improvement in our overseas operations.
The longer-term picture is one of considerable uncertainty due to the 2015 UK general election and any potential referendum on EU membership. Although there will be inevitable challenges to manage for the University, we also believe the next few years should present significant opportunity.
We have strong cash balances and the opportunity, should we wish, to borrow which will buffer against future political uncertainties.
Richard DaleExecutive Director of Finance
38

Corporate GovernanceNewcastle University endeavours to conduct its business in accordance with the seven principles identified by the Committee on Standards in Public Life (selflessness, integrity, objectivity, accountability, openness, honesty and leadership), and with the guidance to universities from the Committee of University Chairs in its Guide for Members of Higher Education Governing Bodies in the UK.
The University is an independent corporation whose legal status derives
from the Universities of Durham and Newcastle upon Tyne Act 1963 which, with its supporting statutes and schedules, sets out the University’s objectives, powers and framework of governance.
The statutes require the University to have a number of separate bodies, each with clearly defined functions and responsibilities, to oversee and manage its activities. Convocation is a meeting of the alumni and is the body that appoints the Chancellor. Academic Board is a
meeting of all academic and related staff that receives an annual report from the Vice-Chancellor.
The Registrar acts as Secretary of Council and Senate. Any enquiries about the constitution and governance of the University should be addressed to the Registrar. The University maintains a Register of Interests of members of Council and senior officers, which may be consulted by arrangement with the Registrar.
Senate
Senate is the academic authority of the University and draws its membership predominantly from the academic staff and the students of the institution. Its role is to direct and regulate the teaching and research work of the University.
Court
Court is not part of the University’s day-to-day decision-making processes but plays an important and influential role on behalf of the University’s stakeholders. Its membership is representative of the University, the local community and other
organisations with an interest in the work of the University. It meets twice a year to receive a report from the Vice-Chancellor and to discuss any matters relevant to the interests and wellbeing of the University.
Council
Council is the supreme governing body, responsible for the finance, property, investments and general business of the University, and for setting the general strategic direction of the institution. It is also responsible for the University’s system of internal control and for reviewing its effectiveness, including the appropriateness of its arrangements for risk management and value for money. It keeps under regular review the performance of the University and makes use of key performance indicators to assist in this task. A statement of Council’s primary responsibilities is provided below. Council undertakes annual reviews of its effectiveness.
It has a majority of members from outside the University (lay members) including three lay officers; Chair, Vice-Chair and Treasurer. Members also include staff of the University and the student body. None of the lay members receive any payment,
apart from reimbursed expenses, for the work they do for the University. Council normally meets six times each academic year.
Members of Council during 2013–14 were:
Mr Mark I’Anson (Chair) 1
Professor Chris Brink 2
Dr Peter Andras 2
Dr John Appleby 2
Ms Eve Berwin 3
Professor Alan Boddy 2
Mr Neil Braithwaite 1
Professor Vicki Bruce 2
Mr Mike Davison 1
Mr Jonathan Glass 1
Professor Deborah Henderson 2
Ms Jacqui Henderson (Vice-Chair) 1
Mr Robert Hull 1
Mr Stephen Lightley (Treasurer) 1
Mr Calum Mackenzie 3
Mr Jeff McIntosh 1
Mrs Heidi Mottram 1
Mr Simon Pleydell 1
Professor Ella Ritchie 2
Mr Paul Walker 1
Much of the detailed work is routed through Committees of Council. These committees, and in some cases others, are formally constituted as Committees of Council with written terms of reference and specified membership, including a significant proportion of lay members. The decisions of these committees are reported to Council and, where relevant, Senate.
1 Lay member2 Employee of the University3 Student representative
39

Audit Committee
Audit Committee is a committee of Council, comprising three lay members of Council and two additional lay members. It meets five times each year with the University’s internal auditors (and, where relevant, external auditors) in attendance. The Committee reviews the effectiveness of internal control systems by considering detailed reports together with recommendations for improvement, management responses and implementation plans. As part of its annual opinion it also gives assurance about the management and quality of data to HEFCE, HESA and other public bodies. Members during 2013–14 were:
Mr Mike Davison (Chair)Mr Jonathan Glass Mr Robert HullDr Mike Laker Ms Angela Woodburn
Finance Committee
Finance Committee considers and recommends to Council the financial strategy for the University and advises on investments, determines the level of funding to be made available to support the annual budget allocations, approves the accounting policies and considers the financial statements. It also has overall responsibility for ensuring the appropriate management of taxation within the University. Members during 2013–14 were:
Mr Stephen Lightley (Chair)Mr Neil BraithwaiteProfessor Chris BrinkMr Mark I’AnsonMr Jeff McIntoshProfessor Tony Stevenson
Nominations Committee
Nominations Committee makes recommendations to Council in respect of the appointment of lay members of Council, the offices of Chair and Vice-Chair of Council, Honorary Treasurer and members of the Committees of Council. Members during 2013–14 were:
Mr Mark I’Anson (Chair)Professor Chris BrinkSir Michael DarringtonMr Jack JefferyMr Peter JohnsonMr Richard MaudslayMs Claire MorganProfessor Ella Ritchie
Remuneration Committee
Remuneration Committee considers the remuneration and terms and conditions of senior members of staff. Members during 2013–14 were:
Ms Jacqui Henderson (Chair)Mr Mark I’AnsonProfessor Chris BrinkMr Stephen LightleyMr Simon PleydellMs Vicky Wright
£
40

Executive Board
Executive Board is the senior management team of the University and is formally designated as a joint committee of Council and Senate. It keeps under review the University’s strategy and makes recommendations on the development of the strategy to Senate and Council. It develops and regularly reviews the University’s business plan, assesses the risks related to the delivery of the plan, and ensures that appropriate measures are in place to assure the financial sustainability of the University’s activities. Executive Board reports on these matters regularly to Council. Through the monitoring undertaken by its Financial Monitoring and Budget Scrutiny Group and Budget Setting Group, Executive Board is also responsible for the use of resources and financial performance of all budgetary units. It has particular responsibility for value for money.
The principal academic and administrative officer of the University is the Vice-Chancellor, who has general responsibility for maintaining and promoting the efficiency and good order of the University. Under the terms of the formal HEFCE Memorandum of Financial Assurance and Accountability, the Vice-Chancellor is the accountable officer of the University. In that capacity he and the Chair of Council can be summoned to appear before the Public Accounts Committee of the House of Commons. The Vice-Chancellor is also responsible for assuring the quality and accuracy of University data provided to HEFCE, HESA and other public bodies. As Chief Executive of the University, the Vice-Chancellor exercises considerable influence upon the development of institutional strategy, the identification and planning of new developments, and shaping of the institutional ethos. The Deputy Vice-Chancellor, Pro-Vice-Chancellors and senior administrative officers all contribute in various ways to these aspects of the work, but the ultimate responsibility for what is done rests with Council. Members of Executive Board during 2013–14 were:
Professor Chris Brink (Vice-Chancellor)Professor Ella Ritchie (Deputy Vice-Chancellor)Professor Suzanne Cholerton (Pro-Vice-Chancellor – Learning and Teaching)Professor Chris Day (Pro-Vice-Chancellor – Medical Sciences)Professor Charles Harvey (Pro-Vice-Chancellor – Humanities and Social Sciences)Professor Steve Homans (Pro-Vice-Chancellor – Science, Agriculture and Engineering)Professor Tony Stevenson (Pro-Vice-Chancellor – Planning and Resources)Professor Nicholas Wright (Pro-Vice-Chancellor – Research and Innovation)Dr John Hogan (Registrar)Mr Richard Dale (Executive Director of Finance)Mrs Veryan Johnston (Executive Director of Human Resources)
Managing Risk
In common with all organisations we are affected by a number of risk factors, not all of which are wholly within our control. Although some of the risk factors are macroeconomic and likely to affect the performance of the higher education sector as a whole, others are particular to Newcastle University. Some risks may be unknown to us and other risks, currently regarded as immaterial, could turn out to be material. All of them have the potential to impact our income, expenditure, assets and liquidity adversely. We have a defined University-wide risk management process for identifying, evaluating and managing the significant risks faced by the University. A summary of the key strategic risks is presented to each meeting of Council.
!
Council: Statement of Primary Responsibilities
Council is the supreme governing body of the University, subject to the provisions of the University’s Statutes. The primary responsibilities of Council are as follows:
General• to be responsible for ensuring the effective management of the University and to take all final decisions on matters of fundamental
concern, being decisions that have not been delegated to the Vice-Chancellor• to safeguard the good name and values of the University• to contribute to the development of, and approve the mission and strategic vision of, the University, long-term academic and
business plans and key performance indicators, and to ensure that these meet the interests of stakeholders• subject to the powers of Senate, to take such steps as it thinks proper to advance the interests of the University, maintain its
efficiency, and encourage teaching, the pursuit of learning and the conduct of research within it• to ensure that processes are in place to monitor and evaluate the performance and effectiveness of the University against the
plans and approved key performance indicators, which should be, where possible and appropriate, benchmarked against other comparable institutions
41

• to establish processes to monitor and evaluate the performance and effectiveness of Council itself• to delegate authority to the Vice-Chancellor, as Chief Executive, for the academic, corporate, financial, estate and personnel
management of the University, whilst recognising the additional accountability of the Vice-Chancellor to HEFCE. Council’s scheme of delegation shall be kept under regular review
• to make such provision as it thinks fit for the general welfare of students, where appropriate through Senate• to conduct its business in accordance with best practice in higher education corporate governance and with the principles of public
life drawn up by the Committee on Standards in Public Life embracing selflessness, integrity, objectivity, accountability, openness, honesty and leadership
• to ensure procedures are in place for handling internal grievances, whistle-blowing and for managing conflicts of interest
Finance• to be the principal financial and business authority of the University, to ensure that proper books of account are kept, to approve the
annual budget and financial statements, and to have overall responsibility for the University’s assets, property and estate• to ensure the establishment and monitoring of systems of control and accountability, including financial and operational controls and
risk assessment• as part of the financial governance role
◊ to ensure that funds from HEFCE are used only in accordance with the Further and Higher Education Act 1992, the Memorandum of Financial Assurance and Accountability between HEFCE and institutions, and any other conditions that HEFCE may from time to time prescribe
◊ to ensure that reasonable discretion is exercised in the use of public funds and account taken of any relevant guidance on accountability, sustainability or propriety
◊ to be responsible for delivering value for money from public funds, taking into account guidance on good practice
Employment• to appoint, in accordance with the relevant Statutes
◊ the Vice-Chancellor and to put in place suitable arrangements for monitoring his/her performance◊ a Registrar, who is also Secretary to Council, ensuring that there is an appropriate separation in the lines of accountability◊ a Deputy Vice-Chancellor◊ one or more Pro-Vice-Chancellors◊ the Pro-Vice-Chancellors
and in each case to determine the conditions of appointment
• to be the employing authority for all staff in the University. This includes ultimate responsibility for◊ approving the human resources strategy◊ determining the conditions of appointment of the staff of the University, after consultation with Senate when required◊ the welfare of University staff◊ establishing, suspending or abolishing any post in the University, except those posts specifically created by the Statutes, after
consultation with Senate◊ appointing members of staff of the University, on the recommendation of Senate when required
Compliance• to be the University’s legal authority and, as such, to ensure that systems are in place for meeting all of its legal obligations, including
those which relate to health and safety and equal opportunities and which arise from contracts and other legal commitments made in its name
• to ensure that the University complies with any wishes attached to any property, legacy, endowment, bequest or gift in support of the work and welfare of the University
• to ensure that the University’s constitution is followed at all times and that appropriate advice is available to enable this to happen
In accordance with the University’s Statutes, Council is responsible for the administration and management of the affairs of the University and is required to present audited financial statements for each financial year.
Council is responsible for keeping proper accounting records, which disclose with reasonable accuracy at any time the financial position of the University and to enable it to ensure that the financial statements are prepared in accordance with the University’s Statutes, the Statement of Recommended Practice – Accounting for Further and Higher Education Institutions and other relevant accounting standards. In addition, within the terms and conditions of the Memorandum of Financial Assurance and Accountability agreed between HEFCE and the University, Council, through its accountable officer, is required to prepare financial statements for each financial year, which give a true and fair view of the state of affairs of the University and of the surplus or deficit and cash flows for that year.
Responsibilities of Council in the Preparation of the Financial Statements
42

In causing the financial statements to be prepared, Council has ensured that:
• suitable accounting policies are selected and applied consistently• judgements and estimates are made that are reasonable and prudent• applicable accounting standards have been followed, subject to any material departures disclosed and explained in the
financial statements• financial statements are prepared on the going concern basis
Council has taken reasonable steps to:
• ensure that funds from HEFCE are used only for the purposes for which they have been given and in accordance with the Memorandum of Financial Assurance and Accountability with the Funding Council and any other conditions which the Funding Council may from time to time prescribe• ensure that there are appropriate financial and management controls in place to safeguard public funds and funds from
other sources• safeguard the assets of the University and prevent and detect fraud• secure the economical, efficient and effective management of the University’s resources and expenditure
Council has responsibility for maintaining a sound system of internal control that supports the achievement of policies, aims and objectives, while safeguarding the public and other funds and assets for which it is responsible. This is in accordance with the responsibilities assigned to the governing body in the Universities of Durham and Newcastle upon Tyne Act 1963 and the Memorandum of Financial Assurance and Accountability with HEFCE. It is designed to manage rather than eliminate the risk of failure to achieve policies, aims and objectives. It can, therefore, only provide reasonable and not absolute assurance against material misstatement or loss.
The key elements of the University’s system of internal control, which is designed to discharge the responsibilities set out above, include the following:
• clear definitions of, and the authority delegated to, heads of academic units and heads of administrative services• a comprehensive medium- and short-term planning process, supplemented by detailed annual income, expenditure, capital and
cash flow budgets• clearly defined and formalised requirements for approval and control of expenditure• comprehensive Financial Regulations, detailing financial controls and procedures, approved by the Audit Committee and Finance
Committee• key performance and risk indicators, which are monitored by the senior management team (through Executive Board) on a regular
basis. Appropriate action is taken to address performance issues and the outcome reported to Council• an ongoing process designed to identify the principal risks (whether business, operational, compliance or financial) to the
achievement of policies, aims and objectives, to evaluate the nature and extent of those risks and to manage them efficiently, effectively and economically. The reporting method uses a system whereby risks are ranked in terms of likelihood and impact and are reviewed and reported to Council to assure it that procedures are in place for the identified risks to be managed
Council is of the view that the University’s process for identifying, evaluating and managing its significant risks is embedded into ongoing operations and has been in place for the year ended 31 July 2014 and up to the date of the approval of the financial statements.
The system of internal control is regularly reviewed by Council and accords with the internal control guidance for directors in the Combined Code as deemed appropriate for higher education. It is informed also by a professional Internal Audit team, which works to standards defined in the HEFCE Audit Code of Practice and which is reviewed for effectiveness by HEFCE’s Assurance Service. Senior management and Audit Committee have also reviewed the performance of Internal Audit and are satisfied with it.
The Internal Audit annual plan is approved by the Audit Committee and endorsed by Council. The senior management team and Audit Committee receive regular internal audit reports, which include recommendations for improvement. Internal Audit provides an annual report to Council, which includes an opinion on the adequacy and effectiveness of the University’s system of internal control, including risk management, corporate governance, internal control and value for money.
Statement on Internal Control
43

Independent Auditor’s Report to the Council of Newcastle University
We have audited the group and parent institution financial statements (the ‘financial statements’) of Newcastle University (the ‘University’) for the year ended 31 July 2014 which comprise the Accounting Policies, the Consolidated Income and Expenditure Account, the Statement of Consolidated Total Recognised Gains and Losses, the Consolidated and University Balance Sheets, the Consolidated Cash Flow Statement and the related notes 1 to 32. The financial reporting framework that has been applied in their preparation is applicable law and United Kingdom Accounting Standards (United Kingdom Generally Accepted Accounting Practice).
Respective responsibilities of the Council and auditorsAs explained more fully in the Responsibilities of Council in the Preparation of the Financial Statements disclosure set out on page 42 the Council is responsible for the preparation of the financial statements and for being satisfied that they give a true and fair view. Our responsibility is to audit and express an opinion on the financial statements in accordance with applicable law and International Standards on Auditing (UK and Ireland). Those standards require us to comply with the Auditing Practices Board’s Ethical Standards for Auditors.
This report, including the opinions, has been prepared for and only for the Council as a body in accordance with paragraph 15 of the Charters and Statutes of the University and for no other purpose. We do not, in giving these opinions, accept or assume responsibility for any other purpose or to any other person to whom this report is shown or into whose hands it may come save where expressly agreed by our prior consent in writing.
Scope of the audit of the financial statementsAn audit involves obtaining evidence about the amounts and disclosures in the financial statements sufficient to give reasonable assurance that the financial statements are free from material misstatement, whether caused
by fraud or error. This includes an assessment of: whether the accounting policies are appropriate to the Group’s and University’s circumstances and have been consistently applied and adequately disclosed; the reasonableness of significant accounting estimates made by the Council; and the overall presentation of the financial statements. In addition, we read all the financial and non-financial information in the Strategic Report, Charity Status and Public Benefit Statement, Operational Review and Financial Review to identify material inconsistencies with the audited financial statements to identify any information that is apparently materially incorrect, based on, or materially inconsistent with, the knowledge aquired by us in the course of performing the audit. If we become aware of any apparent material misstatements or inconsistencies we consider the implications for our report.
Opinion on financial statementsIn our opinion the financial statements:
• give a true and fair view of the state of affairs of the University and the Group at 31 July 2014, and of the Group’s income and expenditure, recognised gains and losses, and statement of cash flows for the year then ended
• have been properly prepared in accordance with United Kingdom Generally Accepted Accounting Practice, and
• have been properly prepared in accordance with the Statement of Recommended Practice – Accounting for Further and Higher Education
Opinion on other matters prescribed in the HEFCE Audit Code of Practice issued under the Further and Higher Education Act 1992In our opinion, in all material respects:
• funds from whatever source administered by the University for specific purposes have been properly
applied to those purposes and, if relevant, managed in accordance with relevant legislation, and
• funds provided by HEFCE have been applied in accordance with the Financial Memorandum and any other terms and conditions attached to them
Matters on which we are required to report by exceptionWe have nothing to report in respect of the following matter where the HEFCE Audit Code of Practice issued under the Further and Higher Education Act 1992 requires us to report to you if, in our opinion:
• the statement of internal control, included as part of the Corporate Governance Statement, is inconsistent with our knowledge of the University and Group
Ernst & Young LLPStatutory AuditorNewcastle upon Tyne27 October 2014
The maintenance and integrity of Newcastle University’s website is the responsibility of its Council; the work carried out by the auditors does not involve consideration of these matters and, accordingly, the auditors accept no responsibility for any changes that may have occurred to the financial statements since they were initially presented on the website.
Legislation in the United Kingdom governing the preparation and dissemination of financial statements may differ from legislation in other jurisdictions.
44

Statement of Principal Accounting PoliciesIn accordance with FRS18 these accounting policies have been reviewed by Council and are considered appropriate to the University’s activities, and have been applied consistently in the preparation of the financial statements.
1. Basis of PreparationThese financial statements have been prepared in accordance with the Statement of Recommended Practice – Accounting for Further and Higher Education and in accordance with applicable accounting standards. They conform to the guidance published by the Higher Education Funding Council for England.
2. Basis of AccountingThe financial statements are prepared under the historical cost convention as modified by the revaluation of endowment asset investments.
3. Basis of ConsolidationThe consolidated financial statements consolidate the results of the University and all subsidiary undertakings for the financial year to 31 July 2014.
Details of the University’s subsidiary and associated undertakings, investment in joint ventures and other investments are provided in notes 12 and 13 to the accounts.
The consolidated income and expenditure account includes the University’s share of the profits or losses and tax of associated undertakings and the consolidated balance sheet includes the investment in associated undertakings at the University’s share of their underlying net assets. Associated undertakings are those in which the University has a participating interest and a significant influence over their commercial and financial policy decisions.
The consolidated financial statements do not include the results of Newcastle University Students’ Union as it is a separate company limited by guarantee in which the University has no financial
interest and no control or significant influence over its policy decisions.
The consolidated financial statements do not include the results of the University of Newcastle upon Tyne Development Trust as it is a separate charity which manages its funds independently of the University. Although the University nominates some of the trustees, it has no control of the Trust’s decisions.
4. Recognition of IncomeIncome from research grants and contracts is included to the extent of the related expenditure incurred during the year, together with any related contributions towards overhead costs. All income from short-term deposits is credited to the income and expenditure account in the period in which it is earned.
Charitable donations which have no specific terms attached to them are classified as expendable and unrestricted. The income from such donations is recognised in the income and expenditure account when received. Charitable donations which have specific terms attached to them are accounted for as endowment funds unless the purpose is the purchase and / or construction of tangible fixed assets whereby the donation is treated as a deferred capital grant.
Endowment funds are classified as either expendable, where the capital element can be converted into income, or permanent, where the capital element must be permanently maintained. Income from expendable endowments is included in the income and expenditure account to the extent of the related expenditure during the year. Permanent endowments are managed on a total return basis. The entire investment return is included in the income and expenditure account to the extent of the related expenditure during the year.
Recurrent grants from the Funding Councils are recognised in the period in which they are receivable.
Non-recurrent grants from Funding Councils or other bodies receivable in respect of the acquisition or construction of fixed assets are treated as deferred capital grants and amortised in line with depreciation over the life of the assets.
The University acts as an agent in the collection and payment of training bursaries from the Training and Development Agency for Schools and of Access Funds from the Higher Education Funding Council for England. Related payments received from the Training and Development Agency for Schools and the Higher Education Funding Council for England and subsequent disbursements to students are excluded from the income and expenditure account and are shown separately in notes 29 and 30 to the accounts.
5. Maintenance of PremisesThe University has a rolling long-term maintenance plan which is reviewed periodically and forms the basis of the ongoing maintenance of the estate. The cost of long-term and routine corrective maintenance is charged to the income and expenditure account as incurred.
6. Foreign Currency TranslationUniversity
Transactions denominated in foreign currencies are recorded at the rate of exchange ruling at the dates of the transactions. Monetary assets and liabilities denominated in foreign currencies are translated into sterling at year-end rates or, where there are related forward foreign exchange contracts, at contract rates. All exchange differences are taken to the income and expenditure account with the exception of differences on foreign currency borrowings to the extent that they are used to finance or provide a hedge against foreign equity investments which are taken directly to reserves together with the exchange difference on the carrying amount of the related investments.
45
Group
The financial statements of subsidiary undertakings are translated at the rate of exchange ruling at the balance sheet date. The exchange difference arising on the retranslation of opening net assets is taken directly to reserves. All other exchange differences are taken to income and expenditure with the exception of differences on foreign currency borrowings to the extent that they are used to finance or provide a hedge against group equity investments in foreign enterprises which are taken directly to reserves together with the exchange difference on the net investments in the enterprises.
7. LeasesLeasing agreements that transfer to the University substantially all the benefits and risks of ownership of an asset are treated as if the asset had been purchased outright. The assets are included in fixed assets and the capital element of the leasing commitments is shown as obligations under finance leases. The lease rentals are treated as consisting of capital and interest elements. The capital element is applied to reduce the outstanding obligations and the interest element is charged to the income and expenditure account in proportion to the reducing capital element outstanding. Assets held under finance leases are depreciated over the shorter of the lease term or the useful economic lives of equivalent owned assets. Costs under operating leases are charged on a straight-line basis over the lease term.
8. Tangible Fixed Assetsa. Land and BuildingsLand and buildings are stated at cost. Freehold land is not depreciated. Buildings are depreciated over their expected useful lives to the University (generally 50 years), and leasehold land over the life of the lease. Major refurbishments are depreciated over their expected useful lives to the University (generally 25 years).
Where buildings are acquired with the aid of specific grants they are capitalised and depreciated as above. The related grants are treated as deferred capital grants and released to income over the expected useful life of the buildings on a basis consistent with the depreciation policy.
Finance costs which are directly attributable to the construction of land and buildings are not capitalised as part of the cost of those assets.
A review for impairment of a fixed asset is carried out if events or changes in circumstances indicate that the carrying amount of the fixed asset may not be recoverable.
Buildings under construction are accounted for at cost, based on the value of architects’ certificates and other direct costs incurred to 31 July. They are not depreciated until they are brought into use.
b. EquipmentEquipment costing less than £20,000 per individual item or group of related items and all software costs are written off to the income and expenditure account in the year of acquisition. All other equipment is capitalised.
Capitalised equipment is stated at cost and depreciated over its expected useful life, as follows:
Research vessel – 25 yearsGeneral equipment – 4 to 10 yearsEquipment acquired for specific research projects – project life (generally 3 years)Leased equipment – period of lease
Where equipment is acquired with the aid of specific grants it is capitalised and depreciated as above. The related grant is credited to a deferred capital grant account and released to the income and expenditure account over the expected useful life of the related equipment or the period of the grant in respect of specific research projects.
c. Heritage AssetsWhere material, heritage assets purchased on or after 1 August 2007 are measured and recognised at their cost. Where reliable cost or valuation information is available assets acquired prior to 1 August 2007 are included in fixed assets.
9. InvestmentsFixed asset investments that are not listed on a recognised stock exchange are carried at historical cost, less any provision for impairment in their value.
Endowment asset investments are included in the balance sheet at market value. The asset value is represented by endowment reserves which is separated into permanent and expendable. Notes to the accounts further analyse the endowments into the capital element and unapplied return.
Current asset investments are included at the lower of cost and net realisable value.
10. StocksStocks are valued at the lower of cost and net realisable value. Where necessary, provision is made for obsolete, slow-moving and defective stocks.
11. ProvisionsProvisions are recognised when the institution has a present legal or constructive obligation as a result of a past event and it is probable that a transfer of economic benefit will be required to settle the obligation and a reliable estimate can be made of the amount of the obligation.
46

12. Pension SchemesThe two principal pension schemes for the University’s staff are the Universities Superannuation Scheme (USS) and the University of Newcastle upon Tyne Retirement Benefits Plan (1971) (RBP) which is an Exempt Approved Scheme under the Finance Act 1970. The schemes are defined benefit schemes which are externally funded and contracted out of the State Second Pension (S2P). The funds are valued every three years by professionally qualified independent actuaries using the projected unit method, the rates of contribution payable being determined by the trustees on the advice of the actuaries. Pension costs are assessed in accordance with the advice of the actuaries, based on the latest actuarial valuations of the schemes.
A small number of staff remain in other pension schemes.
The University is unable to identify its share of the underlying assets and liabilities of the USS on a consistent and reliable basis and, therefore, as required by FRS17, accounts for this scheme as if it were a defined contribution scheme. As a result, the amount charged to the income and expenditure account represents the contributions payable to the scheme in respect of the accounting period.
The RBP scheme’s assets are included at market value and scheme liabilities are measured on an actuarial basis using the projected unit method; these liabilities are discounted at the current rate of return on AA corporate bonds. The post-retirement benefit surplus or deficit is included on the University’s balance sheet, net of the related amount of deferred tax. Surpluses are only included to the extent that they are recoverable through reduced contributions in the future or through refunds from the scheme. The current service cost and any past service costs are included in the income and expenditure account within staff costs, and the expected return on the scheme’s assets, net of the impact of the unwinding of the discount on scheme liabilities, is included within interest receivable / payable. Actuarial gains and losses, including differences between the expected and actual return on scheme assets are recognised, net of the related deferred tax, in the Statement of Consolidated Total Recognised Gains and Losses.
13. Taxation StatusThe University is an exempt charity within the meaning of Schedule 2 of the Charities Act 2011 and as such is a charity within the meaning of Paragraph 1 of Schedule 6 to the Finance Act 2010. Accordingly, the University is potentially exempt from taxation in respect of income or capital gains received within categories covered by Sections 478–488 of the Corporation Tax Act 2010 (CTA 2010) (formerly enacted in Section 505 of the Income and Corporation Taxes Act 1988 (ICTA)) or Section 256 of the Taxation of Chargeable Gains Act 1992 to the extent that such income or gains are applied to exclusively charitable purposes.
The University receives no similar exemption in respect of Value Added Tax (VAT). The University’s subsidiary companies are subject to corporation tax and VAT in the same way as any commercial organisation.
14. Cash Flow and Liquid ResourcesCash flows comprise increases or decreases in cash. Cash includes cash in hand, deposits repayable on demand and overdrafts. Deposits are repayable on demand if they are in practice available within 24 hours without penalty. No investments, however liquid, are included as cash. Liquid resources comprise assets held as a readily disposable store of value. They include term deposits, government securities and loan stock held as part of the University’s treasury management activities. They exclude any such assets held as endowment asset investments.
47
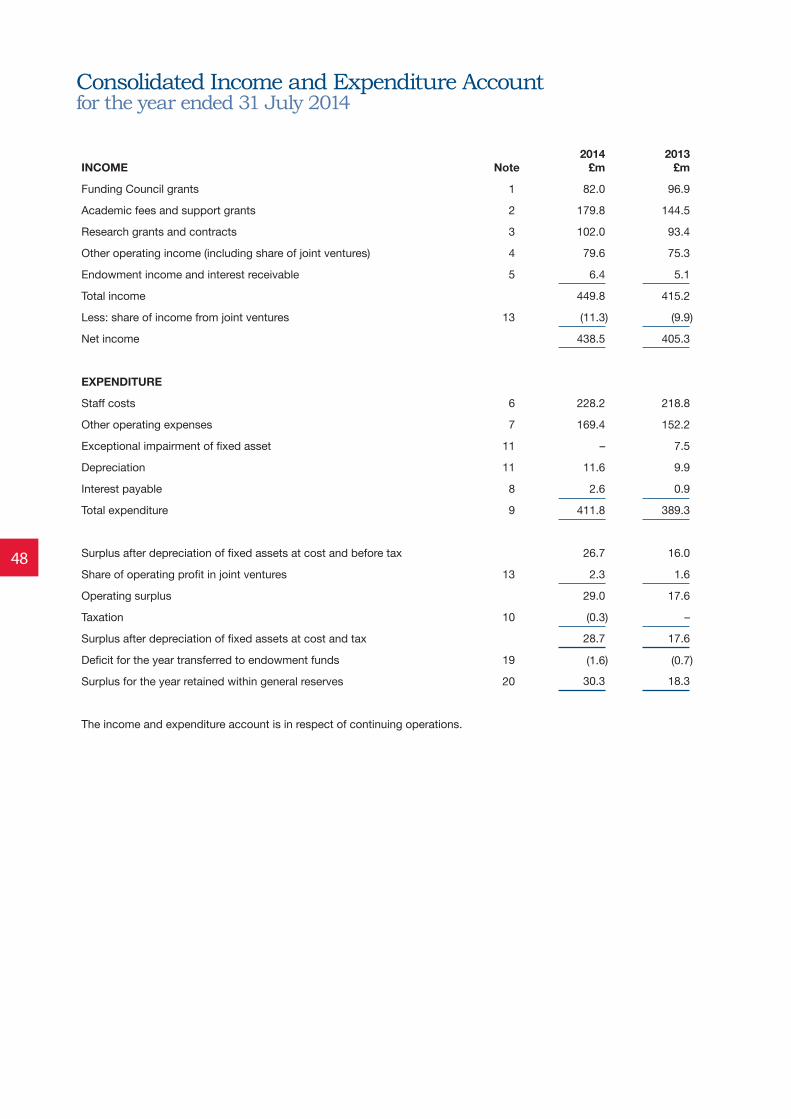
Consolidated Income and Expenditure Account for the year ended 31 July 2014
INCOME Note2014
£m2013
£m
Funding Council grants 1 82.0 96.9
Academic fees and support grants 2 179.8 144.5
Research grants and contracts 3 102.0 93.4
Other operating income (including share of joint ventures) 4 79.6 75.3
Endowment income and interest receivable 5 6.4 5.1
Total income 449.8 415.2
Less: share of income from joint ventures 13 (11.3) (9.9)
Net income 438.5 405.3
EXPENDITURE
Staff costs 6 228.2 218.8
Other operating expenses 7 169.4 152.2
Exceptional impairment of fixed asset 11 – 7.5
Depreciation 11 11.6 9.9
Interest payable 8 2.6 0.9
Total expenditure 9 411.8 389.3
Surplus after depreciation of fixed assets at cost and before tax 26.7 16.0
Share of operating profit in joint ventures 13 2.3 1.6
Operating surplus 29.0 17.6
Taxation 10 (0.3) –
Surplus after depreciation of fixed assets at cost and tax 28.7 17.6
Deficit for the year transferred to endowment funds 19 (1.6) (0.7)
Surplus for the year retained within general reserves 20 30.3 18.3
The income and expenditure account is in respect of continuing operations.
48
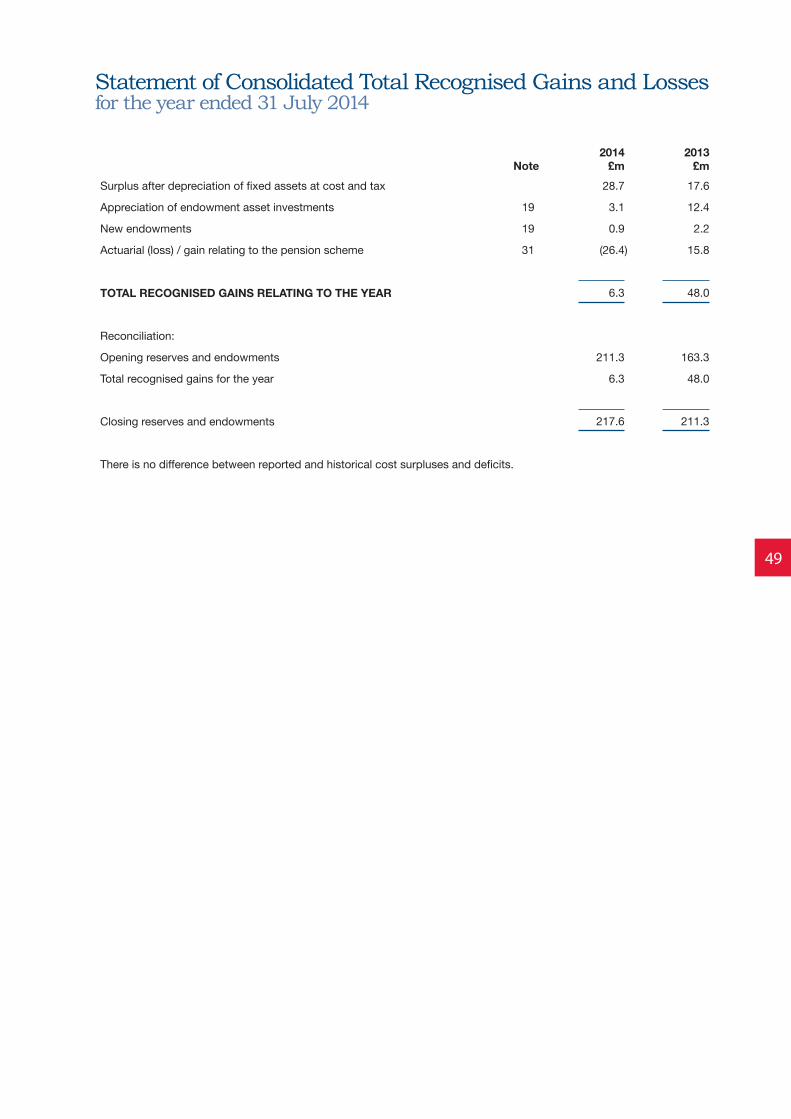
Statement of Consolidated Total Recognised Gains and Losses for the year ended 31 July 2014
Note2014
£m2013
£mSurplus after depreciation of fixed assets at cost and tax 28.7 17.6
Appreciation of endowment asset investments 19 3.1 12.4
New endowments 19 0.9 2.2
Actuarial (loss) / gain relating to the pension scheme 31 (26.4) 15.8
TOTAL RECOGNISED GAINS RELATING TO THE YEAR 6.3 48.0
Reconciliation:
Opening reserves and endowments 211.3 163.3
Total recognised gains for the year 6.3 48.0
Closing reserves and endowments 217.6 211.3
There is no difference between reported and historical cost surpluses and deficits.
49

Balance Sheets as at 31 July 2014
CONSOLIDATED UNIVERSITY2014 2013 2014 2013
Note £m £m £m £mFIXED ASSETSTangible assets 11 271.5 237.9 248.8 237.7Investments 12 0.1 0.1 17.6 11.4Investment assets – Joint ventures 13Share of gross assets 24.1 19.0 – –Share of gross liabilities (9.2) (8.2) – –
286.5 248.8 266.4 249.1
ENDOWMENT ASSET INVESTMENTS 14 57.6 55.2 57.6 55.2
CURRENT ASSETSAssets held for sale – 0.2 – 0.2Stocks and stores in hand 0.1 0.1 0.1 0.1Debtors 15 36.7 39.2 39.3 42.0Short term liquid deposits 153.1 108.0 153.1 108.0Cash at bank and in hand 14.8 35.3 9.6 31.9
204.7 182.8 202.1 182.2CREDITORS: AMOUNTS FALLING DUEWITHIN ONE YEAR 16 (110.2) (99.1) (107.6) (98.0)
NET CURRENT ASSETS 94.5 83.7 94.5 84.2
TOTAL ASSETS LESS CURRENT LIABILITIES 438.6 387.7 418.5 388.5
CREDITORS: AMOUNTS FALLING DUEAFTER MORE THAN ONE YEAR 17 (40.4) (18.3) (17.8) (18.3)
NET ASSETS EXCLUDING PENSION LIABILITY 398.2 369.4 400.7 370.2
PENSION LIABILITY 31 (45.1) (20.5) (45.1) (20.5)
NET ASSETS INCLUDING PENSION LIABILITY 353.1 348.9 355.6 349.7
DEFERRED CAPITAL GRANTS 18 135.4 137.5 135.4 137.5
ENDOWMENTSPermanent 19 39.7 38.6 39.7 38.6Expendable 19 17.9 16.6 17.9 16.6
57.6 55.2 57.6 55.2RESERVESGeneral reserve excluding pension liability 205.1 176.6 207.7 177.5Pension liability 31 (45.1) (20.5) (45.1) (20.5)General reserve including pension liability 20 160.0 156.1 162.6 157.0
MINORITY INTEREST 0.1 0.1 – –TOTAL FUNDS 353.1 348.9 355.6 349.7
The financial statements were approved by Council on 27 October 2014 and signed on its behalf by:
C H BRINK,Vice Chancellor
S J LIGHTLEY,Treasurer
R C DALE,Executive Director of Finance
50

Consolidated Cash Flow Statement for the year ended 31 July 2014
2014 2013Note £m £m
NET CASH INFLOW FROM OPERATING ACTIVITIES 21 40.3 36.1
Returns on investments and servicing of finance 22 2.5 2.3
Taxation (0.1) –
Capital expenditure and financial investment 23 (16.9) (11.7)
Cash inflow before use of liquid resources and financing 25.8 26.7
Management of liquid resources – cash increase in short-term deposits (45.1) (16.0)
Financing 24 (1.0) (0.9)
(Decrease) / increase in cash in the period (20.3) 9.8
RECONCILIATION OF NET CASH FLOW TO MOVEMENT IN NET FUNDS
(Decrease) / increase in cash in the period (20.3) 9.8
Increase in short-term deposits 45.1 16.0
Repayment of debt 1.0 0.9
Change in net funds resulting from cash flows 25.8 26.7
New finance leases (24.9) –
Movement in net funds 0.9 26.7
Net funds at 1 August 128.8 102.1
Net funds at 31 July 25 129.7 128.8
Included within net funds and creditors: amounts falling due within one year (note 16) are cash balances of £10.2m(2013 £18.8m) that relate to, and are ring-fenced for, collaborative research projects.
51

Notes to the Accounts
1 FUNDING COUNCIL GRANTS 2014 2013£m £m
HEFCE recurrent grant 73.3 86.0HEFCE specific grants 5.6 7.0HEFCE deferred capital grants released in year– Buildings 2.8 3.4– Equipment 0.2 0.3Teaching Agency recurrent grant – 0.1Teaching Agency specific grant 0.1 0.1
82.0 96.9
2 ACADEMIC FEES AND SUPPORT GRANTS 2014 2013£m £m
Full-time students 97.1 74.1Full-time students charged overseas fees, UK taught 63.9 52.3Full-time students charged overseas fees, overseas taught 12.2 9.5Part-time fees 2.3 3.2Research training support grants 2.9 3.1Short courses 1.4 2.3
179.8 144.5
3 RESEARCH GRANTS AND CONTRACTS 2014 2013£m £m
Research Councils 30.9 27.3UK–based charities 24.9 24.5European Commission 12.2 11.9Other grants and contracts 34.0 29.7
102.0 93.4
4 OTHER OPERATING INCOME 2014 2013£m £m
Residences, catering and conferences 23.9 21.7Other services rendered 4.9 7.1Health authorities 12.4 13.3Share of income from joint ventures 11.3 9.9Other income 27.1 23.3
79.6 75.3
5 ENDOWMENT INCOME AND INTEREST RECEIVABLE 2014 2013£m £m
Income from permanent endowments (note 19) 0.9 0.9Income from expendable endowments (note 19) 0.4 0.3Pension finance interest (note 31) 3.5 1.7Income from short-term investments 1.6 2.2
6.4 5.1
52

6 STAFF 2014 2013£m £m
STAFF COSTSWages and salaries 176.8 170.0Social security costs 14.6 14.4Other pension costs 35.1 33.2FRS17 pension service cost adjustment 1.7 1.2
228.2 218.8
2014 2013Emoluments of the Vice-Chancellor: £000 £000
Salary 224.2 222.0Benefits in kind 1.4 1.7
225.6 223.7Pension contributions 56.4 55.9
282.0 279.6
STAFF NUMBERS 2014 2013Average FTEs Average FTEs
Academic 1,318 1,259Support 2,666 2,606Research 1,009 946
4,993 4,811
Remuneration of higher paid staff, excluding the Vice-Chancellor and employer's pension contributions (Clinical staff numbers in brackets): 2014 2013
Number Number
£100,000–£109,999 16 (7) 23 (12) £110,000–£119,999 15 (9) 8 (6) £120,000–£129,999 12 (9) 17 (11) £130,000–£139,999 17 (11) 15 (10) £140,000–£149,999 13 (12) 9 (9) £150,000–£159,999 8 (7) 12 (10) £160,000–£169,999 5 (4) 5 (4) £170,000–£179,999 11 (11) 12 (12) £180,000–£189,999 5 (5) 3 (2) £190,000–£199,999 1 (1) 2 (2) £200,000–£209,999 2 (2) 5 (5) £210,000–£219,999 5 (4) 2 (2) £220,000–£229,999 1 (1) 3 (3) £230,000–£239,999 1 (1) – –.
Aggregate payments for compensation for loss of office for two (2013–none) senior members of staff earning in excess of £100,000 per annum were £137,011. This comprised of termination payments of £136,591 made directly to individuals in respect of loss of office plus £420 of legal costs relating to the settlement agreements. All of these costs were internally funded by the University and approved by the Remuneration Committee.
53

Notes to the Accounts (continued)
8 INTEREST PAYABLE 2014 2013£m £m
On loans not wholly repayable within five years 0.9 0.9On finance leases 1.7 –
2.6 0.9
9 ANALYSIS OF 2013–14Staff
Costs
OtherOperatingExpenses Depreciation
InterestPayable Total
EXPENDITURE BY ACTIVITY £m £m £m £m £m
Academic schools 123.9 44.9 1.8 – 170.6Academic services 12.8 13.4 0.3 – 26.5Administration and central services 21.8 24.0 – – 45.8Premises 8.5 31.2 6.5 2.0 48.2Residences, catering and conferences 5.4 13.5 0.8 0.6 20.3Research grants and contracts 47.8 33.3 1.9 – 83.0Other expenditure 8.0 9.1 0.3 – 17.4
Total per income and expenditure account 228.2 169.4 11.6 2.6 411.8
The depreciation charge has been funded by:Deferred capital grants released 5.8General income 5.8
11.6
Administration and central services includes £9.1m (2013: £9.0m) in respect of payments made to students for bursaries, prizes, scholarships or other similar awards.
7 OTHER OPERATING EXPENSES 2014 2013£m £m
Building maintenance and renewals 14.8 16.0Student-related expenditure 28.8 27.5Consumables and laboratory expenditure 17.4 15.5Staff-related expenditure 27.3 24.5Non-capitalised equipment purchases and maintenance 18.2 15.4Heat, light, water and power 9.4 10.7Residences, catering and conference operating expenses 10.5 9.2Professional fees 5.2 3.9Books and periodicals 5.0 4.4Studentsʼ Union annual subvention 1.5 1.4Operating lease rentals - land and buildings 8.0 6.8Other expenses 23.3 16.9
169.4 152.2
Professional fees include auditors remuneration in respect of audit services for the Group of £88,080 to Ernst & Young LLP (2013: £90,940) and for the University of £55,100 (2013: £55,040). In respect of non-audit services (mainly grant certification work) remuneration amounted to £57,750 (2013: £15,840) for the Group and University. The comparatives for the year ended 31 July 2013 have been restated to give a more appropriate reflection of the true nature of the costs. There is no impact on the total expenditure levels.
54

10 TAXATION 2014 2013£m £m
Republic of Singapore corporation tax at 17% (2013–17%) 0.1 –Republic of Singapore witholding tax at 17% (2013–17%) 0.2 –United Kingdom corporation tax at 20% (2013–20%) – –
0.3 –
11 TANGIBLE ASSETS CONSOLIDATED
Land and Buildings Leasehold Assets under
Construction Freehold Long Short Equipment Total £m £m £m £m £m £m
COSTBalance at 1 August 2013 160.0 100.7 19.8 15.9 64.8 361.2Additions – 24.1 – 15.9 6.0 46.0Foreign exchange retranslation – (0.8) – – – (0.8)Transfers from assets under construction 4.1 – – (4.1) – –Disposals – – (0.8) – (3.2) (4.0)
Balance at 31 July 2014 164.1 124.0 19.0 27.7 67.6 402.4
DEPRECIATIONBalance at 1 August 2013 33.8 26.3 5.4 – 57.8 123.3Charge for year 3.5 2.8 1.0 – 4.3 11.6Eliminated on disposals – – (0.8) – (3.2) (4.0)
Balance at 31 July 2014 37.3 29.1 5.6 – 58.9 130.9
NET BOOK VALUEAt 31 July 2014 126.8 94.9 13.4 27.7 8.7 271.5
At 1 August 2013 126.2 74.4 14.4 15.9 7.0 237.9
Financed by Funding Council capital grants 25.0 62.3 – 2.0 0.3 89.6Other 101.8 32.6 13.4 25.7 8.4 181.9
126.8 94.9 13.4 27.7 8.7 271.5
The long leasehold relating to the NUMed Malaysia campus has been capitalised during the year. The net book value of assets held under finance leases at 31st July 2014 is £22.5m (2013 £nil) and the related depreciation charge for the year was £0.8m (2013 £nil).
On 31 January 2013, the University disposed of its interest in the land known as Science Central to Newcastle Science Central LLP. This land was given a full valuation on that date by Sanderson Weatherall, RICS qualified chartered surveyors, who are independent of the University. The difference between the net book value of the land and the value of the capital allocated to the University by Newcastle Science Central LLP of £7.5m was treated as an exceptional impairment in the consolidated income and expenditure account for the year ended 31 July 2013.
55

Notes to the Accounts (continued)
11 TANGIBLE ASSETS (continued) UNIVERSITY
Land and Buildings Leasehold Assets under
Construction Freehold Long Short Equipment Total £m £m £m £m £m £m
COSTBalance at 1 August 2013 159.9 100.7 19.8 15.9 63.9 360.2Additions – – – 15.9 5.8 21.7Transfers from assets under construction 4.1 – – (4.1) – –Disposals – – (0.8) – (3.2) (4.0)
Balance at 31 July 2014 164.0 100.7 19.0 27.7 66.5 377.9
DEPRECIATIONBalance at 1 August 2013 33.8 26.3 5.4 – 57.0 122.5Charge for year 3.5 2.0 1.0 – 4.1 10.6Eliminated on disposals – – (0.8) – (3.2) (4.0)
Balance at 31 July 2014 37.3 28.3 5.6 – 57.9 129.1
NET BOOK VALUEAt 31 July 2014 126.7 72.4 13.4 27.7 8.6 248.8
At 1 August 2013 126.1 74.4 14.4 15.9 6.9 237.7
Financed by Funding Council capital grants 25.0 62.3 – 2.0 0.3 89.6Other 101.7 10.1 13.4 25.7 8.3 159.2
126.7 72.4 13.4 27.7 8.6 248.8
The University holds a number of collections, exhibits and artefacts, most of which have been donated or bequeathed to the University. These assets are not considered Heritage Assets as defined in the SORP and therefore have no value attributed to them in the financial statements.
12 FIXED ASSET INVESTMENTS CONSOLIDATED UNIVERSITY2014 2013 2014 2013
£m £m £m £m
Shares in subsidiary undertakings at cost less amounts written off – – 3.7 1.1
Other investments other than loansAt cost 1 August 0.1 0.1 10.3 0.1Additions on disposal of land to Newcastle Science Central LLP – – – 7.0Other additions in year – – 3.6 3.2At cost 31 July 0.1 0.1 13.9 10.3
Total fixed asset investments 0.1 0.1 17.6 11.4
56

OTHER INVESTMENTS OTHER THAN LOANSPercentage
of voting rights
%
CONSOLIDATED UNIVERSITY2014 2013 2014 2013
£m £m £m £m
CVCP Properties PLC 1.3 0.1 0.1 0.1 0.1North East Seed Capital Fund LP 11.94 – – – –North East Seed Capital Fund Two LP 4.50 – – – –
0.1 0.1 0.1 0.1
The University has direct minor shareholdings in a number of other companies, including spin outs, which are not material to these financial statements.
Shares in associated undertakings and other investments held by subsidiary companies are disclosed in the financial statements of those companies.
12 FIXED ASSET INVESTMENTS (continued)
SHARES IN SUBSIDIARY UNDERTAKINGS
Details of the companies, all registered in England and Wales (unless otherwise stated), in which Newcastle University holds an interest are as follows:
Name of Company Percentage Holding of
Ordinary Shares
% Nature of Business
Newcastle University Holdings Limited 100 Operates as a holding company only.
Newcastle University Ventures Limited 100 Provides support for the commercialdevelopment of research and consultancy.
University of Newcastle upon Tyne Supply Company Limited
100 Leases assets to the University.
Newcastle University Pension Trustee(1971) Limited
100 Provides a corporate trusteeship for theUniversity Retirement Benefits Plan.
Newcastle ISC Limited 100 Acts as a holding company for the jointventure INTO Newcastle University LLP.
NUMed Malaysia sdn bhd 100 A company incorporated in Malaysia for the provision of tertiary courses focusing on medical education.
NUInternational Singapore pte Limited 100 A company incorporated in Singapore for collaborative teaching and research.
Newcastle University Enterprises Limited (*) 100 This company is dormant.
NUINTO Limited 51 Provides the teaching of English language skills.
(*) For the year ending 31 July 2014 Newcastle University Enterprises Limited (CRN:06331269) was exempt from the requirement to prepare individual accounts by virtue of section 394A of the Companies Act 2006 relating to dormant subsidiaries.
University membership in companies limited by guarantee: The Russell GroupNewcastle Science Company LimitedUniversities UKNorth East Universities Purchasing Consortium
57

Notes to the Accounts (continued)
13 INVESTMENT IN JOINT VENTURESINTO Newcastle University LLP is a joint venture between the University and INTO University Partnerships Limited. A 50% share of the LLP’s gross assets and liabilities is included in the University’s consolidated balance sheet and 50% of its net income is reported in the University’s consolidated income and expenditure account. INTO Newcastle University LLP’s principal activity is the provision of pre-University education and residential accommodation for international students. At the year end an amount of £86,031 (2013: creditor of £774,498) was due from the University to INTO Newcastle University LLP.
Newcastle Science Central LLP is a joint venture between the University and Newcastle City Council. The principal activity of the joint venture is the sale and lease of land for the development of the Science Central site in Newcastle. This land was transferred into the partnership on 31 January 2013. A 50% share of the LLP’s losses to date is reported in the University’s consolidated income and expenditure account and the University’s interest in the gross assets and liabilities of the LLP is included in the University’s consolidated balance sheet.
CONSOLIDATED2014 2013
£m £m
Share of income from joint venture – INTO Newcastle University LLP 11.3 9.9
Share of operating profit from joint venture – INTO Newcastle University LLP 2.4 1.9Share of operating loss from joint venture – Newcastle Science Central LLP (0.1) (0.3)
2.3 1.6
Share of gross assets from joint venture – INTO Newcastle University LLP 10.3 8.8Share of gross assets from joint venture – Newcastle Science Central LLP 13.8 10.2
24.1 19.0
Share of gross liabilities from joint venture – INTO Newcastle University LLP (8.8) (7.9)Share of gross liabilities from joint venture – Newcastle Science Central LLP (0.4) (0.3)
(9.2) (8.2)
14 ENDOWMENT ASSET INVESTMENTS CONSOLIDATED AND UNIVERSITY
2014 2013£m £m
At 1 August 55.2 41.3Additions 18.2 43.4Disposals (19.9) (42.4)Net appreciation on disposals and on revaluation 3.1 12.4Increase in cash balances 0.2 0.4Increase in other current asset balances 0.8 0.1
At 31 July 57.6 55.2
Fixed interest stock and equities 56.6 55.2Bank balances 1.5 1.3Other current balances (0.5) (1.3)
57.6 55.2
58

15 DEBTORS CONSOLIDATED UNIVERSITY2014 2013 2014 2013
£m £m £m £m
Trade debtors 13.6 18.7 13.5 17.3Accrued income on research grants and contracts 14.6 13.6 14.6 13.6Amounts owed by subsidiary undertakings – – 3.9 4.6Prepayments and accrued income 7.6 5.1 6.6 4.9Other debtors 0.9 1.8 0.7 1.6
36.7 39.2 39.3 42.0
Contained within amounts owed by subsidiary undertakings is an amount of £500,000 due from NUMed Malaysia which is repayable after more than one year.
16 CREDITORS: AMOUNTS FALLING DUEWITHIN ONE YEAR CONSOLIDATED UNIVERSITY
2014 2013 2014 2013£m £m £m £m
Fixed term loans 1.0 1.0 1.0 1.0Obligations under finance leases 2.3 – – –Payments received on account 42.7 32.4 42.7 32.4Research collaborator creditors 10.2 18.8 10.2 18.8Other creditors 6.7 4.0 6.7 4.0Social security and other taxation payable 5.5 5.2 5.5 5.2Accruals and deferred income 41.8 37.7 41.5 36.6
110.2 99.1 107.6 98.059

Notes to the Accounts (continued)
17 CREDITORS: AMOUNTS FALLING DUEAFTER MORE THAN ONE YEAR
CONSOLIDATED UNIVERSITY2014 2013 2014 2013
£m £m £m £m
Fixed term, unsecured loans repayable by 2029 13.8 14.8 13.8 14.8Accruals and deferred income 4.0 3.5 4.0 3.5Obligations under finance leases 22.6 – – –
40.4 18.3 17.8 18.3
EffectiveInterest
Rate%
CONSOLIDATED AND UNIVERSITY
Fixed term, unsecured loans are repayable in 2014 2013accordance with the following profile: £m £m
Student residences loan due after one year but not more than five years 5.98 2.7 2.7Academic buildings loan due after one year but not more than five years 5.67 1.2 1.2
3.9 3.9
Student residences loan due after more than five years 5.98 7.0 7.7Academic buildings loan due after more than five years 5.67 2.9 3.2
13.8 14.8
Both loans are repayable quarterly in instalments of £170,000 and £75,000 respectively for the student residences and academic buildings.
18 DEFERRED CAPITAL GRANTS CONSOLIDATED AND UNIVERSITY
FundingCouncil
Other Grants and Benefactions Total
£m £m £mAt 1 AugustBuildings 92.1 41.6 133.7Equipment 0.5 3.3 3.8
92.6 44.9 137.5Amounts receivedBuildings – 1.5 1.5Equipment – 2.2 2.2
– 3.7 3.7Released to income and expenditure accountBuildings 2.8 0.9 3.7Equipment 0.2 1.9 2.1
3.0 2.8 5.8At 31 JulyBuildings 89.3 42.2 131.5Equipment 0.3 3.6 3.9
89.6 45.8 135.4
60

19 ENDOWMENTS CONSOLIDATED AND UNIVERSITYUnrestricted
PermanentRestricted
PermanentTotal
PermanentRestricted
Expendable2014Total
2013Total
£m £m £m £m £m £mAt 1 August Capital 2.7 16.5 19.2 9.8 29.0 26.8Unapplied return 2.4 17.0 19.4 6.8 26.2 14.5
5.1 33.5 38.6 16.6 55.2 41.3
New endowments – – – 0.9 0.9 2.2Appreciation of endowmentasset investments 0.3 1.9 2.2 0.9 3.1 12.4
0.3 1.9 2.2 1.8 4.0 14.6
Income 0.2 0.7 0.9 0.4 1.3 1.2Expenditure (0.2) (1.8) (2.0) (0.9) (2.9) (1.9)
– (1.1) (1.1) (0.5) (1.6) (0.7)
At 31 July 5.4 34.3 39.7 17.9 57.6 55.2
Represented by:Capital 2.7 16.5 19.2 10.7 29.9 29.0Unapplied return 2.7 17.8 20.5 7.2 27.7 26.2
5.4 34.3 39.7 17.9 57.6 55.2
61

20 GENERAL RESERVE CONSOLIDATED UNIVERSITY2014 2013 2014 2013
£m £m £m £m
At 1 August 156.1 122.0 157.0 122.5Surplus retained for the year 30.3 18.3 32.0 18.7Actuarial (loss) / gain on pension scheme (26.4) 15.8 (26.4) 15.8
At 31 July 160.0 156.1 162.6 157.0
CONSOLIDATEDImpact of FRS17 Retirement Benefits AND UNIVERSITYFRS17 resulted in the following movements: 2014 2013
£m £m
Increase in staff costs (1.7) (1.2)Pension finance income 3.5 1.7Impact on the income and expenditure account for the year 1.8 0.5
Actuarial (loss) / gain relating to the pension scheme (26.4) 15.8
(Decrease) / increase in total recognised gains and losses for the year (24.6) 16.3
Pension liability at 1 August (20.5) (36.8)
Pension liability at 31 July (45.1) (20.5)
Notes to the Accounts (continued)
21 RECONCILIATION OF SURPLUS BEFORE TAX TO NET CASH INFLOW FROM OPERATING ACTIVITIES
2014 2013£m £m
Surplus after depreciation of fixed assets at cost and before tax 26.7 16.0Depreciation 11.6 9.9Fixed asset impairment – 7.5Profit on disposal of asset held for resale (2.1) (1.1)Deferred capital grants released to income (5.8) (6.2)Profit distribution from INTO Newcastle University LLP 1.8 2.4Investment income (2.9) (3.4)Interest payable 2.6 0.9Difference between FRS17 net pension charge and cash contributions (1.8) (0.5)Decrease / (increase) in debtors 1.1 (4.5)Increase in creditors 9.1 15.1
Net cash inflow from operating activities 40.3 36.1
62

22 RETURNS ON INVESTMENTS AND SERVICING OF FINANCE 2014 2013£m £m
Income from endowments 1.3 1.2Other interest received 2.1 2.1Interest paid (0.9) (1.0)
Net cash inflow from returns on investments and servicing of finance 2.5 2.3
23 CAPITAL EXPENDITURE AND FINANCIAL INVESTMENT 2014 2013£m £m
Purchase of tangible fixed assets (21.9) (21.3)Payments to acquire long term investments (2.4) (2.0)Payments to acquire endowment assets (18.2) (43.4)
Total fixed and endowment asset investments acquired (42.5) (66.7)Receipts from sale of endowment assets 19.9 42.4Receipts from sale of assets held for resale 2.2 1.8Deferred capital grants received 2.6 8.6New endowments 0.9 2.2
Net cash outflow from capital expenditure and financial investment (16.9) (11.7)
24 ANALYSIS OF CHANGES IN CONSOLIDATED FINANCING DURING THE YEAR
Fixed Term Loans: £mAt 1 August 2012 16.7Capital repayments (0.9)At 31 July 2013 15.8New finance leases 24.9Capital repayments (1.0)At 31 July 2014 39.7
63
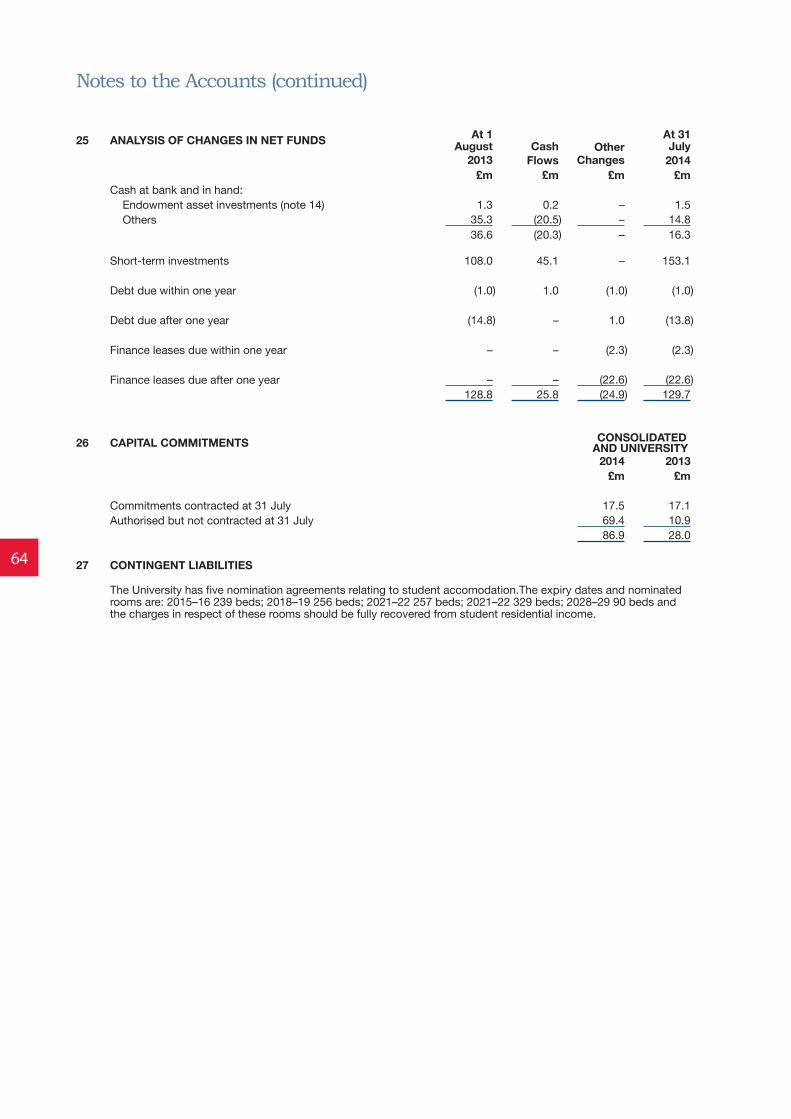
Notes to the Accounts (continued)
25 ANALYSIS OF CHANGES IN NET FUNDS At 1 August Cash Other
At 31 July
2013 Flows Changes 2014£m £m £m £m
Cash at bank and in hand: Endowment asset investments (note 14) 1.3 0.2 – 1.5 Others 35.3 (20.5) – 14.8
36.6 (20.3) – 16.3
Short-term investments 108.0 45.1 – 153.1
Debt due within one year (1.0) 1.0 (1.0) (1.0)
Debt due after one year (14.8) – 1.0 (13.8)
Finance leases due within one year – – (2.3) (2.3)
Finance leases due after one year – – (22.6) (22.6)128.8 25.8 (24.9) 129.7
26 CAPITAL COMMITMENTS CONSOLIDATED AND UNIVERSITY
2014 2013£m £m
Commitments contracted at 31 July 17.5 17.1Authorised but not contracted at 31 July 69.4 10.9
86.9 28.0
27 CONTINGENT LIABILITIES
The University has five nomination agreements relating to student accomodation.The expiry dates and nominated rooms are: 2015–16 239 beds; 2018–19 256 beds; 2021–22 257 beds; 2021–22 329 beds; 2028–29 90 beds and the charges in respect of these rooms should be fully recovered from student residential income.
64

28 LEASE OBLIGATIONS CONSOLIDATED AND UNIVERSITY
Amounts due under finance leases: 2014 2013£m £m
Amounts payableWithin one year 2.3 –In two to five years 7.6 –In more than five years 58.3 –
68.2 –Less: finance charges allocated to future periods (43.3) –
24.9 –
Annual rentals under operating lease commitments are as follows: 2014 2013£m £m
Leases expiring:In two to five years 0.7 1.0Over five years 5.5 5.1
6.2 6.1
29 ACCESS FUNDS 2014 2013
£m £m
Balance unspent at 1 August 0.1 0.1Funding Council grants 0.2 0.1
0.3 0.2Disbursements (0.1) (0.1)
Balance unspent at 31 July 0.2 0.1
Funding Council grants are available solely for students; the University acts only as paying agent. The grants and related disbursements are therefore excluded from the income and expenditure account.
30 TEACHING AGENCY 2014 2013£m £m
Training bursaries: Grant 1.2 1.7Disbursements (1.3) (1.7)Balance due from Teaching Agency at 31 July (0.1) –
The above training bursaries from the Teaching Agency (TA) are available solely for students in initial teacher training; the University acts only as paying agent. The bursaries and related disbursements are therefore excluded from the income and expenditure account.
65

Notes to the Accounts (continued)
31 PENSION ARRANGEMENTS
The University participates in two main pension schemes, the Retirement Benefits Plan (1971) (RBP) and Universities Superannuation Scheme Limited (USS).
The University also has a small number of staff in the National Health Service Scheme (NHSS), the total cost of which was £2.0m (2013: £1.9m). This includes £0.2m (2013: £0.3m) outstanding contributions at the balance sheet date.
The total pension cost for the University was:
2014 2013£m £m
Contributions to USS 27.5 25.9Contributions to RBP including FRS17 adjustment 7.3 6.6Contributions to NHSS 2.0 1.9
Total pension cost (note 6) 36.8 34.4
Pension finance interest (note 5) (3.5) (1.7)
Total pension cost including pension finance interest 33.3 32.7
RBP
RBP is an Exempt Approved Scheme under the Finance Act 1970 and provides benefits based on final pensionable salary; it is established under irrevocable trusts and its assets are kept strictly separate from those of the University. It is a defined benefit scheme. The total pension cost to the University was £7.3m (2013: £6.6m). The contribution payable by the University was 13.25% of pensionable salaries. There were no outstanding contributions at the balance sheet date.
The expected employer contribution to the plan during the next accounting year is £5.9m.
A full actuarial valuation was carried out as at 1 August 2013 and updated to 31 July 2014 by a qualified independent actuary. The major assumptions used by the actuary were:
Year ended
31 July 2014
Year ended
31 July 2013
Discount rate at year end 4.20% 4.60%Expected return on plan assets at year end 6.60% 7.20%Future salary increases 3.70% 3.80%Future pension increases applying to future benefit accrual 1.80% 1.80%RPI inflation 3.20% 3.30%CPI inflation 2.20% 2.30%Life expectancy of current pensioners (from age 65) 23.9 23.2Life expectancy of future pensioners (from age 65) 25.4 24.7
66

31 PENSION ARRANGEMENTS (continued)
The assets in the scheme and the expected rate of return were:
Value at 31 July 2014
Long-term expected
returnAsset
Allocation Value at
31 July 2013
Long-term expected
returnAsset
Allocation£m % % £m % %
Equities 75.1 7.50 42 78.4 8.00 45Bonds 60.7 3.80 33 58.8 4.28 34Property 13.9 7.50 8 12.1 8.00 7Absolute return fund 24.0 6.00 13 22.5 6.50 13Cash 7.9 0.50 4 0.9 0.50 1
Fair value of assets 181.6 6.60 172.7 7.20Present value of obligations (226.7) (193.2)
Funded status (45.1) (20.5)
Net pension liability (45.1) (20.5)
Analysis of the amount charged to operating surplus 2014 2013£m £m
Current service cost 7.3 6.6Interest on obligation 8.9 8.0Expected return on plan assets (12.4) (9.7)
Total operating charge 3.8 4.9
Change in defined benefit obligation 2014 2013 £m £m
Opening defined benefit obligation 193.2 187.3Service cost (including employee contributions) 7.6 6.8Interest cost 8.9 8.0Actuarial losses/(gains) 26.0 (0.9)Benefits paid (9.0) (8.0)
Closing defined benefit obligation 226.7 193.2
Change in fair value of plan assets 2014 2013 £m £m
Opening fair value of plan assets 172.7 150.5Expected return 12.4 9.7Actuarial (losses)/gains (0.4) 14.9Contributions by employer 5.6 5.4Contributions by employee 0.3 0.2Benefits paid (9.0) (8.0)
Closing fair value of plan assets 181.6 172.7
67

Notes to the Accounts (continued)
USS
USS is a defined benefit scheme which is externally funded and contracted out of the State Second Pension (S2P). The assets of the scheme are held in a separate fund administered by the trustee, Universities Superannuation Scheme Limited.
Because of the mutual nature of the scheme, the scheme’s assets are not hypothecated to individual institutions and a scheme-wide contribution rate is set. The University is therefore exposed to actuarial risks associated with other institutions and is unable to identify its share of the underlying assets and liabilities of the scheme on a consistent and reasonable basis and, therefore, as required by FRS17 ‘Retirement Benefits’, accounts for the scheme as if it were a defined contribution scheme. As a result, the amount charged to the income and expenditure account represents the contributions payable to the scheme in respect of the accounting period.
The total pension cost for the University was £27.5m (2013: £25.9m). This includes £2.4m (2013: £2.3m) outstanding contributions at the balance sheet date. The contribution rate payable by the University was 16% of pensionable salaries.
The latest triennial actuarial valuation of the scheme was at 31 March 2011. This was the second valuation for USS under the new scheme-specific funding regime introduced by the Pensions Act 2004, which requires schemes to adopt a statutory funding objective, which is to have sufficient and appropriate assets to cover their technical provisions. The actuary also carries out a review of the funding level each year between triennial valuations and details of his estimate of the funding level at 31 March 2014 are also included in this note.
The triennial valuation was carried out using the projected unit method. The assumptions which have the most significant effect on the results of the valuation are:
The financial assumptions were derived from market yields prevailing at the valuation date. An ʽinflation risk premiumʼ adjustment was also included by deducting 0.3% from the market-implied inflation on account of the historically high level of inflation implied by government bonds (particularly when compared to the Bank of England’s target of 2% for CPI which corresponds broadly to 2.75% for RPI pa).
At the valuation date, the value of the assets of the scheme was £32,433.5 million and the value of the scheme’s technical provisions was £35,343.7 million indicating a shortfall of £2,910.2 million. The assets therefore were sufficient to cover 92% of the benefits which had accrued to members after allowing for expected future increases in earnings. The actuary also valued the scheme on a number of other bases as at the valuation date. On the scheme’s historic gilts basis, using a valuation rate of interest in respect of past service liabilities of 4.4% pa the funding level was approximately 68%.Under the Pension Protection Fund regulations introduced by the Pensions Act 2004 it was 93% funded; on a buy-out basis (ie. assuming the scheme had discontinued on the valuation date) the assets would have been approximately 57% of the amount necessary to secure all the USS benefits with an insurance company; and using the FRS17 formula as if USS was a single employer scheme, using a AA bond discount rate of 5.5% pa, the actuary estimated that the funding level would have been approximately 82%.
As part of this valuation, the trustees have determined, after consultation with the employers, a recovery plan to pay off the shortfall by 31 March 2021. In 2011 the actuary estimated that if experience remained in line with the assumptions made the shortfall at 31 March 2014 would be £2.2 billion, equivalent to a funding level of 95%.
However, changes in market conditions between March 2011 and March 2014 have had an impact on scheme funding. The next formal triennial valuation will take place as at 31 March 2014 and work is currently underway to update the actuarial assumptions and allow for any adjustments to the overall funding approach adopted by the trustee board in consultation with stakeholders.
the rate of return on investments (ie the valuation rate of interest) 6.1% pathe rate of increase in salary 4.4% pa (with short term general pay growth at 3.65%)the rate of increase in pensions 3.4% pa for 3 years and 2.6% pa thereafterthe assumed rates of mortality from age 65: Males (females) currently aged 65 23.7 (25.6) years Males (females) currently aged 45 25.5 (27.6) years
31 PENSION ARRANGEMENTS (continued)
68

As work on the 2014 valuation is not yet complete the trustee cannot provide the final figure, however, an estimate has been provided using the assumptions used to deliver the 2011 actuarial valuation. On that basis, the actuary has estimated that the funding level under the scheme specific funding regime will have fallen from 92% at 31 March 2011 to 85% at 31 March 2014. This estimate is based on the results from the valuation at 31 March 2011 allowing primarily for investment returns and changes to market conditions.
The funding level has decreased mainly due to a decrease in real gilt yields, reducing the implied net discount rate and therefore placing a higher value on the schemes liabilities. This increase has been partially offset by a higher than expected investment return.
Surpluses or deficits which arise at future valuations may impact on the University’s future contribution commitment. A deficit may require additional funding in the form of higher contribution requirements, where a surplus could, perhaps, be used to similarly reduce contribution requirements.
The technical provisions relate essentially to the past service liabilities and funding levels, but it is also necessary to assess the ongoing cost of newly accruing benefits. The cost of future accrual was calculated using the same assumptions as those used to calculate the technical provisions but the allowance for promotional salary increases was not as high. Analysis has shown very variable levels of growth over and above general pay increases in recent years, and the salary growth assumption built into the cost of future accrual is based on more stable, historic salary experience. However, when calculating the past service liabilities of the scheme, a cautionary reserve has been included in addition, on account of the variability mentioned above.
As at the 2011 valuation date the Scheme was still a fully Final Salary Scheme for future accruals and the prevailing employer contribution rate was 16% of salaries. Following UK government legislation, from 2011 statutory pension increases or revaluations are based on the Consumer Prices Index measure of price inflation. Historically, these increases had been based on the Retail Prices Index measure of price inflation.
Since the valuation effective date there have been a number of changes to the benefits provided by the scheme although these became effective from October 2011. These include:
New Entrants – other than in specific, limited circumstances, new entrants are now provided on a Career Revalued Benefits (CRB) basis rather than a Final Salary (FS) basis.
The normal pension age was increased for future service and new entrants to age 65.
Flexible retirement options were introduced.
Member contributions were uplifted to 7.5% pa and 6.5% pa for FS section members and CRB section members respectively.
Cost sharing – if the total contribution level exceeds 23.5% of salaries per annum, the employers will pay 65% of the excess over 23.5% and members would pay the remaining 35% to the fund as additional contributions.
Pension increase cap – for service derived after 30 September 2011, USS will match increases in official pensions for the first 5%. If official pensions increase by more than 5% then USS will pay half of the difference up to a maximum increase of 10%.
USS is a ‘last man standing’ scheme so that in the event of the insolvency of any of the participating employers in USS, the amount of any pension funding shortfall (which cannot otherwise be recovered) in respect of that employer will be spread across the remaining participant employers and reflected in the next actuarial valuation of the scheme.
At 31 March 2014, USS had over 162,000 active members and the University had 2,961 active members participating in the scheme.
The University participated in the Federated Superannuation System prior to the creation of USS. This scheme purchased annuities to provide pensioners with their benefits. However, annuity growth has fallen below inflation and is insufficient to cover the annual guaranteed increase and as a result participating employers are invoiced for the shortfall. The University’s contribution for the current year was £7,705 and this will decline in line with a reduction in the number of pensioners.
31 PENSION ARRANGEMENTS (continued)
69

Notes to the Accounts (continued)32 RELATED PARTIES The University had transactions with a number of organisations which fell within the definition of Related Parties under
FRS8 ‘Related Party Disclosures’. In accordance with FRS8 no disclosure has been made of intra-group transactions and balances eliminated on consolidation. Due to the nature of the University’s operations and the composition of its Council (being drawn from local public and private sector organisations) it is inevitable that transactions will take place with organisations in which a member of Council may have an interest. All transactions involving organisations in which a member of Council or Executive Board may have an interest are conducted at arm’s length and in accordance with the University’s financial regulations and normal procurement procedures. Details of transactions, where material, are shown below.
(Income)/ Debtor/(Creditor) Nature of transaction/ Expenditure balance relationship 2014 2013 2014 2013 £m £m £m £m Joint ventures, associates and spin outs INTO Newcastle University LLP (0.2) (0.3) – 0.3 Net fees for student accommodation and other services. Newcastle Science Company Limited 0.2 0.1 – – Partner funding. Demuris Limited – – 0.2 0.1 Loan to spin out. Alcyomics Limited – – 0.1 0.1 Loan to spin out. INEX Microtechnology Limited – – 0.2 – Loan to spin out.
Other organisationsNewcastle University Students’ Union 1.7 1.6 – – Students ̓Union subvention and fees for other services. The University of Newcastle upon Tyne (1.8) (1.8) – 0.1 Endowment income Development Trust distribution.
The Newcastle upon Tyne Hospitals (14.0) (10.2) 1.0 2.7 University representation NHS Trust on Trust Board. NHS/ academic staff recharges.
International Centre for Life 2.5 2.2 – – University representation on board and rentals payable.
Council and Executive Board members Mrs H Mottram, Northumbrian Water 0.7 0.9 – – Water rates. Chief Executive Professor C Day, Medical Research (9.3) (7.2) 0.1 0.1 Medical Research Council Council member research funding.
Professor S Homans, Biotechnology (5.7) (5.1) 0.1 – BBSRC research funding. and Biological Sciences Research Council member (2013 only)
Professor A Boddy, Leukaemia and (1.4) (1.5) 0.3 0.4 Research funding. Lymphoma Research Panel member; Technology Strategy Board (2014 only) (1.4) – 0.1 – Research funding.
Professor C Brink, 0.1 0.1 – – Russell Group subscription. Russell Group Board Director; Universities UK (2.1) (0.9) – – Science Without Borders.
Mr S Pleydell, Trust Chief Executive – (0.2) 0.1 0.1 South Tees Hospitals NHS Trust (part year) NHS/academic staff recharges. Mr M Davison, non-executive director 0.1 0.1 – – City Hospitals Sunderland. Professor V Bruce, Governor, British – (0.1) – – Research funding. Academy (2013 only)
Council members did not receive any remuneration in respect of their service to Council during the year. The amount paid to members of Council in respect of expenses during the year amounted to £3,503 (2013: £3,627).
The University does not have any connected institutions, as defined by the Charities Act 2011, Schedule 3, paragraph 28.
70
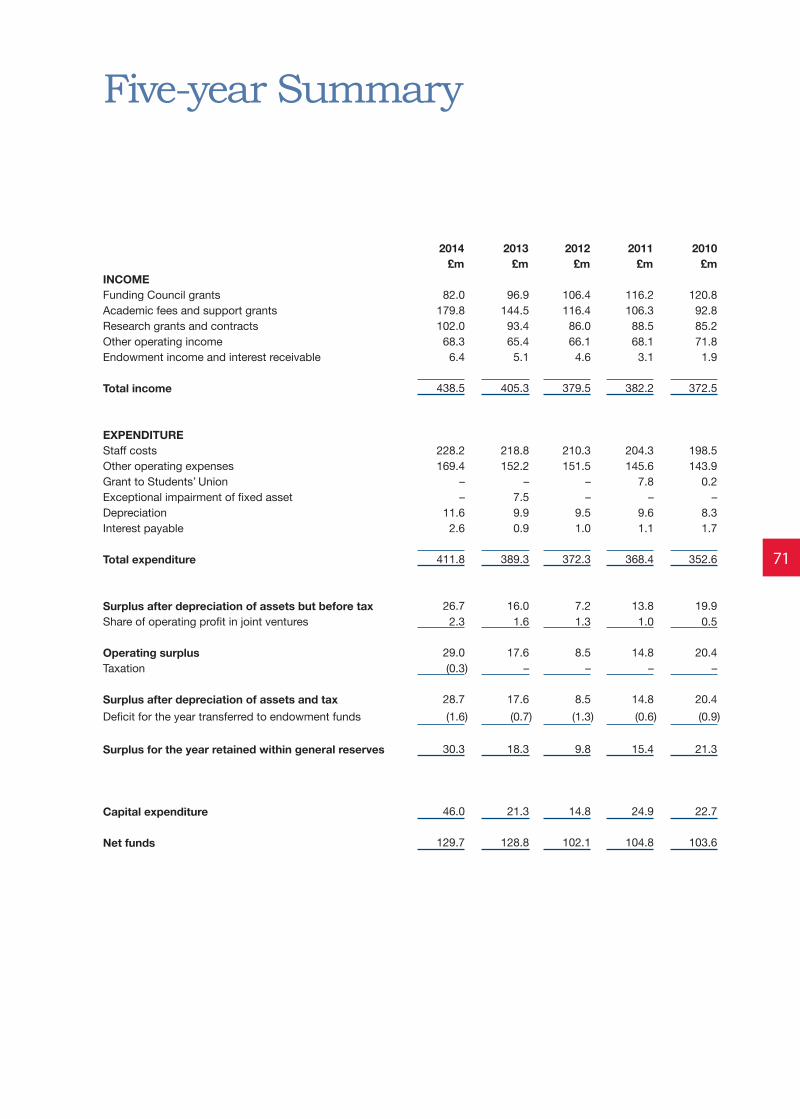
Five-year Summary
2014 2013 2012 2011 2010£m £m £m £m £m
INCOMEFunding Council grants 82.0 96.9 106.4 116.2 120.8Academic fees and support grants 179.8 144.5 116.4 106.3 92.8Research grants and contracts 102.0 93.4 86.0 88.5 85.2Other operating income 68.3 65.4 66.1 68.1 71.8Endowment income and interest receivable 6.4 5.1 4.6 3.1 1.9
Total income 438.5 405.3 379.5 382.2 372.5
EXPENDITUREStaff costs 228.2 218.8 210.3 204.3 198.5Other operating expenses 169.4 152.2 151.5 145.6 143.9Grant to Studentsʼ Union – – – 7.8 0.2Exceptional impairment of fixed asset – 7.5 – – –Depreciation 11.6 9.9 9.5 9.6 8.3Interest payable 2.6 0.9 1.0 1.1 1.7
Total expenditure 411.8 389.3 372.3 368.4 352.6
Surplus after depreciation of assets but before tax 26.7 16.0 7.2 13.8 19.9Share of operating profit in joint ventures 2.3 1.6 1.3 1.0 0.5
Operating surplus 29.0 17.6 8.5 14.8 20.4Taxation (0.3) – – – –
Surplus after depreciation of assets and tax 28.7 17.6 8.5 14.8 20.4Deficit for the year transferred to endowment funds (1.6) (0.7) (1.3) (0.6) (0.9)
Surplus for the year retained within general reserves 30.3 18.3 9.8 15.4 21.3
Capital expenditure 46.0 21.3 14.8 24.9 22.7
Net funds 129.7 128.8 102.1 104.8 103.6
71

Newcastle UniversityNewcastle upon TyneNE1 7RUUnited Kingdom
www.ncl.ac.uk
We would like to thank the following for the use of their illustrative material:John Donoghue; Gavin Duthie; Matt Horne; Mike Urwin; Simon Veit-Wilson; Zander Photography.
Designed by Press Ahead, Sunderland.Printed by Statex Colour Print, Newcastle upon Tyne.
© Newcastle University, 2014.The University of Newcastle upon Tyne trading as Newcastle University.