prof. jacob a. frenkel chairman, merrill lynch international former governor of the bank of israel...
TRANSCRIPT

Prof. Jacob A. Frenkel
Chairman, Merrill Lynch International Former Governor of the Bank of Israel
The Global EconomyChallenges to Recovery
The Global EconomyChallenges to Recovery
9th Dubrovnik Economic Conference DubrovnikJune 26 – 28, 2003

June 18, 2003
Table of ContentsTable of Contents
The US economy: Background and Challenges
A more sustainable growth outlook
Private sector reacts to challenges
A timely policy response
The path to economic recovery
Downside risks
Asset market vulnerability
Unwinding the current account deficit
Geo-political instability and oil shocks
Euroland economic outlook
Japan economic outlook
Emerging Asia and Latin America
Global Recessionary Deflation?

June 18, 2003
1.5
2.0
2.9
1.1
4.8
2.42.6
2.52.5
0
1
2
3
4
5
6
72-95 1996 1997 1998 1999 2000 2001 2002 Q1 03
US Economy Enjoys High ProductivityUS Economy Enjoys High Productivity
Source: Bureau of Labour Statistics
% year-on-year
Non-farm Productivity, last data point: Q1 03
1998-2002 average = 2.7%

June 18, 2003
Background and ChallengesBackground and Challenges
Non-sustainable rapid growth in the 1990s led to a series of real and financial imbalances
Bubbles burst in tech sectors and telecoms with fallouts in financial and real markets
Profit crunch required cost reduction
Manufacturing sector declined, employment weakened
Terrorism (9/11) damaged economic confidence
Corporate governance crisis damaged financial integrity
Confidence crisis and recession required policy response
Iraq crisis: before and after

June 18, 2003
Actual Numbers
Source: Bureau of Economic Analysis, last data point: Q1 03
-1.0
0.0
1.0
2.0
3.0
4.0
5.0
6.0
96 97 98 99 00 01 02 03 04
ML Forecast
Quarterly Real GDP (4 Quarter percentage change)Quarterly Real GDP (4 Quarter percentage change)
Boom, Gloom and Modest US RecoveryBoom, Gloom and Modest US Recovery
Actual Numbers Average 1996-2000: 4.0%Average 2001-2002: 1.4%Average 2003-2004: 2.8%

June 18, 2003
A More Sustainable US Growth OutlookA More Sustainable US Growth Outlook
A flexible, competitive and deregulated economy enables:
A smooth response by corporates and households
A timely policy response
Real GDP growth forecast: 2.2% in 2003, 3.4% in 2004
Capital spending starts to recover; limited overhang
Consumer spending less buoyant but still robust
High and rising productivity yields a jobless recovery
Housing market remains a solid pillar

June 18, 2003
Quick Reaction of Economic Agentsand PoliciesQuick Reaction of Economic Agentsand Policies
A flexible and adaptable economy, with low inflation and moderate public debt has facilitated:
An effective private sector response:
A significant reduction in labor costs
A rapid adjustment of inventories
Mitigating the profit crunch
An effective policy response:
A decisive and timely monetary policy response
A series of fiscal stimulus packages

June 18, 2003
6
7
8
9
10
11
12
13
1996 1997 1998 1999 2000 2001 2002 2003
Profit Crunch Requires AdjustmentProfit Crunch Requires Adjustment
Source: Bureau of Economic Analysis, last data point: Q1 03
1992-2002 average = 10.1%
Profits as Share of Non-Financial Corporate GDPProfits as Share of Non-Financial Corporate GDP US Recession
%%

June 18, 2003
Companies Lay Off Workers to Cut CostsCompanies Lay Off Workers to Cut Costs
6.1%
3.5
4.0
4.5
5.0
5.5
6.0
6.5
J an-01 J un-01 Nov-01 Apr-02 Sep-02 Feb-03
Source: Bureau of Labour Statistics, last data point: May 03
SA Unemployment Rate, as % of Total Civilian Labour ForceSA Unemployment Rate, as % of Total Civilian Labour Force
US Job Loss Jan 01-Dec 02 > 1.9m

June 18, 2003
-4
-3
-2
-1
0
1
2
3
4
5
6
1996 1997 1998 1999 2000 2001 2002 2003
Unit Labour Cost Pressures Have DeclinedUnit Labour Cost Pressures Have Declined
Source: Bureau of Labour Statistics; Unit Labour Costs, Non-farm Business Sector, last data point: Q1 03
% change% change
US Recession

June 18, 2003
-10
-8
-6
-4
-2
0
2
4
6
8
1996 1997 1998 1999 2000 2001 2002 2003
US Inventory Reflects FlexibilityUS Inventory Reflects Flexibility
Source: Census Bureau, last data point: Apr 03
% change% change
Inventories cut by $250bn in one year
Manufacturing & Wholesale Inventories, 3 Month % Change, AnnualisedManufacturing & Wholesale Inventories, 3 Month % Change, Annualised

June 18, 2003
Decisive US Fed Rate CutsDecisive US Fed Rate Cuts
1.25%
6.5%
0.0
1.0
2.0
3.0
4.0
5.0
6.0
7.0
J an-99 J ul-99 Feb-00 Sep-00 Apr-01 Nov-01 J un-02 J an-03
%
Source: Federal Reserve Bank of New York
Federal Funds Target

June 18, 2003
8.4
4.1
2.93.4
2.8
1.6 1.61.9
2.3 2.2
0.0
1.0
2.0
3.0
4.0
5.0
6.0
7.0
8.0
9.0
71-81 82-92 1996 1997 1998 1999 2000 2001 2002 2003F
In a Low Inflation EnvironmentIn a Low Inflation Environment
Source: Bureau of Labour Statistics, Merrill Lynch forecast
% year-on-year
10 year average = 2.5%

June 18, 2003
-3.8-3.3
-2.4
-1.3
-0.1
0.5
1.2
-0.7
-3.6
-4.6
-3.8
-5.0
-4.0
-3.0
-2.0
-1.0
0.0
1.0
2.0
1994
1995
1996
1997
1998
1999
2000
2001
2002
2003F
2004F
Reinforced by Ample Fiscal StimulusReinforced by Ample Fiscal Stimulus
US Budget Balance as% of GDP
US Gross Public Debtas % of GDP
Source: IMF World Economic Outlook, April 2003
75 7367
58 5962
0
10
20
30
40
50
60
70
80
1994
1996
1998
2000
2002
2003F

June 18, 2003
-30
-25
-20
-15
-10
-5
0
5
10
15
20
J an-99 J an-00 J an-01 J an-02 J an-03
Capital Spending Leads the RecoveryCapital Spending Leads the Recovery
Source: Census Bureau, last data point: Apr 03
New Orders of Non-Defense Capital Goods, % change year-on-yearNew Orders of Non-Defense Capital Goods, % change year-on-year
% change

June 18, 2003
-15
-10
-5
0
5
10
15
20
25
30
1990 1991 1992 1993 1994 1995 1996 1997 1998 1999 2000 2001 2002 2003
US Tech Spending RecoversUS Tech Spending Recovers
Source: Bureau of Economic Analysis, last data point: Q1 03
Real Capital Spending on Tech Equipment & Software, % change quarterly YoYReal Capital Spending on Tech Equipment & Software, % change quarterly YoY
% change

June 18, 2003
0
1,000
2,000
3,000
4,000
5,000
6,000
7,000
8,000
9,000
1991 1992 1993 1994 1995 1996 1997 1998 1999 2000 2001 2002 2003
Mortgage Refinancing Supports ConsumptionMortgage Refinancing Supports Consumption
Source: Mortgage Bankers Association, last data point: 3rd June 03
US Recession
Mortgage Application Index for Refinancing
4 Week Moving Average4 Week Moving Average
Households “cash out” $150-200bn in 2002

June 18, 2003
US Retail Sales Rebound and StabiliseUS Retail Sales Rebound and Stabilise
0.0
1.0
2.0
3.0
4.0
5.0
6.0
J an-01 J ul-01 J an-02 J ul-02 J an-03
Source: Census Bureau, Retail Sales ex-autos, last data point: May 03
% year-on-year% year-on-year

June 18, 2003
400
600
800
1,000
1,200
1,400
1,600
1991 1992 1993 1994 1995 1996 1997 1998 1999 2000 2001 2002 2003
Robust US Housing StartsRobust US Housing Starts
Source: Census Bureau; Single-Family Housing Starts, 000s, SAAR, last data point: May 03
10 year average
US Recession

June 18, 2003
-1.5
-0.5
0.5
1.5
2.5
3.5
4.5
5.5
J an-99 J an-00 J an-01 J an-02 J an-03
GDP growth
YoY Employment Growth
`
The Recovery Remains JoblessThe Recovery Remains Jobless
Source: BEA, BLS, last data point: Employment May 03, GDP Mar 03
% YoY growth

June 18, 2003
Global Growth OutlookGlobal Growth Outlook
Merrill Lynch Forecasts, June 2003Merrill Lynch Forecasts, June 2003
2000 2001 2002E 2003F
World* 4.0 1.2 1.9 2.2
US 3.8 0.3 2.4 2.2
Euroland 3.5 1.4 0.8 0.6
J apan 2.4 -0.2 0.2 0.2
Asia Pacific
(ex. J apan)
6.7 4.0 5.7 5.1
Latin America 4.1 0.1 -1.2 1.4
(*) IMF forecasts

June 18, 2003
Downside RisksDownside Risks
Vulnerable Asset Markets Could further Affect Confidence
The investment rebound could be short-lived
Household spending could retrench
Disorderly Unwinding of US Current Account Deficit if:
Foreign investors reduce holdings of US assets
US Dollar weakens and forex markets remain volatile
US savings recover too rapidly
US investment recovers too slowly
Geo-political Instability and Oil Shocks
Global recessionary deflation?

June 18, 2003
Risk Aversion in US MarketsRisk Aversion in US Markets
-1.5
-1.0
-0.5
0.0
0.5
1.0
1.5
2.0
2.5
J ul-98 Jan-99 Jul-99 Jan-00 Jul-00 Jan-01 Jul-01 Jan-02 Jul-02 Jan-03
Source: Merrill Lynch, last data point: 17 June 03
Risk Aversion Index, 30 days moving average
Index composed of Equity Implied Volatility, Swap Spreads & Spread Ratio between BBB & BB CorpsIndex composed of Equity Implied Volatility, Swap Spreads & Spread Ratio between BBB & BB Corps
Russia/LTCMcollapse
September 11
Accounting scandals
Fall of Baghdad

June 18, 2003
High US Corporate Debt RatioHigh US Corporate Debt Ratio
60%
65%
70%
75%
80%
85%
90%
95%
1991 1992 1993 1994 1995 1996 1997 1998 1999 2000 2001 2002
Source: Census Bureau, last data point: Q4 02
10 year average = 75%
Long-Term Debt/Income, all Manufacturing IndustriesLong-Term Debt/Income, all Manufacturing Industries

June 18, 2003
9
11
13
15
17
19
21
1991 1992 1993 1994 1995 1996 1997 1998 1999 2000 2001 2002 2003
US Corporate Debt Servicing ManageableUS Corporate Debt Servicing Manageable
Source: Bureau of Economic Analysis, last data point: Q1 03
%%
10 year average = 12.8%
Current = 14.3%
US RecessionInterest Expense/EBITDAInterest Expense/EBITDA

June 18, 2003
0
50
100
150
200
250
1996 1997 1998 1999 2000 2001 2002
0
20
40
60
80
100
120
140
160
180
200
Insert Footnote Text
Corporate Bond Defaults Rise Globally Corporate Bond Defaults Rise Globally
No. of issuers US$ bn
Source: Standard & Poor’s
Amount defaulted
No. of issuers

June 18, 2003
27 46 21 37
226
415 417
733
0
100
200
300
400
500
600
700
800
Q1 2002 Q2 2002 Q3 2002 Q4 2002
UpgradesDowngrades
US Corporate Credit Ratings WorsenUS Corporate Credit Ratings Worsen
Source: Standard & Poor’s
US$ bn
US rating actions by value

June 18, 2003
60
80
100
120
140
1992 1993 1994 1995 1996 1997 1998 1999 2000 2001
Are Residential Prices Sustainable?Are Residential Prices Sustainable?
Source: Bank for International Settlements
Residential Price Indices , 1992 =100, logarithmic scaleResidential Price Indices , 1992 =100, logarithmic scale
FranceFrance
USA
ItalyItaly
GermanyGermany
JapanJapan
UK

June 18, 2003
A Rising Current Account DeficitA Rising Current Account Deficit
-6
-5
-4
-3
-2
-1
0
1996 1997 1998 1999 2000 2001 2002 2003F
Source: Bureau of Economic Analysis, Merrill Lynch
Current Account balance as % of GDPCurrent Account balance as % of GDP

June 18, 2003
Risks to External Financing of DeficitsRisks to External Financing of Deficits
US current account deficit projected to remain above 4% of GDP, worsening net foreign liability position
A potentially disorderly unwinding of US current account deficit is possible if:
Loss of confidence or a shift in portfolio preferences reduces foreign investors appetite for US assets
US Savings recover too quickly
US Investments recover too slowly
Possible disruption of exchange rates and interest rates

June 18, 2003
0
50
100
150
200
250
300
1996 1997 1998 1999 2000 2001 2002 2003
Foreign Investors Withdraw from US MarketsForeign Investors Withdraw from US Markets
US$ bn, 12 months moving average
Foreign Foreign Purchases of Purchases of
US Stocks US Stocks
Foreign Purchases Foreign Purchases of US Corporate of US Corporate
Bonds Bonds
Source: Federal Reserve, last data point: Mar 03

June 18, 2003
US Dollar WeakensUS Dollar Weakens
0.80
0.85
0.90
0.95
1.00
1.05
1.10
1.15
1.20
Jan-02 Mar-02 Jun-02 Sep-02 Nov-02 Feb-03 Apr-03
`
Source: Bloomberg
US$/Euro

June 18, 2003
15
20
25
30
35
40
45
J an Apr J ul Sep Dec Mar J un Sep Dec
1990-19912002-2003Nymex Future Curve
Oil Price (WTI)Oil Price (WTI)
Source: Bloomberg
$/bbl$/bbl
08/01/90 - Iraq 08/01/90 - Iraq invades Kuwaitinvades Kuwait
01/17/91 - Operation 01/17/91 - Operation Desert Storm beginsDesert Storm begins 02/28/91 - Cessation of war02/28/91 - Cessation of war
June 18, 2003
-12
-10
-8
-6
-4
-2
0
2
1993 1994 1995 1996 1997 1998 1999 2000 2001 2002f 2003f
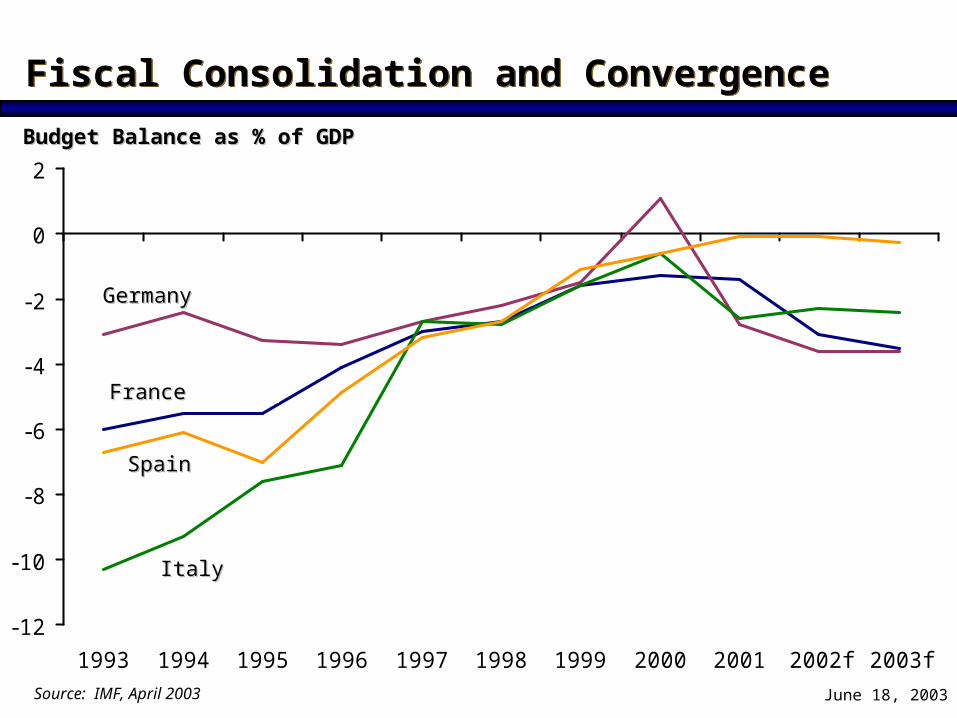
Fiscal Consolidation and ConvergenceFiscal Consolidation and Convergence
Source: IMF, April 2003
Budget Balance as % of GDPBudget Balance as % of GDP
FranceFrance
GermanyGermany
ItalyItaly
SpainSpain

June 18, 2003
Euroland Economic OutlookEuroland Economic Outlook
Euro strength & US weakness dampen growth prospects
Unemployment is rising again
Business & consumer confidence are falling
Controversies concerning the “stability and growth” pact
The German engine is lagging
Structural measures are essential for future growth
European Recovery Lags Behind USEuropean Recovery Lags Behind US

June 18, 2003
Euroland Recovery Lags Behind USEuroland Recovery Lags Behind US
2.4
0.81
0.20.4
21.8
2.2
0.6
1
0.2
0.6
22.2
0.0
0.5
1.0
1.5
2.0
2.5
3.0
US Euroland France Germany I taly Spain UK
2002E 2003F
% Real GDP Growth
Source: Merrill Lynch forecasts

June 18, 2003
Long Term Recession in JapanLong Term Recession in Japan
4.1
0.30.7
1.4
3.9
0.9
-2.9
-1.4
2.4
-0.2
0.2 0.21.0
-4.0
-3.0
-2.0
-1.0
0.0
1.0
2.0
3.0
4.0
5.0
1982-9
1
1992
1993
1994
1995
1996
1997
1998
1999
2000
2001
2002
2003E
Real GDP %, YoY
OECD 10-year Avg = 2.4%OECD 10-year Avg = 2.4%Japan 10-year Avg = 0.5%Japan 10-year Avg = 0.5%
Source: ESRI, Merrill Lynch forecasts

June 18, 2003
-4.9
-3.8
-5.5
-7.1-7.4 -7.2
-7.7-7.4
-9.0
-8.0
-7.0
-6.0
-5.0
-4.0
-3.0
-2.0
-1.0
0.0
19
96
19
97
19
98
19
99
20
00
20
01
20
02
20
03
F
Fiscal Laxity has Created Public Debt ProblemFiscal Laxity has Created Public Debt Problem
Japan Budget Balanceas % of GDP
Japan Gross Public Debtas % of GDP
Source: IMF World Economic Outlook, April 2003
92
108
134
154162
0
20
40
60
80
100
120
140
160
180
19
96
19
98
20
00
20
02
20
03
F

June 18, 2003
Slow Progress on Japanese Bank RestructuringSlow Progress on Japanese Bank Restructuring
A few major banks start to deal with bad loans and strengthen their capital base
But…
Under-provisioning for bad loans persists
Weak capital base and low profitability of banks limit speed of bad loan disposal
Market confidence in financial sector is low

June 18, 2003
Asian Economic OutlookAsian Economic Outlook
Growth remains strong across Asian region: China and India insulated by strong local markets Tech-dependent Asia pulled by policy easing
Countries with strong policy frameworks experience stronger growth
High level of foreign reserves and current account surpluses have reduced vulnerability
Incomplete corporate and bank restructuring
Solid Recovery Continues In 2003Solid Recovery Continues In 2003

June 18, 2003
Latin America Economic OutlookLatin America Economic Outlook
Smaller fiscal deficits and lower inflation are key
Corporate governance and political stability remain critical factors
Region dependent on capital inflows
Argentina: needs to be reborn Brazil: on the road to recovery Mexico and Chile: bright spotsVenezuela, Ecuador and Peru: in trouble
Outlook Reflects Domestic Policies and US GrowthOutlook Reflects Domestic Policies and US Growth

June 18, 2003
If US and Europe Stay the Course, Global If US and Europe Stay the Course, Global Recessionary Deflation Will Be AvoidedRecessionary Deflation Will Be Avoided
Global Recessionary Deflation?Global Recessionary Deflation?
US: Very unlikely Flexible and competitive economy High productivity growth Decisive policy response
Euroland: Unlikely but watch for Germany Benefits from single currency and convergence Structural rigidities Political and institutional challenges
Japan: In the midst of deflation Rigid policy framework Needs financial restructuring

END