products processes customers
TRANSCRIPT
M Y E R S I N D U ST R I E S , I N C . 2 0 01 A N N U A L R E P O RT
P R I N C I P L E S F O R G R O W T H .
P R O D U C T S . . .
P R O C E S S E S . . .
C U S T O M E R S . . .
C O M P A N Y P R O F I L E
C O M P A N Y P R O F I L E –
Inside Front Cover
TABLE OF CONTENTS
M Y E R S I N D U S T R I E S M I L E S T O N E S –
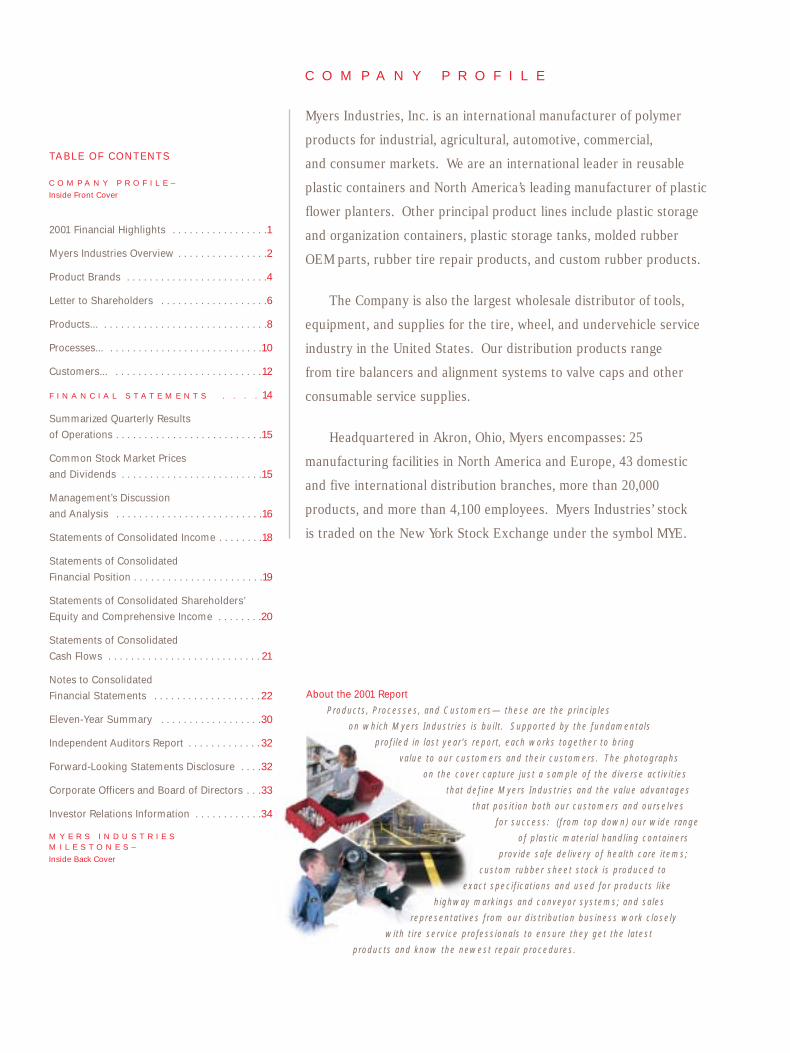
About the 2001 Report
Products, Processes, and Customers— these are the principles
on which Myers Industries is built. Supported by the fundamentals
profiled in last year’s report, each works together to bring
value to our customers and their customers. The photographs
on the cover capture just a sample of the diverse activities
that define Myers Industries and the value advantages
that position both our customers and ourselves
for success: (from top down) our wide range
of plastic material handling containers
provide safe delivery of health care items;
custom rubber sheet stock is produced to
exact specifications and used for products like
highway markings and conveyor systems; and sales
representatives from our distribution business work closely
with tire service professionals to ensure they get the latest
products and know the newest repair procedures.
Myers Industries, Inc. is an international manufacturer of polymer
products for industrial, agricultural, automotive, commercial,
and consumer markets. We are an international leader in reusable
plastic containers and North America’s leading manufacturer of plastic
flower planters. Other principal product lines include plastic storage
and organization containers, plastic storage tanks, molded rubber
OEM parts, rubber tire repair products, and custom rubber products.
The Company is also the largest wholesale distributor of tools,
equipment, and supplies for the tire, wheel, and undervehicle service
industry in the United States. Our distribution products range
from tire balancers and alignment systems to valve caps and other
consumable service supplies.
Headquartered in Akron, Ohio, Myers encompasses: 25
manufacturing facilities in North America and Europe, 43 domestic
and five international distribution branches, more than 20,000
products, and more than 4,100 employees. Myers Industries’ stock
is traded on the New York Stock Exchange under the symbol MYE.
Inside Back Cover
2001 Financial Highlights . . . . . . . . . . . . . . . . .1
Myers Industries Overview . . . . . . . . . . . . . . . .2
Product Brands . . . . . . . . . . . . . . . . . . . . . . . . .4
Letter to Shareholders . . . . . . . . . . . . . . . . . . .6
Products... . . . . . . . . . . . . . . . . . . . . . . . . . . . . .8
Processes... . . . . . . . . . . . . . . . . . . . . . . . . . . .10
Customers... . . . . . . . . . . . . . . . . . . . . . . . . . .12
F I N A N C I A L S T A T E M E N T S . . . . 14
Summarized Quarterly Results
of Operations . . . . . . . . . . . . . . . . . . . . . . . . . .15
Common Stock Market Prices
and Dividends . . . . . . . . . . . . . . . . . . . . . . . . .15
Management’s Discussion
and Analysis . . . . . . . . . . . . . . . . . . . . . . . . . .16
Statements of Consolidated Income . . . . . . . .18
Statements of Consolidated
Financial Position . . . . . . . . . . . . . . . . . . . . . . .19
Statements of Consolidated Shareholders’
Equity and Comprehensive Income . . . . . . . .20
Statements of Consolidated
Cash Flows . . . . . . . . . . . . . . . . . . . . . . . . . . . 21
Notes to Consolidated
Financial Statements . . . . . . . . . . . . . . . . . . .22
Eleven-Year Summary . . . . . . . . . . . . . . . . . .30
Independent Auditors Report . . . . . . . . . . . . . 32
Forward-Looking Statements Disclosure . . . .32
Corporate Officers and Board of Directors . . .33
Investor Relations Information . . . . . . . . . . . .34

2 0 0 1 F I N A N C I A L H I G H L I G H T S
010099
NET SALES$ Millions
608.0652.7
580.8
010099
15.2
24.0
31.2
NET INCOME$ Millions
010099
.64
1.01
1.28
NET INCOMEPER SHARE$ Dollars
2001 NET SALESBy Business Segment
% Change
(6.9)
(33.4)
(36.7)
(36.6)
(13.8)
1.7
1.2
9.5
(0.3)
Operations for the Year
Net Sales
Income Before Taxes
Net Income
Net Income Per Common Share
Financial Position At Year-End
Working Capital
Shareholders’ Equity
Book Value Per Common Share
Other Data
Dividends Paid Per Common Share
Average Common Shares Outstanding
Dollars In Thousands (Except Per Share Data)
DISTRIBUTION
25 %
MANUFACTURING
75 %
2001
$607,950
27,240
15,191
.64
$91,719
217,526
9.12
.23
23,801,899
2000
$652,660
40,910
24,001
1.01
$106,417
213,903
9.01
.21
23,862,568
1
2
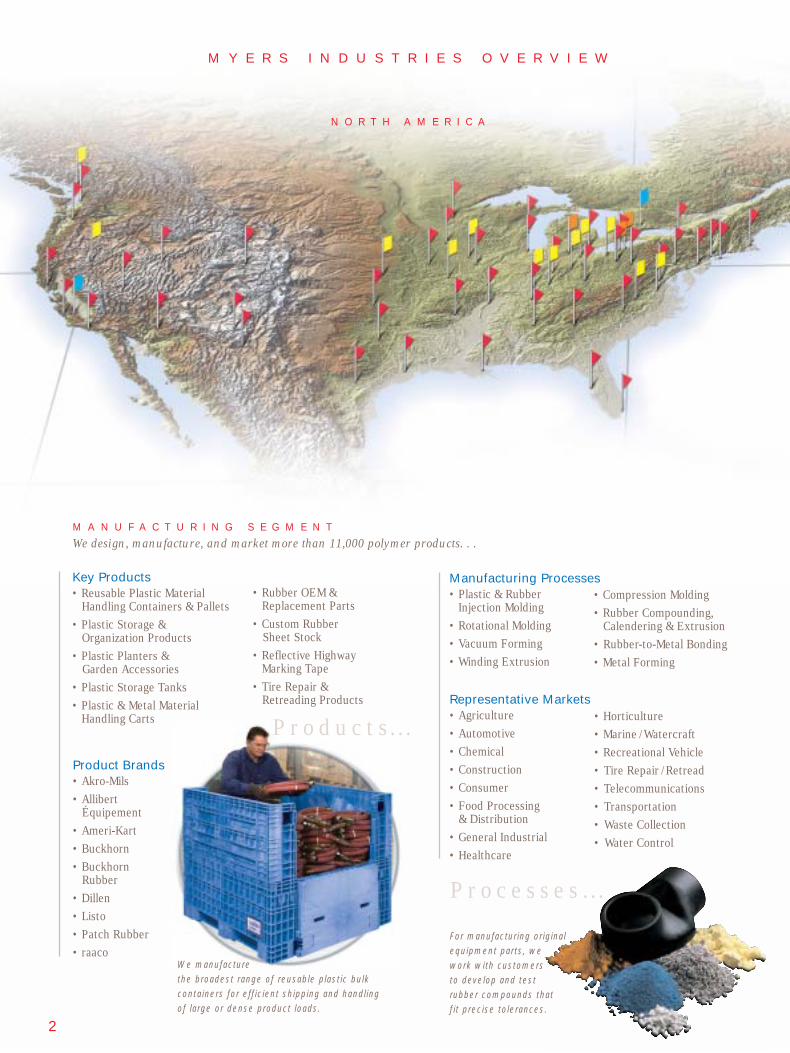
N O R T H A M E R I C A
Key Products• Reusable Plastic Material
Handling Containers & Pallets
• Plastic Storage & Organization Products
• Plastic Planters & Garden Accessories
• Plastic Storage Tanks
• Plastic & Metal Material Handling Carts
• Rubber OEM & Replacement Parts
• Custom Rubber Sheet Stock
• Reflective Highway Marking Tape
• Tire Repair & Retreading Products
M Y E R S I N D U S T R I E S O V E R V I E W
M A N U F A C T U R I N G S E G M E N T
We design, manufacture, and market more than 11,000 polymer products. . .
• Compression Molding
• Rubber Compounding, Calendering & Extrusion
• Rubber-to-Metal Bonding
• Metal Forming
Representative Markets• Agriculture
• Automotive
• Chemical
• Construction
• Consumer
• Food Processing & Distribution
• General Industrial
• Healthcare
• Horticulture
• Marine /Watercraft
• Recreational Vehicle
• Tire Repair /Retread
• Telecommunications
• Transportation
• Waste Collection
• Water Control
Manufacturing Processes• Plastic & Rubber
Injection Molding
• Rotational Molding
• Vacuum Forming
• Winding Extrusion
Product Brands• Akro-Mils
• Allibert Équipement
• Ameri-Kart
• Buckhorn
• Buckhorn Rubber
• Dillen
• Listo
• Patch Rubber
• raacoWe manufacture the broadest range of reusable plastic bulkcontainers for efficient shipping and handling of large or dense product loads.
For manufacturing originalequipment parts, we work with customers to develop and test rubber compounds thatfit precise tolerances.
P r o c e s s e s . . .
P r o d u c t s . . .
A Focused Business Approach for Growth. . .
• Concentrate on markets where our
products and expertise create profit
opportunities for our customers
and ourselves.
• Achieve leadership in key product
areas through breadth of offering,
consistent quality, and superior
customer service.
• Drive internal growth with new
products, line extensions, and
new technology.
• Leverage brand equity and capabilities
to increase business with existing
customers and cultivate new ones.
• Investigate complementary acquisitions
with potential for long-term growth.
• Respond to opportunities that present
themselves and work to protect that
which has been gained.
. . .Supported by Strong Fundamentals to Increase Benefits for Our Customers and Our Shareholders:
• Long-Term Approach
• Consistent Quality
• Multiple Growth Platforms
• Diverse Product Offering
• Complementary Acquisitions
• International Reach
• Brand Strength and Market Leadership
• Broad Distribution Capabilities
• Broad Manufacturing Capabilities
• Superior Customer Service
• Product Innovation
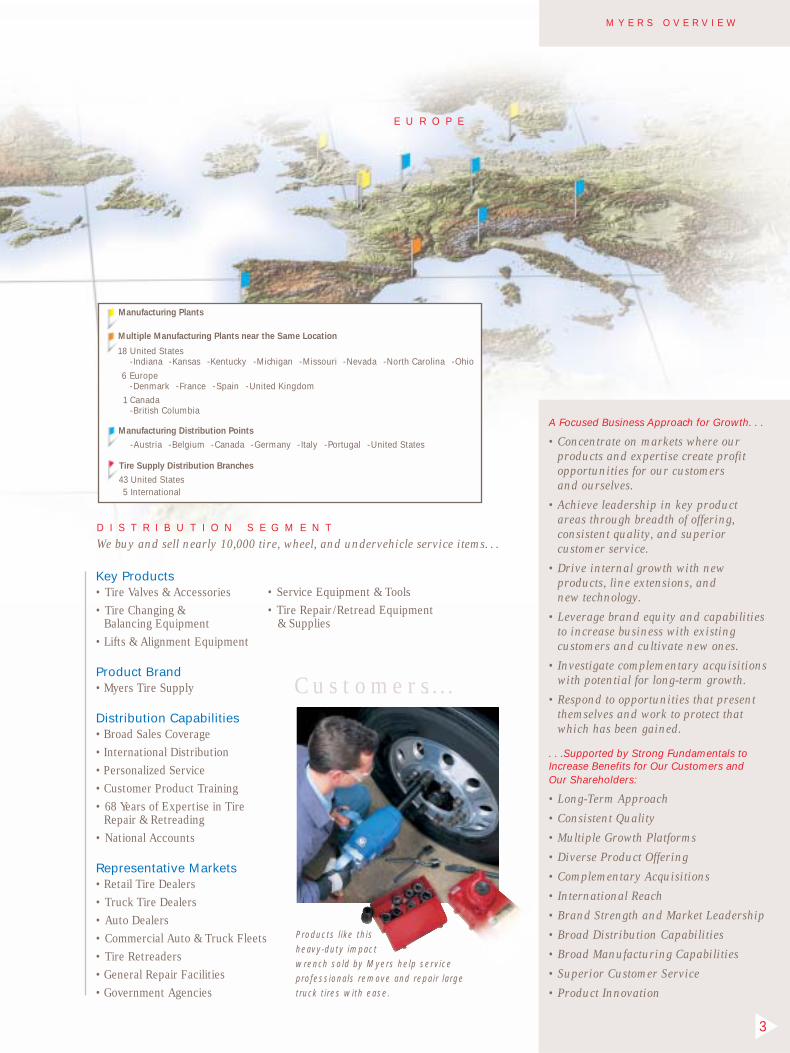
E U R O P E
D I S T R I B U T I O N S E G M E N T
We buy and sell nearly 10,000 tire, wheel, and undervehicle service items. . .
M Y E R S O V E R V I E W
3
Key Products• Tire Valves & Accessories
• Tire Changing & Balancing Equipment
• Lifts & Alignment Equipment
Product Brand• Myers Tire Supply
Distribution Capabilities• Broad Sales Coverage
• International Distribution
• Personalized Service
• Customer Product Training
• 68 Years of Expertise in TireRepair & Retreading
• National Accounts
Representative Markets• Retail Tire Dealers
• Truck Tire Dealers
• Auto Dealers
• Commercial Auto & Truck Fleets
• Tire Retreaders
• General Repair Facilities
• Government Agencies
• Service Equipment & Tools
• Tire Repair/Retread Equipment & Supplies
Products like this heavy-duty impact wrench sold by Myers help serviceprofessionals remove and repair large truck tires with ease.
C u s t o m e r s. . . .
18 United States-Indiana -Kansas -Kentucky -Michigan -Missouri -Nevada -North Carolina -Ohio
6 Europe-Denmark -France -Spain -United Kingdom
Multiple Manufacturing Plants near the Same Location
Manufacturing Plants
Manufacturing Distribution Points
-Austria -Belgium -Canada -Germany -Italy -Portugal -United States
Tire Supply Distribution Branches
43 United States5 International
1 Canada-British Columbia

Our Buckhorn reusable plastic container systems replace cardboard and wood containers to help customers reduce material handling costs. We offer one of North America’s mostcomprehensive selections of bulk and hand-held containers and pallets to meet producttransport and handling needs in industries from automotive to grocery. We also provide custom product design and manufacturing, plus services to help customers implementreusable container programs.
Buckhorn™
P R O D U C T B R A N D S
Akro-Mils® Industrial, commercial, and consumer users find storage, organization, and transport solutionswith our Akro-Mils plastic and metal products. Sold by distributors nationwide, our industrialcontainers and bins perform many tasks, from creating assembly workstations to transportingmedical supplies. Our Akro-Mils/RB-Dura™ line provides an extensive range of metal transport carts for industrial and commercial markets. Akro-Mils consumer products, sold by leading retailers, offer storage and organization efficiency with home, holiday, crafts, and office products.
MANUFACTURING SEGMENT
AllibertEquipment™´
Under our Ameri-Kart brand, we produce an extensive range of custom rotationally-moldedand vacuum-formed plastic parts including storage tanks, fenders, trim, and dashboards used to manufacture recreational vehicles. We also make specialty products for automotive,commercial, and agriculture markets. Other Ameri-Kart products include plastic carts used in material handling and residential waste collection.
Ameri-Kart™
4
Easily displaying plants for sale in a greenhouse. Efficiently linkingcomponents of the air system in the engine of a construction vehicle tomaintain top performance. Quickly repairing brake parts on semi-trucks to keep fleets moving coast-to-coast. No matter where Myers Industriesproducts are put to work, they contribute to our customers’ success byimproving productivity and profitability. Our brands have strong positions in diverse niche markets and draw from an extensive range of products,processes, and capabilities to increase value for our customers— and their customers.
In Europe, Myers makes the leading brand of reusable plastic material handling products, Allibert Équipement. Our broad range of bulk containers, totes, and pallets eliminate waste and improve productivity for customers in manufacturing, distribution, agriculture, and food businesses. We are also the leading manufacturer of plastic bulk storage tanks on the Continent. In sizes up to 50 cubic meters, these tanks replace stainless steel versions and are used for waste handling, water treatment, and chemical storage.

5
Buckhorn Rubber® Myers’ Buckhorn Rubber original equipment and replacement parts meet the performance needs of customers in waterworks, transportation, and other industries. Our engineered, molded products range from air intake hoses and hood latches for semi-trucks to gate seals for flood control dams and specialty parts for agriculture equipment. We also bond rubber to metal to develop products such as seals for water valves and vibration dampening bushings for axle assemblies.
Patch Rubber® Myers’ Patch Rubber brand has the most comprehensive line of tire repair and retreading products in the U. S. From tire plugs to specialty chemicals, these products repair everythingfrom small punctures in passenger tires to large breaks in construction vehicle tires. OtherPatch products include custom calendered rubber and sheet stock used in many industries as the base to create items such as golf grips and conveyor belt linings. Our rubber-based ATM™
reflective marking tape and symbols are applied by road construction professionals to replace paint for marking highways and road repair areas.
European customers know our raaco brand for plastic small item storage products. Our raaco bins and containers organize small parts in manufacturing operations. Serviceprofessionals transport repair items in our durable tool cases and cabinet systems, which are available in various sizes with compartments and inserts to organize different-size tools and parts. Our raaco products also provide consumers with storage solutions for home andsports, such as bin and rack systems for workshops and tackle boxes for fishing.
raaco™
Myers Tire Supply® We are the one-stop-shop for tire, wheel, and undervehicle service tools, equipment, and supplies under the Myers Tire Supply name. We buy from the leading manufacturers, and our product offering encompasses everything professionals need to service passenger, truck, and OTR tires and wheels— computerized alignment equipment, tire balancers, impact wrenches, tire repair plugs, small hand tools, and more. Myers also provides products for allied services, such as transmission, oil, brake, and cooling system maintenance.
DISTRIBUTION SEGMENT
P R O D U C T B R A N D S
Dillen Products™ With our Dillen and Listo brands, Myers manufactures the most extensive range of plastic planters in North America. The Myers offering includes indoor planters, pots, bowls, hanging baskets, window boxes, and grower trays. Combined with our Akro-Mils Specialty line of
outdoor decorative planters and garden accessories, Myers brings a comprehensive plastic planter offering to diverse customers: growers, greenhouses and nurseries, retail garden centers, mass merchandisers, and, ultimately, consumers.
Listo Products™
Dear Fellow Shareholders,
2001 was our worst year in a long time. The fourth quarter, typically
a strong one for us, was particularly weak. The recession that began
in 2000 accelerated and eroded activity in nearly every market.
Despite the challenges, the Company remained profitable.
We reduced working capital and employment; we constrained
investment and expenditure; we began activity based costing
reviews in some operations to better control our performance in
the faster-moving, more competitive environment; and we paid
down our debt, reducing it by 12 percent over the course
of the year.
Fourth Quarter and Full Year Financial Results
Net sales for the fourth quarter ended December 31, 2001, were
$148.5 million, a decrease of 13 percent from the $171.3 million
reported in 2000. Net income was $2.3 million, a decrease of
48 percent compared to $4.5 million in last year’s fourth quarter.
Net income per share of $.10 was down 47 percent compared
with $.19 in the fourth quarter of 2000.
At $608.0 million, net sales for the year ended December 31,
2001 were 7 percent below the prior year's record results of
$652.7 million. Net income was $15.2 million, a decrease of
37 percent from $24.0 million in 2000. Net income per share was
$.64, also a decrease of 37 percent from the $1.01 reported in 2000.
Excluding contributions from acquisitions, net sales would have
decreased 14 percent for the fourth quarter and 9 percent for the
full year of 2001. The translation effect of foreign currencies had
no material impact on sales and earnings for neither the quarter
nor the year.
Manufacturing Segment Overview
In the manufacturing segment, net sales were down 15 percent for
the fourth quarter and 7 percent for the year, compared to the same
periods in 2000. Excluding contributions from the RB Manufacturing
Company and Best Plastics acquisitions, made early in the fourth
quarter of 2000, manufacturing segment net sales would have
been 16 percent lower for the fourth quarter and 10 percent lower
for the year.
2001 was a tough year to be a manufacturer. As economic
conditions declined during the course of the year, industrial markets
served by our manufacturing segment were affected most severely.
Heavy-truck, recreational vehicle, and other manufacturing-based
businesses experienced a squeeze on their own revenues and profits.
Most companies responded by cutting spending, producing less,
and reducing inventories.
The effects of widespread consolidation, both within the
markets we serve and among competitors, further exacerbated
already-intense pressure on pricing within our product lines.
Although price variances for high-density polyethylene, the primary
raw material for the plastic products we manufacture, were favorable
throughout 2001, they were insufficient to offset lower demand
within the context of the intense price competition that resulted
from the overcapacity within the marketplace.
Distribution Segment Overview
Compared to 2000's fourth quarter and full year results, sales in
the distribution segment were down 6 percent for the quarter and
5 percent for the year. Lower sales of both passenger and truck
original equipment and replacement tires, plus weak demand for
service to both tires and wheels, as well as related undervehicle
components which our products support, hurt our performance
in this segment.
Product mix was consistent with that of the previous year,
weighted more toward consumable supplies than capital equipment.
During last year, we worked at expanding relationships with national
accounts to achieve exclusive or preferred supplier status. The
modest sales and profit decline in the distribution segment, when
compared to the manufacturing segment, particularly in the fourth
quarter, illustrates its relative stability.
6
L E T T E R T O S H A R E H O L D E R S

7
We believe Myers Tire Supply’s single-source supplier
strategy is sound. We possess extensive knowledge of the tire
service industry. We have the nationwide coverage to speed new
and existing products to market, and we enjoy close relationships
that our customers depend upon for training and support to help
them advance their business.
Cash Flow, Debt Reduction, and Capital Expenditures
Cash flow from operations was a record $76.8 million for the year,
an increase of 14 percent compared to $67.3 million in 2000.
We reduced our total debt by $35.3 million for the year, from
$300.2 million at the start of the year to $264.2 million at December
31, 2001. Debt as a percentage of capitalization was 54.9 percent
at the end of the year, down 6 percent from the previous year.
Capital expenditures for the year totaled $25.2 million,
42 percent lower than in 2000. Investments for tooling and equipment
over the last several years increased our capacity, not a necessary
commodity during a period of weakened sales.
Stock Performance and Return to Shareholders
Myers stock appreciated 3.6 percent during 2001, closing out the
year at $13.65 and outperforming most major market indexes. On
May 1, the shares of the Company began trading on the New York
Stock Exchange. Continuing in our belief that shareholders deserve
an ongoing return on their investment, in August the Board of
Directors declared a 10 percent stock dividend, marking the 26th
consecutive year in which they have increased the cash payout to
shareholders. Compared to 2000, shareholders’ equity increased
to $217.5 million, up 2 percent, and book value per share rose to
$9.12, an increase of 1 percent.
Summary
We hope that we have seen the worst of the economic obstacles,
and approach 2002 with cautious optimism.
In addition to the other areas of operational improvement, we
continue to review our manufacturing capacity needs and constraints,
deciding how best to align our product requirements, manufacturing
capabilities, and geographies for market needs going forward.
Board of Directors
The task of an outside Director has never been an easy one. It takes
many board meetings to get a sense of a business in which one has
no day-to-day involvement. Both management and shareholders of
Myers Industries have been fortunate in the intelligence, knowledge,
commitment, and dedication of its Board of directors.
It is with respect and appreciation that we acknowledge the
great contributions to the Company of Edwin P. Schrank and Samuel
Salem, who retire from the Board of Directors this term: Ed with
more than 30 years of service and Sam with over 15 years of service.
Both have aided the Company and its shareholders immeasurably.
I thank them for their valuable service, will miss their wise counsel
and companionship, and wish them good health and happiness.
We thank you, our shareholders, for continued confidence in
Myers Industries; our suppliers for their support; and our employees
for their commitment to serving our customers, building value,
and strengthening our business.
L E T T E R T O S H A R E H O L D E R S
Stephen E. MyersPresident and Chief Executive Officer
March 8, 2002
Respectfully submitted,

8
Cube Out, Cash InOne of the newest reusable containers from ourAllibert Équipement brand is "Crescendo," a foldingpallet box used to ship bulk products in closed-loopsupply chains. Set-up or collapsed, the boxes stackand fully utilize, or "cube," transport space— whichhelps customers improve freight costs for loadedincoming and empty outgoing containers.
M A N U F A C T U R I N G
Products from Myers Industries bring value to customers by helping them to reduce costs and build their business— from reusable material handling containers that protect food indistribution, to plugs and chemicals for safe tire repair, to wheelweights for accurate tire balancing. Bolstered by new products,line expansions, and acquisitions, our extensive product offeringin each business segment supports the needs of customers asdiverse as flower growers and truck service centers and helpsMyers to develop niche growth opportunities.
Innovation in CleaningAdding to our extensive line of carts, we entered a newniche market with the introduction of the AkroCleanTM
janitorial cart. The cart combines innovative storage,ergonomic, and sanitary features to boost efficiency
in industrial and commercial cleaning operations.
Working Under PressureMyers' Buckhorn Rubber brand air hoses and screenshelp filter the air and maintain consistent pressure inthe compressed air system of heavy trucks, while ourhood latches secure the engine covers. We offer awide range of molded rubber original equipment andreplacement parts for truck, agriculture, marine, and construction equipment.
P r o d
u c t s . . .
9
D I S T R I B U T I O N
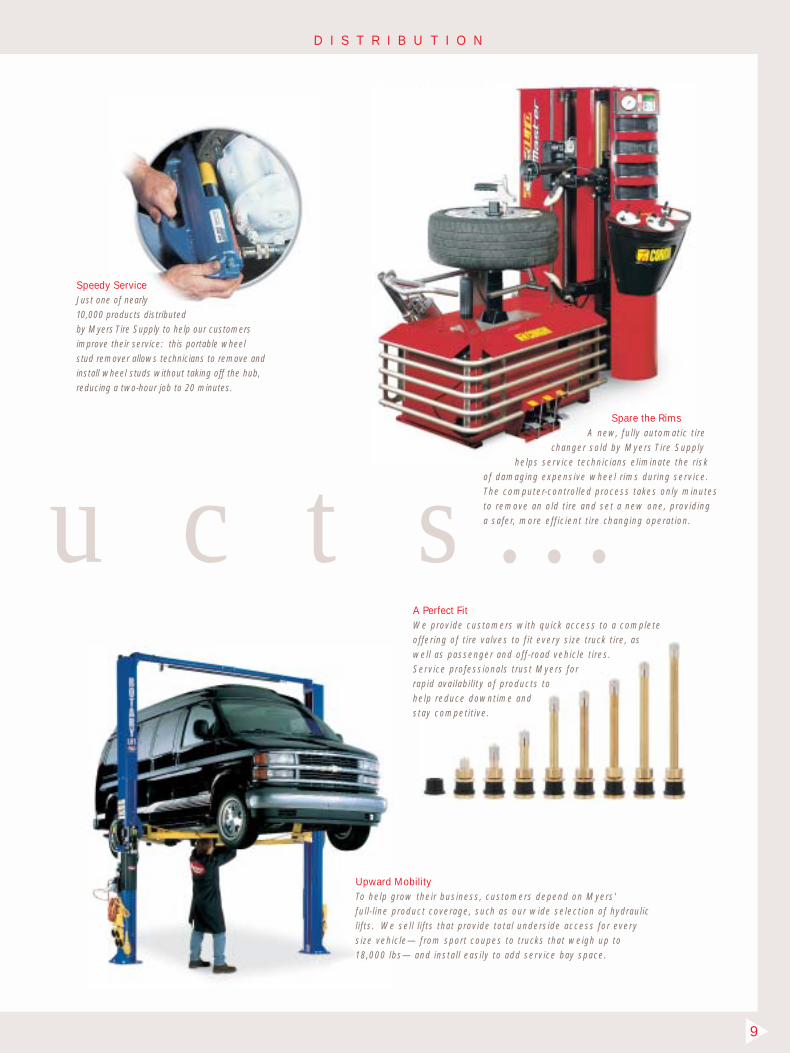
A Perfect FitWe provide customers with quick access to a completeoffering of tire valves to fit every size truck tire, as well as passenger and off-road vehicle tires. Service professionals trust Myers for rapid availability of products to help reduce downtime and stay competitive.
Spare the Rims A new, fully automatic tire
changer sold by Myers Tire Supplyhelps service technicians eliminate the risk
of damaging expensive wheel rims during service.The computer-controlled process takes only minutesto remove an old tire and set a new one, providing a safer, more efficient tire changing operation.
Speedy Service Just one of nearly 10,000 products distributed by Myers Tire Supply to help our customers improve their service: this portable wheel stud remover allows technicians to remove andinstall wheel studs without taking off the hub,reducing a two-hour job to 20 minutes.
Upward Mobility To help grow their business, customers depend on Myers' full-line product coverage, such as our wide selection of hydrauliclifts. We sell lifts that provide total underside access for everysize vehicle— from sport coupes to trucks that weigh up to18,000 lbs— and install easily to add service bay space.

10
Going Great Lengths for CustomersAt lengths up to 70" and heights up to 50", our new Buckhorn Extended Length Bulk Box delivers design "firsts" to improve material handling. Structural foam-molded for strength, the reusable container's sides fold in a unique pattern to protect them against bowing, a condition which can create instability when loaded containers are stacked on one another. Doors on all sides allow easier interior access. For customers, the innovation increases safety and productivity in their supply chain.
Growth in the Aging ProcessMyers creates the natural beauty of aged stone and metal— in plastic planters. Through special injection-molding techniques,
the "Mojave" recreates stone texture and the "Versailles" portrays intricate metal engraving. The finishes differentiate
these new Listo products from competitors to give retailers and consumers the benefits of resin planters with authentic styles.
M A N U F A C T U R I N G
Visibly Bright IdeasLayered polymer construction, pressure-sensitive adhesives,and brilliant colors combine to provide superior wear and
visibility in Myers' rubber-based reflective tape, Advance Traffic Markings. Both temporary and permanent, the tape replaces paint for easier marking of roads with stripes and symbols, as well as identification of facility areas.
P r o c e
Processes, or capabilities, for Myers Industries are driven by acommitment to know customers' needs and provide superior productsand services that improve their work, whether it’s extruded-plasticstorage tanks for chemicals, molded-rubber seals for flood control dams,or quick access to undervehicle service equipment. In manufacturing,our engineering and molding of polymer products is backed by designinnovation and shared capabilities across brands to increase value for customers. In distribution, our product selection and nationwidecoverage helps service professionals avoid costly downtime.
Fabric scrimRubber base
Paint/clear coat Adhesive
Cross Section ATM Material
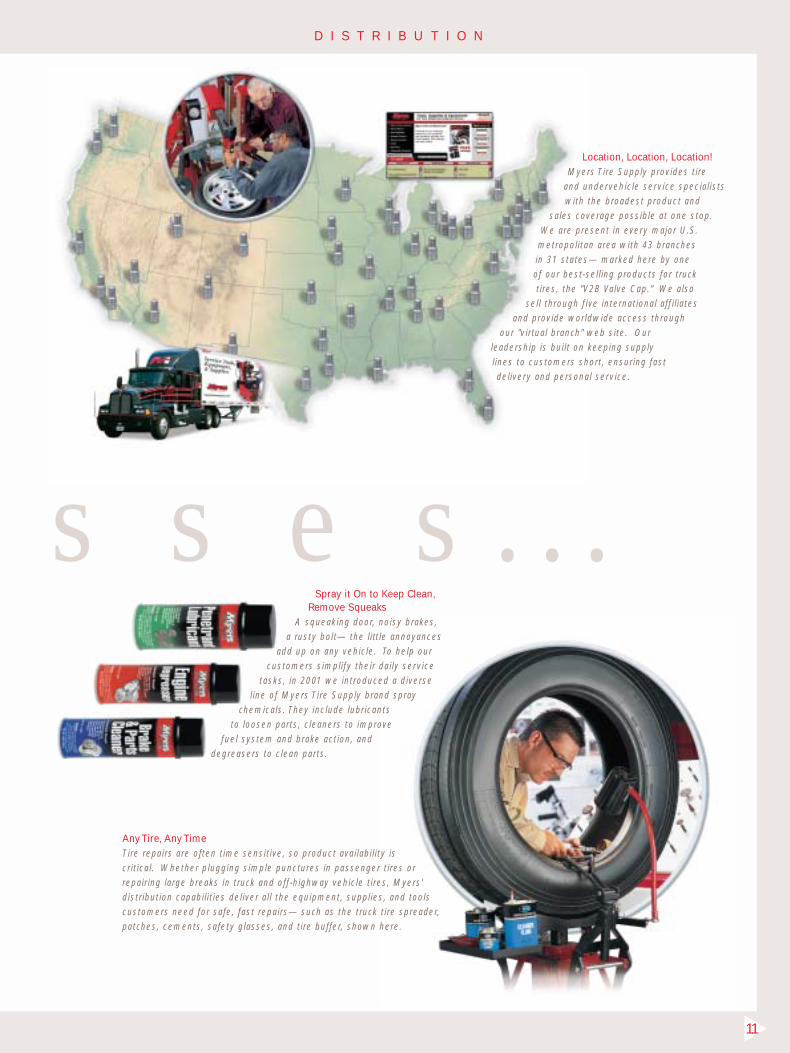
Location, Location, Location!Myers Tire Supply provides tire
and undervehicle service specialists with the broadest product and
sales coverage possible at one stop. We are present in every major U.S.
metropolitan area with 43 branches in 31 states— marked here by oneof our best-selling products for trucktires, the "V2B Valve Cap." We also
sell through five international affiliates and provide worldwide access through
our "virtual branch" web site. Our leadership is built on keeping supplylines to customers short, ensuring fast delivery and personal service.
11
Any Tire, Any TimeTire repairs are often time sensitive, so product availability is critical. Whether plugging simple punctures in passenger tires or repairing large breaks in truck and off-highway vehicle tires, Myers' distribution capabilities deliver all the equipment, supplies, and toolscustomers need for safe, fast repairs— such as the truck tire spreader,patches, cements, safety glasses, and tire buffer, shown here.
D I S T R I B U T I O N
Spray it On to Keep Clean,Remove Squeaks
A squeaking door, noisy brakes, a rusty bolt— the little annoyances
add up on any vehicle. To help our customers simplify their daily service
tasks, in 2001 we introduced a diverse line of Myers Tire Supply brand spray
chemicals. They include lubricantsto loosen parts, cleaners to improve
fuel system and brake action, and degreasers to clean parts.
s s e s . . .

12
M A N U F A C T U R I N G
C u s t o
Customers rely on products and processes from Myers Industries to add value in their business— helping them to grow with theircustomers. In manufacturing, value includes innovation andconsistent quality, such as designing a custom container that protects the finish on engines shipped to assembly points, orsupplying special rubber material to create the best-selling golf club grips. In distribution, value is product scope and knowledgebuilt on 68 years of close relationships with the people who service tires and related components.
Smoothing the RideWorking closely with customers, we improved the design of our Buckhorn
Rubber trailer bushings to provide longer life and better performance inabsorbing torque and vibration in semi-truck trailer suspensions. By relieving
more stress on suspension beams, the product innovation allows customers toproduce beams from lighter-weight materials, thereby reducing manufacturing costs.
Winging Our Way to Retail Shelves In 2001, we expanded our lawn and garden productoffering with new Akro-Mils plastic birdfeeders,birdbaths, and birdhouses. Unique designs anddurability, plus attractive display packaging,help to strengthen our ties with retailers and grow their sales in the popular "birder" market.
Value in the Fine PrintMyers adds value for customers through creative solutions. With our Dillen brand, we are a leader in providingplant growers with custom printing and labelapplication on plastic pots. Printing logos, barcodes, and planting tips on pots builds brandidentity for growers, speeds checkout for retailers,and provides consumers with easy plant care reference.

Relationships Make the DifferenceIn today's digital world, people still value relationships, and no one
gets closer to customers than Myers. Our goal is to meet customers' needs through product scope and service that
exceeds their expectations. Customers rely on face-to-face interaction with our sales professionals to gain
industry knowledge and train on new productsand service techniques. We emphasize
such close interaction to help customers grow and foster
loyal relationships.
Brake-ing New Ground Myers helps customers improve vehicle service efficiency by speeding the newest products to market. This computer-assisted brake lathe machines a rotor to factory specifications without removing it from the car, saving time and reducing the margin for error.
13
D I S T R I B U T I O N
Getting a Charge Under the HoodOur distribution expertise is not limited to tires, wheels, and brake components. We sell many products for coolant, transmission,and electrical service— like this battery tester for passenger cars and heavy-duty vehicles. The hand-held device prompts the technician through testing the battery, starter, and charging system in seconds. As customers' needs grow, we adapt to enhance the one-stop-shopping value they depend upon.
m e r s . . .

14
Summarized Quarterly Results of Operations . . . . . . . . . . . . . . . . .15
Common Stock Market Prices and Dividends . . . . . . . . . . . . . . . . .15
Management’s Discussion and Analysis . . . . . . . . . . . . . . . . .16 - 17
Statements of Consolidated Income . . . . . . . . . . . . . . . . . . . . . . . .18
Statements of Consolidated Financial Position . . . . . . . . . . . . . . . .19
Statements of Consolidated Shareholders’
Equity and Comprehensive Income . . . . . . . . . . . . . . . . . . . . . . . .20
Statements of Consolidated Cash Flows . . . . . . . . . . . . . . . . . . . .21
Notes to Consolidated Financial Statements
Summary of Significant Accounting Policies . . . . . . . . . . . . . .22
Acquisitions . . . . . . . . . . . . . . . . . . . . . . . . . . . . . . . . . . . . . . . .23
Retirement Plans . . . . . . . . . . . . . . . . . . . . . . . . . . . . . . . .23 - 24
Long-Term Debt and Credit Agreements . . . . . . . . . . . . . . . . .25
Leases . . . . . . . . . . . . . . . . . . . . . . . . . . . . . . . . . . . . . . . . . . . .25
Income Taxes . . . . . . . . . . . . . . . . . . . . . . . . . . . . . . . . . . . . . . .26
Stock Options . . . . . . . . . . . . . . . . . . . . . . . . . . . . . . . . . . . . . . 27
Industry Segments . . . . . . . . . . . . . . . . . . . . . . . . . . . . . . .28 - 29
Eleven-Year Summary . . . . . . . . . . . . . . . . . . . . . . . . . . . . . . . 30 - 31
Independent Auditors Report . . . . . . . . . . . . . . . . . . . . . . . . . . . . .32
Forward-Looking Statements Disclosure . . . . . . . . . . . . . . . . . . . .32
Corporate Officers and Board of Directors . . . . . . . . . . . . . . . . . . .33
Investor Relations Information . . . . . . . . . . . . . . . . . . . . . . . . . . . .34
F I N A N C I A L S T A T E M E N T S

15
The Company's Common Stock is traded on the New YorkStock Exchange (ticker symbol MYE). The approximate number
Summarized Quarterly Results of Operations(Unaudited) Thousands of Dollars, Except Per Share Data
Common Stock Market Prices and Dividends
2001
Quarter Ended Sales Price Dividends PaidHigh Low
March 31 14.55 10.01 .055June 30 14.18 11.14 .055September 30 13.82 10.70 .060December 31 14.58 10.90 .060
2000Quarter Ended Sales Price Dividends Paid
High LowMarch 31 13.22 9.66 .050June 30 11.83 8.88 .050September 30 12.95 9.09 .055December 31 13.41 8.75 .055
2001
Quarter Ended March 31 June 30 Sept. 30 Dec. 31 TotalNet sales $165,260 $152,738 $141,447 $148,505 $607,950 Gross profit 58,891 50,291 45,970 49,787 204,939 Net income 7,987 3,181 1,691 2,332 15,191 Per share .34 .13 .07 .10 .64
2000Quarter Ended March 31 June 30 Sept. 30 Dec. 31 TotalNet sales $161,586 $166,235 $153,548 $171,291 $652,660 Gross profit 56,954 57,135 47,815 55,674 217,578 Net income 8,332 8,059 3,150 4,460 24,001 Per share .34 .34 .14 .19 1.01
010099
.23
.21
.19
DIVIDENDSPER SHARE$ Millions
of record holders at December 31, 2001 was 2,200. High andlow stock prices and dividends for the last two years were:
010099
9.129.018.59
BOOK VALUEPER SHARE$ Dollars

16
Management’s Discussion and Analysis of Results
of Operations and Financial Condition
2001For the year ended December 31, 2001, net sales of $608.0 million were down 7 percent from the $652.7 millionin 2000. Net income for 2001 of $15.2 million or $.64 pershare decreased 37 percent from the $24.0 million and $1.01 per share reported in 2000.
The Company experienced sales declines in both of itsbusiness segments. Distribution segment sales were down$7.2 million or 5 percent reflecting lower unit volumes,particularly for capital equipment. In the Manufacturingsegment, sales decreased $37.7 million or 7 percent from the prior year as the Company experienced sharply lowerdemand brought on by the general recession and globaleconomic slowdown affecting most of the industrial marketswe serve. In addition, competitive pressures and lower rawmaterial costs resulted in conditions to maintain or lowerselling prices for most of the Company’s product lines andmarkets. Excluding the impact of acquired companies, salesin the manufacturing segment would have declined 10 percentand total sales would be down 9 percent for the year. Thetranslation effect of foreign currencies, primarily the euro, did not have a material impact with a difference of less than one percent on the sales amounts as reported.
Cost of sales decreased $32.1 million or 7 percent,reflecting the significant drop in fiscal 2001 sales. Grossprofit, expressed as a percentage of sales, improved slightlyto 33.7 percent for the year ended December 31, 2001,compared with 33.3 percent in the prior year. In the distributionsegment, margins improved slightly reflecting a shift in salesmix to higher margin supplies versus capital equipment. In the manufacturing segment, margins were virtuallyunchanged as the benefit of lower raw material costs wereoffset by slightly lower selling prices and a decrease in theabsorption of fixed manufacturing costs resulting fromreduced production.
Total operating expenses increased $4.7 million or 3 percentto $159.0 million. The increase in fiscal 2001 reflects the fullyear impact of expenses of companies acquired in the fourthquarter of last year as well as the amortization of relatedgoodwill. In addition, the Company experienced substantiallyhigher costs for medical insurance and bad debt expense,including approximately $1.0 million as a result of the K-Martbankruptcy filing in January 2002. Expressed as apercentage of sales, operating expenses were 26.1 percent in 2001 compared with 23.6 percent in 2000. This decreasein operating expense leverage is a result of both the highercosts and reduced sales volume in the current year.
Net interest expense for 2001 decreased $3.7 million or16 percent compared with the prior year. This decreasereflects primarily the impact of lower interest rates. Inaddition, the Company reduced total debt by $35.3 million
in fiscal 2001 and, therefore, received the benefit of loweraverage borrowing levels.
Income taxes as a percent of income before taxes was44.2 percent compared to 41.3 percent in the prior year. The higher effective tax rate reflects the more significantimpact of non-deductible goodwill amortization resultingfrom lower pretax income combined with higher foreign tax rate difference.
2000Net sales for the year ended December 31, 2000, increased$71.9 million or 12 percent to a record $652.7 million.Excluding contributions from acquisitions, total net saleswould have increased 3 percent. Sales in the distributionsegment decreased 2 percent for the year as sales of capitalequipment, the more cyclical part of the distributionsegment, continued to be weak. In the manufacturingsegment, sales increased 18 percent over the comparable 12 months. Excluding acquisitions, sales in the manufacturingsegment increased 5 percent for the year. The translationeffect of the euro reduced both total sales and manufacturingsegment sales by $20.0 million for the year. Without thetranslation effect and excluding acquisitions, both total sales and manufacturing segment sales would haveincreased 6 percent for the year.
Cost of sales increased $67.4 million or 18 percentreflecting the higher sales levels and increased cost of rawmaterials, mainly plastic resins, which reduced gross profitas a percentage of sales from 36.7 percent in 1999 to 33.3 percent in 2000.
Total operating expenses increased $10.7 million or 7 percent to $154.3 million. Included in fourth quarter 2000general administrative expense were costs of approximately $3.2 million related to the closing of the Company’s Dayton,Ohio manufacturing facility. These costs were primarily tocover the estimated loss on disposition of the land,buildings, machinery and equipment and other fixed assetsused at the closed facility. Expressed as a percentage ofsales, total operating expenses were 23.6 percent in 2000and 24.7 percent in 1999. This improvement reflects thebenefit from greater integration of the various acquisitionsmade in 1999.
Net interest expenses increased $7.2 million to $22.4 million for the year. This increase reflects the higheraverage borrowing levels resulting from acquisitionscombined with slightly higher rates.
Income taxes as a percent of income before taxes was41.3 percent for 2000 compared to 42.6 percent in the prior year. This decrease is attributable to foreign tax rate differences.
Results Of Operations

17
Management’s Discussion and Analysis of Results
of Operations and Financial Condition
Financial Condition
Liquidity and Capital ResourcesIn 2001, the Company generated cash from operatingactivities of $76.8 million. Investments in property, plant and equipment were $25.2 million. In 2001, total debt wasreduced by $35.3 million and debt as a percentage of totalcapitalization was reduced from 58 percent to 55 percent.At December 31, 2001, the Company had working capital of $91.7 million and a current ratio of 1.9 to 1.
At December 31, 2001, available borrowing under theCompany’s revolving credit facility was approximately $47 million. In addition, there is an uncommitted $25 millionspringing facility. During the next five years managementanticipates on-going capital expenditures in the range of $25 to $30 million annually. Cash flows from operations and funds available under existing credit facilities willprovide the Company’s primary source of future financing.Management believes that it has sufficient financialresources to meet anticipated business requirements in the foreseeable future, including capital expenditures,dividends, working capital and debt service.
Market Risk and Derivative Financial InstrumentsThe Company has financing arrangements that requireinterest payments based on floating interest rates. As such,the Company’s financial results are subject to changes in the market rate of interest. Our objective in managing theexposure to interest rate changes is to limit the volatility andimpact of rate changes on earnings while maintaining thelowest overall borrowing cost. At present, the Company hasnot entered into any interest rate swaps or other derivativeinstruments to fix the interest rate on any portion of itsfinancing arrangements with floating rates. Accordingly,based on current debt levels at December 31, 2001, if marketinterest rates increase one percent, the Company's interestexpense would increase approximately $2.5 million.
Some of the Company’s subsidiaries operate in foreigncountries and, as such, their financial results are subject tothe variability that arises from exchange rate movements.The Company believes that foreign currency exchange ratefluctuations do not represent a significant market risk due to the nature of the foreign countries in which we operate,primarily Canada and Western Europe, as well as the size of those operations relative to the total Company.
The Company uses certain commodities, primarily plasticresins, in its manufacturing processes. As such, the cost ofoperations is subject to fluctuation as the market for thesecommodities changes. The Company monitors this risk butcurrently has no derivative contracts to hedge this risk,
however, the Company also has no significant purchaseobligations to purchase fixed quantities of such commoditiesin future periods.
Accounting Standards for Business Combinationsand GoodwillThe Financial Accounting Standards Board recently issued Statement of Financial Accounting Standard No. 141 (SFAS 141), “Business Combinations,” and SFAS 142, “Goodwill and Other Intangible Assets.” The statements are effective for the Company on January 1, 2002. These statements will result inmodifications relative to the Company’s accounting forgoodwill and other intangible assets. Specifically, theCompany will cease goodwill and certain intangible assetamortization beginning January 1, 2002. Upon adopting the new standards and cessation of amortization forgoodwill, the Company anticipates increases in annualincome before taxes of $9.2 million and earnings per shareof approximately $.30 per share. Additionally, intangibleassets, including goodwill, will be subject to newimpairment testing criteria. Other than the impact to futureearnings of eliminating goodwill amortization, the Companyhas not yet made a complete evaluation regarding theimpact of adoption on the Company’s financial statements,including the possible impairment of goodwill as recorded on the December 31, 2001, balance sheet.
18
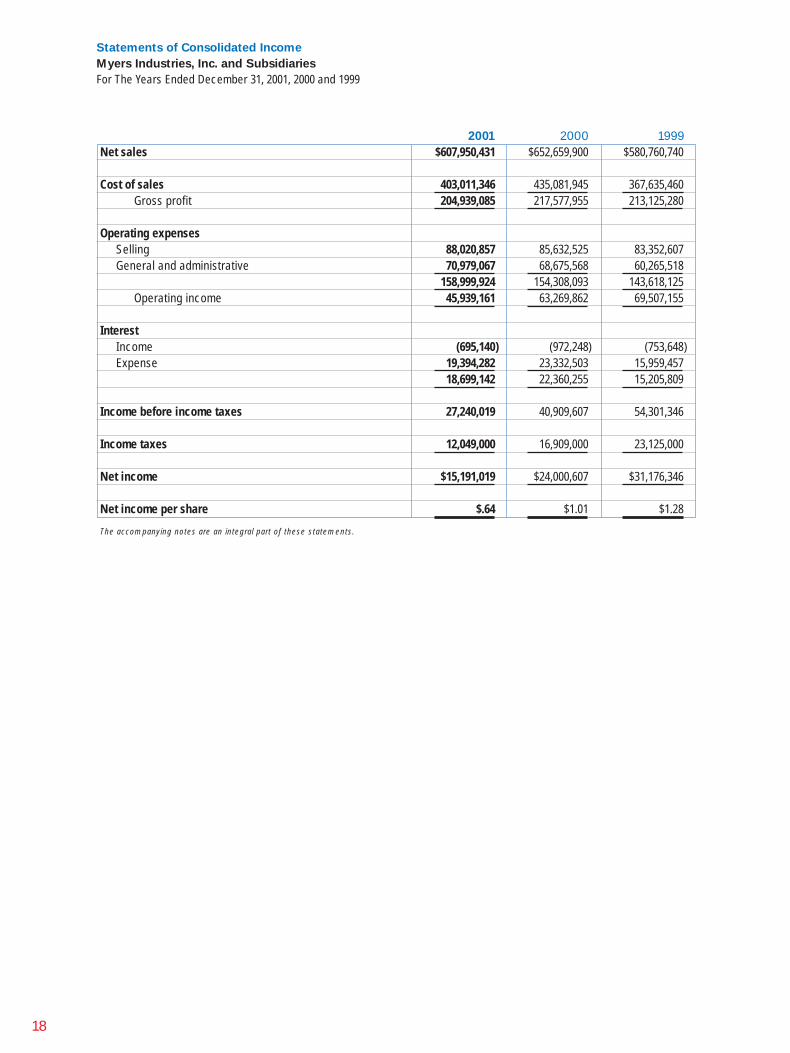
Statements of Consolidated Income
Myers Industries, Inc. and Subsidiaries
For The Years Ended December 31, 2001, 2000 and 1999
2001 2000 1999Net sales $607,950,431 $652,659,900 $580,760,740
Cost of sales 403,011,346 435,081,945 367,635,460 Gross profit 204,939,085 217,577,955 213,125,280
Operating expensesSelling 88,020,857 85,632,525 83,352,607 General and administrative 70,979,067 68,675,568 60,265,518
158,999,924 154,308,093 143,618,125 Operating income 45,939,161 63,269,862 69,507,155
InterestIncome (695,140) (972,248) (753,648)Expense 19,394,282 23,332,503 15,959,457
18,699,142 22,360,255 15,205,809
Income before income taxes 27,240,019 40,909,607 54,301,346
Income taxes 12,049,000 16,909,000 23,125,000
Net income $15,191,019 $24,000,607 $31,176,346
Net income per share $.64 $1.01 $1.28
The accompanying notes are an integral part of these statements.

19
Statements of Consolidated Financial Position
Myers Industries, Inc. and Subsidiaries
As of December 31, 2001 and 2000
2001 2000Current Assets
Cash and temporary cash investments $7,074,964 $2,177,983 Accounts receivable – less allowances
of $4,417,000 and $3,644,000, respectively 104,602,982 125,921,325 Inventories
Finished and in-process products 66,239,288 66,143,998 Raw materials and supplies 15,109,952 22,660,460
81,349,240 88,804,458 Prepaid expenses 3,591,411 2,403,487
Total Current Assets 196,618,597 219,307,253
Other AssetsExcess of cost over fair value of net assets of companies acquired 187,960,222 194,205,707 Patents and other intangible assets 2,834,582 2,955,593 Other 4,017,156 4,130,671
194,811,960 201,291,971 Property, Plant and Equipment, at Cost
Land 7,311,493 7,365,005 Buildings and leasehold improvements 73,983,923 72,727,170 Machinery and equipment 282,140,259 266,506,306
363,435,675 346,598,481 Less allowances for depreciation and amortization 172,699,854 145,093,735
190,735,821 201,504,746 $582,166,378 $622,103,970
2001 2000Current Liabilities
Accounts payable $44,818,664 $49,964,169 Accrued expenses
Employee compensation and related items 25,501,181 25,516,152 Taxes, other than income taxes 2,632,663 2,481,602 Accrued interest 1,207,733 2,834,366 Other 12,971,309 16,200,940
Current portion of long-term debt 17,767,688 15,893,001 Total Current Liabilities 104,899,238 112,890,230
Long-term Debt, less current portion 247,145,234 284,273,097
Deferred Income Taxes 12,595,697 11,037,935
Shareholders' EquitySerial Preferred Shares (authorized 1,000,000 shares) -- --Common Shares, without par value
(authorized 60,000,000 shares; outstanding 23,847,694and 23,749,013 shares, respectively) 14,503,828 13,234,830
Additional paid-in capital 217,594,648 189,779,843 Accumulated other comprehensive income (34,411,755) (27,149,716)Retained income 19,839,488 38,037,751
217,526,209 213,902,708 $582,166,378 $622,103,970
The accompanying notes are an integral part of these statements.
Assets
Liabilities and Shareholders' Equity
20
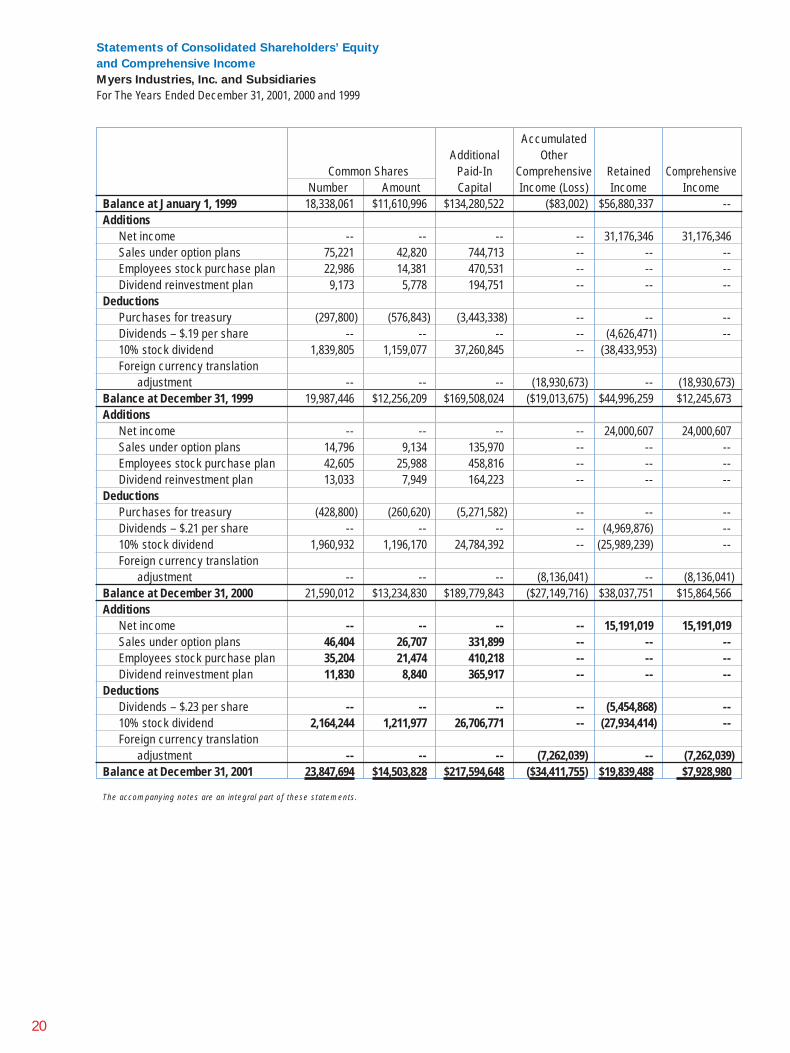
Statements of Consolidated Shareholders’ Equity
and Comprehensive Income
Myers Industries, Inc. and Subsidiaries
For The Years Ended December 31, 2001, 2000 and 1999
AccumulatedAdditional Other
Common Shares Paid-In Comprehensive Retained ComprehensiveNumber Amount Capital Income (Loss) Income Income
Balance at January 1, 1999 18,338,061 $11,610,996 $134,280,522 ($83,002) $56,880,337 --Additions
Net income -- -- -- -- 31,176,346 31,176,346 Sales under option plans 75,221 42,820 744,713 -- -- --Employees stock purchase plan 22,986 14,381 470,531 -- -- --Dividend reinvestment plan 9,173 5,778 194,751 -- -- --
DeductionsPurchases for treasury (297,800) (576,843) (3,443,338) -- -- --Dividends – $.19 per share -- -- -- -- (4,626,471) --10% stock dividend 1,839,805 1,159,077 37,260,845 -- (38,433,953) Foreign currency translation
adjustment -- -- -- (18,930,673) -- (18,930,673)Balance at December 31, 1999 19,987,446 $12,256,209 $169,508,024 ($19,013,675) $44,996,259 $12,245,673 Additions
Net income -- -- -- -- 24,000,607 24,000,607 Sales under option plans 14,796 9,134 135,970 -- -- --Employees stock purchase plan 42,605 25,988 458,816 -- -- --Dividend reinvestment plan 13,033 7,949 164,223 -- -- --
DeductionsPurchases for treasury (428,800) (260,620) (5,271,582) -- -- --Dividends – $.21 per share -- -- -- -- (4,969,876) --10% stock dividend 1,960,932 1,196,170 24,784,392 -- (25,989,239) --Foreign currency translation
adjustment -- -- -- (8,136,041) -- (8,136,041) Balance at December 31, 2000 21,590,012 $13,234,830 $189,779,843 ($27,149,716) $38,037,751 $15,864,566 Additions
Net income -- -- -- -- 15,191,019 15,191,019 Sales under option plans 46,404 26,707 331,899 -- -- --Employees stock purchase plan 35,204 21,474 410,218 -- -- --Dividend reinvestment plan 11,830 8,840 365,917 -- -- --
DeductionsDividends – $.23 per share -- -- -- -- (5,454,868) --10% stock dividend 2,164,244 1,211,977 26,706,771 -- (27,934,414) --Foreign currency translation
adjustment -- -- -- (7,262,039) -- (7,262,039)Balance at December 31, 2001 23,847,694 $14,503,828 $217,594,648 ($34,411,755) $19,839,488 $7,928,980
The accompanying notes are an integral part of these statements.
21
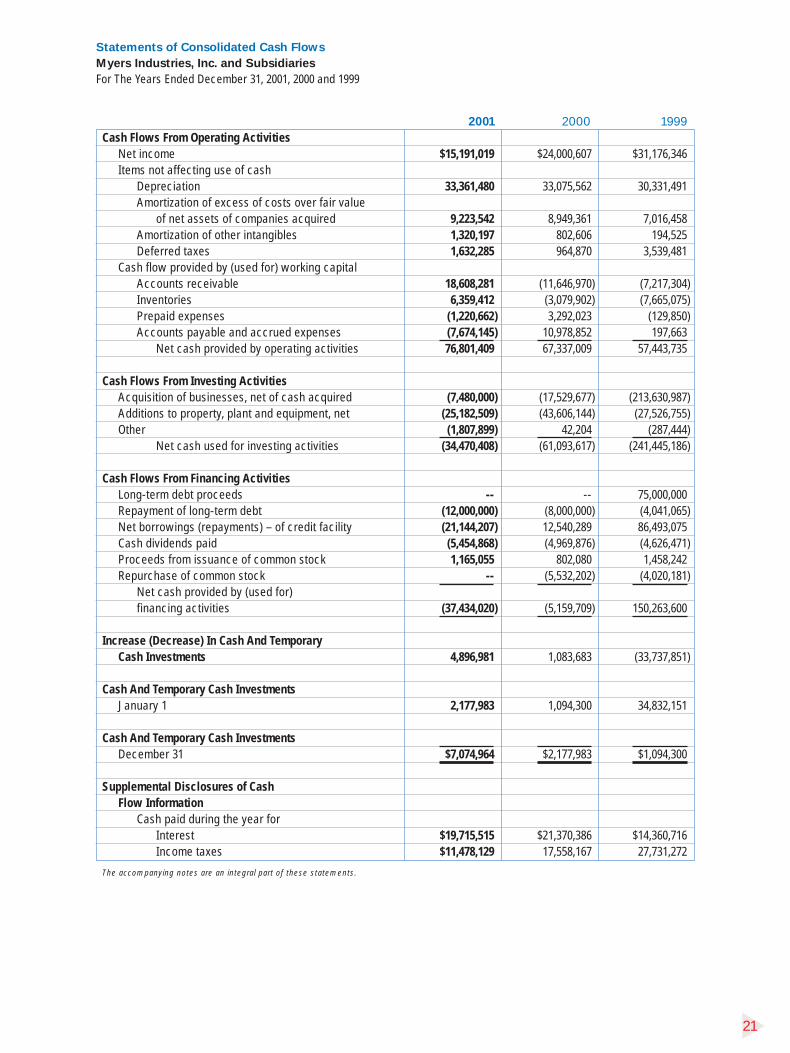
Statements of Consolidated Cash Flows
Myers Industries, Inc. and Subsidiaries
For The Years Ended December 31, 2001, 2000 and 1999
2001 2000 1999Cash Flows From Operating Activities
Net income $15,191,019 $24,000,607 $31,176,346 Items not affecting use of cash
Depreciation 33,361,480 33,075,562 30,331,491 Amortization of excess of costs over fair value
of net assets of companies acquired 9,223,542 8,949,361 7,016,458 Amortization of other intangibles 1,320,197 802,606 194,525 Deferred taxes 1,632,285 964,870 3,539,481
Cash flow provided by (used for) working capitalAccounts receivable 18,608,281 (11,646,970) (7,217,304) Inventories 6,359,412 (3,079,902) (7,665,075)Prepaid expenses (1,220,662) 3,292,023 (129,850) Accounts payable and accrued expenses (7,674,145) 10,978,852 197,663
Net cash provided by operating activities 76,801,409 67,337,009 57,443,735
Cash Flows From Investing ActivitiesAcquisition of businesses, net of cash acquired (7,480,000) (17,529,677) (213,630,987)Additions to property, plant and equipment, net (25,182,509) (43,606,144) (27,526,755)Other (1,807,899) 42,204 (287,444)
Net cash used for investing activities (34,470,408) (61,093,617) (241,445,186)
Cash Flows From Financing ActivitiesLong-term debt proceeds -- -- 75,000,000 Repayment of long-term debt (12,000,000) (8,000,000) (4,041,065)Net borrowings (repayments) – of credit facility (21,144,207) 12,540,289 86,493,075 Cash dividends paid (5,454,868) (4,969,876) (4,626,471)Proceeds from issuance of common stock 1,165,055 802,080 1,458,242 Repurchase of common stock -- (5,532,202) (4,020,181)
Net cash provided by (used for)financing activities (37,434,020) (5,159,709) 150,263,600
Increase (Decrease) In Cash And TemporaryCash Investments 4,896,981 1,083,683 (33,737,851)
Cash And Temporary Cash InvestmentsJanuary 1 2,177,983 1,094,300 34,832,151
Cash And Temporary Cash InvestmentsDecember 31 $7,074,964 $2,177,983 $1,094,300
Supplemental Disclosures of CashFlow Information
Cash paid during the year for Interest $19,715,515 $21,370,386 $14,360,716Income taxes $11,478,129 17,558,167 27,731,272
The accompanying notes are an integral part of these statements.

22
Basis of PresentationThe consolidated financial statements include the accountsof Myers Industries, Inc. and all wholly owned subsidiaries(Company). Significant intercompany accounts andtransactions have been eliminated in consolidation. Thepreparation of financial statements in conformity withgenerally accepted accounting principles requiresmanagement to make estimates and assumptions that affect the reported amounts of assets and liabilities anddisclosures at the date of the financial statements and thereported amount of revenues and expenses during thereported period. Actual results could differ from thoseestimates. Certain amounts in the fiscal 2000 and 1999financial statements have been reclassified to conform with the fiscal year 2001 presentation.
Translation of Foreign CurrenciesAll balance sheet accounts of consolidated foreignsubsidiaries are translated at the current exchange rate asof the end of the accounting period and income statementitems are translated at an average currency exchange rate.The resulting translation adjustment is recorded as aseparate component of shareholders' equity and othercomprehensive income.
Financial InstrumentsTemporary cash investments, all of which have an originalmaturity of 90 days or less, are considered cash equivalents.Other financial instruments, consisting of trade and notesreceivable, and long-term debt, are considered to have a fairvalue which approximates carrying value at December 31, 2001.
InventoriesInventories are stated at the lower of cost or market. Forapproximately 45 percent of its inventories, the Companyuses the last-in, first-out (LIFO) method of determining cost.All other inventories are valued at the first-in, first-out (FIFO)method of determining cost.
If the FIFO method of inventory cost valuation had beenused exclusively by the Company, inventories would havebeen $3,731,000, $4,756,000 and $3,779,000 higher thanreported at December 31, 2001, 2000 and 1999, respectively.
Property, Plant and EquipmentProperty, plant and equipment are carried at cost lessaccumulated depreciation and amortization. The Companyprovides for depreciation and amortization on the basis ofthe straight-line method over the estimated useful lives of the assets as follows:
Buildings 20 to 30 yearsLeasehold Improvements 7 to 10 yearsMachinery & Equipment 3 to 10 yearsVehicles 1 to 3 years
Notes To Consolidated Financial Statements
Myers Industries, Inc. and Subsidiaries
For The Years Ended December 31, 2001, 2000 and 1999
Summary of Significant Accounting Policies
Revenue RecognitionThe Company recognizes revenue from sales when goods are shipped and title has passed to the customer.
Income TaxesDeferred income taxes are provided to recognize the timingdifferences between financial statement and income taxreporting, principally for depreciation, non-deductiblereserves and certain valuation allowances. Deferred taxesare not provided on the unremitted earnings of foreignsubsidiaries as the Company's intention is to permanentlyreinvest these earnings in the operations of thesesubsidiaries. If these earnings would be remitted in futureyears, the taxes due after considering available foreign taxcredits would not be material.
Excess of Cost Over Fair Value of Net Assets ofCompanies AcquiredThis asset represents the excess of cost over the fair valueof net assets of companies acquired and is being amortizedon a straight-line basis over periods ranging from 15 to 40years. Accumulated amortization at December 31, 2001 and 2000 was $30,706,000 and $21,483,000, respectively.
In June 2001, the Financial Accounting Standards Boardissued statement of Financial Accounting Standard No. 141(SFAS 141), "Business Combinations," and SFAS 142,"Goodwill and Other Intangible Assets." These statementsare effective for the Company on January 1, 2002 and willresult in modifications relative to the accounting for goodwilland other intangible assets. Specifically, the Company willno longer amortize goodwill and certain intangible assets,however, such assets will be subject to periodic testing forpotential impairment. Upon adopting the new standards and cessation of amortization for goodwill, the Companyanticipates increases in annual income before taxes of $9.2 million and earnings per share of approximately $.30 per share, however, the Company has not yet made a complete evaluation regarding the impact of the newstandards, including the possible impairment of goodwill as recorded on the December 31, 2001 balance sheet.
Net Income Per ShareBasic net income per share, as shown on the Statements ofConsolidated Income, is determined on the basis of theweighted average number of common shares outstandingduring the year, and for all periods shown basic and dilutedearnings per share are identical. During the years endedDecember 31, 2001, 2000 and 1999, the Company paid a ten percent stock dividend. All per share data has beenadjusted for the stock dividends.

23
Notes To Consolidated Financial Statements
Myers Industries, Inc. and Subsidiaries
For The Years Ended December 31, 2001, 2000 and 1999
Acquisitions
In October, 2000, the Company acquired R.B. Manufacturing(RB), a Sandusky, Ohio manufacturer of material handlingcarts, and Best Plastics, Inc., a Cassopolis, Michiganmanufacturer of thermoformed and rotational molded plastic products. Total cost of the acquisitions wasapproximately $18.2 million and both acquisitions have been accounted for under the purchase method ofaccounting. The excess of purchase price over the fair value of assets acquired was approximately $12.4 millionwhich is being amortized on a straight line basis over 30 years. Consolidated pro-forma sales, income andearnings per share, adjusted to reflect the acquisitions of RB and Best, would not be materially different from thereported amounts for fiscal years 2000 or 1999.
On February 4, 1999, the Company acquired all of theshares of the entities comprising Allibert Équipement(Allibert), the material handling division of Sommer AllibertS.A., and acquired Allibert-Contico, LLC, a joint venturebetween Sommer Allibert S.A. and Contico International, Inc.,for a total purchase price of approximately $150 million. The acquired businesses have five manufacturing facilities in Europe and one in North America and had 1998 annualsales of approximately $145 million.
In August 1999, the Company acquired substantially all of the assets of Dillen Products Companies (Dillen) ofMiddlefield, Ohio for approximately $54 million and all of the outstanding shares of Listo Products, Ltd. (Listo) of
Canada for approximately $15 million. In 2001, the Companypaid approximately $7.5 million as additional and finalconsideration in connection with the acquisition of Dillen.The Listo purchase agreement provides for payment ofadditional consideration contingent upon future earnings of the acquired business through February 2002. TheCompany anticipates a payment of approximately $2.5million in 2002 as final consideration in connection with theacquisition of Listo. Dillen and Listo are leadingmanufacturers of plastic horticultural containers includingpots, trays, saucers and decorative planters for customersincluding greenhouses and nurseries as well as retail gardencenters and mass merchandisers.
The acquisitions have been accounted for under thepurchase method of accounting and, accordingly, the resultsof operations have been included in the Company’sconsolidated financial statements since the dates ofacquisition and the total acquisition costs have beenallocated to the assets acquired and liabilities assumedbased upon their estimated fair values, with the excess ofpurchase price over fair value of net assets acquired ofapproximately $166 million being amortized over lives of 15 to 40 years.
The following unaudited pro-forma information presents a summary of consolidated results of operations of theCompany and the acquisitions of Allibert, Dillen and Listo, as if the acquisitions had occurred January 1, 1999.
These unaudited pro-forma results have been prepared forcomparative purposes only and may not be indicative ofresults of operations which actually would have resulted
Fiscal Year Ended
(In thousands, except per share) December 31,
1999
Net Sales $625,407Net Income 31,759Net Income Per Share 1.31
had the combination been in effect on January 1, 1999, or of future results.
policy to fund pension costs accrued, which are at leastequal to the minimum required contribution as defined bythe Employee Retirement Income Security Act of 1974.
For the Company’s defined benefit plans, the net periodicpension cost was as follows:
The Company and certain of its subsidiaries have pensionand profit sharing plans covering substantially all of theiremployees. Two plans are defined benefit plans withbenefits primarily based upon a fixed amount for eachcompleted year of service as defined. It is the Company's
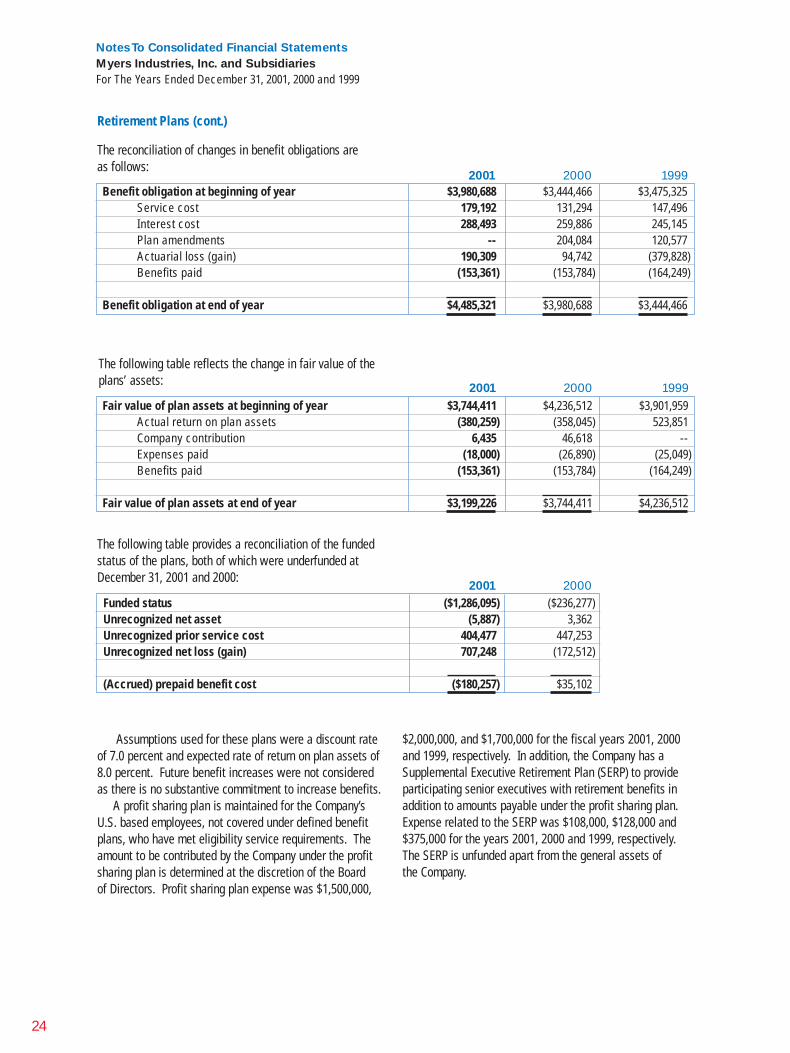
Retirement Plans
2001 2000 1999Service cost $179,192 $131,294 $147,496Interest cost 288,493 259,886 245,145Expected return on assets (291,192) (333,208) (304,447)Amortization of transition obligation 2,525 6,497 6,497Amortization of prior service cost 42,776 27,825 27,825Amortization of net gain -- (42,305) (6,046)
Net periodic pension cost $221,794 $49,989 $116,470
24
Assumptions used for these plans were a discount rateof 7.0 percent and expected rate of return on plan assets of 8.0 percent. Future benefit increases were not considered as there is no substantive commitment to increase benefits.
A profit sharing plan is maintained for the Company’sU.S. based employees, not covered under defined benefitplans, who have met eligibility service requirements. Theamount to be contributed by the Company under the profitsharing plan is determined at the discretion of the Board of Directors. Profit sharing plan expense was $1,500,000,
Notes To Consolidated Financial Statements
Myers Industries, Inc. and Subsidiaries
For The Years Ended December 31, 2001, 2000 and 1999
The following table reflects the change in fair value of theplans’ assets:
The following table provides a reconciliation of the fundedstatus of the plans, both of which were underfunded atDecember 31, 2001 and 2000:
2001 2000
$2,000,000, and $1,700,000 for the fiscal years 2001, 2000and 1999, respectively. In addition, the Company has aSupplemental Executive Retirement Plan (SERP) to provide participating senior executives with retirement benefits inaddition to amounts payable under the profit sharing plan.Expense related to the SERP was $108,000, $128,000 and$375,000 for the years 2001, 2000 and 1999, respectively.The SERP is unfunded apart from the general assets of the Company.
2001 2000 1999Fair value of plan assets at beginning of year $3,744,411 $4,236,512 $3,901,959
Actual return on plan assets (380,259) (358,045) 523,851Company contribution 6,435 46,618 --Expenses paid (18,000) (26,890) (25,049)Benefits paid (153,361) (153,784) (164,249)
Fair value of plan assets at end of year $3,199,226 $3,744,411 $4,236,512
2001 2000 1999Benefit obligation at beginning of year $3,980,688 $3,444,466 $3,475,325
Service cost 179,192 131,294 147,496Interest cost 288,493 259,886 245,145Plan amendments -- 204,084 120,577Actuarial loss (gain) 190,309 94,742 (379,828)Benefits paid (153,361) (153,784) (164,249)
Benefit obligation at end of year $4,485,321 $3,980,688 $3,444,466
The reconciliation of changes in benefit obligations areas follows:
Funded status ($1,286,095) ($236,277)Unrecognized net asset (5,887) 3,362Unrecognized prior service cost 404,477 447,253Unrecognized net loss (gain) 707,248 (172,512)
(Accrued) prepaid benefit cost ($180,257) $35,102
Retirement Plans (cont.)

25
Notes To Consolidated Financial Statements
Myers Industries, Inc. and Subsidiaries
For The Years Ended December 31, 2001, 2000 and 1999
Long-Term Debt and Credit Agreements
The Company has a Multi-Currency Loan Agreement with agroup of banks which provides for a $53.5 million term loanfacility and a revolving credit facility in five currencies,approximating $240 million (US). In addition, there is anuncommitted $25 million springing facility. Amountsavailable under the revolving credit facility are 185 millionUS dollars, 30 million euros, 22 million Canadian dollars, 63 million Danish kroners, and three million pound sterling. At December 31, 2001, the amount borrowed was $53.5 million under the term loan, and 157 million USdollars, 21 million euros, 15 million Canadian dollars, 40 million Danish kroners and two million pound sterlingunder the revolving credit facility.
The borrowing under this facility was used to retire theprior revolving credit agreement, fund acquisitions, and forgeneral corporate purposes. Interest is based upon LIBORfor US dollars and similar bases for the other currencies plusan applicable margin that varies depending on the Company’sratio of total debt to earnings before interest, taxes,depreciation and amortization (EBITDA). The current averageinterest rate on the outstanding advances at December 31,2001 is 3.97 percent. In addition, the Company pays aquarterly facility fee at a rate dependent on the EBITDAratio, and is currently 45 basis points. The Multi-CurrencyLoan Agreement expires in February 2005.
The Credit Agreement contains the customary covenantswhich include among other things, the maintenance ofcertain financial ratios regarding leverage, net worth,interest coverage, and limits as to payments for cashdividends and capital expenditures. At December 31, 2001,the Company was in compliance with all of its debt covenants.In addition, the facility restricts debt outside the facility to$35 million. At December 31, 2001, the Company had
$18.4 million borrowed against this limit consisting ofindustrial revenue bonds, certain indebtedness of acquiredcompanies, and in-country credit facilities for the Company’sinternational operations. The weighted average interest rateon these amounts outstanding is 4.7 percent.
Maturities of long-term debt for the five years endingDecember 31, 2006 are $18,000,000 in 2002; $17,000,000 in 2003; $27,000,000 in 2004; $195,000,000 in 2005 and$1,000,000 in 2006.
Leases
The Company and certain of its subsidiaries are committedunder non-cancelable operating leases involving certainfacilities and equipment. Aggregate rental expense for allleased assets was $9,493,000, $5,416,000 and $4,436,000for the years ended December 31, 2001, 2000 and 1999, respectively.
Future minimum rental commitments for the next fiveyears are as follows:
Long-term debt at December 31, consisted of the following:2001 2000
Revolving credit agreement $192,992,890 $214,461,680Term loan 53,500,000 65,500,000Industrial revenue bonds 4,000,000 4,000,000Other 14,420,032 16,204,418
264,912,922 300,166,098Less current portion 17,767,688 15,893,001
$247,145,234 $284,273,097
Year Ended December 31, Commitment
2002 $8,232,0002003 7,101,000 2004 5,931,0002005 5,284,000 2006 4,697,000

26
The effective tax rate was 44.2% in 2001, 41.3% in 2000and 42.6% in 1999. A reconciliation of the Federal statutoryincome tax rate to the Company's effective tax rate is as follows:
Percent of Pre-Tax Income
2001 2000 1999Statutory Federal income tax rate 35.0% 35.0% 35.0%State income taxes – net of Federal tax benefit 3.8 4.2 4.2Foreign tax rate differential 2.1 (.5) 2.1Effect of non-deductible depreciation and amortization 2.3 1.3 .7Other 1.0 1.3 .6Effective tax rate for the year 44.2% 41.3% 42.6%
Notes To Consolidated Financial Statements
Myers Industries, Inc. and Subsidiaries
For The Years Ended December 31, 2001, 2000 and 1999
Income Taxes
(Dollars in thousands)
2001 2000 1999Current Deferred Current Deferred Current Deferred
Federal $6,518 $2,140 $12,152 $671 $13,052 $3,250Foreign 2,322 (529) 1,457 (12) 3,190 9State and local 1,651 (53) 2,325 316 3,343 281
$10,491 $1,558 $15,934 $975 $19,585 $3,540
(Dollars in thousands)
2001 2000 Deferred income tax liabilities
Property, plant and equipment $19,689 $17,332Employee benefit trust 435 354 Other 388 969
20,512 18,655Deferred income tax assets
Compensation 3,276 2,945Inventory valuation 1,246 1,129Allowance for uncollectible accounts 971 733Non-deductible accruals 2,423 2,810
7,916 7,617 Net deferred income tax liability $12,596 $11,038
Significant components of the Company's deferred tax liabilities as of December 31, 2001 and 2000 are as follows:
Income taxes consisted of the following:
27
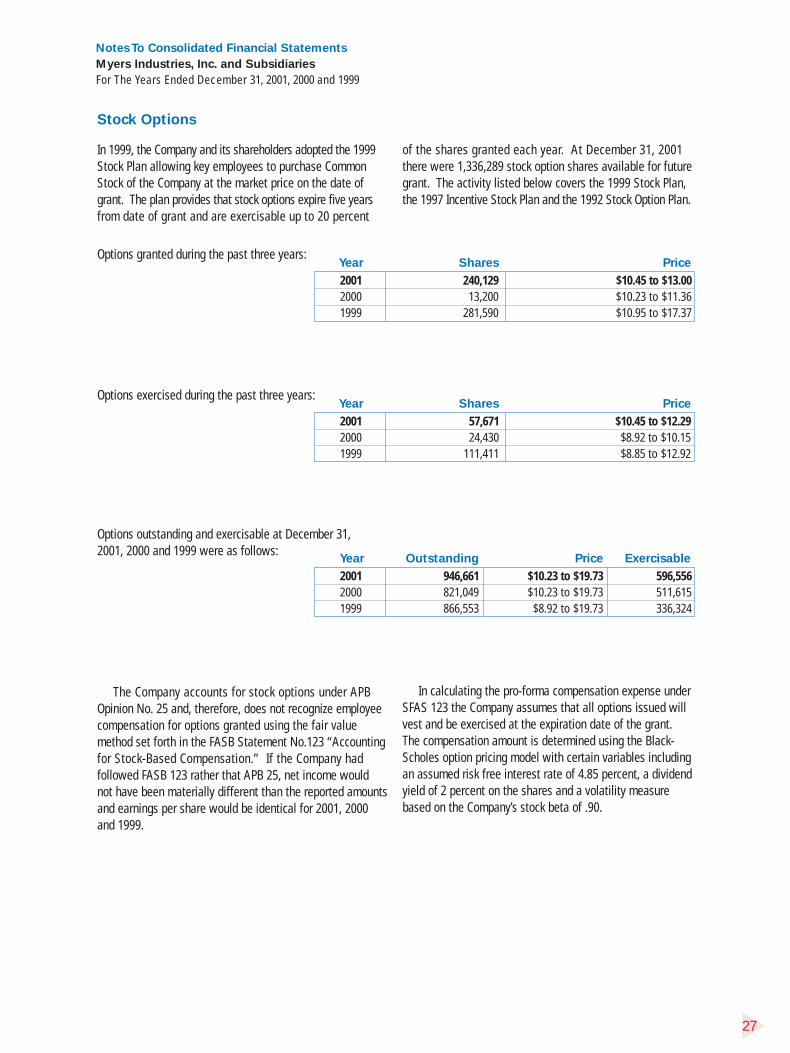
In 1999, the Company and its shareholders adopted the 1999Stock Plan allowing key employees to purchase CommonStock of the Company at the market price on the date ofgrant. The plan provides that stock options expire five yearsfrom date of grant and are exercisable up to 20 percent
Notes To Consolidated Financial Statements
Myers Industries, Inc. and Subsidiaries
For The Years Ended December 31, 2001, 2000 and 1999
of the shares granted each year. At December 31, 2001there were 1,336,289 stock option shares available for futuregrant. The activity listed below covers the 1999 Stock Plan,the 1997 Incentive Stock Plan and the 1992 Stock Option Plan.
Stock Options
The Company accounts for stock options under APB Opinion No. 25 and, therefore, does not recognize employeecompensation for options granted using the fair valuemethod set forth in the FASB Statement No.123 “Accountingfor Stock-Based Compensation.” If the Company hadfollowed FASB 123 rather that APB 25, net income would not have been materially different than the reported amountsand earnings per share would be identical for 2001, 2000and 1999.
In calculating the pro-forma compensation expense underSFAS 123 the Company assumes that all options issued willvest and be exercised at the expiration date of the grant.The compensation amount is determined using the Black-Scholes option pricing model with certain variables includingan assumed risk free interest rate of 4.85 percent, a dividendyield of 2 percent on the shares and a volatility measurebased on the Company’s stock beta of .90.
Options granted during the past three years:Year Shares Price
2001 240,129 $10.45 to $13.002000 13,200 $10.23 to $11.361999 281,590 $10.95 to $17.37
Options outstanding and exercisable at December 31, 2001, 2000 and 1999 were as follows:
Year Outstanding Price Exercisable
2001 946,661 $10.23 to $19.73 596,5562000 821,049 $10.23 to $19.73 511,6151999 866,553 $8.92 to $19.73 336,324
Options exercised during the past three years:Year Shares Price
2001 57,671 $10.45 to $12.292000 24,430 $8.92 to $10.151999 111,411 $8.85 to $12.92
28
Industry Segments
Notes To Consolidated Financial Statements
Myers Industries, Inc. and Subsidiaries
For The Years Ended December 31, 2001, 2000 and 1999
fiscal years 2001, 2000 and 1999, respectively. Sales of manufactured rubber products were $46.0 million, $50.8 million and $52.7 million for fiscal years 2001, 2000 and 1999.
Operating income for each segment is based on net sales less cost of products sold, and the related selling,administrative and general expenses. In computing segmentoperating income general corporate overhead expenses andinterest expenses are not included. The identifiable assetsof each segment include: accounts receivable, inventory, netfixed assets, excess of cost over fair value of net assetsacquired, patents and other intangible assets. Corporateassets are principally land, buildings, computer equipment,cash and temporary cash investments.
Total sales from foreign business units and export were approximately $182.0 million, $194.2 million and $173.8 million for the years 2001, 2000 and 1999,respectively. There are no individual foreign countries for which sales are material. Long-lived assets in foreigncountries consisting primarily of property, plant andequipment and excess of cost over fair value of net assetsacquired were approximately $113.3 million at December 31,2001 and $124.4 million at December 31, 2000. No singlecustomer accounts for 10 percent or more of total companynet sales or the net sales of either business segment.
The Company’s business units have separate managementteams and offer different products and services. Using thecriteria of FASB No.131, these business units have beenaggregated into two reportable segments; Distribution ofaftermarket repair products and services and Manufacturingof polymer products. The aggregation of business units isbased on management by the chief operating decision makerfor the segment as well as similarities of productionprocesses, distribution methods and economic charac-teristics (e.g. average gross margin and the impact ofeconomic conditions on long-term financial performance).
The Company’s distribution segment is engaged in thedistribution of equipment, tools and supplies used for tireservicing and undervehicle repair. The distribution segmentoperates domestically through 43 branches located in majorcities throughout the United States and in foreign countriesthrough export sales and businesses in which the Companyholds an equity interest.
The Company’s manufacturing segment designs,manufactures and markets a variety of polymer based plastic and rubber products. These products aremanufactured primarily through the molding process infacilities throughout the United States and in Europe. Salesto external customers for manufactured plastic productswere $411.1 million, $443.7 million and $366.2 million for

29
Notes To Consolidated Financial Statements
Myers Industries, Inc. and Subsidiaries
For The Years Ended December 31, 2001, 2000 and 1999
(Dollars in thousands)
2001 2000 1999Net Sales
Distribution of aftermarket repairproducts and services $150,932 $158,151 $161,827
Manufacturing of polymer products 470,387 508,070 432,462Intra-segment elimination (13,369) (13,561) (13,528)
$607,950 $652,660 $580,761
Income Before Income TaxesDistribution of aftermarket repair
products and services $14,733 $15,431 $17,580Manufacturing of polymer products 40,597 56,562 60,742Corporate (9,391) (8,723) (8,815)Interest expense—net (18,699) (22,360) (15,206)
$27,240 $40,910 $54,301
Identifiable AssetsDistribution of aftermarket repair
products and services $48,993 $57,136 $61,726Manufacturing of polymer products 528,775 563,637 537,722 Corporate 4,558 2,787 3,561Intra-segment elimination (160) (1,456) (2,599)
$582,166 $622,104 $600,410
Capital Additions, NetDistribution of aftermarket repair
products and services $29 $344 $384Manufacturing of polymer products 24,950 42,787 26,728 Corporate 206 475 415
$25,185 $43,606 $27,527
DepreciationDistribution of aftermarket repair
products and services $483 $496 $399Manufacturing of polymer products 32,172 31,965 29,212 Corporate 706 615 720
$33,361 $33,076 $30,331

2001 2000 1999 1998Operations for the Year
Net sales $607,950,431 $652,659,900 $580,760,740 $392,019,900Cost and expenses
Cost of sales 403,011,346 435,081,945 367,635,460 256,506,103Selling 88,020,857 85,632,525 83,352,607 47,959,466General and administrative 70,979,067 68,675,568 60,265,518 38,181,368Interest—net 18,699,142 22,360,255 15,205,809 887,873
580,710,412 611,750,293 526,459,394 343,534,810Income before income taxes 27,240,019 40,909,607 54,301,346 48,485,090Income taxes 12,049,000 16,909,000 23,125,000 19,806,000Net income $15,191,019 $24,000,607 $31,176,346 $28,679,090Net income per share* $.64 $1.01 $1.28 $1.18
Financial Position—at Year EndTotal assets $582,166,378 $622,103,970 $600,409,632 $306,707,788Current assets 196,618,597 219,307,253 206,990,990 153,650,201Current liabilities 104,899,238 112,890,230 102,244,419 51,233,510Working capital 91,719,359 106,417,023 104,746,571 102,416,691Other assets 194,811,960 201,291,971 203,923,134 43,614,594Property, plant and equipment—net 190,735,821 201,504,746 189,495,508 109,442,993Less:
Long-term debt 247,145,234 284,273,097 280,103,906 48,832,240Deferred income taxes 12,595,697 11,037,935 10,314,490 3,953,185
Shareholders’ Equity $217,526,209 $213,902,708 $207,746,817 $202,688,853Common Shares outstanding* 23,847,694 23,749,013 24,184,810 24,407,959Book value per Common Share* $9.12 $9.01 $8.59 $8.30Other Data
Dividends paid $5,454,870 $4,969,876 $4,626,471 $4,027,721Dividends paid per Common Share* .23 .21 .19 .17Average Common Sharesoutstanding during the year.* 23,801,899 23,862,568 24,401,973 24,363,691
30
608.0580.8
392.0
339.6320.9
300.7274.1
245.1229.3
195.6
652.7NET SALES$ Millions
01999897969594939291 00
15.2
31.2
28.7
22.3
21.0
16.0
17.8
15.4
13.1
10.5
24.0
NET INCOME$ Millions
01999897969594939291 00
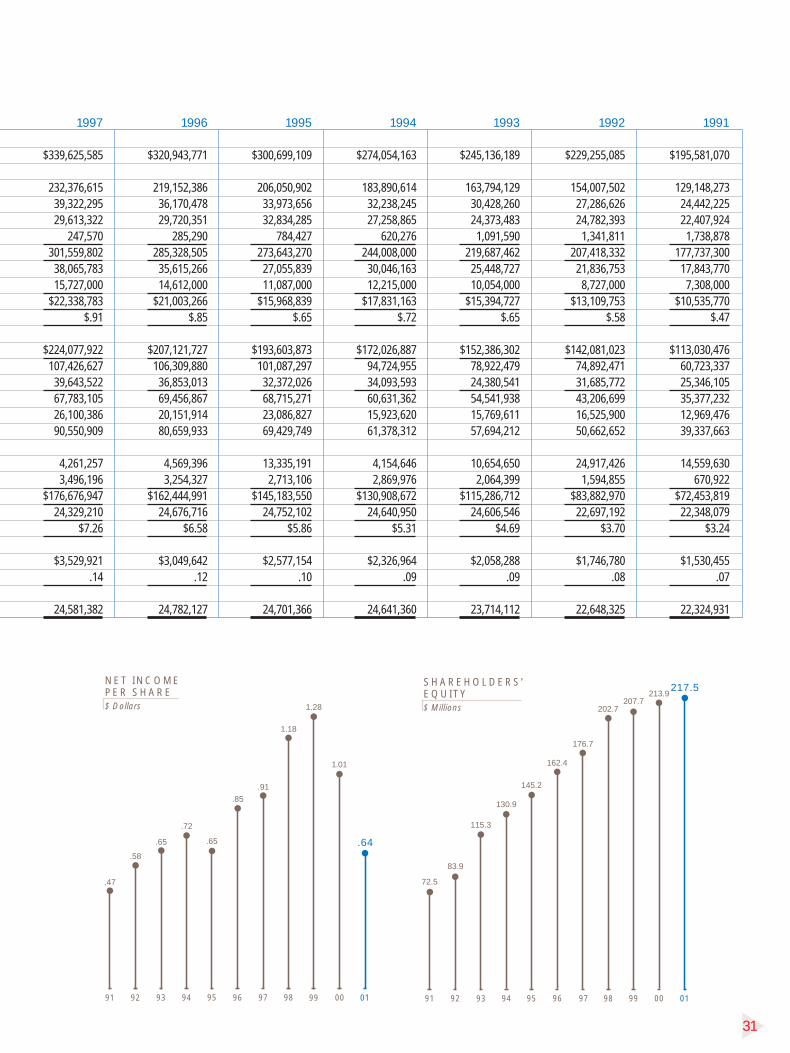
* Adjusted for the ten percent stock dividends paid in August, 2001; August, 2000; August, 1999; August, 1997; and August, 1995; the five-for-four stock split distributed in August, 1994; the ten percent stock dividend paid in August, 1993; the five-for-four stock split distributed in August, 1992; and the ten percent stock dividend paid in August, 1991.
Eleven-Year Financial Summary
Myers Industries, Inc. and Subsidiaries
1997 1996 1995 1994 1993 1992 1991
$339,625,585 $320,943,771 $300,699,109 $274,054,163 $245,136,189 $229,255,085 $195,581,070
232,376,615 219,152,386 206,050,902 183,890,614 163,794,129 154,007,502 129,148,27339,322,295 36,170,478 33,973,656 32,238,245 30,428,260 27,286,626 24,442,22529,613,322 29,720,351 32,834,285 27,258,865 24,373,483 24,782,393 22,407,924
247,570 285,290 784,427 620,276 1,091,590 1,341,811 1,738,878301,559,802 285,328,505 273,643,270 244,008,000 219,687,462 207,418,332 177,737,30038,065,783 35,615,266 27,055,839 30,046,163 25,448,727 21,836,753 17,843,77015,727,000 14,612,000 11,087,000 12,215,000 10,054,000 8,727,000 7,308,000
$22,338,783 $21,003,266 $15,968,839 $17,831,163 $15,394,727 $13,109,753 $10,535,770$.91 $.85 $.65 $.72 $.65 $.58 $.47
$224,077,922 $207,121,727 $193,603,873 $172,026,887 $152,386,302 $142,081,023 $113,030,476107,426,627 106,309,880 101,087,297 94,724,955 78,922,479 74,892,471 60,723,33739,643,522 36,853,013 32,372,026 34,093,593 24,380,541 31,685,772 25,346,10567,783,105 69,456,867 68,715,271 60,631,362 54,541,938 43,206,699 35,377,23226,100,386 20,151,914 23,086,827 15,923,620 15,769,611 16,525,900 12,969,47690,550,909 80,659,933 69,429,749 61,378,312 57,694,212 50,662,652 39,337,663
4,261,257 4,569,396 13,335,191 4,154,646 10,654,650 24,917,426 14,559,6303,496,196 3,254,327 2,713,106 2,869,976 2,064,399 1,594,855 670,922
$176,676,947 $162,444,991 $145,183,550 $130,908,672 $115,286,712 $83,882,970 $72,453,81924,329,210 24,676,716 24,752,102 24,640,950 24,606,546 22,697,192 22,348,079
$7.26 $6.58 $5.86 $5.31 $4.69 $3.70 $3.24
$3,529,921 $3,049,642 $2,577,154 $2,326,964 $2,058,288 $1,746,780 $1,530,455.14 .12 .10 .09 .09 .08 .07
24,581,382 24,782,127 24,701,366 24,641,360 23,714,112 22,648,325 22,324,931
31
217.5207.7
202.7
176.7
162.4
145.2
130.9
115.3
83.9
72.5
213.9
01999897969594939291 00
SHAREHOLDERS’EQUITY$ Millions
.64
1.01
1.28
1.18
.91
.85
.65
.72
.65
.58
.47
NET INCOMEPER SHARE$ Dollars
01999897969594939291 00
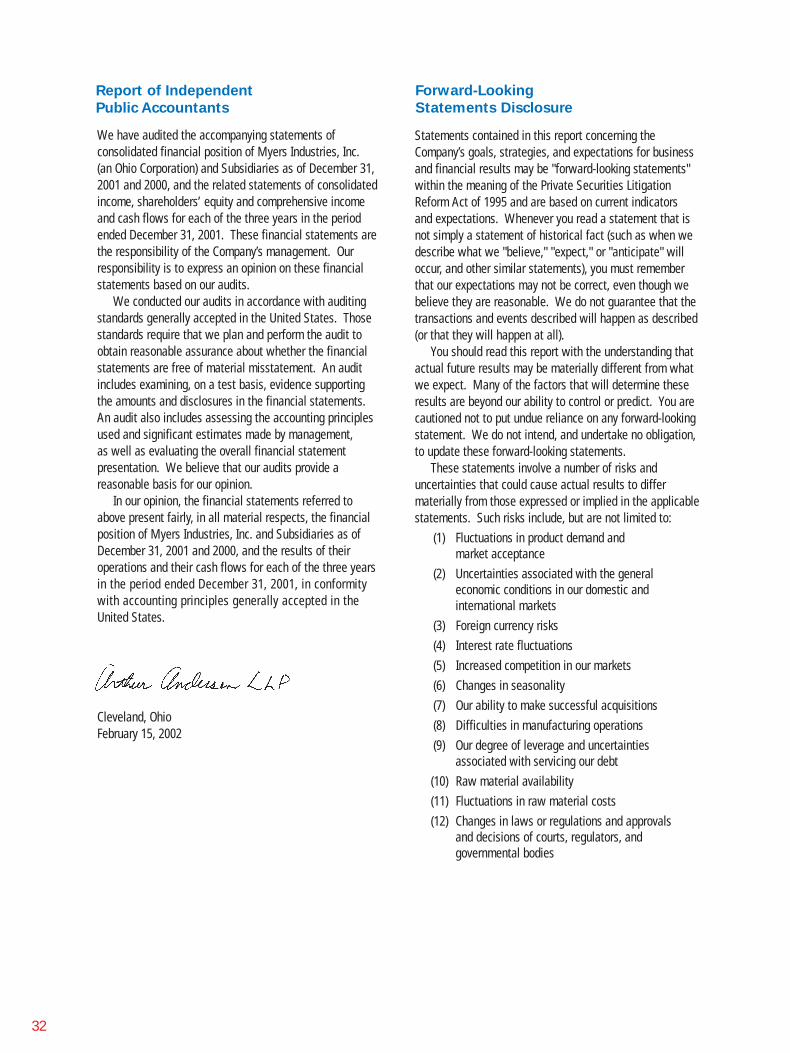
32
We have audited the accompanying statements ofconsolidated financial position of Myers Industries, Inc. (an Ohio Corporation) and Subsidiaries as of December 31,2001 and 2000, and the related statements of consolidatedincome, shareholders’ equity and comprehensive incomeand cash flows for each of the three years in the periodended December 31, 2001. These financial statements arethe responsibility of the Company’s management. Ourresponsibility is to express an opinion on these financialstatements based on our audits.
We conducted our audits in accordance with auditingstandards generally accepted in the United States. Thosestandards require that we plan and perform the audit toobtain reasonable assurance about whether the financialstatements are free of material misstatement. An auditincludes examining, on a test basis, evidence supportingthe amounts and disclosures in the financial statements.An audit also includes assessing the accounting principlesused and significant estimates made by management, as well as evaluating the overall financial statementpresentation. We believe that our audits provide areasonable basis for our opinion.
In our opinion, the financial statements referred toabove present fairly, in all material respects, the financialposition of Myers Industries, Inc. and Subsidiaries as ofDecember 31, 2001 and 2000, and the results of theiroperations and their cash flows for each of the three yearsin the period ended December 31, 2001, in conformity with accounting principles generally accepted in the United States.
Cleveland, OhioFebruary 15, 2002
Report of Independent
Public Accountants
Forward-Looking
Statements Disclosure
Statements contained in this report concerning theCompany’s goals, strategies, and expectations for businessand financial results may be "forward-looking statements"within the meaning of the Private Securities LitigationReform Act of 1995 and are based on current indicators and expectations. Whenever you read a statement that isnot simply a statement of historical fact (such as when wedescribe what we "believe," "expect," or "anticipate" willoccur, and other similar statements), you must rememberthat our expectations may not be correct, even though webelieve they are reasonable. We do not guarantee that thetransactions and events described will happen as described(or that they will happen at all).
You should read this report with the understanding thatactual future results may be materially different from whatwe expect. Many of the factors that will determine theseresults are beyond our ability to control or predict. You arecautioned not to put undue reliance on any forward-lookingstatement. We do not intend, and undertake no obligation,to update these forward-looking statements.
These statements involve a number of risks and uncertainties that could cause actual results to differ materially from those expressed or implied in the applicablestatements. Such risks include, but are not limited to:
(1) Fluctuations in product demand and market acceptance
(2) Uncertainties associated with the general economic conditions in our domestic and international markets
(3) Foreign currency risks(4) Interest rate fluctuations(5) Increased competition in our markets(6) Changes in seasonality(7) Our ability to make successful acquisitions(8) Difficulties in manufacturing operations(9) Our degree of leverage and uncertainties
associated with servicing our debt(10) Raw material availability(11) Fluctuations in raw material costs(12) Changes in laws or regulations and approvals
and decisions of courts, regulators, and governmental bodies

33
Keith A. Brown
President and Chief Executive OfficerChimera Corp.
Karl S. Hay
Former Of Counsel, Brouse McDowellA Legal Professional Association
Richard P. Johnston
Chairman of the Board Merbanco, Inc.
Michael W. Kane
PresidentM. Kane & Company, Inc.
Edward W. Kissel
PresidentO.M. Group
Stephen E. Myers
President and Chief Executive Officer
Richard L. Osborne
Executive Dean, Weatherhead School of ManagementCase Western Reserve University
Jon H. Outcalt
Chairman, NCS HealthCare Inc.
Samuel Salem
Former President, DiversiTech General and Group Vice President, GenCorp.
Edwin P. Schrank
Management Consultant
Milton I. Wiskind
Senior Vice President and Secretary
Stephen E. Myers
President and Chief Executive Officer
Milton I. Wiskind
Senior Vice President and Secretary
Gregory J. Stodnick
Vice President, Finance and Chief Financial Officer
Jean-Paul Lesage
Vice President
Kevin C. O'Neil
Assistant Secretary
Board of Directors Corporate Officers

34
Annual Meeting
The Annual Meeting of Shareholders will be held on Thursday April 25, 2002 at 9:00 a.m. in theCompany’s L.S. Myers Training Center, 1554 SouthMain Street, Akron, Ohio. For more information,please call (330) 253-5592.
Company Headquarters
Myers Industries, Inc.1293 South Main StreetAkron, Ohio 44301Tel: (330) 253-5592
Web Site: www.myersind.com
Myers Industries’ home page provides detailedinformation about the company, including:
• Stock prices and charting from the NYSE;• Downloadable Annual Report PDF files;• SEC Filings;• Recent press releases;• Myers’ products, services, and markets;• Historical information about Myers; and• Information order form to obtain current
financial and investor-related information.
Common Stock
Traded on the New York Stock Exchange
Dividend Reinvestment Plan
Shareholders have a convenient opportunity toautomatically reinvest cash dividends and makevoluntary cash investments in the Company’s stockthrough the Dividend Reinvestment Plan.Participating shareholders pay no brokeragecommissions or other charges on purchases ofshares under the Plan; all such commissions andcharges are paid by the Company.
For full details about participating in the DividendReinvestment Plan, please contact Garee Daniska,Assistant Treasurer, Myers Industries, Inc., 1293South Main Street, Akron, Ohio 44301.
Transfer Agent & Registrar
First Chicago Trust Company of New York is thecompany’s principal transfer agent and registrar.Please contact First Chicago directly with all request to:
• Transfer stock;• Change name or address;• Replace lost stock certificates or
dividend checks;
• Consolidate accounts;• Eliminate multiple mailings; and• Obtain statements of holdings.
First Chicago Trust Company of New YorkA Division of Equiserve LLP14 Wall StreetNew York, NY 10005Telephone Response Center: (201) 324-0313
Form 10-K Requests
A copy of the Company’s 2001 Annual Report on Form 10-K is available to shareholders at our website or upon written request to:
Gregory J. StodnickVice President, FinanceMyers Industries, Inc.1293 South Main StreetAkron, Ohio 44301
National Association of Investors
Corporation (NAIC)
Myers Industries is a corporate member of the National Association of Investors Corporation (NAIC), the world’s largest individual shareholder membership group. Myers participates in NAIC regional and national events.
Auditors
Arthur Andersen LLP200 Public Square, Suite 1800Cleveland, Ohio 44114Tel: (216) 781-2140
Counsel
Brouse McDowell LPA500 First National TowerAkron, Ohio 44308Tel: (330) 535-5711
Shareholder Contacts
Gregory J. StodnickVice President, Finance & CFO
Myers Industries, Inc. • 1293 S. Main Street • Akron, Ohio 44301Telephone: (330) 253-5592 • Fax: (330) 761-6156
Investor Relations
Information
Max R. Barton IIInvestor Relations Manager
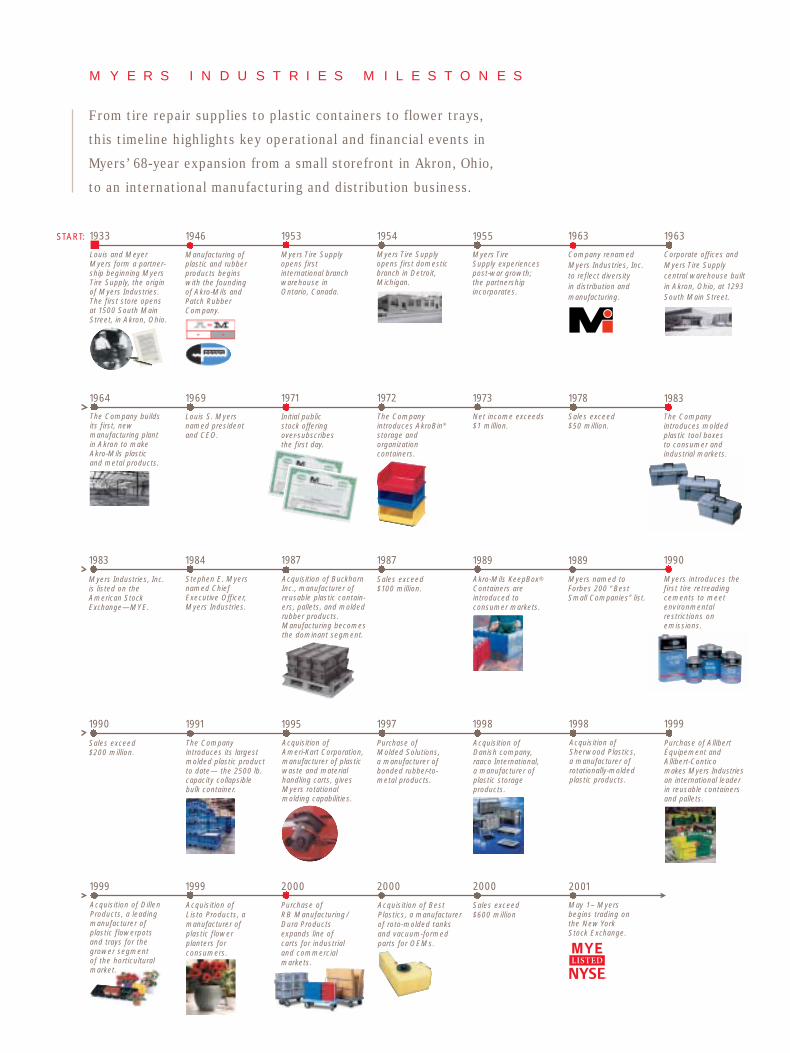
1995
Acquisition of Ameri-Kart Corporation, manufacturer of plasticwaste and materialhandling carts, givesMyers rotational molding capabilities.
M Y E R S I N D U S T R I E S M I L E S T O N E S
From tire repair supplies to plastic containers to flower trays,
this timeline highlights key operational and financial events in
Myers’ 68-year expansion from a small storefront in Akron, Ohio,
to an international manufacturing and distribution business.
Myers introduces thefirst tire retreadingcements to meetenvironmental restrictions on emissions.
1990
Sales exceed$100 million.
1987
1972
The Company introduces AkroBin®
storage and organization containers.
Louis and MeyerMyers form a partner-ship beginning MyersTire Supply, the originof Myers Industries.The first store opensat 1500 South MainStreet, in Akron, Ohio.
1933START: 1955
Myers Tire Supply experiencespost-war growth; the partnership incorporates.
1964
The Company buildsits first, new manufacturing plant in Akron to makeAkro-Mils plastic and metal products.
1998
Acquisition of Danish company,raaco International, a manufacturer of plastic storage products.
1999
Purchase of AllibertÉquipement andAllibert-Contico makes Myers Industriesan international leaderin reusable containers and pallets.
1997
Purchase ofMolded Solutions,a manufacturer ofbonded rubber-to-metal products.
1991
The Company introduces its largestmolded plastic product to date— the 2500 lb.capacity collapsible bulk container.
1998
Acquisition ofSherwood Plastics,a manufacturer ofrotationally-moldedplastic products.
1983
The Company introduces molded plastic tool boxes to consumer andindustrial markets.
1987
Acquisition of BuckhornInc., manufacturer ofreusable plastic contain-ers, pallets, and moldedrubber products.Manufacturing becomesthe dominant segment.
1984
Stephen E. Myersnamed Chief Executive Officer,Myers Industries.
1989
Myers named toForbes 200 “BestSmall Companies” list.
1989
Akro-Mils KeepBox®
Containers are introduced to consumer markets.
Sales exceed$200 million.
1990
1969
Louis S. Myers named president and CEO.
1971
Initial public stock offering over-subscribes the first day.
1973
Net income exceeds $1 million.
Sales exceed$50 million.
1978
1983
Myers Industries, Inc.is listed on theAmerican StockExchange—MYE.
Manufacturing of plastic and rubber products begins with the founding of Akro-Mils and Patch RubberCompany.
1946 1953
Myers Tire Supplyopens first international branchwarehouse inOntario, Canada.
1954
Myers Tire Supplyopens first domesticbranch in Detroit,Michigan.
1963
Company renamedMyers Industries, Inc.to reflect diversity in distribution and manufacturing.
1963
Corporate offices andMyers Tire Supply central warehouse builtin Akron, Ohio, at 1293 South Main Street.
Acquisition of DillenProducts, a leadingmanufacturer of plastic flowerpots and trays for the grower segment of the horticulturalmarket.
1999 1999
Acquisition of Listo Products, a manufacturer of plastic flower planters for consumers.
Purchase of RB Manufacturing/Dura Productsexpands line ofcarts for industrialand commercial markets.
2000
Acquisition of BestPlastics, a manufacturer of roto-molded tanksand vacuum-formed parts for OEMs.
2000
Sales exceed$600 million
2000
May 1– Myersbegins trading onthe New YorkStock Exchange.
2001

1293 South Main Street
Akron, Ohio 44301
Tel: (330) 253-5592
Fax: (330) 761-6156
www.myersind.com
© 2001 Myers Industries, Inc. Form No.701261 - 03/02 - 13MDesigned and produced in-house by Myers Industries, Inc.