productivity performance of smes - bank negara … · smes promote private ownership and...
TRANSCRIPT
S M E A n n u a l R e p o r t 2 0 0 7 �
N a t i o n a l S M E D e v e l o p m e n t C o u n c i l
31
ProductivityPerformance of SMEs
Chapter 3
1. Government Strategies Driving SME Development 34
2. Productivity Performance of SMEsa. The Manufacturing Sector 38b. The Agriculture Sector 41
SME i-161.qxd:Inside Layout 2.qxd 7/17/08 6:30 PM Page 31

S M E A n n u a l R e p o r t 2 0 0 7 �
N a t i o n a l S M E D e v e l o p m e n t C o u n c i l
33P r o d u c t i v i t y P e r f o r m a n c e o f S M E s
With SMEs representing 99.2% of total business
establishments and employing over 5.6 million workers,
developing a competitive, productive and resilient SME
sector is an important thrust to support the
Government’s aim of achieving balanced economic
development and higher standards of living at all levels
of society.
C h a p t e r 3
SME i-161.qxd:Inside Layout 2.qxd 7/17/08 6:30 PM Page 33
� S M E A n n u a l R e p o r t 2 0 0 7
N a t i o n a l S M E D e v e l o p m e n t C o u n c i l
34
SMEs promote private ownership and entrepreneurship, provide broad
based growth whilst also acting as incubators for developing domestic
enterprises into large corporations. In developed Asian countries like Japan
and PR China, SMEs’ contribution to the GDP is already above 55%
compared to 32% recorded by Malaysian SMEs. The Government has
accorded high priority to the development of SMEs to fully realise their
potential. The commitment of the Government is reflected in the national
development agenda. Both the Ninth Malaysia Plan (9MP) and the Third
Industrial Masterplan (IMP3), outline key strategies for SME development for
the 2006-2010 and 2006-2015 periods respectively.
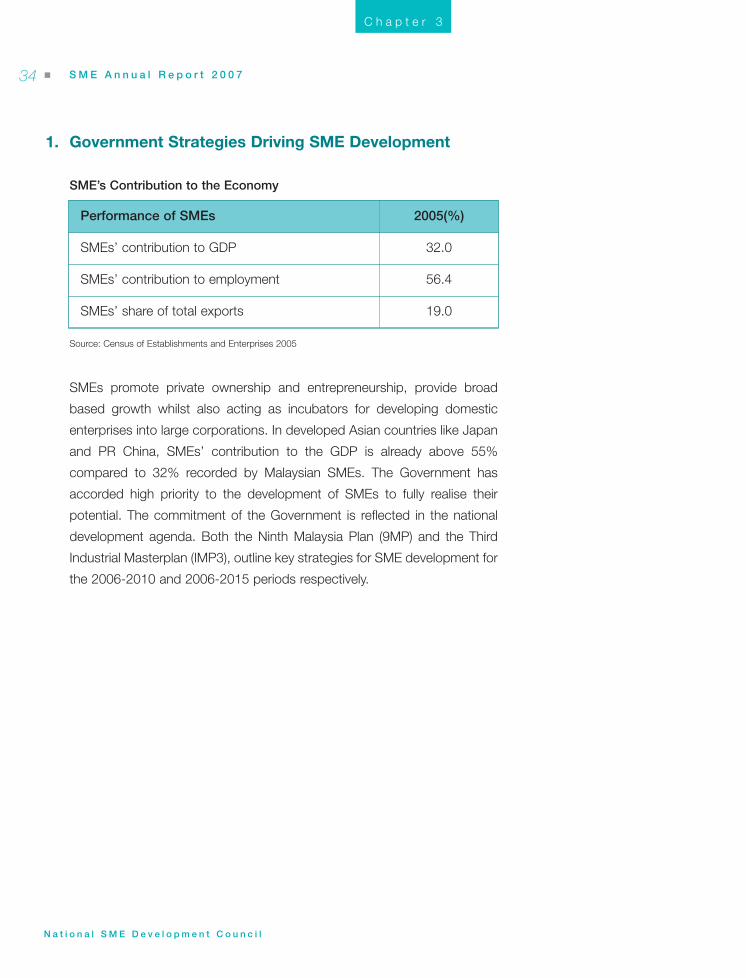
SME’s Contribution to the Economy
1. Government Strategies Driving SME Development
C h a p t e r 3
Performance of SMEs 2005(%)
SMEs’ contribution to GDP 32.0
SMEs’ contribution to employment 56.4
SMEs’ share of total exports 19.0
Source: Census of Establishments and Enterprises 2005
SME i-161.qxd:Inside Layout 2.qxd 7/20/08 1:40 PM Page 34
S M E A n n u a l R e p o r t 2 0 0 7 �
N a t i o n a l S M E D e v e l o p m e n t C o u n c i l
35P r o d u c t i v i t y P e r f o r m a n c e o f S M E s
Key Strategies For Growth
The Ninth Malaysia Plan (9MP) and the Third Industrial Masterplan (IMP3) have
outlined key strategies and thrusts to help SMEs move up the value chain, with a
special focus on Information and Communications Technology (ICT), capacity
building and enhanced productivity.
The Ninth Malaysian Plan (9MP)
During the 9MP period from 2006-2010, the principal SME policy is the
development of a competitive, innovative and technologically strong SME sector
able to compete in a global market. Strategies are directed at the acquisition of
technologies to propel SMEs up the value chain in the manufacturing, agriculture
and services sectors. These include:
• Outsourcing
Programmes will be implemented to nurture SMEs as research and development
(R&D) partners. Collaborative ventures among Multi National Corporations (MNCs),
Government Link Corporations (GLCs) and SMEs will facilitate technology transfer
and skills development and marketing opportunities;
• Inter-firm Linkages
Creating business links between SMEs, GLCs and MNCs would enable SMEs
to be more competitive and become reliable suppliers for global outsourcing
networks which would expand Malaysia’s trade with new export markets;
• Entrepreneurship Programmes
Programmes, including advisory and outreach services, will be expanded to
equip SMEs with new and improved management and business practices
methods in production, quality improvement, marketing and distribution; and
• Knowledge Skills
Further development of technical skills amongst SMEs, especially in generating
innovation and creating economic value from knowledge application.
C h a p t e r 3
SME i-161.qxd:Inside Layout 2.qxd 7/17/08 6:30 PM Page 35
� S M E A n n u a l R e p o r t 2 0 0 7
N a t i o n a l S M E D e v e l o p m e n t C o u n c i l
36
C h a p t e r 3
The Third Industrial Masterplan (IMP3)
IMP3 outlines five clear strategies on strengthening the economic foundation of SMEs in
the manufacturing, agriculture and services sectors. These are:
• Enhancing Competitiveness
To enhance competitive advantage, SMEs are encouraged to integrate with MNCs,
capitalising on the current outsourcing trends among large corporations especially
in high value added activities. SMEs need to move up the value chain through
rationalisation and specialisation, focusing on building and enhancing core
competencies to compete regionally and globally. Specialisation will enable SMEs to
better leverage on the core competencies to create a market niche, both
domestically and overseas;
• Capitalising on Outward Investment Opportunities
With the advent of a more liberalised market, SMEs can no longer rely on domestic
demand. A more integrated global market provides new opportunities and greater
export opportunities for those who are proactive. Financial institutions are urged to
provide loans towards new investments overseas especially in the Association of the
Southeast Asia Nations (ASEAN) region. This will go hand in hand with efforts from
various Agencies such as the Small and Medium Industries Development
Corporation (SMIDEC) and the Malaysian External Trade Development Corporation
(MATRADE) who will initiate closer bilateral cooperation with foreign counterparts,
promote industry linkages, joint trade commissions and exhibitions to facilitate
networking between local and foreign SMEs;
• Focus on Technology and Innovation
In line with global trends, growth amongst domestic SMEs will inevitably be driven by
technology and innovation. The emergence of new technology and products have
influenced the way business is now conducted. As such, high priority has been given
to strengthen the technological capabilities of SMEs. SMIDEC in collaboration with
technology-based institutions like SIRIM Bhd (SIRIM), Malaysian Technology
Development Corporation (MTDC), Multimedia Development Corporation (MDeC) and
Malaysia Biotechnology Corporation will introduce technology foresight programmes
that allow SMEs to take advantage of available technology;
SME i-161.qxd:Inside Layout 2.qxd 7/17/08 6:30 PM Page 36
S M E A n n u a l R e p o r t 2 0 0 7 �
N a t i o n a l S M E D e v e l o p m e n t C o u n c i l
37P r o d u c t i v i t y P e r f o r m a n c e o f S M E s
• Providing a Cohesive and Supportive Regulatory and Institutional Framework
To achieve a higher rate of success the approach has to be systematic and coordinated.
This synchronised approach is to be carried out hand in hand with financial support
programmes which include:
- Assisting potential entrepreneurs to upgrade technical and professional skills;
- Assisting in the purchase of new machinery and equipment;
- Providing industrial sites and special parks at competitive prices;
- Providing assistance in the registration and patenting of Intellectual Property (IP);
and
- Reducing red tape for faster processing.
• Nurturing the Services Sector
The Census of Establishment and Enterprises 2005 indicated 86.5% of SMEs are in
the services sector. Several areas for growth have been identified within this sector:
- Distributive trade - increasing new products and services for franchising;
- Business and professional services - encouraging entrepreneurs in specialist
skills such as pharmacies and dental clinics;
- Logistics services - increased SME participation in the integrated logistics supply
chain;
- Construction and related services - SMEs to link with large construction companies
to form a strong domestic sub-contracting base to secure contracts locally and
overseas; and
- ICT - stimulate growth of technopreneurs and SMEs by providing seed and start-
up funding.
C h a p t e r 3
SME i-161.qxd:Inside Layout 2.qxd 7/17/08 6:30 PM Page 37
� S M E A n n u a l R e p o r t 2 0 0 7
N a t i o n a l S M E D e v e l o p m e n t C o u n c i l
38
2. Productivity Performance of SMEs
Given the Government’s adoption of a more comprehensive approach towards SME
development such as increasing access to financing, strengthening enabling business
infrastructure, enhancing the capacity and capability of SMEs including providing
greater access to business support services locally and abroad, the way forward for
SMEs is to move up the value chain to remain competitive. These measures have
helped in part to raise productivity levels across the three main sectors of the
economy.
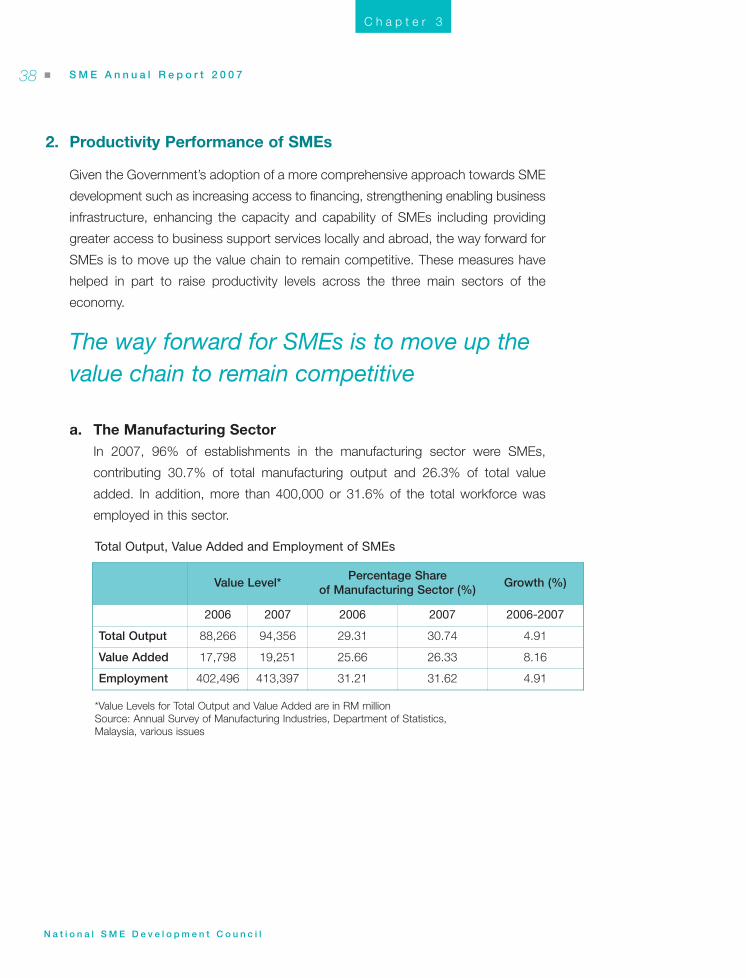
a. The Manufacturing SectorIn 2007, 96% of establishments in the manufacturing sector were SMEs,
contributing 30.7% of total manufacturing output and 26.3% of total value
added. In addition, more than 400,000 or 31.6% of the total workforce was
employed in this sector.
Total Output, Value Added and Employment of SMEs
Value Level*Percentage Share
of Manufacturing Sector (%)Growth (%)
2006 2007 2006 2007 2006-2007
Total Output 88,266 94,356 29.31 30.74 4.91
Value Added 17,798 19,251 25.66 26.33 8.16
Employment 402,496 413,397 31.21 31.62 4.91
*Value Levels for Total Output and Value Added are in RM millionSource: Annual Survey of Manufacturing Industries, Department of Statistics,Malaysia, various issues
The way forward for SMEs is to move up thevalue chain to remain competitive
C h a p t e r 3
SME i-161.qxd:Inside Layout 2.qxd 7/17/08 6:30 PM Page 38
S M E A n n u a l R e p o r t 2 0 0 7 �P r o d u c t i v i t y P e r f o r m a n c e o f S M E s
N a t i o n a l S M E D e v e l o p m e n t C o u n c i l
39
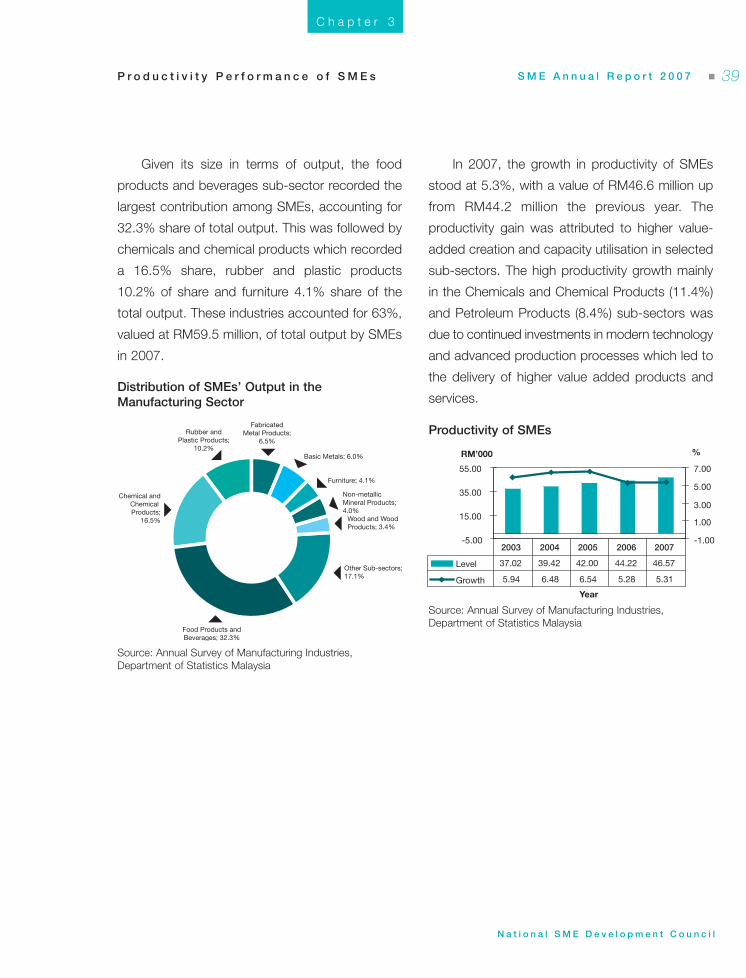
Given its size in terms of output, the food
products and beverages sub-sector recorded the
largest contribution among SMEs, accounting for
32.3% share of total output. This was followed by
chemicals and chemical products which recorded
a 16.5% share, rubber and plastic products
10.2% of share and furniture 4.1% share of the
total output. These industries accounted for 63%,
valued at RM59.5 million, of total output by SMEs
in 2007.
Distribution of SMEs’ Output in theManufacturing Sector
Food Products and Beverages; 32.3%
Other Sub-sectors;17.1%
Wood and Wood Products; 3.4%
Non-metallic Mineral Products;4.0%
FabricatedMetal Products;
6.5%
Furniture; 4.1%
Basic Metals; 6.0%
Chemical andChemical Products;
16.5%
Rubber andPlastic Products;
10.2%
In 2007, the growth in productivity of SMEs
stood at 5.3%, with a value of RM46.6 million up
from RM44.2 million the previous year. The
productivity gain was attributed to higher value-
added creation and capacity utilisation in selected
sub-sectors. The high productivity growth mainly
in the Chemicals and Chemical Products (11.4%)
and Petroleum Products (8.4%) sub-sectors was
due to continued investments in modern technology
and advanced production processes which led to
the delivery of higher value added products and
services.
Productivity of SMEs
-5.00
15.00
35.00
55.00
Year
-1.00
1.00
3.00
5.00
7.00
Level 37.02 39.42 42.00 44.22 46.57
Growth 5.94 6.48 6.54 5.28 5.31
2003 2004 2005 2006 2007
RM’000 %
Source: Annual Survey of Manufacturing Industries,Department of Statistics Malaysia
Source: Annual Survey of Manufacturing Industries,Department of Statistics Malaysia
C h a p t e r 3
SME i-161.qxd:Inside Layout 2.qxd 7/17/08 6:30 PM Page 39
� S M E A n n u a l R e p o r t 2 0 0 7
N a t i o n a l S M E D e v e l o p m e n t C o u n c i l
40
Capital Productivity
Capital productivity also registered an upward
improving trend. The key drivers of capital
productivity growth among SMEs were found in
the sub- sectors, led by SMEs in the wood and
wood products, which achieved capital productivity
growth of 8.3%, due to efficient utilisation of
machinery and equipment through better
maintenance and preventive methods. This has
improved the capacity and capability of SMEs to
deliver products and services that meet global
market standards and provide customer
satisfaction.
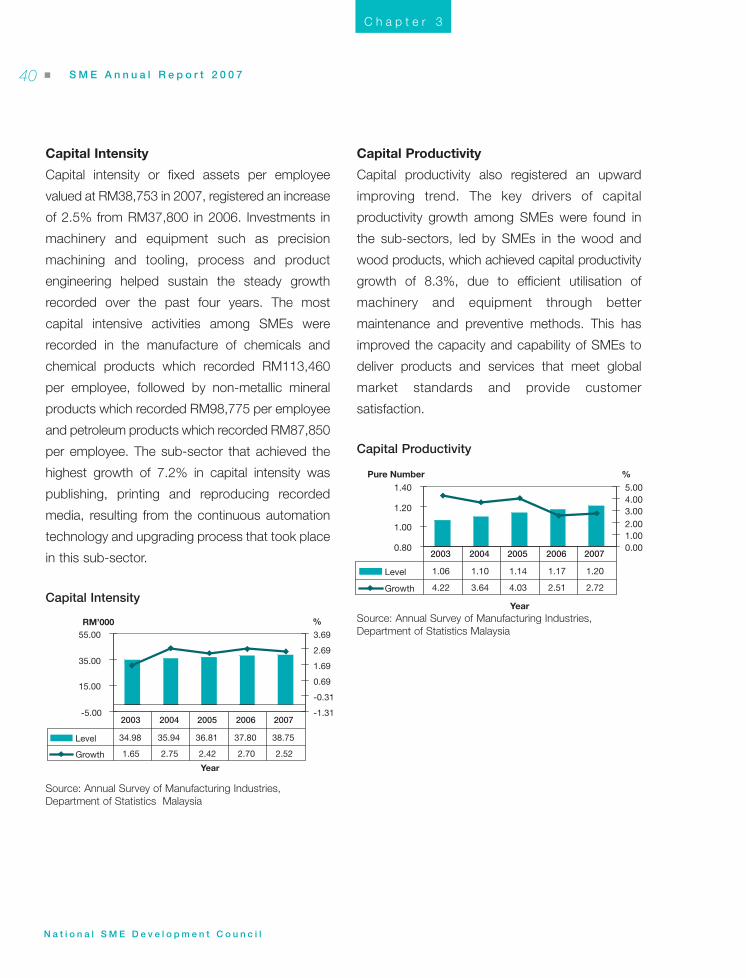
Capital Intensity
Capital intensity or fixed assets per employee
valued at RM38,753 in 2007, registered an increase
of 2.5% from RM37,800 in 2006. Investments in
machinery and equipment such as precision
machining and tooling, process and product
engineering helped sustain the steady growth
recorded over the past four years. The most
capital intensive activities among SMEs were
recorded in the manufacture of chemicals and
chemical products which recorded RM113,460
per employee, followed by non-metallic mineral
products which recorded RM98,775 per employee
and petroleum products which recorded RM87,850
per employee. The sub- sector that achieved the
highest growth of 7.2% in capital intensity was
publishing, printing and reproducing recorded
media, resulting from the continuous automation
technology and upgrading process that took place
in this sub-sector.
Capital Productivity
0.80
1.00
1.20
1.40
Year
0.001.002.003.004.005.00
Level 1.06 1.10 1.14 1.17 1.20
Growth 4.22 3.64 4.03 2.51 2.72
2003 2004 2005 2006 2007
Pure Number %
Source: Annual Survey of Manufacturing Industries,Department of Statistics Malaysia
Capital Intensity
-5.00
15.00
35.00
55.00
Year
-1.31
-0.31
0.69
1.69
2.69
3.69
Level 34.98 35.94 36.81 37.80 38.75
Growth 1.65 2.75 2.42 2.70 2.52
2003 2004 2005 2006 2007
RM’000 %
Source: Annual Survey of Manufacturing Industries,Department of Statistics Malaysia
C h a p t e r 3
SME i-161.qxd:Inside Layout 2.qxd 7/18/08 8:48 AM Page 40
S M E A n n u a l R e p o r t 2 0 0 7 �
N a t i o n a l S M E D e v e l o p m e n t C o u n c i l
41P r o d u c t i v i t y P e r f o r m a n c e o f S M E s
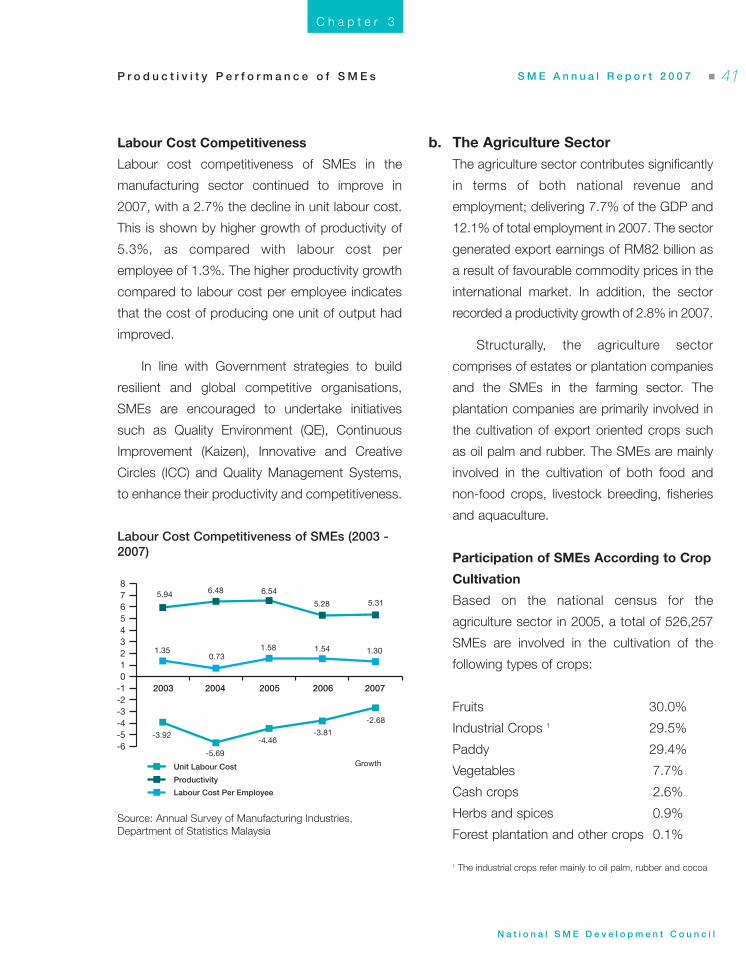
Labour Cost Competitiveness
Labour cost competitiveness of SMEs in the
manufacturing sector continued to improve in
2007, with a 2.7% the decline in unit labour cost.
This is shown by higher growth of productivity of
5.3%, as compared with labour cost per
employee of 1.3%. The higher productivity growth
compared to labour cost per employee indicates
that the cost of producing one unit of output had
improved.
In line with Government strategies to build
resilient and global competitive organisations,
SMEs are encouraged to undertake initiatives
such as Quality Environment (QE), Continuous
Improvement (Kaizen), Innovative and Creative
Circles (ICC) and Quality Management Systems,
to enhance their productivity and competitiveness.
Labour Cost Competitiveness of SMEs (2003 -2007)
-6-5-4-3-2-1012345678
Unit Labour Cost
Productivity
Labour Cost Per Employee
2003 2004 2005 2006 2007
Growth
5.94
1.30
5.31
1.541.581.350.73
5.28
6.546.48
-2.68
-3.81-4.46
-5.69
-3.92
Source: Annual Survey of Manufacturing Industries,Department of Statistics Malaysia
C h a p t e r 3
b. The Agriculture Sector The agriculture sector contributes significantly
in terms of both national revenue and
employment; delivering 7.7% of the GDP and
12.1% of total employment in 2007. The sector
generated export earnings of RM82 billion as
a result of favourable commodity prices in the
international market. In addition, the sector
recorded a productivity growth of 2.8% in 2007.
Structurally, the agriculture sector
comprises of estates or plantation companies
and the SMEs in the farming sector. The
plantation companies are primarily involved in
the cultivation of export oriented crops such
as oil palm and rubber. The SMEs are mainly
involved in the cultivation of both food and
non-food crops, livestock breeding, fisheries
and aquaculture.
Participation of SMEs According to Crop
Cultivation
Based on the national census for the
agriculture sector in 2005, a total of 526,257
SMEs are involved in the cultivation of the
following types of crops:
Fruits 30.0%
Industrial Crops 1 29.5%
Paddy 29.4%
Vegetables 7.7%
Cash crops 2.6%
Herbs and spices 0.9%
Forest plantation and other crops 0.1%
1 The industrial crops refer mainly to oil palm, rubber and cocoa
SME i-161.qxd:Inside Layout 2.qxd 7/17/08 6:30 PM Page 41

� S M E A n n u a l R e p o r t 2 0 0 7
N a t i o n a l S M E D e v e l o p m e n t C o u n c i l
42
Productivity of the SMEs in the agriculture
sector can be measured in terms of land and
labour productivity.
Land and Labour Productivity for
Selected Crops and Fruits
Land productivity measures the amount of
agricultural output harvested from each
hectare of land2. Land productivity for selected
crops and fruits in 2007 include:
Crops/Fruits Yield per hectare
per annum (tonnes)
Tomato 59.0
Oil palm 19.0
Dragon Fruit 16.5
French Bean 14.4
Chilli 12.3
Durian 7.9
Maize 6.5
Mango 5.0
Rubber 1.4
Cocoa 0.92 One hectare is equal to 2.47 acres
C h a p t e r 3
Labour productivity measures the amount of
agricultural output harvested by each worker per
man-day. Labour productivity for selected crops
and fruits include:
Crops/Fruits Output per man-day
(Kilograms)
French Bean 94
Mango 60
Tomato 57
Durian 49
Chilli 41
Farm level productivity has improved due to
the emphasis towards a wider application of the
latest farm technologies and the expending use of
biotechnology. Productivity also improved due to
large scale commercial farming, the production of
high quality and value added products, wider
application of ICT, and the development of
agripreneurial skills through the various incubation
programmes on offer.
SME i-161.qxd:Inside Layout 2.qxd 7/17/08 6:30 PM Page 42
S M E A n n u a l R e p o r t 2 0 0 7 �
N a t i o n a l S M E D e v e l o p m e n t C o u n c i l
43P r o d u c t i v i t y P e r f o r m a n c e o f S M E s
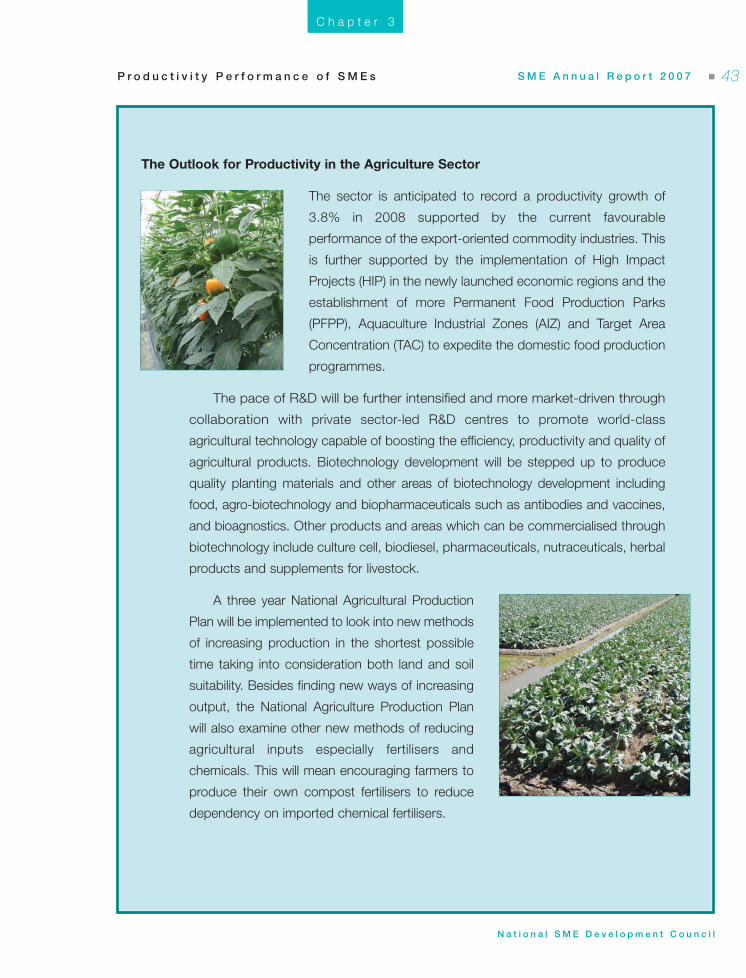
The sector is anticipated to record a productivity growth of
3.8% in 2008 supported by the current favourable
performance of the export-oriented commodity industries. This
is further supported by the implementation of High Impact
Projects (HIP) in the newly launched economic regions and the
establishment of more Permanent Food Production Parks
(PFPP), Aquaculture Industrial Zones (AIZ) and Target Area
Concentration (TAC) to expedite the domestic food production
programmes.
C h a p t e r 3
The Outlook for Productivity in the Agriculture Sector
The pace of R&D will be further intensified and more market-driven through
collaboration with private sector-led R&D centres to promote world-class
agricultural technology capable of boosting the efficiency, productivity and quality of
agricultural products. Biotechnology development will be stepped up to produce
quality planting materials and other areas of biotechnology development including
food, agro- biotechnology and biopharmaceuticals such as antibodies and vaccines,
and bioagnostics. Other products and areas which can be commercialised through
biotechnology include culture cell, biodiesel, pharmaceuticals, nutraceuticals, herbal
products and supplements for livestock.
A three year National Agricultural Production
Plan will be implemented to look into new methods
of increasing production in the shortest possible
time taking into consideration both land and soil
suitability. Besides finding new ways of increasing
output, the National Agriculture Production Plan
will also examine other new methods of reducing
agricultural inputs especially fertilisers and
chemicals. This will mean encouraging farmers to
produce their own compost fertilisers to reduce
dependency on imported chemical fertilisers.
SME i-161.qxd:Inside Layout 2.qxd 7/17/08 6:30 PM Page 43
� S M E A n n u a l R e p o r t 2 0 0 7
N a t i o n a l S M E D e v e l o p m e n t C o u n c i l
44
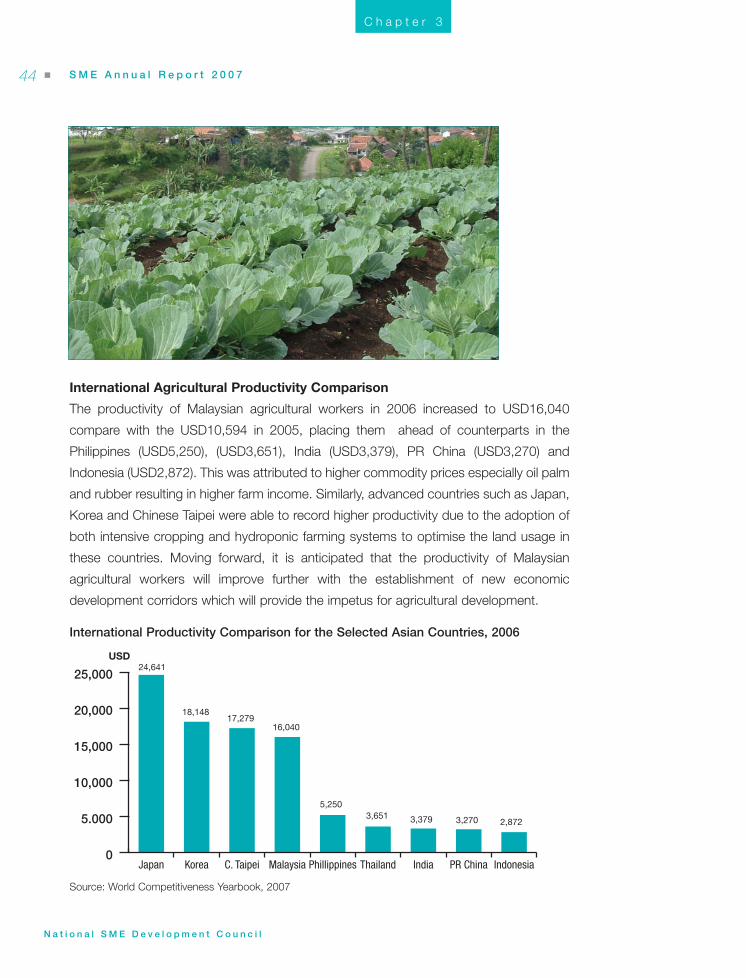
International Agricultural Productivity Comparison
The productivity of Malaysian agricultural workers in 2006 increased to USD16,040
compare with the USD10,594 in 2005, placing them ahead of counterparts in the
Philippines (USD5,250), (USD3,651), India (USD3,379), PR China (USD3,270) and
Indonesia (USD2,872). This was attributed to higher commodity prices especially oil palm
and rubber resulting in higher farm income. Similarly, advanced countries such as Japan,
Korea and Chinese Taipei were able to record higher productivity due to the adoption of
both intensive cropping and hydroponic farming systems to optimise the land usage in
these countries. Moving forward, it is anticipated that the productivity of Malaysian
agricultural workers will improve further with the establishment of new economic
development corridors which will provide the impetus for agricultural development.
USD24,641
18,14817,279
16,040
5,2503,651 3,379 3,270 2,872
0
5.000
10,000
15,000
20,000
25,000
IndonesiaPR ChinaIndiaThailandPhillippinesMalaysiaC. TaipeiKoreaJapan
International Productivity Comparison for the Selected Asian Countries, 2006
C h a p t e r 3
Source: World Competitiveness Yearbook, 2007
SME i-161.qxd:Inside Layout 2.qxd 7/20/08 1:41 PM Page 44
S M E A n n u a l R e p o r t 2 0 0 7 �
N a t i o n a l S M E D e v e l o p m e n t C o u n c i l
45P r o d u c t i v i t y P e r f o r m a n c e o f S M E s
Tourism receipts is expected to contribute
more than 10% to the total sales value of the retail
industry. Supporting facilities such as transportation
would be provided to foreign tourists from airports
and hotels to the various shopping destinations in
major Malaysian cities. In addition, Government
incentives will be introduced to stimulate consumer
spending.
The transport sub-sector is expected to
experience further productivity growth resulting
from capacity expansion in transport infrastructure,
better transport services through enhanced ICT
applications, and an increase in investments by
telecommunication service providers.
While the ICT industry is on target to
experience productivity growth, however, there will
be a slight slow down in ICT spending in 2008 due
to increased competition from vendors in the
marketplace. Furthermore, the recession in the US
and rising oil prices will also affect ICT spending in
Malaysia. Continuous efforts to promote Malaysia
as an ICT hub and the growing importance of
Shared Services and Outsourcing (SSO) are among
the factors that can increase the efficiency and
competitiveness of the sector. The SSO industry is
expected to continue this strong growth, helping
create job opportunities and more knowledge
workers in the ICT industry. Apart from outsourcing
services, emerging technologies like mobile
number portability, metro Ethernet and web 2.0
are also expected to drive the ICT market in
Malaysia.
The services sector is the major contributor to
the economy, contributing 53% to GDP in
2007. In the same year, output growth in the
sector strengthened to 9.7% compared to
6.8% in 2006. This was mainly supported by
strong domestic consumption, expansion in
finance, insurance activities and the
intensification of business and tourism
activities.
The services sector registered a
productivity growth of 5% to a level of
RM54,229 in 2007 from RM51,653 in 2006.
The growth was mainly driven by improved
efficiency and higher ICT usage.
Moving forward, productivity of the
services sector is expected to improve further.
Growth in the trade sub-sector will be driven
by strategies to boost retail spending, retail
activities, advertising and promotional
campaigns that had been identified in
promoting retail offerings to foreign tourists in
the Visit Malaysia Year 2007 (extended to 31
August 2008) campaign. The tourism industry
is expected to maintain its performance in
2008. Continuous promotional efforts from
both the public and private sectors to make
Malaysia a prime tourist destination would
further enhance the industry growth. The
tourism sector on the whole is targeting to
achieve 21.5 million tourist arrivals and RM49
billion in revenue in 2008.
C h a p t e r 3
The Outlook for Productivity in the Services Sector
SME i-161.qxd:Inside Layout 2.qxd 7/17/08 6:30 PM Page 45
� S M E A n n u a l R e p o r t 2 0 0 7
N a t i o n a l S M E D e v e l o p m e n t C o u n c i l
46
Outlook for SMEs
To compete successfully in the domestic and
global markets, SMEs are encouraged to capitalise
on outward investment opportunities, adopt best
business practices and be more resilient in the
face of greater competition. SMEs can venture into
the identified new sources of economic wealth.
Among some of the new areas are Halal products
and services, franchising and ICT.
Since human capital development is expected
to further spur the development of business start-
ups and increase the supply of skilled and
knowledge workers, SMEs need to improve on
capacity and capability by investing in appropriate
new technologies and intensifying the ongoing
training of human resources.
As SMEs assume an important role in the
economic growth of the country, the Government
has put in place various measures to enhance
their efficiencies and competitiveness. Various
programmes including incentives in the form of
grants and soft loans are made available to
encourage SME in the development of innovative
products and to automate processes, in order to
keep pace with global demand for high quality and
competitively priced products and services.
C h a p t e r 3
Promoting Greater Efficiency through
e-payments
With the rising significance of internet and
telecommunications as important communication
tools in the world of commerce, SMEs are urged
to look at the cost benefits of utilising technology
to make and receive payments electronically.
Electronic payment (e-payment) which provides
the speed and convenience of making payments
from any place at any time, will offer SMEs
welcome respite in the current economic climate.
Adopting e-payment solutions will enable
SMEs to transact in the domestic and global
markets more efficiently. The lower cost of doing
business will contribute towards enhancing the
overall competitiveness of SMEs and increase
opportunities for greater business growth.
SME i-161.qxd:Inside Layout 2.qxd 7/17/08 6:30 PM Page 46
S M E A n n u a l R e p o r t 2 0 0 7 �
N a t i o n a l S M E D e v e l o p m e n t C o u n c i l
47P r o d u c t i v i t y P e r f o r m a n c e o f S M E s
The Impact of ICT Implementation
SMEs can benefit either as producers of ICT or as
users of ICT to increase their productivity, improve
communications and attract new clients. ICT
adoption can be a costly exercise, therefore SMEs
need to clearly identify at the outset, what is
essential to improve their productivity.
The most basic ICT tool is having
communication capabilities through fixed lines or
mobile phones. At the next level up, SMEs may
consider investing in personal computers with
basic software for simple information processing
needs such as word processing to compile invoices
for example, and to keep accounts on track.
Internet access enables SMEs to have advanced
communication capabilities such as e-mail, web
browsing and developing websites. SMEs in
manufacturing can benefit from more advanced
ICT tools such as Enterprise Resource Planning
(ERP) or inventory management.
Ultimately, the adoption and application of
advanced technologies including ICT contribute
towards the creation of competitive businesses. A
study on the “Impact of ICT Implementation
among SMEs” was carried out in 2007 highlighting
six areas of business that have been profoundly
impacted by the implementation of ICT.
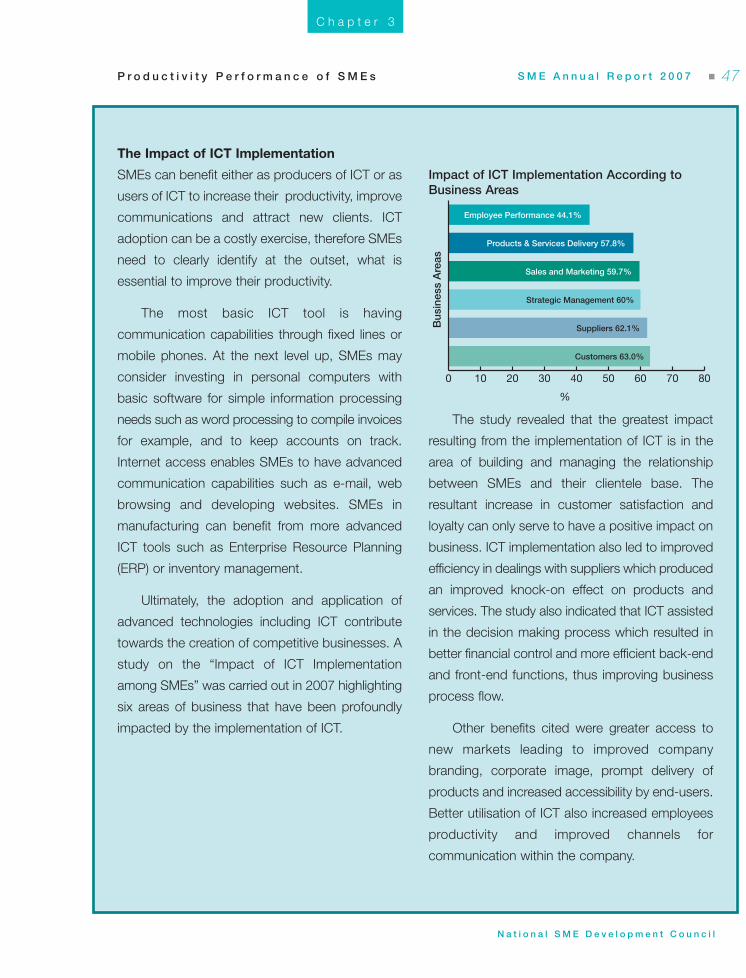
The study revealed that the greatest impact
resulting from the implementation of ICT is in the
area of building and managing the relationship
between SMEs and their clientele base. The
resultant increase in customer satisfaction and
loyalty can only serve to have a positive impact on
business. ICT implementation also led to improved
efficiency in dealings with suppliers which produced
an improved knock-on effect on products and
services. The study also indicated that ICT assisted
in the decision making process which resulted in
better financial control and more efficient back-end
and front-end functions, thus improving business
process flow.
Other benefits cited were greater access to
new markets leading to improved company
branding, corporate image, prompt delivery of
products and increased accessibility by end-users.
Better utilisation of ICT also increased employees
productivity and improved channels for
communication within the company.
C h a p t e r 3
0 10 20 30 40 50 60 70 80
Customers 63.0%
Suppliers 62.1%
Strategic Management 60%
Sales and Marketing 59.7%
Products & Services Delivery 57.8%
Employee Performance 44.1%
%
Bus
ines
s A
reas
Impact of ICT Implementation According toBusiness Areas
SME i-161.qxd:Inside Layout 2.qxd 7/17/08 6:30 PM Page 47
� S M E A n n u a l R e p o r t 2 0 0 7
N a t i o n a l S M E D e v e l o p m e n t C o u n c i l
48
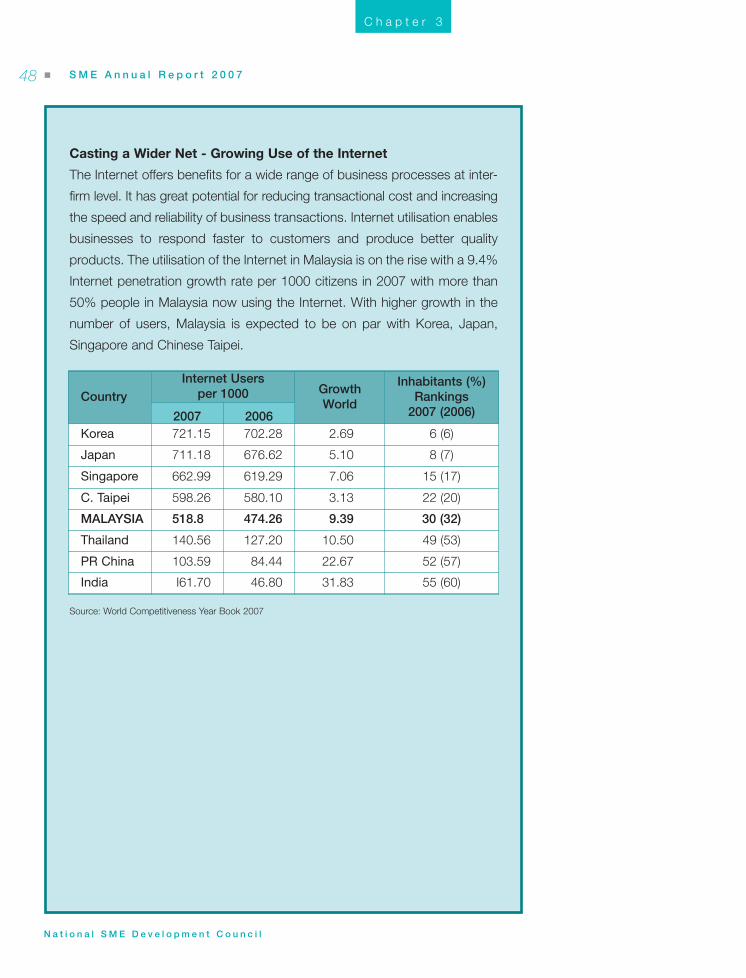
CountryInternet Users
per 1000 Growth World
Inhabitants (%)Rankings
2007 (2006)2007 2006Korea 721.15 702.28 2.69 6 (6)
Japan 711.18 676.62 5.10 8 (7)
Singapore 662.99 619.29 7.06 15 (17)
C. Taipei 598.26 580.10 3.13 22 (20)
MALAYSIA 518.8 474.26 9.39 30 (32)
Thailand 140.56 127.20 10.50 49 (53)
PR China 103.59 84.44 22.67 52 (57)
India I61.70 46.80 31.83 55 (60)
Casting a Wider Net - Growing Use of the Internet
The Internet offers benefits for a wide range of business processes at inter-
firm level. It has great potential for reducing transactional cost and increasing
the speed and reliability of business transactions. Internet utilisation enables
businesses to respond faster to customers and produce better quality
products. The utilisation of the Internet in Malaysia is on the rise with a 9.4%
Internet penetration growth rate per 1000 citizens in 2007 with more than
50% people in Malaysia now using the Internet. With higher growth in the
number of users, Malaysia is expected to be on par with Korea, Japan,
Singapore and Chinese Taipei.
C h a p t e r 3
Source: World Competitiveness Year Book 2007
SME i-161.qxd:Inside Layout 2.qxd 7/20/08 1:42 PM Page 48