productivity parameters in relation to hydrography of the...
TRANSCRIPT

J. Mar: Biol. Ass. India, 47 (2) : 115 - 120, July - Dec., 2005
Productivity parameters in relation to hydrography of the inshore surface waters off Visakhapatnam
K. Vijayakumaran
Regional Centre of Central Marine Fisheries Research Institute, Pandurangapuram, Ocean View Layout, Visakhapatnam 530 003, India. Email : [email protected]
Abstract
Time-scale study on physico-chemical and productivity parameters of inshore surface waters was carried out from two fixed stations at the outer harbour off Visakhapatnam during 1986-90. The inter-relations between various parameters were studied and discussed in the background of upwelling and sinking processes along this coast. High values of chlorophyll-a (14.1 mg m-9, phaeopigments (28.8 mg m-') and primary produc- tion (1552.7 mg C mJ d-I) were recorded in the study. SST and dissolved oxygen showed negative relation with productivity and pigments while phosphate, silicate and nitrate showed positive relations with produc- tivity parameters. The anomaly in the trend of SST and salinity during 1987-88 is attributed to the influence of changes in major ocean-atmospheric processes. Based on the results, the need for continuous monitoring of hydrographic parameters from fixed stations is suggested.
Keywords: Productivity, inshore waters, Visakhapatnam
Introduction
Several workers have investigated different aspects of hydrography offvisakhapatnam harbour waters (Ganapati and Raman, 1979; Raman and Ganapati, 1986; Sarma et al., 1982; Vijayakumar and Sarma, 1988; Phani Prakash, 1989; Nanda, 1991). The use of I4C technique for mea- surement of primary production, initiated in Bay of Ben- gal during Galathea Expedition (Steeman-Neilsen and Jensen, 1957) was employed in the present study. Long- term studies on the productivity and hydrography of in- shore waters off Visakhapatnam are very rare. This paper presents the results of the investigation on primary pro- duction, plant pigments and physico-chemical parameters from fixed stations at the Visakhapatnam outer harbour, conducted during a four-year period from April 1986 to March 1990.
Materials and methods
Weekly surface samples were collected during April 1986 to March 1990 (188 observations) from two fixed stations at Visakhapatnam outer harbour. The first station (17" 41.60' N, 83" 18.38' E) is located on the outside of the breakwaters where water depth is about 7 m and the second one (17" 41.84' N, 83" 18.34' E) inside the Fish- eries Harbour nearer to the entrance where water depth is about 4m. The second station, which is about 500 m north of the first and within the breakwaters, was selected to study the influence of fishing harbour and absence of surf action on various parameters. The surface tempera- ture was measured using a bucket thermometer. Standard
procedures were adopted for estimating dissolved oxy- gen, salinity, and inorganic nutrients (Strickland and Par- sons, 1968; Parsons et al., 1984). Primary production was estimated by simulated in situ incubation of samples for six hours after addition of (5pci) I4C. Incubated samples were filtered through Sartorius membrane filters (pore size 0.45 pm) and photosynthetic uptake of radio- carbon was estimated by counting the filters on a G-M Counter (Strickland and Parsons, 1968; Dyson et al., 1965). Samples for plant pigments were filtered using Whatman GFID glass fibre filters and pigments extracted in 90% acetone were estimated using spectrophotometer (ECIL GS 866 C) (Strickland and Parsons, 1968). Stan- dard statistical methods (Snedecor and Cochran, 1967) and software packages were used for analyzing the data.
Results and discussion
Surface temperature
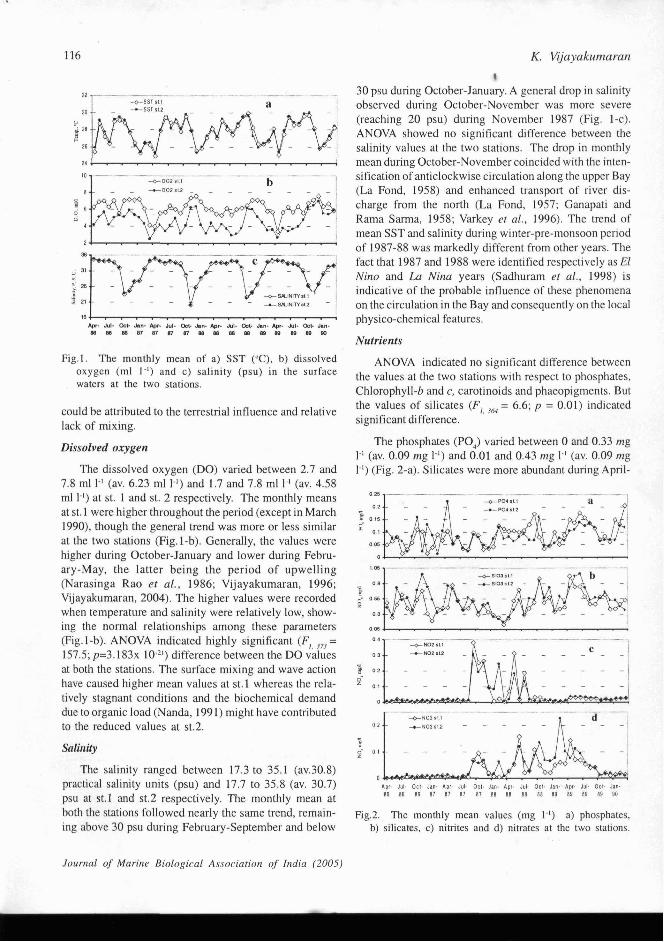
The surface temperature (SST) varied from 21.8 "C to 31.1 "C (av. 27.6 oC) and 22.7 "C to 32.2"C (av. 27.7 "C) at st.1 and st.2 respectively (Fig.1-a). Except in 1988, the lowest value was in April, indicating the upwelling of cooler water to the near shore surface (La Fond, 1954). A change in the usual pattern observed in 1988, which also recorded the highest mean, is indicative of a probable change in the oceanic circulation. Though ANOVA indi- cated no significant difference between the SST at the two stations, the slightly higher range and average at st.2
Journal of' Marine Biological Association of India (2005)
. . . . . . . . . . . . . . . d
Aph JYI- DCI- Jan- Apr. Jul. m t - Jan- N r - Jut- OF1. J a n N r - Jul- k t - Jan. W W l 8 7 8 7 8 7 8 7 W W W W I P I I W
Fig.1. The monthly mean of a) SST ("C), b) dissolved oxygen (ml I - ' ) and c) salinity (psu) in the surface waters at the two stations.
could be attributed to the terrestrial influence and relative lack of mixing.
Dissolved oxygen
The dissolved oxygen (DO) varied between 2.7 and 7.8 ml I-' (av. 6.23 ml I-') and 1.7 and 7.8 ml I-' (av. 4.58 ml I-') at st. 1 and st. 2 respectively. The monthly means at st. 1 were higher throughout the period (except in March 1990), though the general trend was more or less similar at the two stations (Fig.1-b). Generally, the values were higher during October-January and lower during Febru- ary-May, the latter being the period of upwelling (Narasinga Rao et al., 1986; Vijayakumaran, 1996; Vijayakumaran, 2004). The higher values were recorded when temperature and salinity were relatively low, show- ing the normal relationships among these parameters (Fig.1-b). ANOVA indicated highly significant (F, ,,? = 157.5; p=3.183x lo-?') difference between the DO vilues at both the stations. The surface mixing and wave action have caused higher mean values at st.1 whereas the rela- tively stagnant conditions and the biochemical demand due to organic load (Nanda, 1991) might have contributed to the reduced values at st.2.
Salinity
The salinity ranged between 17.3 to 35.1 (av.30.8) practical salinity units (psu) and 17.7 to 35.8 (av. 30.7) psu at st.1 and st.2 respectively. The monthly mean at
t
30 psu during October-January. A general drop in salinity observed during October-November was more severe (reaching 20 psu) during November 1987 (Fig. I-c). ANOVA showed no significant difference between the salinity values at the two stations. The drop in monthly mean during October-November coincided with the inten- sification of anticlockwise circulation along the upper Bay (La Fond, 1958) and enhanced transport of river dis- charge from the north (La Fond, 1957; Ganapati and Rama Sarma, 1958; Varkey er al., 1996). The trend of mean SST and salinity during winter-pre-monsoon period of 1987-88 was markedly different from other years. The fact that 1987 and 1988 were identified respectively as El Nino and La Nina years (Sadhuram et al., 1998) is indicative of the probable influence of these phenomena on the circulation in the Bay and consequently on the local physico-chemical features.
Nutrients
ANOVA indicated no significant difference between the values at the two stations with respect to phosphates, Chlorophyll-b and c, carotinoids and phaeopigments. But the values of silicates (F, ,, = 6.6; p = 0.01) indicated . . significant difference.
The phosphates (PO,) varied between 0 and 0.33 mg I-' (av. 0.09 mg I-') and 0.01 and 0.43 mg I-' (av. 0.09 mg I-') (Fig. 2-a). Silicates were more abundant during April-
Apr . Jul- Ocl- J a n - A p r - Jut- Oct. Jan. Apr . Jul. O c l - J a n - Apr- Jut. Ocl. J a n . 1 6 8 6 8 6 8 7 6 7 8 7 8 7 88 611 1 8 88 8 9 6 9 6 9 119 90
both the stations followed nearly the same trend, remain- Fig.2. The monthly mean values (mg I-') a) phosphates, ing above 30 psu during February-September and below b) silicates, c) nitrites and d) nitrates at the two stations.
Journal qf Marine Biological Association of India (2005)

Productivity parameters in relation to hydrography 117
July and October-January. Low mean values were ob- served at both the stations during January-May 1998 (Fig. 2-b). Nitrites (NO,), the average value was 0.04 mg I - ' at both stations (Fig. 2-c). ANOVA indicated no sig- nificant difference between the stations. The higher monthly mean values more or less coincided with the period of anomaly in the temperature and salinity. Nitrates (NO,), the average was 0.03 mg I- ' and 0.04 mg I-' at these
mg m-3 and 1.17 mg m-' (Fig. 3-c). The total chlorophyll (a + b + c) varied from 0 to 31.36 mg m-3 and 0 and 28.51 mg m-' (Fig. 3-d). Generally the fluctuations in the monthly mean values of chlorophylls were minimal dur- ing September 1987 to March 1989 at both the stations. Carotenoids, the averages were 0.47 m-SPU m-' and 0.66 m-SPU m-' (Fig. 4-a). The phaeopigments ranged from 0 to 28.84 mg m-3 and 0 and 27.34 mg m" (Fig. 4-b).
stations (Fig. 2-d). ANOVA indicated no significant dif- Total pigments (c hlorophy l l s + carotenoids +
ference between the values at the two stations. phaeopigments), the monthly mean remained below 6 mg Vija~akumaran et a[. (1996) reported lower nitrite and m-3during most of the period but recorded values higher nitrate values compared to silicates and phosphates in than mg m.3 during July 1986 and April and July of adjacent waters. The low nitrate values were ascribed to 1987 and 1989 (Fig. 4-c), The range and average values denitrifying bacteria by some earlier workers (Ganapati of chlorophyll a and were much higher in the present and Rams Sarma, 1958; Jayaraman, 1954). Citing the low study to the previous studies from same area
in the adjacent locations, Sarma et (Nanda, 1991) and adjacent waters (Vijayakumaran, 1996). mentioned that nitrogen could be a limiting nutrient in also the maximum of chlorophyll-c observed in this these waters. study was much less than that reported earlier (13.21 mg Plant pigments
The Chlorophyll-a ranged between 0 and 14.12 mg m-' and 0 and 13.3 mg m-' at st.1 and st.2 (Fig. 3-a). ANOVA indicated significant (F, ,, = 4.5; p = 0.03) difference between the values at'the two stations, st.2 recording higher values. Chlorophyll-b, the average val- ues were 0.95 mg m-%ndl.ll mg m3 at these stations (Fig. 3-b). Chlorophyll-c, the average values were 1.03
AP,. Jut- Oct. Ian. A p r Jul- Ost. Jan- Apr- Jut- Ocl. Jan- A p r Jul- Ocl- Jan. 118 88 11 111 11 I7 llT 111 11 11 111 80 89 80 I D 80
m3) by Nanda (1991). Similarly, the range and average of total pigments were also higher in the present study.
Primary production
The primary production varied from 3.1 to 991.2 mg- C m" d-' and 3.5 to 1552.7 mg-C m-' d-' (Fig. 4-d). ANOVA indicated significant (F, ,,, = 9.5; p = 0.002) difference between the values at'the two stations (st.2
A p - Jut. Oct- Jan. A p - Jul- Ocl- Jan- A p - Jul- Oct- Jan- A p - Jul. Ocl- Jan- 86 88 88 87 87 87 87 88 88 88 88 89 89 89 89 90
Fig.4. The monthly mean. a) carotenoids (m-SPU mJ), b) Fig.3. The monthly mean (mg m-'). a) chlorophyll-a, phaeopigments (mg m-3), c) total pigments (mg m3)
b) chlorophyll-b&c). chlorophyll-c. and d) total and d) primary pToduction (mg-C m3 ,,.I) in the surface chlorophylls in the surface waters at the two stations. waters at the two stations.
Journal of Marine Biological A.ssoriation of India (2005)

,118 K. Vijayakurnarnn
recording higher values). It showed a higher value, range Interrelations and average compared to earlier report by Nanda (1991)
In order to understand the relationships among differ- and Vijayakumaran (1996). However, seasonal peaks ent parameters, coefficients of correlation (r) were worked reported earlier were different obviously due to viewing
data trends in relatively shorter periods. out (Table 1). The r-values were tested at two levels denoted as highly significant (a=0.01) and significant
Tablel. The matrix of coefiicient qf correlatiorl (r) among difrerent parameters at st.] & 2
Parameter st.# Atm-T SST Sal DO2 PO4 SiOl NO2 No3 PP Chl-a Chl-b Chl-c Carot Phaeo
Atm-T #I 1 0.66** 0.32** -0.26** 0.18* 0.24** 0.07 0.21** 0.16* 0.17* 0.12 0.15 0.13 0.11
# 2 1 0.73** 0.31** -0.13 0.14 0.08 0.03 0.09 0.11 0.13 0.09 0.18** 0.08 0.07
SST #I 1 -0.06 0.16* 0.11 0.05 0.11 0.11 -0.07 -0.25**-0.20** -0.22** -0.26** -0.23**
# 2 1 0.03 0.06 0.09 0.03 -0.02 0.09 0.09 -0.16* -0.18* -0.12 -0.19* -0.17*
Sal # 1 1 -0.55** 0.20** -0.08 -0.02 0.08 0.15* 0.22** 0.16* 0.13 0.17* 0.13
# 2 1 -0.57** 0.08 -0.17* 0.0 0.01 0.14 0.27** 0.21** 0.20** 0.25** 0.15
DO, #I 1 -0.27** -0.23** -0.10 -0.26** -0.24** -0.34** -0.29** -0.38** -0.26** -0.28**
# 2 1 -0.14 4.01 -0.14 -0.19** -0.06 -0.13 -0.04 -0.07 -0.09 -0.13
Pod #I 1 0.30** 0.05 0.24** 0.18* 0.08 0.03 0.05 0.03 0.06
# 2 1 0.15* 0.06 0.13 0.15* 0.27** 0.25** 0.26** 0.23** 0.18*
SiO, # 1 1 -0.08 0.32** 0.28** 0.18* 0.09 0.15 0.12 0.22**
# 2 1 -0.16* 0.15* 0.12 0.07 0.02 0.01 0.09 0.11
No? #I 1 0.27** -0.02 -0.05 -0.05 0.00 -0.13 -0.06
# 2 1 0.20** -0.01 -0.07 -0.05 -0.04 -0.15 -0.06
NO, #I 1 0.33** 0.13 0.07 0.11 -0.04 0.21**
# 2 1 0.36** 0.06 -0.09 0.03 -0.13 0.04
P P #I 1 0.41** 0.26** 0.26** 0.27** 0.50**
# 2 1 0.39** 0.12 0.22** 0.13 0.12
Chl-a 1 0.84** 0.85** 0.77** 0.83**
# 2 1 0.75** 0.82** 0.80** 0.68**
Chl-b #I 1 0.84** 0.60** 0.70**
# 2 1 0.81** 0.63** 0.58**
Chl-c: # 1 1 0.59** 0.71**
# 2 1 0.64** 0.65**
Carot # 1 1 0.72**
# 2 1 0.61**
Phaeo #I 1
# 2 I
- ~ -- - - - --
** Highly significant (a = 0.01), * Significant (a = 0.05) Atm-T: Atmospheric temperature, SST: Sea surface temperature, Sal: Salinity, PP: Primary production, Chl: Chlorophyll, Carot: Carotenoids, Phaeo: Phaeopigments
Journal of Marine Biological Association of India (2005)

Productivity parameters in relation to hydrograplzy 119
(a=0.05). At st.1, the atmospheric temperature showed highly significant positive correlations with SST, salinity, silicates and nitrates. As expected, the atmospheric tem- perature showed negative correlation with dissolved oxy- gen at st. 1. Atmospheric temperature also showed signifi- cant positive correlations with phosphates, primary pro- duction and chlorophyll-a. At st.2, atmospheric tempera- ture showed highly significant positive correlations with SST, salinity and chlorophyll-c. The SST at st. 1 showed significant positive correlation with dissolved oxygen and highly significant negative correlations with all the plant pigments. At st.2, SST showed significant negative cor- relation with all pigments except chlorophyll-c.
Salinity at st.1 showed highly significant positive correlations with phosphates and chlorophyll-a, primary production, chlorophyll-b and carotenoids, and negative correlation with dissolved oxygen. At st.2, it showed highly significant negative correlation with dissolved oxygen, and with silicates compared to highly significant positive correlation with all chlorophylls and carotenoids. At st. 1, dissolved oxygen showed highly significant nega- tive correlation with all parameters except SST and nitrites whereas at st.2 it showed significant negative correlation with salinity and nitrates.
At st. 1 phosphates, silicates and nitrates showed highly significant correlation among each other. However, ni- trites showed significant positive correlation only with nitrates. Silicates and nitrates showed highly significant positive relations with primary production and phaeopigments whereas phosphates showed significant positive relation only with primary production. At st.2, phosphates showed significant positive relation with pri- mary production and highly significant relation with all pigments. Nitrates showed highly significant positive correlation with nitrites and primary production. At st. 1, pigments and primary productivity showed highly signifi- cant correlation among each other. At st.2, primary pro- ductivity showed significant correlation with chlorophyll a and c whereas pigments showed highly significant correlation among each other.
While the influence of atmospheric temperature on SST is direct, that on salinity could be incidental. The upwelling brings high saline water to near-shore surface during summer and the sinking process in winter leads to the appearance of low saline water (La Fond, 1954). Dissolved oxygen having a negative correlation with several nutrients and productivity parameters could be the influence of upwelling, which enhance these parameters and diminish dissolved oxygen simultaneously. The notable absence of a negative relation between dissolved oxygen and SST could also be easily attributed to
upwelling, which brings low temperature-low oxygen water to the surface. The reduced SST and enhanced plankton production during upwelling could be the reason for a negative relation existing between SST and plant pigments.
There were instances of primary productivity being negatively correlated with phosphates (Radhakrishna, 1978), positively correlated with chlorophyll-a (Bhattathiri et al., 1980) and temperature and salinity (Purushothaman and Bhatnagar, 1976). Compared to the earlier works, the interrelations among physicochemical parameters, pigments and productivity were much significant as would be ex- pected in a natural system. It could be presumed that the different interrelations among parameters, which are not evident in short-term studies, emerge significantly when the data for longer period are considered for analysis.
Conclusions
The influence of surf action was observed at st.1, while that of the fishing harbour was indicated in certain parameters at st.2. Compared to previous short-term stud- ies the interrelations between various parameters were quite normal and explainable (especially at st. 1). The data on surface temperature and salinity at the study stations clearly reflect the changes in coastal waters due to up- welling and sinking processes and even indicate probable signals of the anomalies due to global ocean-atmospheric features such as El-Nino and La-Nina. Since interannual variations in coastal oceanic features are a reality, the patterns, trends, interrelations and anomalies could be clearly understood by carrying out time-scale studies from fixed stations for fairly longer periods. Vijayakumaran (2004) has suggested installation of a moored buoy for this purpose in the nearshore waters off Visakhapatnam.
Acknowledgements
The author acknowledges the valuable guidance and encouragement given by Dr. K. Radhakrishna and the assistance given by B. Narayana Rao and the crew of Cadalmin-V.
References
Balakrishnan Nair, N., P.K. Abdul Azis, K. Dharmaraj, N. Arunachalam, K. Krishnakumar, and N. K. Balasubramaniam. 1984. Ecology of the Indian Estu- aries: Primary productivity of the Ashtamudi Estuary, Southwest coast of India. Pror. Indian Acad. Sci. (Anbl . Sci.), 93(1): 9-23.
Bhattathiri, P.M., V.P. Devassy and K. Radhakrishna. 1980. Primary production in Bay of Bengal during south- west monsoon of 1978. Mahasagar. Bull.Nat1. Instt. of Oceanogr., 13(4): 315-323.
Journal of Marine Biological Association of India (2005)

K. Vijayakumaran
Dyson, N., H.R. Jitts and B. D. Scott. 1965. Technique for measuring oceanic primary production using radioac- tive carbon. CSIRO Tech. Pap., 18, 12 pp.
Ganapati, !? N. and D.V. Rama Sarma. 1958. Hydrogra- phy in relation to production of plankton off Waltair coast. Andlzra Univ. Menz. Oceanogr., 2: 168-192.
------ . and A.V. Raman. 1979. Pollution in Visakhapatnam harbour. Curr. Sci., 42: 490-492.
Jayaraman, R. 1954. Seasonal variations in salinity dis- solved oxygen and nutrient salts in the inshore waters of Gulf of Mannar and Palk Bay, Mandapam (South India). Indian J. Fislz., 1: 354-364.
La Fond, E.C. 1954. On upwelling and sinking off the East Coast of India. Andlzra Univ. Mem. Oceanogr., 1: 117-121.
1957. Oceanographic studies in the Bay of Bengal. Proc. Indian Acad. Sci., 46: 1-47.
1958. On the Circulation of the surface layers of the East Coast of India. Andllra Univ. Menz. Oceanogr., 2: 1-1 1. .
Narasinga Rao, T.V., D. Panakala Rao, B. Prabhakara Rao and V.S. Rama Raju. 1986. Upwelling and sinking along Visakhapatnam coast. Indian J. mar: Sci., 15: 84-87.
Nanda, Ch. D. 1991. Primary productivity and related hydrographic parameters in Visakhapatnam harbour. Ph.D. Tl~esis, Andhra University, Visakhapatnam, 157 PP.
Parsons, T.R., Y. Maita, and C.M. Lalli. 1984. A Manual ~f Chernical and Biological Metllods for Seawater , Analysis, Pergamon Press, Oxford, 173 pp.
Phani Prakash, K. 1989. Phytoplankton ecology in relation to pollution in Visakhapatnam harbour, East Coast of
Rama Raju, V.S., B. Prabhakara Rao and V. Subha Rao. 1992. Water masses of Visakhapatnam shelf. Physical Processes in the Indian Seas (Proc. First Convention, ISPSO, 1990): 75-78.
Sadhuram, Y., D.P. Rao, M.V. Subrahmanyam and P.N.M. Shastri. 1998. Variability of SST and Western Bound- ary Current in the Bay of Bengal under El Nino and La Nina years. Journal of Scientific Research, (Banaras Hindu University, Varanasi), 48: 213-225.
Sarma, V.V., G.R.K. Raju and T. Bosebabu. 1982. Pollution characteristics and water quality in Visakhapatnam harbour. Mahasagar, Bull.Nat1. Instt. of Oceanogr., 15: 15-22.
., T.V. Narasinmha Rao, V.S. Rama Raju, R. Vijayakumar and C. Suguna. 1988. Interrelationships and distribution of hydrochemical parameters in coastal waters off Visakhapatnam, East Coast of India. ibid. 21: 197-207.
Snedecor, W. G. and G. W. Cochran. 1967. Stati.stica1 Methods (Sixtl~ Edition). Oxford and IBH Publishing Co., Calcutta, 593 pp.
Steeman-Neilsen E. and E.A. Jensen. 1957. Primary oce- anic production, the autotrophic production of or- ganic matter in the oceans. Galatlzea Report, 1: 47- 135.
Strickland, J.D.H and T.R. Parsons. 1968. A Practical Handbook of Seawater Analysis. Bull. Fish. Res. Bd. Canada, 167, 311 pp.
Varkey, M.J., V.S.N. Murty and A. Suryanarayana. 1996. Physical Oceanography of the Bay of Bengal and Andaman Sea. Oceanogr. Mar. Biol., An Annual Review, 34: 1-70.
~ndia. P1z.D. Tl~esis, ~ n d h r a University, Visakhapatnam, 180 pp. Vijayakumar, R and V.V. Sarma. 1988. Zooplankton stud-
ies in Visakha~atnam harbour and nearshore waters. Purushothaman, A. and G.P. Bhatnagar. 1976. Primary East Coast of India. Indian J. mar. Sci., 17: 75-77.
production studies in Porto-Novo waters, South India. Arclz. Hydrobiol., 77: 37-50. Vijayakumaran, K. 2004. A simple model for predicting
upwelling status along Visakhapatnam coast. Fislrery Radhakrishna, K. 1978. Primary productivity of the Bay Technology, 41 ( 1 ) : 9- 16.
of Bengal during March-April 1975. Indian J. mar. Sci., 7: 58-60. , B. Naryana Rao and K Radhakrishna.
Raman, A.V. and P.N. Ganapati. 1986. Eutrophication in 1996. Surface produc;ivity and related hydrography
Visakhapatnam harbour, East Coast of India. Indian off Visakhapatnarn during pre-monsoon and winter
J. mar. Sci., 15: 131-132. months of 1987-89. Indian J. mar. Sci., 25: 29-34.
Accepted: 22, December 2005
Journal of Marine Biological Association of India (2005)