productivity improvement through lean manufacturing
TRANSCRIPT

DSpace Institution
DSpace Repository http://dspace.org
Industrial Engineering Thesis
2021-02
Productivity Improvement through Lean
Manufacturing Principles in Garment
Section of Bahir Dar Textile Share Company.
Abrham, Temesgen
http://ir.bdu.edu.et/handle/123456789/12447
Downloaded from DSpace Repository, DSpace Institution's institutional repository
BAHIR DAR UNIVERSITY
BAHIR DAR INSTITUTE OF TECHNOLOGY
SCHOOL OF RESEARCH AND GRADUATE STUDIES
FACULTY OF MECHANICAL AND INDUSTRIAL
ENGINEERING
Productivity Improvement through Lean Manufacturing Principles in
Garment Section of Bahir Dar Textile Share Company.
MSc. Thesis
By
Abrham Temesgen
Advisor Name: Bereket Haile Woldegiorgis, (PhD)
Co-Advisor Name: Atinkut Atinafu, (PhD candidate)
February, 2021
Bahir Dar, Ethiopia
i
PRODUCTIVITY IMPROVEMENT THROUGH LEAN MANUFACTURING
PRINCIPLES IN GARMENT SECTION OF BAHIR DAR TEXTILE SHARE
COMPANY.
Abrham Temesgen Belachew
A thesis progress submitted to the school of Research and Graduate Studies of Bahir
Dar Institute of Technology, BDU in partial fulfilment of the requirements for the
degree of
Masters of Science in the Production Engineering and Management in the Faculty of
Mechanical and Industrial Engineering.
Advisor Name: Bereket Haile Woldegiorgis, (PhD)
Co-Advisor Name: Atinkut Atinafu, (PhD candidate)
BahirDar, Ethiopia
February 15, 2020
ii
DECLARATION
I, the undersigned, declare that the thesis comprises my work. In compliance with
internationally accepted practices, I have acknowledged and refereed all materials
used in this work. I understand that non-adherence to the principles of academic
honesty and integrity, misrepresentation/ fabrication of any idea/data/fact/source
will constitute sufficient ground for disciplinary action by the University and can
also evoke penal action from the sources which have not been properly cited or
acknowledged.
Name of the student ______________________________Signature___________
Date of submission: ________________
Place: Bahir Dar
This thesis has been submitted for examination with my approval as a university
advisor.
Advisor Name: __________________________________
Advisor’s Signature: ______________________________
Co-Advisor Name: __________________________________
Co-Advisor’s Signature: ______________________________
iii
iv
ACKNOWLEDGMENTS
First of all, I would like to thank my God, for what he has done to me, and for his
willingness to conduct the study.
I am very great full to my advisor Dr. Bereket Haile Woldegiorgis who is the Assistant
Professor in the Faculty of Mechanical and Industrial Engineering for his unreserved
supports and patients along with the thesis work. His thoughts and critical comments
have greatly contributed to the thesis. Besides, I am great full to my Co. advisor Mr.
Atinkut Atinafu who is the Ph.D. candidate in the Faculty of Mechanical and Industrial
Engineering for his best supports and kindness. I believe that I have learned a lot during
the MSc thesis study will give me huge support for my future work.
I very thank full to my institution Bahir Dar Institute of Technology for facilitating such
an opportunity to study the most important area. Also, I would like to thank Bahir Dar
Textile Share Company crews for their willingness and support to conduct the study in
their company. During the study, I get continual collaboration and help from Mr. Esht
who is the garment section supervisor, so I am very thankful for your help.
Finally, I want to thank my mother Yeshitila Mersha for all you have done for me to
make me a better person and all of the achievements are the results of your continual
effort.
v
ABSTRACT
The production systems of manufacturing industries have a vital role in companies’
success. A less productive work station is one of the causes of lower production output
and profitability. The production system needs to be well organized and use effective
systems to be competitive in the global market. The case company used for this study
is Bahir Dar Textile Share Company. The garment section of BDTSC is one of the
bottlenecks for company profitability associated with poor manufacturing practice and
lower effort to address customer needs. Therefore, in this study, to improve productivity
the lean manufacturing principles are utilized. According to lean thinking, the
production process is a combination of value-adding and non-value-adding operations
and productivity improvement is achieved by eliminating non-value-adding operations.
Lean manufacturing has tools that are used to systematically study and analyze the
production process known as value stream mapping. The value stream mapping helps
to effectively implement lean manufacturing principles and model the new production
model. Some of the waste types identified in the production line were lower resource
utilization, excess inventories, waiting time, transportation, excess information flow,
and lower flexibility. The study reveals that the improved production system reduces
the lead time from 73.57 hours to 4.09 hours by 94.4 percent, non-value-added time
from 4183 min to 172 min by 96.2 %, and the inventory was reduced from 7050 pair to
750 pair of bed sheet by 89.35%. On the other hand, by using a flexible production
system the product variety is increased from one bed sheet to six bed sheet types per
day. Besides the customer-oriented production system increase the production output
by 16%, the utilization of the human resources increased by 10.3%. Lastly, the lean
production system is an effective tool to improve the productivity of garment
production in the textile industry.
Keywords: Productivity improvement; Lean Manufacturing; Value stream mapping;
Non-value-added activity; Waste elimination; Simulation.
vi
TABLE OF CONTENTS
ACKNOWLEDGMENTS ............................................................................................ iv
ABSTRACT ................................................................................................................... v
TABLE OF CONTENTS .............................................................................................. vi
LIST OF ABBREVIATIONS ........................................................................................ x
LIST OF SYMBOLS ..................................................................................................... x
LIST OF FIGURES ...................................................................................................... xi
LIST OF TABLES ....................................................................................................... xii
1. INTRODUCTION ..................................................................................................... 1
1.1. Background ......................................................................................................... 3
1.2. Statement of the Problem .................................................................................... 4
1.3. Objective of the Study ........................................................................................ 6
1.3.1 General objective .......................................................................................... 6
1.3.2 Specific objectives ........................................................................................ 6
1.4. Scope of the Study .............................................................................................. 7
1.5. Significance of the Study .................................................................................... 8
2. LITERATURE REVIEW .......................................................................................... 9
2.1. Concepts of Productivity ..................................................................................... 9
2.2. Historical Development of Lean Manufacturing .............................................. 10
2.3. Define the Company Purpose ........................................................................... 11
2.4. Waste Elimination ............................................................................................. 12
2.5. TPS House ........................................................................................................ 13
2.6. Total Framework of the Lean Production System ............................................ 15
2.6.1. Primary Purpose ......................................................................................... 15
2.6.2 Kanban ........................................................................................................ 15
2.6.3 Production Smoothing ................................................................................ 16
2.6.4 Shortening Setup Time ............................................................................... 16
vii
2.6.5 Process Layout for Shortened Lead Times and One-Piece Production ...... 16
2.6.6 Standardization of Operations ..................................................................... 17
2.6.7 Autonomation ............................................................................................. 17
2.6.8 Improvement Activities .............................................................................. 17
2.7. Value Stream Mapping ..................................................................................... 17
2.7.1 Benefits value stream mapping: .................................................................. 19
2.8. Simulating the Future State Value Stream Map ............................................... 20
2.9. Research Gaps ................................................................................................... 21
2.10. Overview of the Company .............................................................................. 22
2.10.1. Background of the Company ................................................................... 22
2.10.2. Organizational structure of BDTSC ......................................................... 22
2.10.3. Supply chain system ................................................................................ 22
2.10.4. Production system in BDTSC Garment Section ...................................... 24
3. METHODOLOGY .................................................................................................. 26
3.1. Research Problem ............................................................................................. 28
3.2. Research Design ................................................................................................ 29
3.3. Sample Design .................................................................................................. 29
3.4. Collecting data .................................................................................................. 29
3.4.1. Interview .................................................................................................... 29
3.4.2. Direct observations .................................................................................... 30
3.4.3. Questionnaire ............................................................................................. 30
4. RESULTS OF THE PRELIMINARY ANALYSIS ................................................ 31
4.1. Demographic Information ................................................................................. 31
4.2. Descriptive Analysis ......................................................................................... 32
4.2.1. Are there any activities for synchronizing customer need with the available
production rate? ................................................................................................... 32
4.2.2. Do your company producing finished goods to a supermarket/direct
shipment from which the customer pulls? ........................................................... 33
viii
4.2.3. Are you applying continuous flow in the manufacturing system?............. 33
4.2.4. Does your company's production output determine by customers' demand in
a supermarket? ..................................................................................................... 34
4.2.5. Do your company have a pacemaker process that used to schedule the rest
of the process? ...................................................................................................... 35
4.2.6. Are there leveling the production mix for fulfilling different customer
needs? ................................................................................................................... 36
4.2.7. Do your company use pitch increment of work? ....................................... 36
4.2.8. Are there techniques for reducing change over time?................................ 37
4.3. Summary of Lean Manufacturing Practice for Garment production ................ 37
4.4. Selected Product Family ................................................................................... 37
5. VALUE STREAM MAPPING ................................................................................ 38
5.1. The Current State Value Stream Map ............................................................... 38
5.1.1. Process ....................................................................................................... 39
5.1.2. Process Box ................................................................................................ 39
5.1.3. Lead Time .................................................................................................. 41
5.1.4. Travel Distance .......................................................................................... 41
5.1.5. Capturing the Communication Flow .......................................................... 42
5.1.6. Capturing Material Flow ............................................................................ 44
5.2. Creating the Future State Value Stream Map ................................................... 49
5.2.1. Icon Related with the Future State VSM ................................................... 49
5.2.2. Communication Flow in a future state VSM ............................................. 52
5.2.3. Synchronizing Customer Need with the Available Production Rate ......... 52
5.2.4. Should BDTSC Produce Bedsheets to a Finished Goods Supermarket or
Directly to Shipping? ........................................................................................... 54
5.2.5. Continuous Flow (One Piece Flow) ........................................................... 55
5.2.6. Supermarket Pull System ........................................................................... 60
5.2.7. Pacesetter ................................................................................................... 65
ix
5.2.8. Creating Flexible Production System ........................................................ 66
5.2.9. Pitch Increment and Removal of Work...................................................... 67
5.2.10. What Process Improvements will be necessary for BDTSC's? ............... 68
5.2.10. Allover Improvements Made by using Lean Principles........................... 72
5.2.11. Summary of Modelling the Future State VSM .................................. 73
5.3. Simulating the Future State VSM ..................................................................... 76
5.3.1 Simulation Result ........................................................................................ 76
5.3.2. Validating the Future State Model ............................................................. 78
6. CONCLUSIONS AND RECOMMENDATIONS .................................................. 80
6.1. Conclusions ....................................................................................................... 80
6.2. Recommendations ............................................................................................. 81
6.3. Future Work ...................................................................................................... 81
REFERENCES ............................................................................................................ 82
APPENDIX .................................................................................................................. 85
Appendix-1 Questionnaire ....................................................................................... 85
Appendix 1:1 Guidelines for implementing lean production............................... 86
Appendix 1:3 Descriptive analysis result for questionnaire ................................ 87
Appendix-2 More Findings ...................................................................................... 88
Appendix 2:1 Flow process chart (material) for production of bedsheet. ........... 88
Appendix 2:2 Flow diagram of the old layout. .................................................... 89
Appendix 2:3 Flow diagram of the future State layout. ....................................... 90
Appendix 2:4 Cycle time of operations for bed sheet production. ...................... 91
Appendix-3 Icons for Constructing the Value Stream Mapping ............................. 92
Appendix 3:1 Value stream mapping icons ......................................................... 94
Appendix-4 Simulation Analysis Result .................................................................. 95
Appendix 4:1 Arena input analyzer analysis result (Expression, Square error) .. 96
Appendix 4:2 Arena simulation analysis result ................................................. 103
x
LIST OF ABBREVIATIONS
4P Problem Solving, People and Partner, Process, Philosophy
BDTSC BahirDar Textile Share company
BiT Bahir Dar Institute of Technology
CO Change Over Time
CT Cycle Time
DES Discrete Event Simulation
FIFO First in First out
JIT Just-in-time
NVA Non-value-adding activity
OEE Overall Equipment Effectiveness
PIM Productivity improvement method
5S Seiri, Seiton, Seison, Seiketsu, and Shitsuke
TPM Total productive maintenance
TPS Toyota Production System
TQM Total quality management
VA Value-adding activity
VSM Value Stream Mapping
WIP Work in Process
LIST OF SYMBOLS
Kg Kilogram
M Meter
Min Minute
km Kilo Meter
sec Second
xi
LIST OF FIGURES
Figure 1.1: Example of value stream mapping .............................................................. 2
Figure 2.1: Toyota 4P Top Leadership commitment required ..................................... 12
Figure 2.2: The Toyota Production System ................................................................. 14
Figure 2.3: Supplier customer relationships at BahirDar Textile Share Company ...... 23
Figure 2.4: Orientation of operations in Garment Section. .......................................... 24
Figure 2.5: Operation process chart for Bedsheet 160 X 250 ...................................... 25
Figure 3.1: A modified approach to value stream map ................................................ 27
Figure 3.2: Framework Showing the Planning of Work .............................................. 28
Figure 4.1: Respondent information regarding lean practice. ...................................... 33
Figure 5.1: Availability for bailing machine ................................................................ 40
Figure 5.2; Documenting manual (verbal) and electronic communication ................. 43
Figure 5.3: Inventory three .......................................................................................... 45
Figure 5.4: Sewing work station with inventory four .................................................. 46
Figure 5.5: Inventory five ............................................................................................ 46
Figure 5.6: Inventory six .............................................................................................. 47
Figure 5.7: Current state value stream map for Garment Section ................................ 48
Figure 5.8: Current state value stream map with kaizen Burst icon. ........................... 50
Figure 5.9: Direct Shipment of finished goods to customers. ...................................... 54
Figure 5.10: Work cell formed by using first in first out lane ..................................... 56
Figure 5.11: Garment section current cycle times of operation ................................... 57
Figure 5.12: Cycle time after load sharing ................................................................... 58
Figure 5.13: The effect of continuous system in manpower utilization, time utilization,
and production output. ................................................................................................. 60
Figure 5.14: Super Market pull system for cutting operation ...................................... 63
Figure 5.15: Super Market pull system for dyeing Section ......................................... 63
Figure 5.16: Overall improvements in VA, NVA, Inventory, and WIP travel length
reduction ...................................................................................................................... 65
Figure 5.17: Andon visual control system ................................................................... 66
Figure 5.18: Load leveling box .................................................................................... 67
Figure 5.19: Future state value stream mapping with Kaizen burst............................. 74
Figure 5.20: The future state value stream mapping .................................................... 75
Figure 5.21: The future state VSM simulation result .................................................. 79

xii
LIST OF TABLES
Table 4.1: Value Added vs. Non-Value Added. .......................................................... 35
Table 5.1: Value stream mapping automatic data entry system .................................. 38
Table 5.2: Takt time data ............................................................................................. 58
Table 5.3: Withdrawal kanban. .................................................................................... 61
Table 5.4: Production-ordering kanban ....................................................................... 61
Table 5.5: Signal Kanban ............................................................................................. 62
Table 5.6: VA time, NVA time, and Inventory size reduction in the garment section 64
Table 5.7: Card for labeling different resources in the garment section. ..................... 70
Table 5.8: Allover improvements made by using value stream mapping. ................... 72
Table 5.9: Future state value stream mapping automatic data entry system................ 73
Table 5.10: Table for comparing the results of future state model and simulation model.
...................................................................................................................................... 78
1
1. INTRODUCTION
Lean manufacturing is first developed and used by Toyota Company in the 1940s.
Toyota Company is one of the leading auto sellers in the world market. The reason
behind their success in the global market is the company uses effective tools for the
production of goods. Starting from Toyota most of the lean tools (Cellular
manufacturing, Just-in-time, Total productive maintenance, Setup time reduction)
getting acceptance and implemented in discrete manufacturing (Abdulmalek F., &
Rajgopal J. 2007).
For countries like Ethiopia, the productivity of the garment industry is low. One of the
reasons for the lower productivity of the manufacturing sector is a way of production
is conventionally performed and does not use the standard way of the production system
(Tadesse A., 2011). Therefore there should be a way to use the strategy of the most
successful production system. Because this kind of change can give prosperity to
productivity if it is implemented correctly. But which kind of production system will
best fit our production system is the question.
The world has seen the crafts, mass, and lean production systems. Currently, the world
is using the lean production system and it is characterized by the production of goods
based on customer order. Lean manufacturing is a world-wide accepted philosophy of
production system that should be implemented in Ethiopian manufacturing industries
to remain a competitor in the local and global markets. The main target of the approach
is productivity improvement by enhancing the efficiency of lower productive value-
adding (VA) activities and by eliminating non-value-adding (NVA) activities. Lean
management uses these five core principles to get a productive working site. These are
valued, the value stream, flow, pull, and perfection( James P., & Daniel T., 2003).
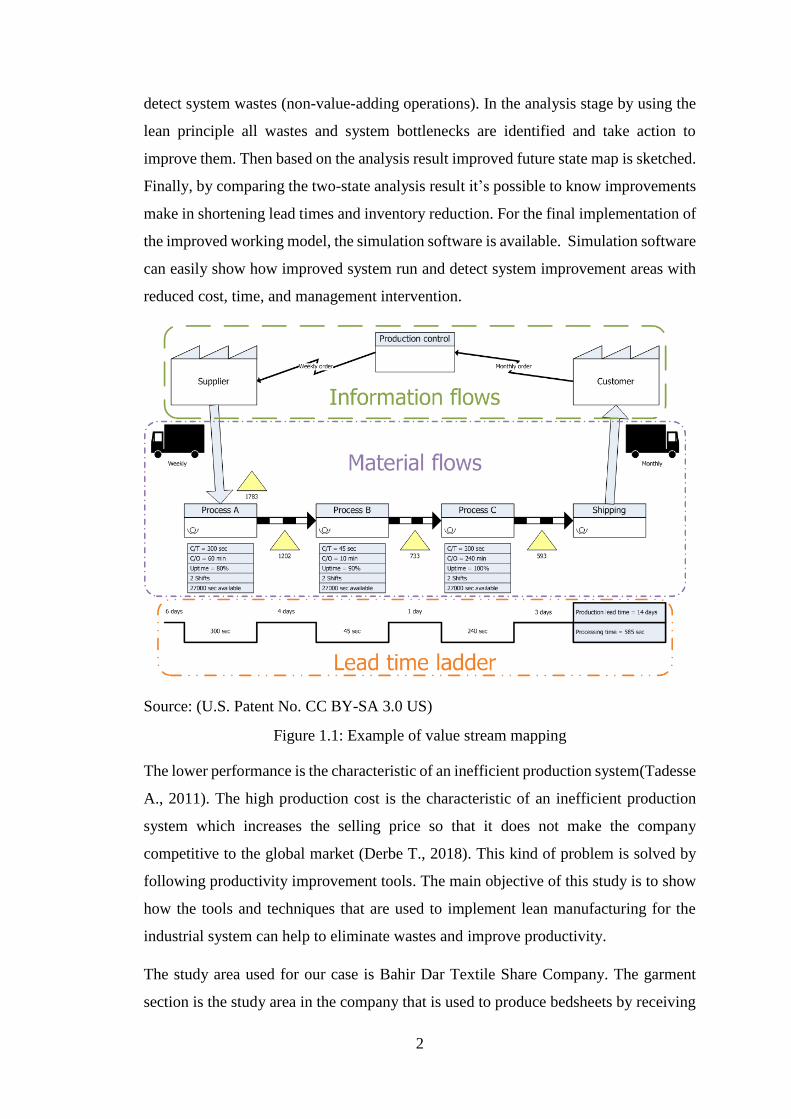
The lean manufacturing technique is implemented with the help of value stream
mapping(VSM). Manufacturing system Value Stream is a combination of all value-
adding and non-value-adding operations, used to get finished output from a list of
inputs. In VSM there are two kinds of flow in a production line, these are information
and material flow. Like other process improvement methodology the VSM used to
sketch current and future state map this enables to see improvements made. In the
beginning, the current state of the production system is modeled which allows us to
2
detect system wastes (non-value-adding operations). In the analysis stage by using the
lean principle all wastes and system bottlenecks are identified and take action to
improve them. Then based on the analysis result improved future state map is sketched.
Finally, by comparing the two-state analysis result it’s possible to know improvements
make in shortening lead times and inventory reduction. For the final implementation of
the improved working model, the simulation software is available. Simulation software
can easily show how improved system run and detect system improvement areas with
reduced cost, time, and management intervention.
Source: (U.S. Patent No. CC BY-SA 3.0 US)
Figure 1.1: Example of value stream mapping
The lower performance is the characteristic of an inefficient production system(Tadesse
A., 2011). The high production cost is the characteristic of an inefficient production
system which increases the selling price so that it does not make the company
competitive to the global market (Derbe T., 2018). This kind of problem is solved by
following productivity improvement tools. The main objective of this study is to show
how the tools and techniques that are used to implement lean manufacturing for the
industrial system can help to eliminate wastes and improve productivity.
The study area used for our case is Bahir Dar Textile Share Company. The garment
section is the study area in the company that is used to produce bedsheets by receiving
3
fabrics from the dyeing section. The production processes consist of the following
operations; these are inspection, spreading, cutting, sewing, folding, packing, and
pressing. The study will be carried out by selecting one of the products in the process
line.
1.1. Background
The productivity of Ethiopian garment industries is near to the ground and there should
be a way to improve it to be competitive in the global market( Tadesse A., 2011). The
textile industries' lower competitiveness problem rise from both internal and external
factors. According to Rahel S. (2010) study on garment industries reveals that the
internal factors are lower capacity in performance measurement practice, financial
capacity, logistics handling as well as customer and supplier relation. On the other hand,
external factors include globalization, product short life cycle, changing market
demand, lower stability, and challenges from outside competitors are major ones.
Tadesse A. (2011) develop a method known as PIM that is used to improve productivity
from operation to firm level of Ethiopian garment industries.
Gebrehiwot A. (2017) combines value stream mapping with overall equipment
effectiveness(OEE) for improving the productivity of garment production in Knit to
Finish Garment PLC. The study reveals the combination of VSM and OEE reduces
non-value-added activity and improves OEE. The productivity improvement by using
lean manufacturing uses a simulation system to validate all the results and this will be
a new approach for studying garment production systems.
4
1.2. Statement of the Problem
Industry performance improvement is nowadays a major issue for the company’s
survival in this cost-competitive world. Like most of the textile industries in Ethiopia
BDTSC had productivity problems (Tadesse A., 2011). The garment section in BDTSC
is one of the bottlenecks for the company's productivity. The main reasons are lower
variety and quality of products, wasteful production systems, and lower capacity
utilization (Amare M., 2010). A problem like this is solved by knowing problems from
the source.
The garment section daily production report from 8/3/20 to 20/3/20 reveals that wastes
in a production site are categorized as overproduction, inventories, excess
transportation, and lower performance in line balancing (Bahir Dar Textile Share
Company, 2020). In the garment section, there were excess inventories as a result of
bottleneck operations. The fabrics in the production line have 5 delays with an
inventory amount of 7050 pairs of bed sheets. The company lead time was 5.25 days
and the percentage of NVA was 94.75% of lead time. The layout problems are the cause
for a long travel distance of work in process with a total of 7 transportation equivalent
to a travel length of 142 meters. There was an accumulation of tasks in sewing work
station but operators at a bailing operation idle for 1.5 days waiting for product.
As a garment shop, the factory had a lot of opportunities and resources to address
customer needs. In the garment industries, it's possible to produce products from cheap
to custom-made to high price products(Bruce M., 2006). Besides garment industries
produce products for different functions formal, casual, sports and uses men, women,
and children(Kunz G., 2007). To give rapid response to customer requirements the
production system needs to change from traditional producer-driven to customer-
focused strategy(Tyler D., & Heeley J., 2006). But currently, the section produces only
one-bed sheeting per shift and this was an inadequate performance in addressing
customer requirements.
Besides, the section has the attainable capacity of producing 6,000 pairs of bedsheets
per day(“https://www.bahirdartextile.com/en/,”). But currently, the factory daily
production amount shows only 1904 pairs of bedsheets. This indicates 68.3 % of
company resources are not utilized. There is a high cost of production-related to lower
resource utilization and makes the company less competitive (Mikell P., 2008). The

5
study mainly focuses on how to improve productivity by using lean manufacturing
principles. Therefore the improved production system is modeled with value stream
mapping procedures.
6
1.3. Objective of the Study
1.3.1 General objective
The main objective of the research is to improve the productivity of garment
production by using lean manufacturing principles in Bahir Dar Textile Share
Company.
1.3.2 Specific objectives
To measure the performance of garment production.
To identify the value-adding and non-value adding activities.
To model the production system by using value stream mapping.
To test the validity of the value stream mapping model.

7
1.4. Scope of the Study
This thesis work is conducted in Bahir Dar Textile Share Company located in Bahir
Dar. The thesis will focus on modeling the lean production system for garment section
by using value stream mapping. Therefore studying the current production system and
applying tools and techniques for improving productivity and finally modeling what
future state production looks like are the major tasks. The new production system is
finally simulated with the simulation software.
Besides, the performance measurement, analysis of data, interpretation, and
recommendations are the subtasks. The data required for the analysis are cycle time of
operation, inventory amount, and waiting times of inventory, equipment downtime due
to failure, equipment sharing time between operations, and so on. The data acquired are
used to sketch the current state value stream map. Then by using lean principles the
current production system is analyzed and activities the cause for lower performance
are then identified and eliminated. The analysis helps to construct a future state map.
The future state map and important recommendations are used as a blueprint of an
improved production system. Finally, the future state map is modeled with simulation
software to validate an improved system.
8
1.5. Significance of the Study
The thesis work can contribute positively by providing additional knowledge areas for
managing production systems and also by improving the productivity of manufacturing.
In the case of the former one, the validation of new production system use simulation
system and this is a new way of studying the production system. The study also gives
additional knowledge for managing the production process on an administrative level.
Whereas to the manufacturing line, the study will increase productivity by eliminating
wastes. The study is expected to eliminate wastes like unnecessary information flow
and scheduling tasks, unnecessary transportation, delays, accumulation of work in
process, and overproduction. The production process will follow the customer pull
system instead of the current shop push system. There will be a smooth flow of material
from suppliers through the production system to the customer. The production system
will be continuous instead of a batch. On the other hand, the shop manager and
supervisors are benefited from the improved working model because it reduces demand
forecasting and controlling tasks. Also for operators, the study will provide a balanced
workload and a safe working environment from an accident. The major effects of the
production system are an efficient production system, lower production cost, and
enhanced quality of goods. This in return makes the company productive and
competitive in the local and global markets.
9
2. LITERATURE REVIEW
2.1. Concepts of Productivity
Productivity is generally the ratio of the output generated by a production system and
the input. The inputs of production site are material employees, machines, capital,
space, energy, and so on while the outputs are goods and service (Ali S. et al. 2009).
The productivity measurement is affected by purpose and availability of data.
Consequently productivity is expressed with total productivity and partial productivity.
The former is the ratio of total outputs to the sum of all input while the latter is the ratio
between total outputs to one of the inputs (Kendrick J., & Creamer D., 1965).
𝑃𝑟𝑜𝑑𝑢𝑐𝑡𝑖𝑣𝑖𝑡𝑦 =𝑂𝑢𝑡𝑝𝑢𝑡
𝐼𝑛𝑝𝑢𝑡…………………………………(2.1)
Productivity is an attitude of mind to create continuous improvement (Anil K. et al.,
2008). Productivity improvement refers to the increase in output per work-hour or time
expended (Andris F., 2009). The enhancement in productivity is achieved by the
efficient use of resources employees, capital, space, materials, energy, information in
the production of various goods and services(Hans G., 2012). So far to improve
productivity so many productivity improvement methods are introduced some of them
are Six Sigma, Total Productive Maintenance, Just in Time, Lean Manufacturing,
Business Process Reengineering, Balanced Scorecard, Work-Study, Supply Chain
Management, Theory of Constraints, Five S, Kaizen, and Total Productivity
Management (Tadesse A., 2011).
Productivity is affected by different factors which will inhibit or enhance its growth.
There are so many reasons for the lower productivity of the manufacturing site. The
following listed below are all causes of wastes to eliminate in a poor production system
so that enhancement in productivity can be achieved. The first one is poor product
design which will cause high scrap amount, high cost of production, frequent design
change. The second is inefficient work design and poor method of production is the
cause for longer change over time, inappropriate tooling, poor workplace layout, large
inventory accumulation, and inefficient motion economy. The third is inappropriate
management practices, which include poor planning or scheduling practice, poor
material, and tool inventory handling, weak supervision, instruction, and training.
Lastly, waste is also created because of lower worker efficiency, including working
10
with lower pace, absenteeism, poor workmanship, and occupational hazard (Andris F.,
2009).
2.2. Historical Development of Lean Manufacturing
The world has seen three revolutionary stages in the production system; these are crafts,
mass production, and lean production. The origin of crafts production was in the 1880s
and this kind of production ends around 1915 and was replaced by mass production.
The third one begins around the 1950s. The former one is characterized by a small
quantity of production, capable of making one part in various forms, and are
decentralized but centralized within the city. Besides, the craftsmen are highly skilled
peoples responsible for design, manufacture, and assembling parts. Early Production of
Automobiles and other products are started by using crafts techniques. Mass production
is firstly used by Henry Ford for his model T automobile to produced two million
vehicles per year with moving assembly in 1920. This type of production is
characterized by specialization in specific tasks with the interchangeability of parts and
a reduction in the cost of production. But the mass production creates too much stock
of finished goods irrespective of customer order which intern caused a lower variety of
products. A problem of this kind needs new methods to regain market share(James P.,
& Daniel T., 1990).
In the 1950s after World War II, the Japanese automaker like Toyota was in great
trouble to make themselves competitor in the global auto market. The problem facing
Toyota and other Japanese factories is a material shortage for mass production, high
level of employment, difficulties to change over, difficulties to manage huge industries,
and their lower rank in the market are major ones among others. In order to solve this
kind of problems, the Toyota founder Eiji Toyoda and his chief production manager
Taiichi Ohno believes to change the mass production system. Their efforts to create a
new production system were born a lean manufacturing system (Toyota production
system). Lean manufacturing is the combined effect of crafts work and mass
production. From crafts work, it takes the advantages of producing a variety of products
and from mass production, it uses the concept of producing at a lower cost. The lean
producer is characterized by a highly skilled worker, a flexible manufacturing system,
a highly automated system, and produce a variety of products with customer
requirements (James P., & Daniel T., 1990). lean thinking is the process of identifying
11
value, make a flow of these value-creating actions in their order, perform these actions
without interruption whenever a customer needs them, and perform them more and
more effectively. Lean thinking is the process of providing more and more with less
and fewer resources, to give customers what exactly they need (James P., & Daniel T.,
2003).
Jeffrey Liker in his book of the Toyota way defines waste elimination as the heart of
lean production. Lean production is a practical system for improving the productivity
of the production system. Therefore the first thing is to articulate customer needs, what
customers need from the production site? This way if the requirements are defined the
next step will be classifying actual production system activities as value-adding(VA)
and non-value-adding(NVA) or wastes to customer wants. Finally eliminating those
wastes and implementing lean at full scale are major tasks among specific ones (Liker
J., 2004).
Deshkar et al. (2018) create a lean manufacturing framework suitable for small-scale
industries. The researcher applies lean manufacturing in the plastic bag manufacturing
industry by preparing a value stream mapping framework. The future state VSM
reduces the VA time by 74.5% and reduces Takt time from 46 minutes to 26.6 minutes.
Besides the production output increase from 28 to 50 and they recommend the VSM
framework will be applicable in small-scale industries.
Baysan et al. (2019) apply lean manufacturing in a real-life cable ladder manufacturing
system to minimize energy consumption. The method they utilize for analysis
composite of energy VSM, design of experiment, and simulation. The value stream
mapping tool helps to identify waste types but to determine the degree of contribution
for energy consumption they utilize the design of the experiment. They simulate the
result of experimental design and finally, an optimized lean production system is
modeled. The suggested model by using a lean production system reduces energy
consumption by 72.3%.
2.3. Define the Company Purpose
The Toyota production system has 4P rules which are the commitment required for
managers to effectively perform their work. These are problem-solving, people and
partner, process, and philosophy. The former one is achieved by understanding and
developing an attitude of continuous improvement in the workplace. The latter is

12
focused on creating long-term partners for the company. Besides, it works on
employees to develop a commitment to live their company philosophy. The third one
is used to create a commitment to implement a lean manufacturing system. Meanwhile,
managers also need a commitment to creating a reliable and automatic production
system. The last one works on the company long term contribution to society and
commitments for company growth(Monden Y., 2012).
2.4. Waste Elimination
Lean thinking is a philosophy that is based on the elimination of all wastes (i.e., non-
value-adding activities) to improve the performance of a production system or an
enterprise. Manufacturing system value stream composite of activities that are value-
adding and non-value adding. Value-adding activities are the ones that contribute and
part of the final product. Operations within the process that do not add value for final
Source (Monden Y., 2012)
Figure 2.1: Toyota 4P Top Leadership commitment required
output but supplement value-adding (VA) activities are known as non-value-adding
(NVA) activities. The technique focuses on enhancing the efficiency of value-adding
activities and discarding activities that are non-value adding. The Toyota production
system identifies seven types of wastes in the production system. By adding newly
found waste type the eighth waste types are listed as follow (Liker J., 2004).
Overproduction; producing items without customer order, this causes the need
for storage space, transportation, and human resource to manage.
Process (Eliminate Waste)
Philosophy (Long-Term Thinking)
Problem Solving
(Contineous Improvement & Learning)
People and Partner
(Respect, Challenge, & Grow them)
13
Waiting time; delays caused by waiting time for tools, work in process,
equipment, and human resource, or due to maintenance downtime, delay during
supply, bottleneck process, and scarcity of employees.
Transportation; transportation is a waste when there is traveling long-distance
and when it takes too much time.
Over-processing; are inappropriate practice inside the shop floor because of
poor product design, poor method of production (tooling, equipment used,
procedure, and so on), and poor management practice
Excess inventory; this includes raw material, work in process, and produced
item. Besides equipment, machines, tools, and spare parts needed for processing
excess inventory are wastes.
Unnecessary motion; this type of wastes takes place during different activities
at work, including looking, long reaches, transportation, and stocking
Defects; are produced defective items, resources wasted for rework, rejected
items, and cost of inspection are some them.
Unused employee talent; are experience, certificate, ideas, and skills of
employees not properly used due to lower involvement of employees at each
level.
In lean manufacturing, each operation needs to be arranged in cellular type, this will
enable to implement one piece flow based on the customer demand rate. In addition,
each operator, machine, and work station needs to close each other to reduce travel
distance and to effectively exchange information. The combined effect of this will
reduce lead time, space requirement, work in process, and cost of production(James P.
& Daniel T., 2003). The lean production system is in evolutionary progress in which
many improvements are made on it to get the ultimate results. The system is constructed
by combining the working principles of Frederick W.Taylor (scientific management)
and Ford (mass production)(Monden Y., 2012).
2.5. TPS House
TPS house is a simple representation of Toyota production system structural elements
that make it strong enough to withstand every wave that comes to it. It enables us to
produce with the lowest cost, short lead time, and at the required level of quality. The
two pillars are just-in-time and jidoka (autonomous defects free system and automation
system with no involvement of people). At the center of the house, there is a stable,
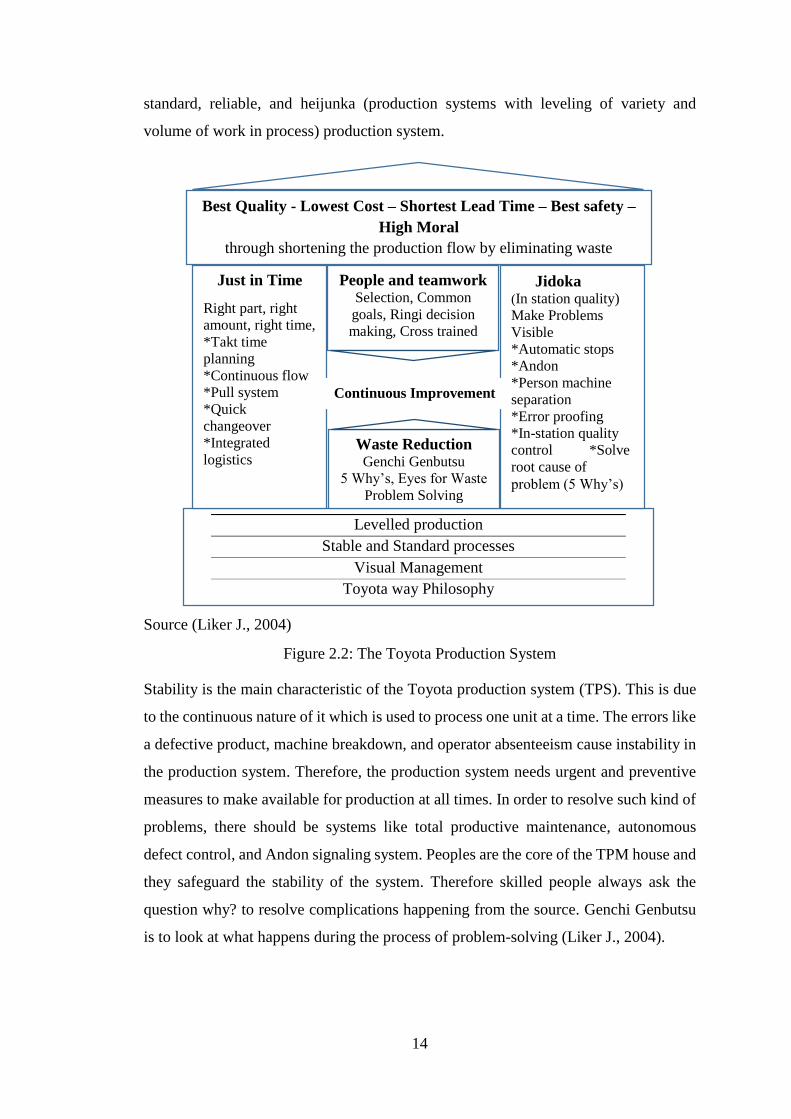
14
standard, reliable, and heijunka (production systems with leveling of variety and
volume of work in process) production system.
Source (Liker J., 2004)
Figure 2.2: The Toyota Production System
Stability is the main characteristic of the Toyota production system (TPS). This is due
to the continuous nature of it which is used to process one unit at a time. The errors like
a defective product, machine breakdown, and operator absenteeism cause instability in
the production system. Therefore, the production system needs urgent and preventive
measures to make available for production at all times. In order to resolve such kind of
problems, there should be systems like total productive maintenance, autonomous
defect control, and Andon signaling system. Peoples are the core of the TPM house and
they safeguard the stability of the system. Therefore skilled people always ask the
question why? to resolve complications happening from the source. Genchi Genbutsu
is to look at what happens during the process of problem-solving (Liker J., 2004).
Levelled production
Stable and Standard processes
Visual Management
Toyota way Philosophy
Just in Time
Right part, right
amount, right time,
*Takt time
planning
*Continuous flow
*Pull system
*Quick
changeover
*Integrated
logistics
Jidoka (In station quality)
Make Problems
Visible
*Automatic stops
*Andon
*Person machine
separation
*Error proofing
*In-station quality
control *Solve
root cause of
problem (5 Why’s)
Best Quality - Lowest Cost – Shortest Lead Time – Best safety –
High Moral
through shortening the production flow by eliminating waste
People and teamwork Selection, Common
goals, Ringi decision
making, Cross trained
Waste Reduction Genchi Genbutsu
5 Why’s, Eyes for Waste
Problem Solving
Continuous Improvement
15
2.6. Total Framework of the Lean Production System
2.6.1. Primary Purpose
Profit through cost reduction: The ultimate goal of productivity improvement is
making a profit by reducing cost. Lean manufacturing reduces the cost of production
by eliminating waste. There are four kinds of wastes Excessive production resources,
Overproduction, Excessive inventory, and unnecessary capital investment. The first
kind of waste includes excessive human resources, equipment, and machinery. These
kinds of wastes are causes for employees’ salaries, depreciation costs, and capital costs.
Excessive production resources create another type of waste known as overproduction
and inventory. Inventories and produced items are the cause for unnecessary capital
investment including; space requirement, cost of transportation, cost of hiring peoples
to manage inventory.
Quantity Control, Quality Assurance, and Respect for Humanity: The cost
reduction through improvement activity must meet other sub-goals. The first one
quantity control which enables an adaptation of daily and monthly fluctuation of
customer demand. While quality assurance allows producing products within
specification. Respect for humanity is another objective that a production system must
attain during cost reduction. When the production system is improved by using cost
reduction the employees must gain over time salaries when working for more than 8
hours. In addition, when employees must not be eliminated from work without gain
complementary salaries.
2.6.2 Kanban
Kanban is a signaling system for implementing JIT production. Kanban is a card like a
tag in it there are types, quantity, and pace of production for a particular product and
flow from one operation to another within the manufacturing site. There are two types
of kanban: these are withdrawal and production ordering kanban. The former one is a
detailed description of which type of product to withdraw. In the same way, the later
one is production ordering description to preceding operation. The kanban system is
supported by the following: Smoothing of production, Standardization of jobs,
Reduction of setup time, Improvement activities, Design of machine layout, and
Autonomation.

16
Just in Time (JIT): In JIT production system suppliers deliver the required item, at the
right quantity and time when production begins. If the JIT is implemented the
production system will be free from inventory in return will save a tremendous amount
of capital from inventory cost. To implement JIT a production system needs to be
organized with a pull system. Therefore at first, there must be a supermarket to deliver
products to a customer. Then when there is space in the supermarket a production
system continuously works to fulfill each space. The second important tool to
implement JIT is Autonomation. Autonomation (in Japanese, “jidoka”) may be loosely
interpreted as autonomous defect control. It supports JIT by never allowing defective
units from a preceding process to flow and disrupt a subsequent process. Finally to
prevent the frequent breakdown of machinery the JIT production system uses Total
productive maintenance (TPM) is a maintenance technique focus on prevention rather
than breakdown maintenance aiming to have a continuous flow of work in process.
2.6.3 Production Smoothing
Production smoothing is the cornerstone of the Toyota production system to work using
kanban to adapt to changing market demand. The main advantage of this kind of system
is to produce a variety of products evenly in the production system, in small quantities,
and in accordance with daily Takt time. There are techniques for applying production
smoothing these are determining the daily production sequence and adapting to product
variety by utilizing general-purpose machines.
2.6.4 Shortening Setup Time
Set up time reduction is continuously trying to reduce the setup time on a machine. This
system helps to reduce change over time in machinery to produce a variety of products
quickly. To reduce set-up time in large press machine single minute exchange of dies
is used. Besides, preparing the setups for quick change over by using an automated
system and by reducing the size of work in process can also reduce the setup time.
2.6.5 Process Layout for Shortened Lead Times and One-Piece Production
In a multi-process handling line, an operator handles several types of machinery
processing one by one leads the foundation one-piece production. The one-piece
production has the following advantages reduce lead time, reduce unnecessary
inventory, and be used to create multi-skilled operators. One-piece production can also
17
be achieved by using cellular manufacturing. Cellular manufacturing is the arrangement
of machines and human resource in sequence to easily conduct activities
2.6.6 Standardization of Operations
The standard operation at Toyota mainly shows the sequential routine of various
operations taken by a worker who handles the multiple kinds of machines. There are
two types of sheets for standard operations: the standard operations routine sheet is
characterized by a man-machine chart, while the standard operation sheet, which is
posted in the factory for all workers to see. This latter sheet specifies the Takt time,
standard operations routine, and standard quantity of the work in process
2.6.7 Autonomation
The two pillars of Toyota Production System are JIT and Autonomation. To realize
perfect JIT, 100 percent of defect-free units must flow to the subsequent process, and
this flow must be rhythmic without interruption. Therefore, quality control must coexist
with the JIT operation throughout the kanban system. Autonomation is a mechanism to
prevent defects flow in a continuous production system.
Visible Control System: is an electric light board (Andon) that is used to detect
problems happening, by hanging high above employees so that it can be seen by
everyone. In a visual control system, there is a yellow light for help and delays and a
red light when there is trouble that stops machine work.
2.6.8 Improvement Activities
In the Toyota production system, there is a quality control circle in this group each
worker can contribute to improvement by providing their suggestion. Quality control
has the following benefits one, controlling production amount by using standard
operation routine sheet, two, quality assurance by providing defect-free production
system the third one is respect for humanity by accommodating individual thought in
improvement activity(Monden Y., 2012).
2.7. Value Stream Mapping
Value Stream Mapping is ‘a pencil and paper tool that helps you visualize and
understand the flow of material and information as a product makes its way through its
value stream (Mike R., 1999). The need to use value stream mapping is firstly used by
18
Taiichi Ohno in Toyota Company. He wants to teach Toyota production system (TPS)
for major Toyota projects to visualize process flow and learning by doing. Then they
created an effective system that is used to show material and information flow known
as value stream mapping. The value stream mapping is first documented by Mike
Rother and John Shook in their book known as learning to see. The technique is used
to sketch the current state map which enables us to see the non-value adding time from
lead time. On the other hand, this figure enables us to take major corrections on the
value stream by using lean principle. Finally, the improved material and information
flow are documented in the future state value stream. Besides, it used to make a relation
between the two states which enable us to show the system improvement area. (Monden
Y., 2012).
The expected outputs from value stream mapping are flexibility, short lead time,
connected process, flow loops, simplified information flow, awareness of the customer
requirement, and pacesetter. Less see them in detail;
Flexibility; is a characteristic used to produce a variety of products as much as
possible with a single loop structure. The first thing that needs to fulfill in this
case is a supermarket system used to know what customers want.
Short lead time; is the time expected after eliminating waste full activities,
besides, it respects customer need so as to deliver within the time given or Takt
time.
A connected process; is the result of narrowing the gap between each operation
and work station to create a one-piece flow. This way of production enables us
to have a pull system that functions with respect to Takt time.
Flow loops; come to life when the market and production system easily
communicate with each other without obstruction. This kind of information
exchange is possible when there is a supermarket.
Simplified information flow; simple information flow is one of the end goals of
value stream mapping within the production system as well as out of the
company. This will reduce the effort needed to manage a production system.
Awareness of the customer requirement, a card like Kanban flowing in each
operation creates awareness of the customer requirement. This will enable the
production system to produce items on time.
19
Pacesetter; is the operation used as a pacemaker for other operations which used
to produce at different paces.
Romero L., & Arce A. (2017) Study the application area of VSM in the manufacturing
sector by analyzing different studies carried out on Value Stream Map. In addition, they
can observe the VSM is applicable in fields of construction, health care, transport,
product development, service (call center, government), architecture, mining, and so
on. The Study recommends using VSM and it gives a better result when it is applied in
the manufacturing sector with lower performance.
Gebrehiwot A. (2017) combines value stream mapping with overall equipment
effectiveness(OEE) for improving the productivity of garment production in Knit to
Finish Garment PLC. The study reveals the combination of VSM and OEE reduces
non-value-added activity by 21 % and improves OEE by 8%.
Amdework G. (2019) improve the productivity of shaft and gear production line in
Hibret Manufacturing and Machine Building Industry. The result of the study shows
that production lead time can be reduced by 23.66%; process cycle efficiency can be
improved from 27.6% to 36.2%; waiting time can be reduced by 37.74%; total distance
traveled can be reduced by 61.2%, and the number of workers can be reduced by25%.
2.7.1 Benefits value stream mapping:
It helps to visualize the whole value stream in a single sheet.
It enables us to see the root causes of wastes in the production system
It reduces the complexity of studying the production system.
It is a common language for implementing the lean manufacturing system.
It is the easiest way for introducing the recent worldwide accepted
manufacturing system.
It helps to show both information and material flow in value stream at a time.
It enables us to see improvements by comparing current and future state value
stream.
It is a flexible system that enables to update value stream daily when input data
are varied and things go wrong (Mike R., & John S., 1999).
To improve the performance of VSM so many studies are carried out. Lugert et al.
(2018) develop a dynamic value stream mapping management (DVMM) to improve the
20
flexibility of the production system by considering digitalization technologies and
organizational structure. In this system, the value stream mapping is assisted by data
analysis and simulation which helps the value stream to give attention to all production
systems by referring to industry 4.
Value stream mapping is applied in the manufacturing line easily but when there is
merging operation or multiple manufacturing lines it's hard to make VSM. Braglia et
al. (2017) develop an improved VSM which was used to solve the above problem in
the refrigerator manufacturing process. The production process of the garment section
uses only a single line of the production process which is a good opportunity for the
researcher to use value stream mapping.
2.8. Simulating the Future State Value Stream Map
Implementing lean at full scale cannot be accomplished within a short period. It needs
to manipulate a vast amount of company resources including inventory, human
resources, and machinery. It is so hard to see change within a short period because the
implementation of lean needs gradual change of work habits of employees and working
conditions. Sometimes companies managers are not willing to make changes in their
production system or they are less committed. This kind of situation is common in
production sites the reasons are lower awareness of improved systems, reluctance to
make a change, fixed mindset, satisfaction with what already they have, and fears if the
thing is not working well. This kind of unwillingness to cooperate and make changes
are a challenge for the researcher. Therefore in this kind of situation, software like
simulation software is more important to create awareness, validate the performance of
an improved system, and eliminate uncertainties ( Abdulmalek F., & Rajgopal J., 2007).
The above reasons tell us there is a need for simulation software for visualizing all the
results. Simulation can be categorized as a discrete event or continuous. The former is
used for changes happening at separated points while the second one is used for a
process that changes continuously in time. The simulation software is developed to
examine the system responses for various levels of loading. For the maximum loading
of demand, the software shows system in capability. The system inefficiency in the
model can predict the problematic regions of the system. There are different techniques
for improving bottleneck operation in simulation software.
21
Stadnicka D., & Litwin P. (2019) study reveals that how the system dynamic model
combined with the VSM model to improve the productivity of the automotive industry.
They utilize vensim software and there is no additional information used beyond VSM
data to make a system dynamic model.
Neeraj et al. (2018) model the material flow of aluminum break brackets by using Arena
software. The discrete event simulation is utilized for determining system bottleneck,
the number of crews, and productivity. The cycle time is analyzed by the input analyzer
tool and process optimization is carried out by process analyzer and Opt Quest. The
results with an improved model are a 6% increase in productivity, and an 8.33%
decrease in the workforce relative to the present production model.
Sime et al. (2019) use arena software for line balancing in the apparel industry. Arena
software is used for modeling and analysis of garment style(ladies tunic). Their study
reveals that computer simulation is an effective system for analyzing the performance
of the production system. They also indicate that simulation software is helpful in
planning and scheduling tasks.
2.9. Research Gaps
Previously the research was done directly by implementing lean manufacturing in the
production line. This conventional way of experimenting will incur additional cost and
time. Besides, sometimes production managers are resistive to make changes during the
actual implementation phase. Amdework G. (2019) improves the productivity of shaft
and gear production by deploying lean manufacturing in the production line. There is
no study found that combines lean manufacturing or any other improvement tool with
a simulation system. This study will be new for garment production in a way that
combining value stream mapping with a simulation system. This will benefit the
researcher to conduct the implementation phase with reduced cost and time.
Gebrehiwot A. (2017) study on the garment industry shows a reduction in non-value-
added activity by 21 % but this study has a limitation in clearly identifying non-value-
added activity and stating improvements numerically. There are few studies is done on
improving the productivity of garment industries. Therefore the study will have a good
opportunity in filling the research gap.
22
2.10. Overview of the Company
2.10.1. Background of the Company
Bahir Dar Textile Share Company (BDTSC) was established in 1961 in the town of
Bahir Dar, 570 Km North West of Addis Ababa. The company produces Bed sheeting
export & local, Poplin, Drill, Twill, Flannel, Kutta Abujedid, and Yarn on hank. The
major inputs of production are lint cotton, chemical, and dyestuffs
(WWW.assolombarda.it,). The company produces most of the products for the local
market. The company have tremendous privilege to owners, employees, surrounding
peoples, and as a whole to the country in the following way;
The raw material used for production comes from the agriculture sector, so it
supports the life of cotton supplier farmers.
The short life cycle of the product and its basic necessity to man’s life provides
a large demand and makes investors profitable.
The textile industries are highly labor-intensive ways of production provide
wages to the employees and support the life of the surrounding people that
interact with the company.
The industry contributes to the country a lot by consuming agricultural products
and from taxation.
2.10.2. Organizational structure of BDTSC
The company was organized into five sections. The production and technique
department, quality control service, planning and programming department,
administration division.
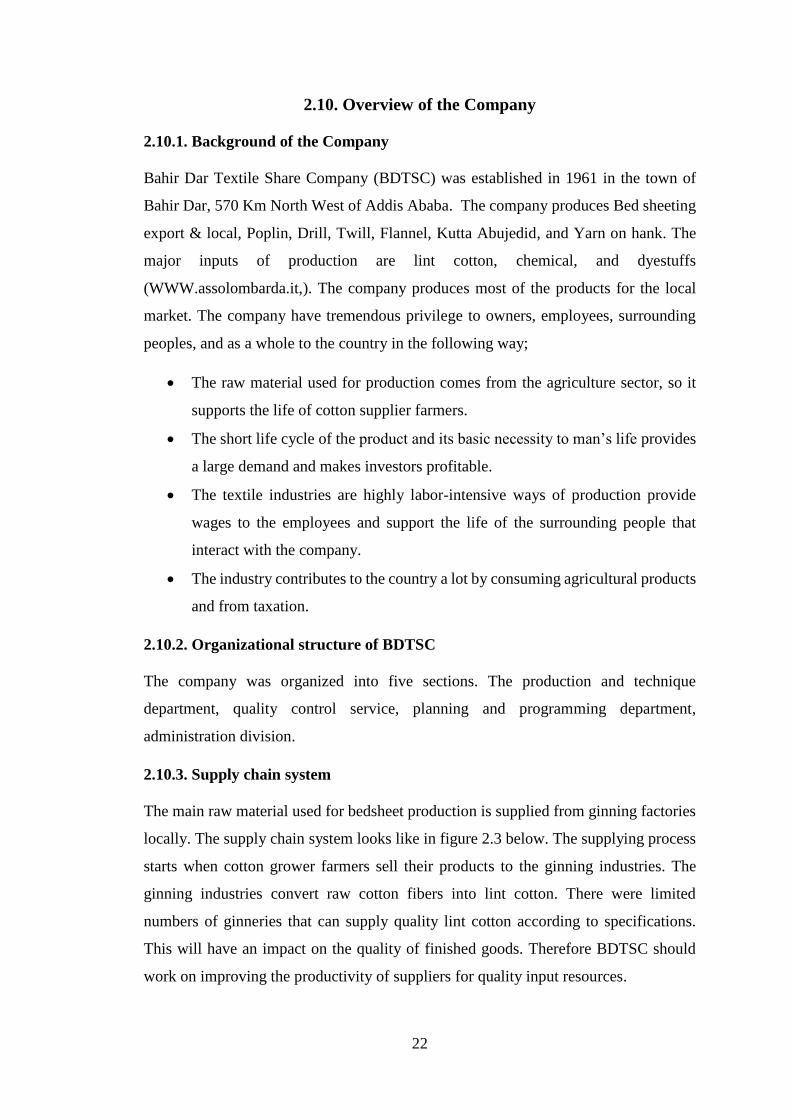
2.10.3. Supply chain system
The main raw material used for bedsheet production is supplied from ginning factories
locally. The supply chain system looks like in figure 2.3 below. The supplying process
starts when cotton grower farmers sell their products to the ginning industries. The
ginning industries convert raw cotton fibers into lint cotton. There were limited
numbers of ginneries that can supply quality lint cotton according to specifications.
This will have an impact on the quality of finished goods. Therefore BDTSC should
work on improving the productivity of suppliers for quality input resources.
23
On the other hand, the flow of material inside the factory begins when the Wholesaler
orders products in person or with electronic fax in the Purchasing and Sales department.
Then the production control unit schedule to produce a variety of products with
available resources and sends orders to each section. Based on that information spinning
section converts lint cotton into yarn and the threads were transported to the weaving
section. In the weaving section with the help of weaving machines yarns transforms
into fabrics. Next to the weaving process, in the dyeing section fabrics are dyed with a
different color solution. Fabrics were then printed with different designs in the intaglio
roller printing machine. Finally, the dyeing section supplies the required type of fabrics
to the garment section.
Source (Amare M., 2010)
Figure 2.3: Supplier customer relationships at BahirDar Textile Share Company
The last shop in BDTSC is the garment section and the main output of the shop is
bedsheets. Inside the garment section, the shop managers schedule production resources
for a week and inform supervisors. The supervisors on the other hand inform the
operators about daily activities and the required outputs. Then operators produce goods
and are stored for a while and shipped to wholesalers. This way materials flow from
suppliers along the production process and finally to customers.
Weaving Process
Wholesalers Retailers Customer
Fabric Finishing
Garment Section
Retailers Customer
Spinning Process Ginning ProcessCotton Growing
Farmer
Cotton Fibre Lint Cotton Yarn
Fabric
Bed sheet
24
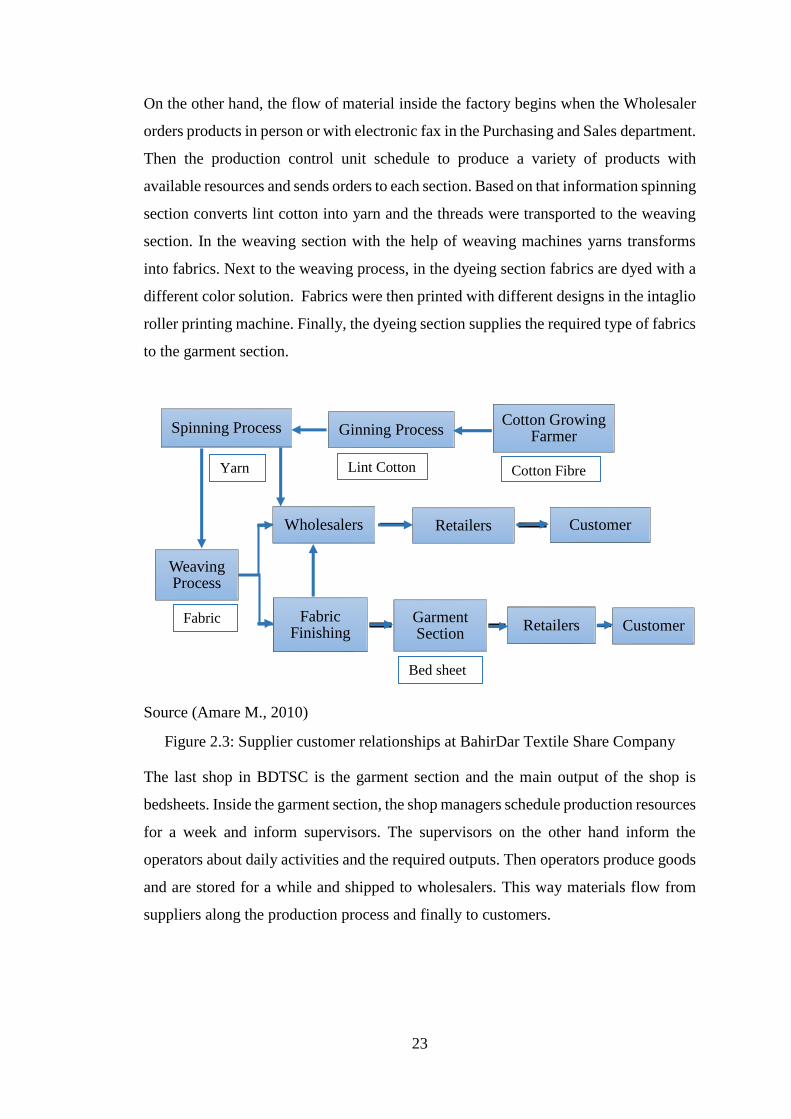
2.10.4. Production system in BDTSC Garment Section
Production is the use of machinery, human resources, technologies, and information for
changing input raw material into more value finished goods. The company consists of
machines that are general-purpose suited for multiple operations and controlled by
human intervention. The production system follows a batch production system which
is characterized by lower demand than the production capacity of the section and the
production method was traditionally adopted. In the batch production system, there was
an accumulation of inventory. The production system of BDTSC gives priority for
customer orders and follows batch repeated at an irregular time interval (make to order).
But when there was lower customer order the production system will have a high idle
time of company resources like machinery, operator, and material, and so on. In order
to prevent the company from lower productivity, the company uses batch repeated at
regular time intervals (make-to-stock). Therefore the production system of BDTSC was
a combination of made to order and make to stock.
Figure 2.4: Orientation of operations in Garment Section.
Productivity improvement refers to the increase in output per work-hour or time
expended(Andris F., 2009). The productivity improvement in the production site was
achieved by eliminating NVA activities. Non-value-adding activities related to the
production site were work content added by poor product design, inefficient method of
production, poor human resource utilization, and so on.
25
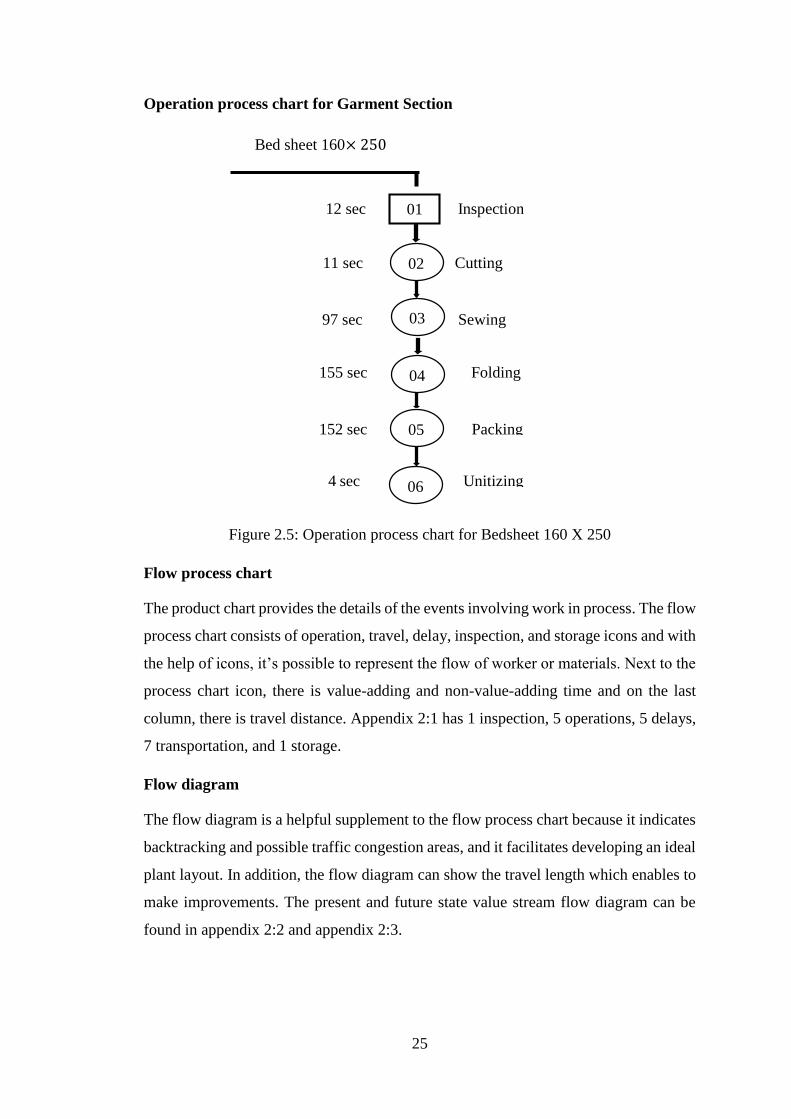
Operation process chart for Garment Section
Figure 2.5: Operation process chart for Bedsheet 160 X 250
Flow process chart
The product chart provides the details of the events involving work in process. The flow
process chart consists of operation, travel, delay, inspection, and storage icons and with
the help of icons, it’s possible to represent the flow of worker or materials. Next to the
process chart icon, there is value-adding and non-value-adding time and on the last
column, there is travel distance. Appendix 2:1 has 1 inspection, 5 operations, 5 delays,
7 transportation, and 1 storage.
Flow diagram
The flow diagram is a helpful supplement to the flow process chart because it indicates
backtracking and possible traffic congestion areas, and it facilitates developing an ideal
plant layout. In addition, the flow diagram can show the travel length which enables to
make improvements. The present and future state value stream flow diagram can be
found in appendix 2:2 and appendix 2:3.
Bed sheet 160× 250
12 sec Inspection
11 sec Cutting
155 sec Folding
97 sec Sewing
4 sec Unitizing
02
03
04
06
01
152 sec Packing 05
26
3. METHODOLOGY
The method of studying the production system is a sequential activity of data collection
and analysis of data based on techniques. Data collection is the process of extracting
useful information that was used in the analysis stage. The data were categorized into
quantitative and qualitative data. The quantitative data gives tangible data for
conducting the analysis. The data are numerical data from company reports, measuring
instruments and questionnaires. The qualitative data were taken from observation and
this data was observer point of view expressed by using pictures and words.
After data collection, the next main activity was an analysis of the collected data.
Therefore the first analysis stage was used to validate the necessity of the study. The
data were collected using a questionnaire. The analysis part was carried out by using
Microsoft Excel software. Besides the analysis result helps to identify the product type
and some improvement areas.
The second analysis stage was the Value stream mapping (VSM) procedure and it helps
for illustrating the process flow, analysis, and process improvement. The VSM was
carried out by using QI macros software. The current state value stream mapping was
sketched by measuring performance on the shop floor, by referring company reports,
and by direct observation on a production site. The current state map was helpful for
modelling the future state. The future state VSM was sketched by using lean
manufacturing tools and this tool helps to make improvements in current state VSM.
The future state VSM was used as a blueprint for the improved production system.
Finally, the simulation of a future state was carried out by using ARENA software and
it helps to validate all improvements made.
The conventional value stream mapping procedure was found in a book called Learning
to see value stream mapping to add value and eliminate MUDA(Mike R., & John S.,
1999). The modified VSM is found in a journal by (Deshkar et al., 2018) and they
prepare a value stream mapping framework for plastic bag manufacturing industry. The
main difference between modified approach and the conventional method was only on
the implementation phase. In the conventional method, the last phase is implementing
the future state VSM by preparing an implementation plan. But implementation is not
part of the study so there must be a validation tool for future state model. In the modified
27
approach uses only the software validation to mimic the real system, and this way the
study was conducted by using the modified approach.
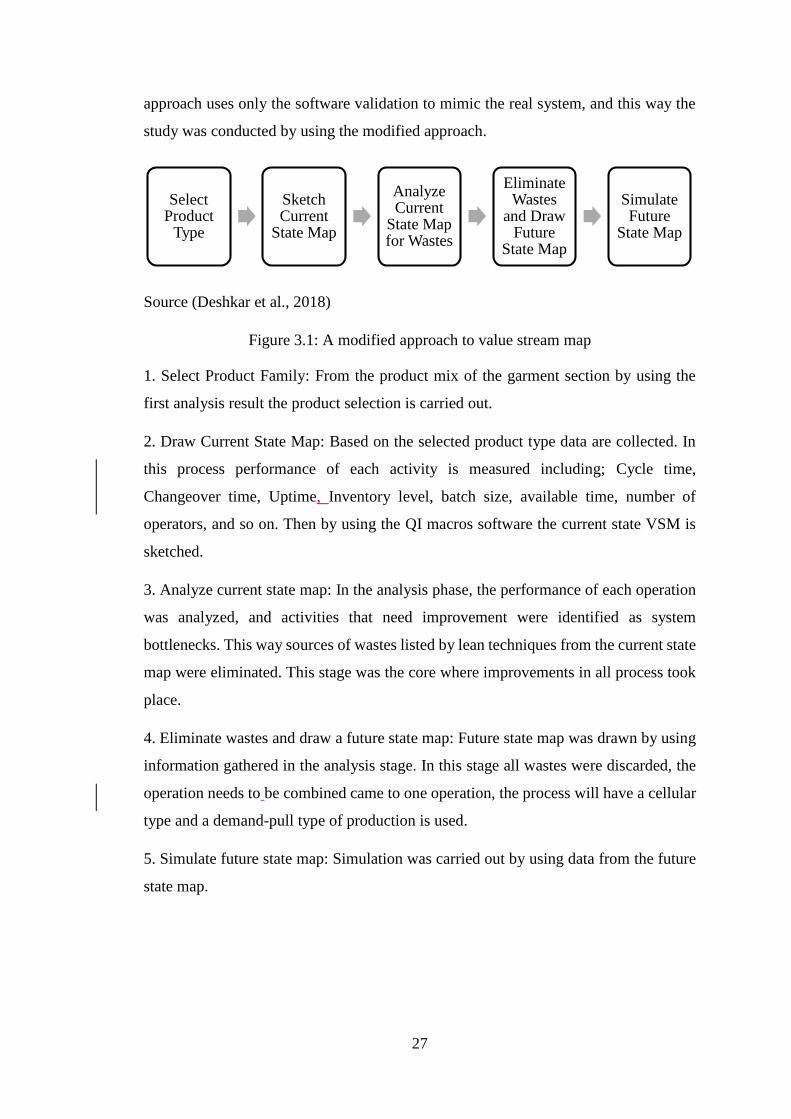
Source (Deshkar et al., 2018)
Figure 3.1: A modified approach to value stream map
1. Select Product Family: From the product mix of the garment section by using the
first analysis result the product selection is carried out.
2. Draw Current State Map: Based on the selected product type data are collected. In
this process performance of each activity is measured including; Cycle time,
Changeover time, Uptime, Inventory level, batch size, available time, number of
operators, and so on. Then by using the QI macros software the current state VSM is
sketched.
3. Analyze current state map: In the analysis phase, the performance of each operation
was analyzed, and activities that need improvement were identified as system
bottlenecks. This way sources of wastes listed by lean techniques from the current state
map were eliminated. This stage was the core where improvements in all process took
place.
4. Eliminate wastes and draw a future state map: Future state map was drawn by using
information gathered in the analysis stage. In this stage all wastes were discarded, the
operation needs to be combined came to one operation, the process will have a cellular
type and a demand-pull type of production is used.
5. Simulate future state map: Simulation was carried out by using data from the future
state map.
Select Product
Type
SketchCurrent
State Map
Analyze Current
State Map for Wastes
Eliminate Wastes
and Draw Future
State Map
Simulate Future
State Map
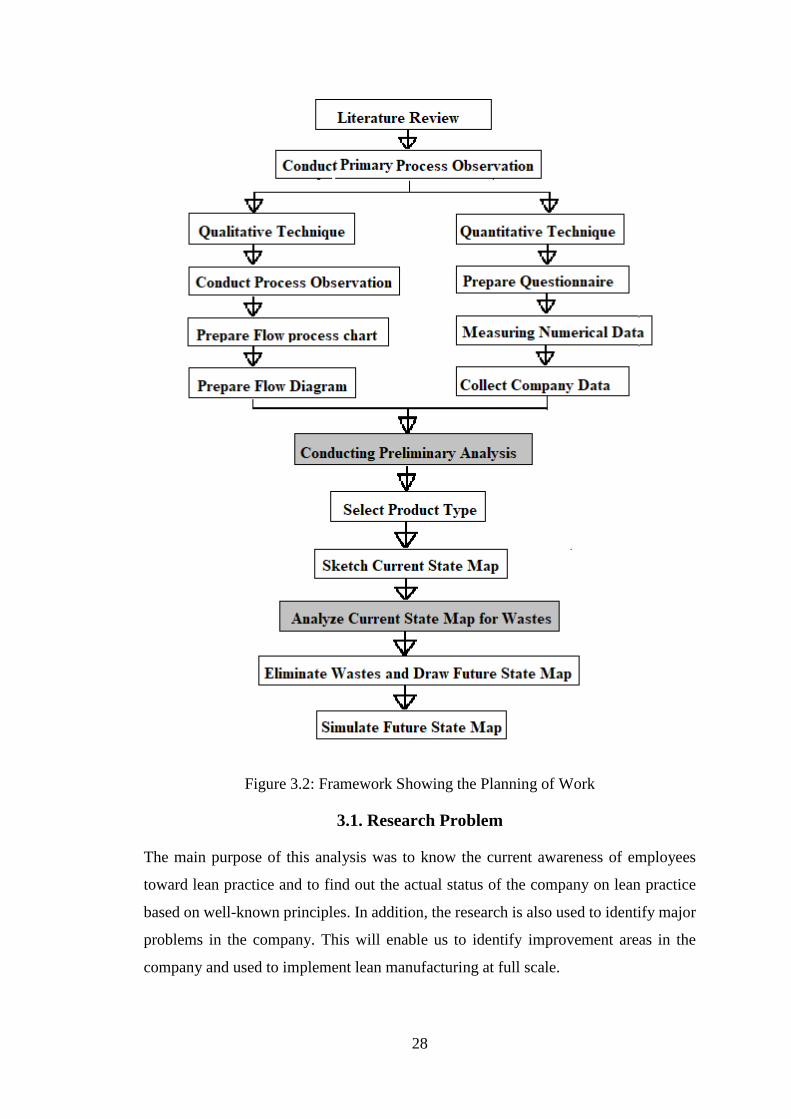
28
Figure 3.2: Framework Showing the Planning of Work
3.1. Research Problem
The main purpose of this analysis was to know the current awareness of employees
toward lean practice and to find out the actual status of the company on lean practice
based on well-known principles. In addition, the research is also used to identify major
problems in the company. This will enable us to identify improvement areas in the
company and used to implement lean manufacturing at full scale.
29
From the research problem, it’s clear that if the research result indicates lower
awareness of employees and poor lean practice it will be the study improvement area.
On the contrary, the positive outcome of the research will allow us to look at other
improvement tools.
3.2. Research Design
The study area used for the research in Bahir Dar Textile Share Company was the
garment section. This was because of one, it used us as an incubation center for lean
practice. Lean production was a practical system used to enhance the performance of a
production system. So if we apply lean within the Garment section and if the results are
good it’s possible to implement it in the preceding section. 2, Most of the other stations
were uses automated machines compared to the Garment section. On the contrary, the
Garment section uses a manual operation system with lots of drawbacks. 3, besides, it’s
the most sensitive station for all stage because its finishing stage and wastage at this
stage will cost high compared to others. The research will be a descriptive research
type.
3.3. Sample Design
A total of 26 employees at a managerial level were sampled using the purposive
sampling method. Employees at the managerial level have a better understanding of the
factory production system and the topic of study.
3.4. Collecting data
The research was mainly carried` out with Interviews, Questionnaire, and Observation.
This data was then analyzed using Microsoft excel.
3.4.1. Interview
Interviews were conducted with the operators and production supervisor. The
researchers used the following questions.
1. Have you started implementing Lean Manufacturing Practices?
2. What are the activities for full filling customer need?
3. What are the activities for improving quality?
4. What is the source of wastes in your production site?
5. What are the activities for eliminating wastes?
30
3.4.2. Direct observations
The researchers observed the production activities and flows of activities. The study
was carried out by observing how each operation was carried out, the material handling
system, the layout, and how information and material flow in the production site. Direct
observations enabled the researchers to collect reliable data without relying on the
respondents’ willingness and abilities.
3.4.3. Questionnaire
The questionnaire was taken from guidelines in a book called Learning to See value
stream mapping (Mike R., & John S., 1999). The guidelines were broadly covered in
the later sections and were the determining factors for the company’s success in many
ways. The questions were also the prerequisite to implement lean at an organizational
level. The questions were distributed for managers at higher and middle level to know
their experience regarding lean practice. The questions were listed in appendix 1:2 and
each statement was assigned with a five-point Likert scale from very poor to very good.
These scales allow us to measure statements from 1 to 5. This data was then analyzed
using Microsoft Excel software by using simple descriptive data analysis.
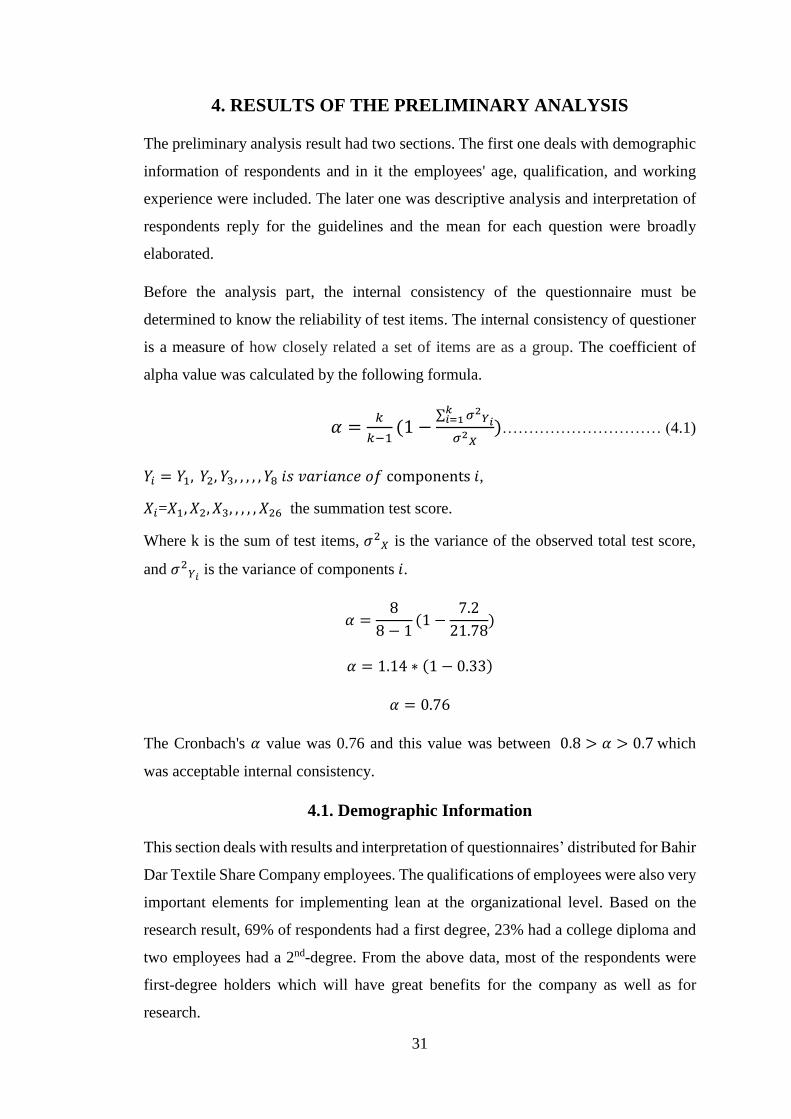
31
4. RESULTS OF THE PRELIMINARY ANALYSIS
The preliminary analysis result had two sections. The first one deals with demographic
information of respondents and in it the employees' age, qualification, and working
experience were included. The later one was descriptive analysis and interpretation of
respondents reply for the guidelines and the mean for each question were broadly
elaborated.
Before the analysis part, the internal consistency of the questionnaire must be
determined to know the reliability of test items. The internal consistency of questioner
is a measure of how closely related a set of items are as a group. The coefficient of
alpha value was calculated by the following formula.
𝛼 =𝑘
𝑘−1(1 −
∑ 𝜎2𝑌𝑖
𝑘𝑖=1
𝜎2𝑋
)………………………… (4.1)
𝑌𝑖 = 𝑌1, 𝑌2, 𝑌3, , , , , 𝑌8 𝑖𝑠 𝑣𝑎𝑟𝑖𝑎𝑛𝑐𝑒 𝑜𝑓 components 𝑖,
𝑋𝑖=𝑋1, 𝑋2, 𝑋3, , , , , 𝑋26 the summation test score.
Where k is the sum of test items, 𝜎2𝑋 is the variance of the observed total test score,
and 𝜎2𝑌𝑖
is the variance of components 𝑖.
𝛼 =8
8 − 1(1 −
7.2
21.78)
𝛼 = 1.14 ∗ (1 − 0.33)
𝛼 = 0.76
The Cronbach's 𝛼 value was 0.76 and this value was between 0.8 > 𝛼 > 0.7 which
was acceptable internal consistency.
4.1. Demographic Information
This section deals with results and interpretation of questionnaires’ distributed for Bahir
Dar Textile Share Company employees. The qualifications of employees were also very
important elements for implementing lean at the organizational level. Based on the
research result, 69% of respondents had a first degree, 23% had a college diploma and
two employees had a 2nd-degree. From the above data, most of the respondents were
first-degree holders which will have great benefits for the company as well as for
research.
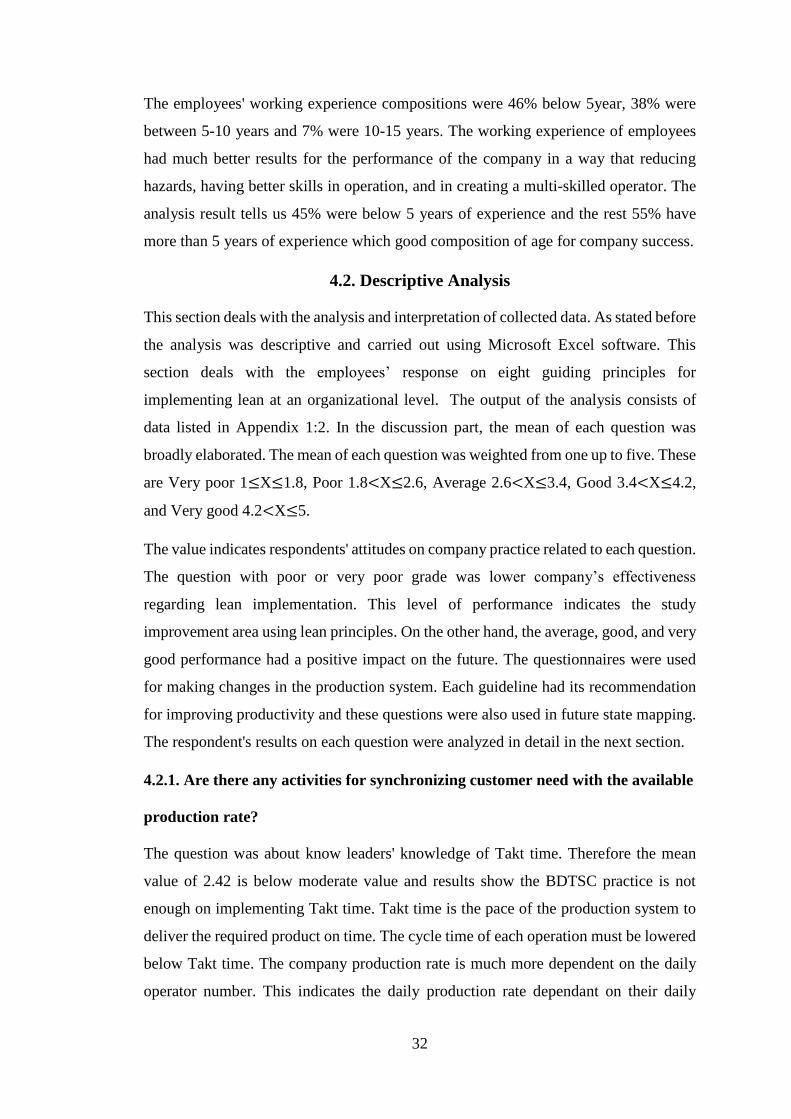
32
The employees' working experience compositions were 46% below 5year, 38% were
between 5-10 years and 7% were 10-15 years. The working experience of employees
had much better results for the performance of the company in a way that reducing
hazards, having better skills in operation, and in creating a multi-skilled operator. The
analysis result tells us 45% were below 5 years of experience and the rest 55% have
more than 5 years of experience which good composition of age for company success.
4.2. Descriptive Analysis
This section deals with the analysis and interpretation of collected data. As stated before
the analysis was descriptive and carried out using Microsoft Excel software. This
section deals with the employees’ response on eight guiding principles for
implementing lean at an organizational level. The output of the analysis consists of
data listed in Appendix 1:2. In the discussion part, the mean of each question was
broadly elaborated. The mean of each question was weighted from one up to five. These
are Very poor 1≤X≤1.8, Poor 1.8<X≤2.6, Average 2.6<X≤3.4, Good 3.4<X≤4.2,
and Very good 4.2<X≤5.
The value indicates respondents' attitudes on company practice related to each question.
The question with poor or very poor grade was lower company’s effectiveness
regarding lean implementation. This level of performance indicates the study
improvement area using lean principles. On the other hand, the average, good, and very
good performance had a positive impact on the future. The questionnaires were used
for making changes in the production system. Each guideline had its recommendation
for improving productivity and these questions were also used in future state mapping.
The respondent's results on each question were analyzed in detail in the next section.
4.2.1. Are there any activities for synchronizing customer need with the available
production rate?
The question was about know leaders' knowledge of Takt time. Therefore the mean
value of 2.42 is below moderate value and results show the BDTSC practice is not
enough on implementing Takt time. Takt time is the pace of the production system to
deliver the required product on time. The cycle time of each operation must be lowered
below Takt time. The company production rate is much more dependent on the daily
operator number. This indicates the daily production rate dependant on their daily
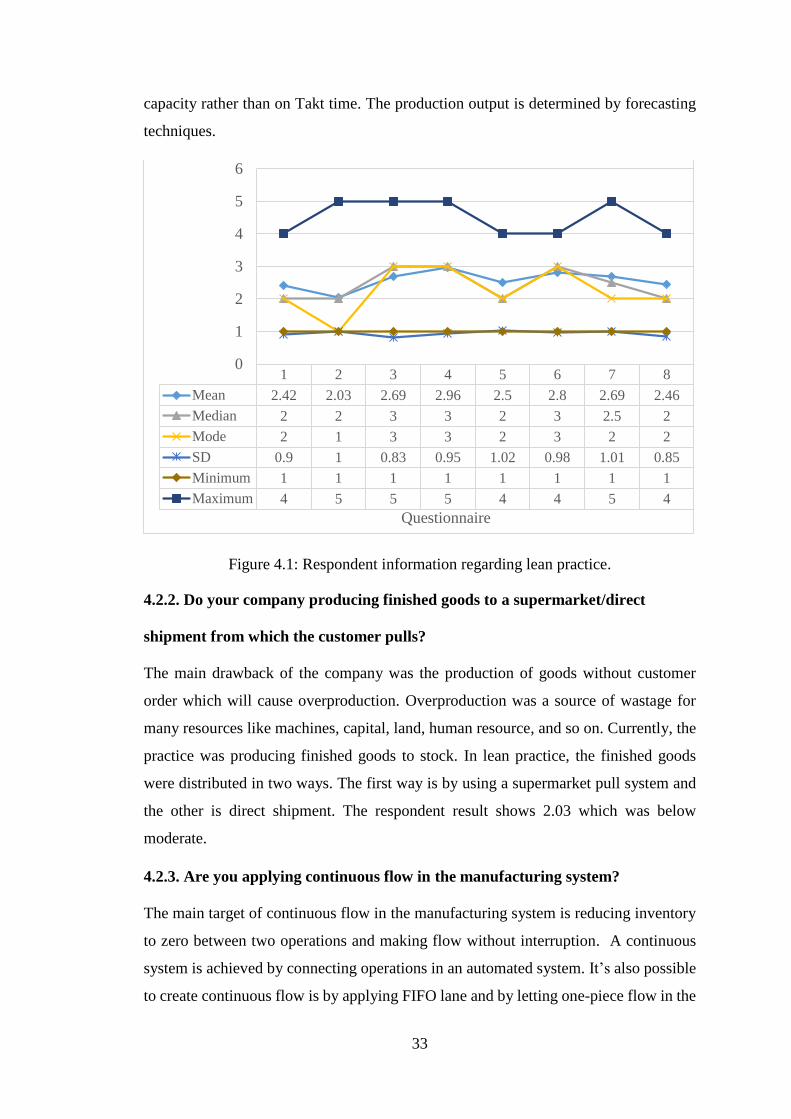
33
capacity rather than on Takt time. The production output is determined by forecasting
techniques.
Figure 4.1: Respondent information regarding lean practice.
4.2.2. Do your company producing finished goods to a supermarket/direct
shipment from which the customer pulls?
The main drawback of the company was the production of goods without customer
order which will cause overproduction. Overproduction was a source of wastage for
many resources like machines, capital, land, human resource, and so on. Currently, the
practice was producing finished goods to stock. In lean practice, the finished goods
were distributed in two ways. The first way is by using a supermarket pull system and
the other is direct shipment. The respondent result shows 2.03 which was below
moderate.
4.2.3. Are you applying continuous flow in the manufacturing system?
The main target of continuous flow in the manufacturing system is reducing inventory
to zero between two operations and making flow without interruption. A continuous
system is achieved by connecting operations in an automated system. It’s also possible
to create continuous flow is by applying FIFO lane and by letting one-piece flow in the
1 2 3 4 5 6 7 8
Mean 2.42 2.03 2.69 2.96 2.5 2.8 2.69 2.46
Median 2 2 3 3 2 3 2.5 2
Mode 2 1 3 3 2 3 2 2
SD 0.9 1 0.83 0.95 1.02 0.98 1.01 0.85
Minimum 1 1 1 1 1 1 1 1
Maximum 4 5 5 5 4 4 5 4
0
1
2
3
4
5
6
Questionnaire
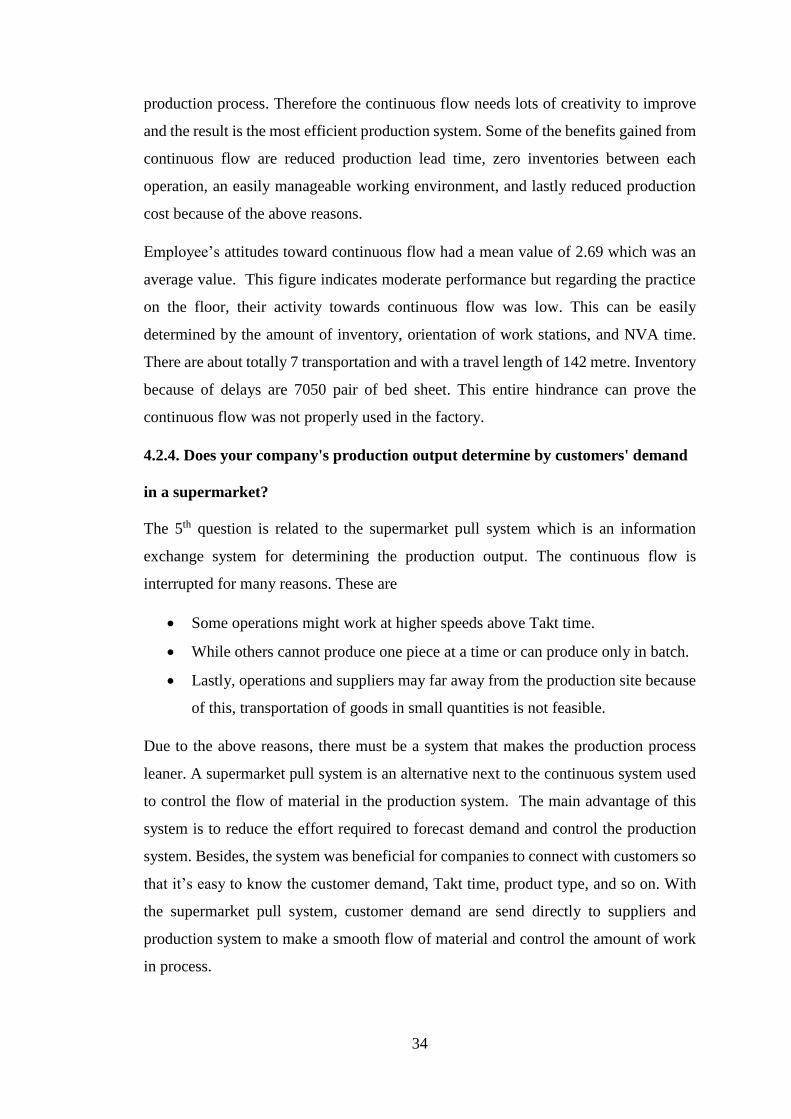
34
production process. Therefore the continuous flow needs lots of creativity to improve
and the result is the most efficient production system. Some of the benefits gained from
continuous flow are reduced production lead time, zero inventories between each
operation, an easily manageable working environment, and lastly reduced production
cost because of the above reasons.
Employee’s attitudes toward continuous flow had a mean value of 2.69 which was an
average value. This figure indicates moderate performance but regarding the practice
on the floor, their activity towards continuous flow was low. This can be easily
determined by the amount of inventory, orientation of work stations, and NVA time.
There are about totally 7 transportation and with a travel length of 142 metre. Inventory
because of delays are 7050 pair of bed sheet. This entire hindrance can prove the
continuous flow was not properly used in the factory.
4.2.4. Does your company's production output determine by customers' demand
in a supermarket?
The 5th question is related to the supermarket pull system which is an information
exchange system for determining the production output. The continuous flow is
interrupted for many reasons. These are
Some operations might work at higher speeds above Takt time.
While others cannot produce one piece at a time or can produce only in batch.
Lastly, operations and suppliers may far away from the production site because
of this, transportation of goods in small quantities is not feasible.
Due to the above reasons, there must be a system that makes the production process
leaner. A supermarket pull system is an alternative next to the continuous system used
to control the flow of material in the production system. The main advantage of this
system is to reduce the effort required to forecast demand and control the production
system. Besides, the system was beneficial for companies to connect with customers so
that it’s easy to know the customer demand, Takt time, product type, and so on. With
the supermarket pull system, customer demand are send directly to suppliers and
production system to make a smooth flow of material and control the amount of work
in process.
35
Source (QI macros software., 2018)
Table 4.1: Value Added vs. Non-Value Added.
The garment shop was characterized by large work in process between operations and
no mechanism was used to control large work in process. The production lead time of
the company was 5.25 days while the value-adding time was 5.25% of lead time. The
main target in VSM was to eliminate NVA activity and reduce NVA time up to 5%.
Accumulations of inventories were the result of unbalanced cycle time between
operations, lack of a system that can reduce inventories, and lack of awareness on
wastage. Therefore this kind of problem needs good insight and a systematic way of
problem-solving.
In the BDTSC garment section, the practice to use supermarkets was almost zero
because the production system was controlled by the schedule from the production
control unit. This way of information exchange system was repetitive and time-
consuming and it needs a new way of the information exchange system. This indicates
the company practice regarding the supermarket pull system was below average value
and it needs some improvement. But the employee’s response toward the question
shows a moderate mean value of 2.96.
4.2.5. Do your company have a pacemaker process that used to schedule the rest
of the process?
The main target of this question is to know whether there was a pacemaker system in
the production system that was used to show of the pace for upstream operations. The
pacemaker process is influenced by different operating conditions. Here the pacemaker
process is applied on a continuous flow of work in process so that pace of production
system can be controlled. The trend inside the BDTSC garment shop was producing
maximum output with available capacity in each independent station without
considering the capacity of downstream operations. The supervisor tries to vary the
Minutes Typical Target
Value Added Time 232
Lead time 4414.3
Non-Value-Added Time 4182.3
Value Added % 5.25% 5% 95%
NVA % 94.75% 95% 5%
Value-added ratio 1:18 1:19 19:1
36
daily production amount by transferring employees from other operations on bottleneck
operations. Here employees identify bottleneck stations as sewing workstations which
were a good approach to meet daily customer demand. The respondent gives a mean
value of 2.5 which was below the average value.
4.2.6. Are there leveling the production mix for fulfilling different customer needs?
The concept behind this question is to know the practice regarding fulfilling different
customer need within the production system. Leveling the production mix is the process
of distributing different product types evenly overtime periods in a production flow. In
the current state value-stream, the product mixing was carried out only in bailing
operation. In bailing operation three types of bed sheets was pressed together to create
a variety of product for fulfilling different customer wants. Currently, the daily
production capacity was only one kind of product in a single manufacturing line. Due
to this production system will have to wait for three-shift works for the final bailing
operation. The waiting time for more than two days was one form of time waste. There
are many reasons for this to happen the first one was the production flow is arranged
for batch and flexibility in the batch system is cannot be attained. As a result, the
inventories and waiting time for different product variety was too large. The
respondent’s evaluation result regarding the questioner is about 2.8 which is a moderate
value representing activity in the unitizing section. On the contrary, the overall practice
to accommodate a variety of product inflow is very low.
4.2.7. Do your company use pitch increment of work?
The answer to this question was no because the production system was batch and it was
controlled by information sent once per day. The production control unit in the garment
section controls their manufacturing line pace was by using daily unit output. Two
operators in the sewing line were accountable to deliver 100 pairs of bed sheets per
shift. So at the end of the day, there was time-consuming work to count each output and
stocking temporary for bailing operation. Here there was uneven load distribution in
each work station for example operators on the sewing line has to produce 100 units
daily but operators on the bailing machine work two-three days per week. Unit
production was the only method available to regulate the daily production output.
Furthermore, the garment section production system is push-type, and controlling the
37
pace of batch production was a difficult task. The average value of 2.69 is too much
relative to practice on the floor and the current production needs some improvement.
4.2.8. Are there techniques for reducing change over time?
Change over time is machine downtime during product change from one product type
to another. The main use of reducing change over time and a lot size of the batch is to
respond quickly to the customer need. In return, it will reduce the inventory amount
and waiting time to be held on the shop floor. In the garment section, the change over
time was almost zero for all operations. The reason was machines are simple and
general-purpose besides most of the operations are manually done. Therefore the main
focus of the researcher was on reducing batch size instead of reducing set up time on
machines. On the other hand, the respondent’s response of 2.46 indicates poor
performance and needs some improvement.
4.3. Summary of Lean Manufacturing Practice for Garment production
The respondent's average mean value of 2.54 regarding the questions deviates a little
bit from the company's actual practice. This value indicates the company employees
had an awareness of lean manufacturing but the company practice in utilizing lean
manufacturing was almost poor. Based on my observation the company employees had
lower awareness in identifying wastes, ways of achieving a lean production system, and
understanding the benefits of lean production. The reasons will be many among them
lower consciousness on each question or keeping company image were a major one.
But the value 2.54 was between 1.8<X≤2.6 which indicates the poor performance of
the company on lean practice. The discreptive analysis result with poor grade shows
the needs of using lean manufacturing in the production system. Generally, the
interview questions, observation, and the questionaries’ results show that garment
production needs some improvements to maximize productivity.
4.4. Selected Product Family
Value stream mapping was carried out for the Garment section assigned to produce
bedsheet. The Section was producing Bed Sheeting in different sizes with a customer
order and for stock. At the time of study one of BDTSC customers, Amaga private
union order bedsheet type 160x250. Therefore for this study, the performance is
measured for the same product type.
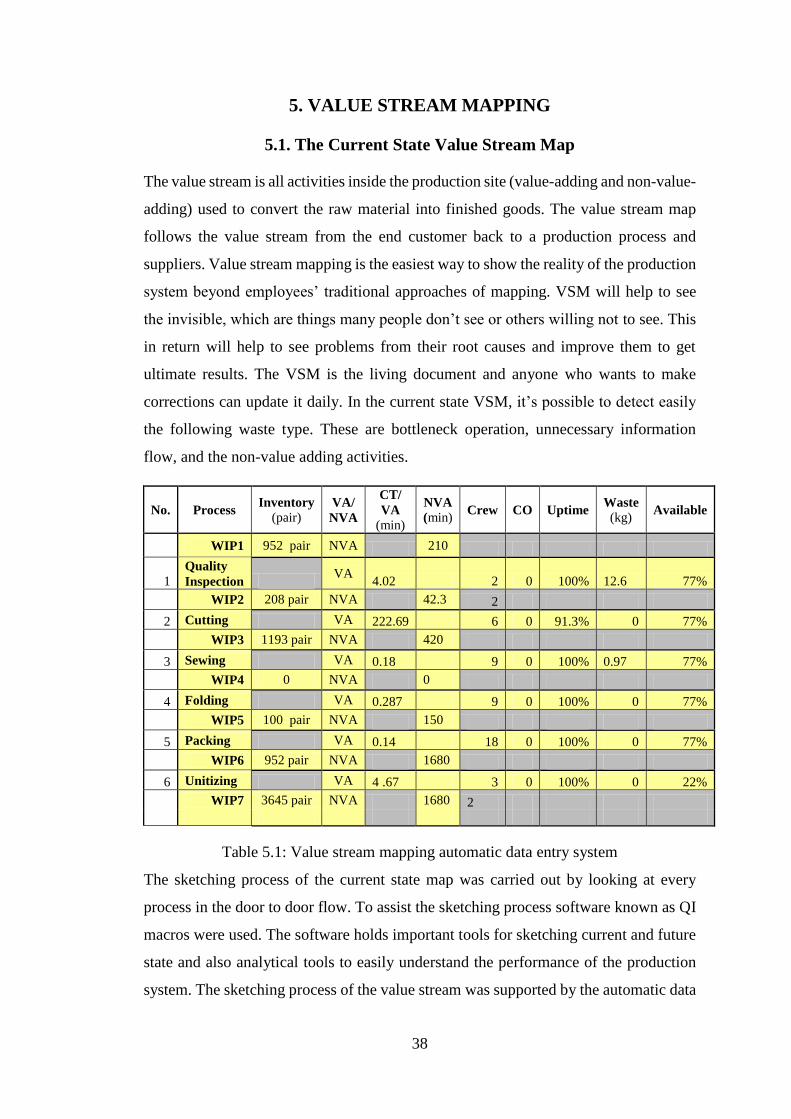
38
5. VALUE STREAM MAPPING
5.1. The Current State Value Stream Map
The value stream is all activities inside the production site (value-adding and non-value-
adding) used to convert the raw material into finished goods. The value stream map
follows the value stream from the end customer back to a production process and
suppliers. Value stream mapping is the easiest way to show the reality of the production
system beyond employees’ traditional approaches of mapping. VSM will help to see
the invisible, which are things many people don’t see or others willing not to see. This
in return will help to see problems from their root causes and improve them to get
ultimate results. The VSM is the living document and anyone who wants to make
corrections can update it daily. In the current state VSM, it’s possible to detect easily
the following waste type. These are bottleneck operation, unnecessary information
flow, and the non-value adding activities.
No. Process Inventory
(pair) VA/
NVA
CT/
VA
(min)
NVA
(min) Crew CO Uptime
Waste
(kg) Available
WIP1 952 pair NVA 210
1 Quality
Inspection VA
4.02 2 0 100% 12.6 77%
WIP2 208 pair NVA 42.3 2
2 Cutting VA 222.69 6 0 91.3% 0 77%
WIP3 1193 pair NVA 420
3 Sewing VA 0.18 9 0 100% 0.97 77%
WIP4 0 NVA 0
4 Folding VA 0.287 9 0 100% 0 77%
WIP5 100 pair NVA 150
5 Packing VA 0.14 18 0 100% 0 77%
WIP6 952 pair NVA 1680
6 Unitizing VA 4 .67 3 0 100% 0 22%
WIP7 3645 pair NVA 1680 2
Table 5.1: Value stream mapping automatic data entry system
The sketching process of the current state map was carried out by looking at every
process in the door to door flow. To assist the sketching process software known as QI
macros were used. The software holds important tools for sketching current and future
state and also analytical tools to easily understand the performance of the production
system. The sketching process of the value stream was supported by the automatic data
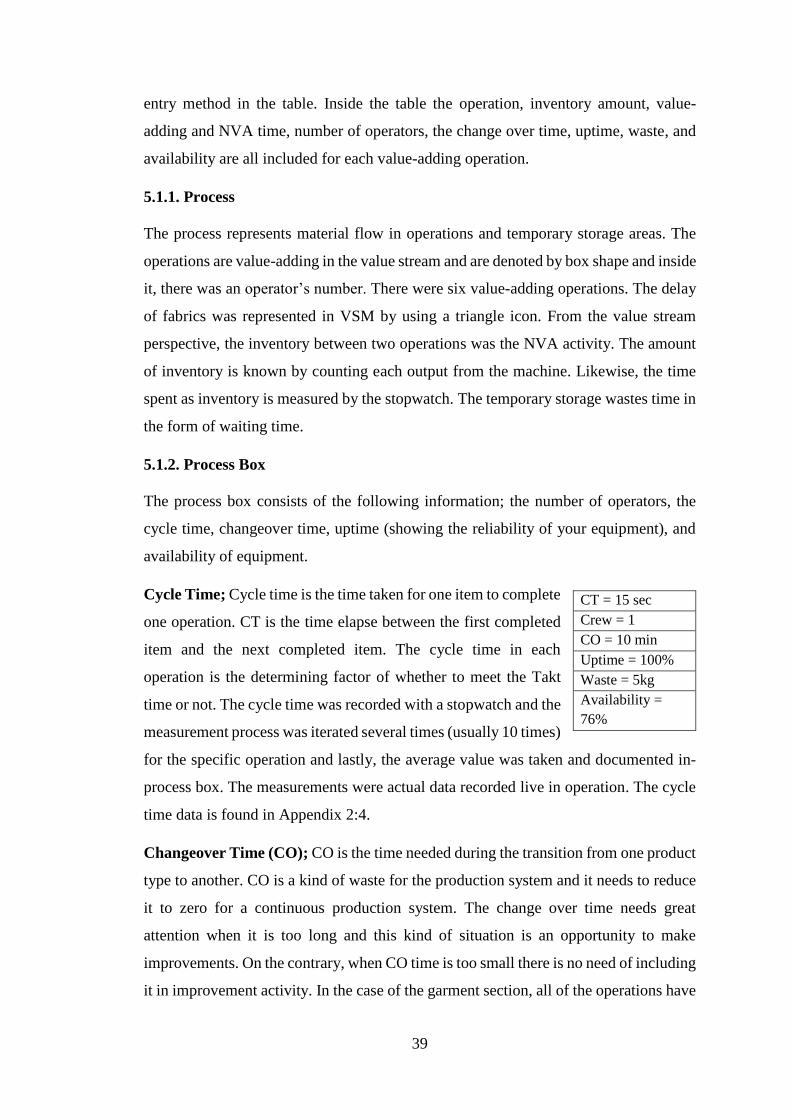
39
entry method in the table. Inside the table the operation, inventory amount, value-
adding and NVA time, number of operators, the change over time, uptime, waste, and
availability are all included for each value-adding operation.
5.1.1. Process
The process represents material flow in operations and temporary storage areas. The
operations are value-adding in the value stream and are denoted by box shape and inside
it, there was an operator’s number. There were six value-adding operations. The delay
of fabrics was represented in VSM by using a triangle icon. From the value stream
perspective, the inventory between two operations was the NVA activity. The amount
of inventory is known by counting each output from the machine. Likewise, the time
spent as inventory is measured by the stopwatch. The temporary storage wastes time in
the form of waiting time.
5.1.2. Process Box
The process box consists of the following information; the number of operators, the
cycle time, changeover time, uptime (showing the reliability of your equipment), and
availability of equipment.
Cycle Time; Cycle time is the time taken for one item to complete
one operation. CT is the time elapse between the first completed
item and the next completed item. The cycle time in each
operation is the determining factor of whether to meet the Takt
time or not. The cycle time was recorded with a stopwatch and the
measurement process was iterated several times (usually 10 times)
for the specific operation and lastly, the average value was taken and documented in-
process box. The measurements were actual data recorded live in operation. The cycle
time data is found in Appendix 2:4.
Changeover Time (CO); CO is the time needed during the transition from one product
type to another. CO is a kind of waste for the production system and it needs to reduce
it to zero for a continuous production system. The change over time needs great
attention when it is too long and this kind of situation is an opportunity to make
improvements. On the contrary, when CO time is too small there is no need of including
it in improvement activity. In the case of the garment section, all of the operations have
CT = 15 sec
Crew = 1
CO = 10 min
Uptime = 100%
Waste = 5kg
Availability =
76%
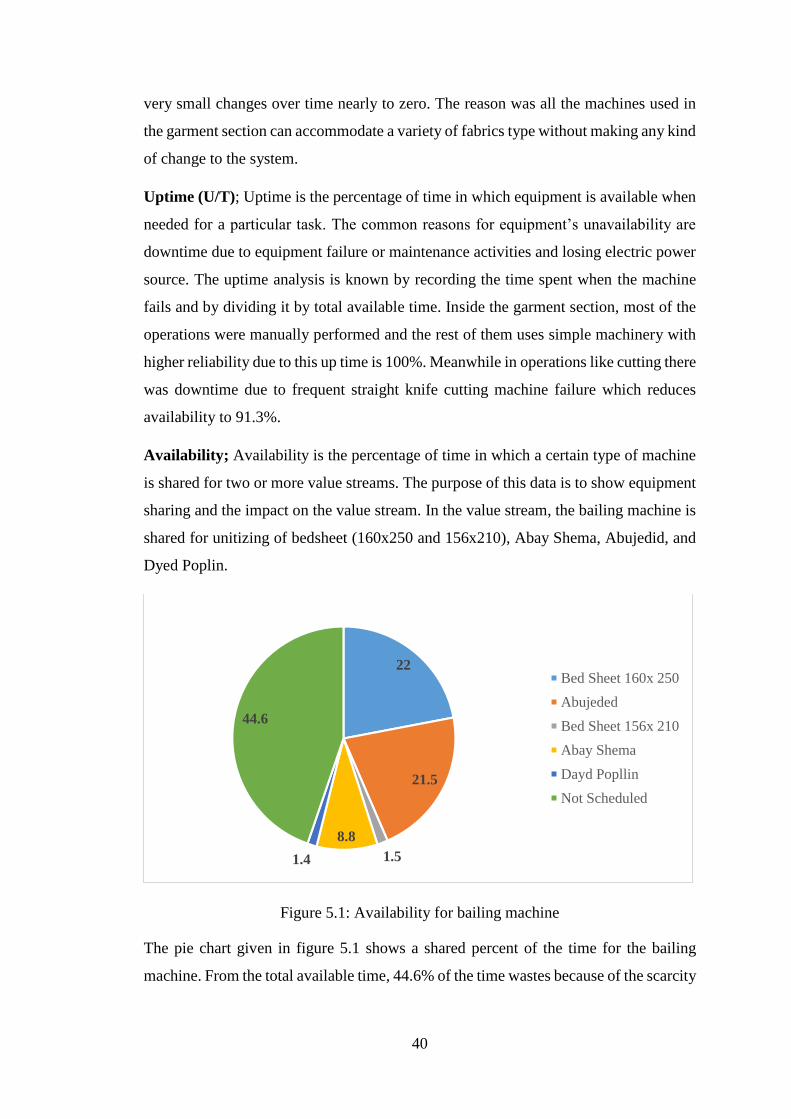
40
very small changes over time nearly to zero. The reason was all the machines used in
the garment section can accommodate a variety of fabrics type without making any kind
of change to the system.
Uptime (U/T); Uptime is the percentage of time in which equipment is available when
needed for a particular task. The common reasons for equipment’s unavailability are
downtime due to equipment failure or maintenance activities and losing electric power
source. The uptime analysis is known by recording the time spent when the machine
fails and by dividing it by total available time. Inside the garment section, most of the
operations were manually performed and the rest of them uses simple machinery with
higher reliability due to this up time is 100%. Meanwhile in operations like cutting there
was downtime due to frequent straight knife cutting machine failure which reduces
availability to 91.3%.
Availability; Availability is the percentage of time in which a certain type of machine
is shared for two or more value streams. The purpose of this data is to show equipment
sharing and the impact on the value stream. In the value stream, the bailing machine is
shared for unitizing of bedsheet (160x250 and 156x210), Abay Shema, Abujedid, and
Dyed Poplin.
Figure 5.1: Availability for bailing machine
The pie chart given in figure 5.1 shows a shared percent of the time for the bailing
machine. From the total available time, 44.6% of the time wastes because of the scarcity
22
21.5
1.5
8.8
1.4
44.6
Bed Sheet 160x 250
Abujeded
Bed Sheet 156x 210
Abay Shema
Dayd Popllin
Not Scheduled
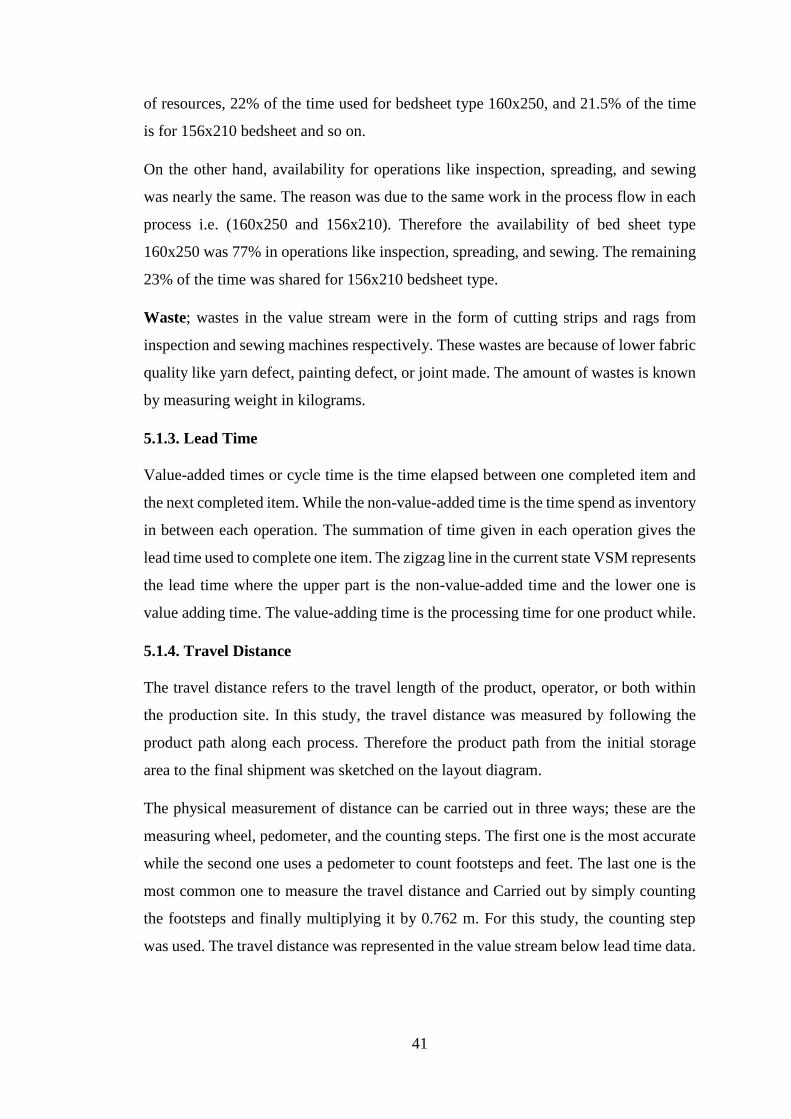
41
of resources, 22% of the time used for bedsheet type 160x250, and 21.5% of the time
is for 156x210 bedsheet and so on.
On the other hand, availability for operations like inspection, spreading, and sewing
was nearly the same. The reason was due to the same work in the process flow in each
process i.e. (160x250 and 156x210). Therefore the availability of bed sheet type
160x250 was 77% in operations like inspection, spreading, and sewing. The remaining
23% of the time was shared for 156x210 bedsheet type.
Waste; wastes in the value stream were in the form of cutting strips and rags from
inspection and sewing machines respectively. These wastes are because of lower fabric
quality like yarn defect, painting defect, or joint made. The amount of wastes is known
by measuring weight in kilograms.
5.1.3. Lead Time
Value-added times or cycle time is the time elapsed between one completed item and
the next completed item. While the non-value-added time is the time spend as inventory
in between each operation. The summation of time given in each operation gives the
lead time used to complete one item. The zigzag line in the current state VSM represents
the lead time where the upper part is the non-value-added time and the lower one is
value adding time. The value-adding time is the processing time for one product while.
5.1.4. Travel Distance
The travel distance refers to the travel length of the product, operator, or both within
the production site. In this study, the travel distance was measured by following the
product path along each process. Therefore the product path from the initial storage
area to the final shipment was sketched on the layout diagram.
The physical measurement of distance can be carried out in three ways; these are the
measuring wheel, pedometer, and the counting steps. The first one is the most accurate
while the second one uses a pedometer to count footsteps and feet. The last one is the
most common one to measure the travel distance and Carried out by simply counting
the footsteps and finally multiplying it by 0.762 m. For this study, the counting step
was used. The travel distance was represented in the value stream below lead time data.
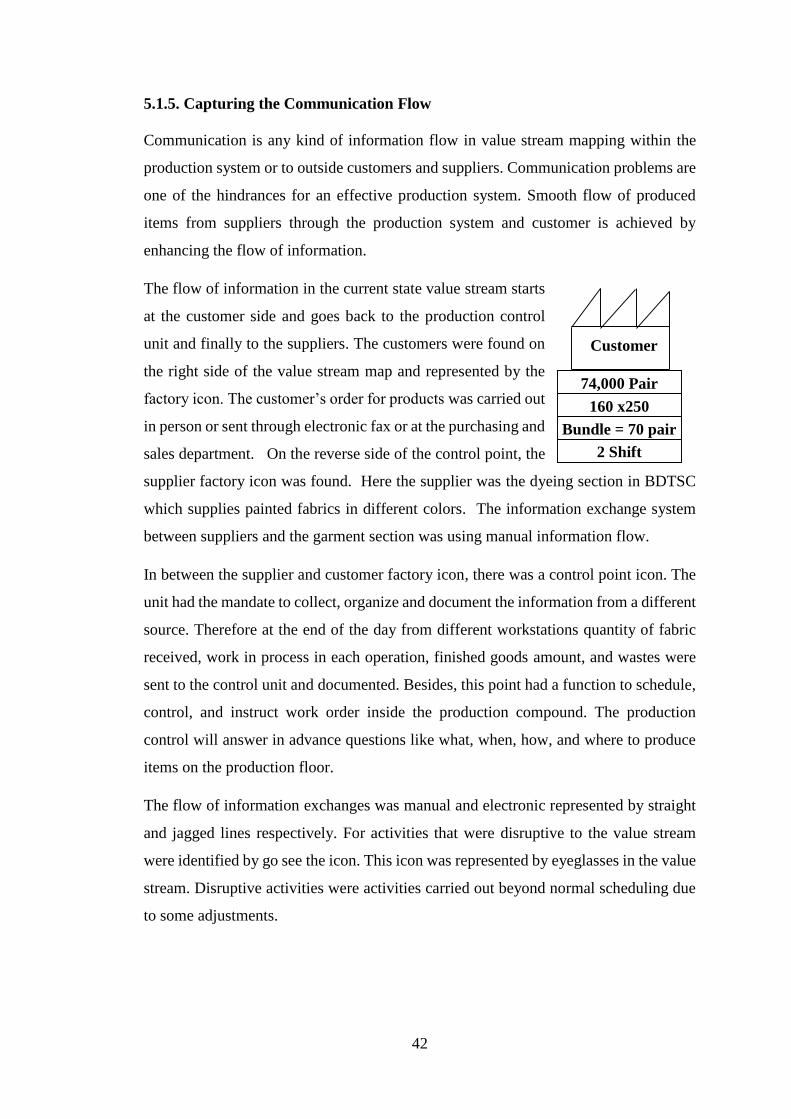
42
5.1.5. Capturing the Communication Flow
Communication is any kind of information flow in value stream mapping within the
production system or to outside customers and suppliers. Communication problems are
one of the hindrances for an effective production system. Smooth flow of produced
items from suppliers through the production system and customer is achieved by
enhancing the flow of information.
The flow of information in the current state value stream starts
at the customer side and goes back to the production control
unit and finally to the suppliers. The customers were found on
the right side of the value stream map and represented by the
factory icon. The customer’s order for products was carried out
in person or sent through electronic fax or at the purchasing and
sales department. On the reverse side of the control point, the
supplier factory icon was found. Here the supplier was the dyeing section in BDTSC
which supplies painted fabrics in different colors. The information exchange system
between suppliers and the garment section was using manual information flow.
In between the supplier and customer factory icon, there was a control point icon. The
unit had the mandate to collect, organize and document the information from a different
source. Therefore at the end of the day from different workstations quantity of fabric
received, work in process in each operation, finished goods amount, and wastes were
sent to the control unit and documented. Besides, this point had a function to schedule,
control, and instruct work order inside the production compound. The production
control will answer in advance questions like what, when, how, and where to produce
items on the production floor.
The flow of information exchanges was manual and electronic represented by straight
and jagged lines respectively. For activities that were disruptive to the value stream
were identified by go see the icon. This icon was represented by eyeglasses in the value
stream. Disruptive activities were activities carried out beyond normal scheduling due
to some adjustments.
74,000 Pair
160 x250
Bundle = 70 pair
2 Shift
Customer

43
Figure 5.2; Documenting manual (verbal) and electronic communication
Instructions
© 2017 KnowWare
Quality
Inspection208 Cutting 1193 Sewing 0 Folding 100
Dyeing
Section
Packing 952 Bailing 3645
Production
Control
FIFO2 6 9 9 18 3
`Production Controlling
& Daily Work Order Shipping
Schedule
Shipping
Quality Reports
Fax
Purchase Order
1 X
daily
Daily Order5-Day
Forcast
Order Change
Amaga
74,000 Pair
160 x250
Unit =70
pair2 Shift
952
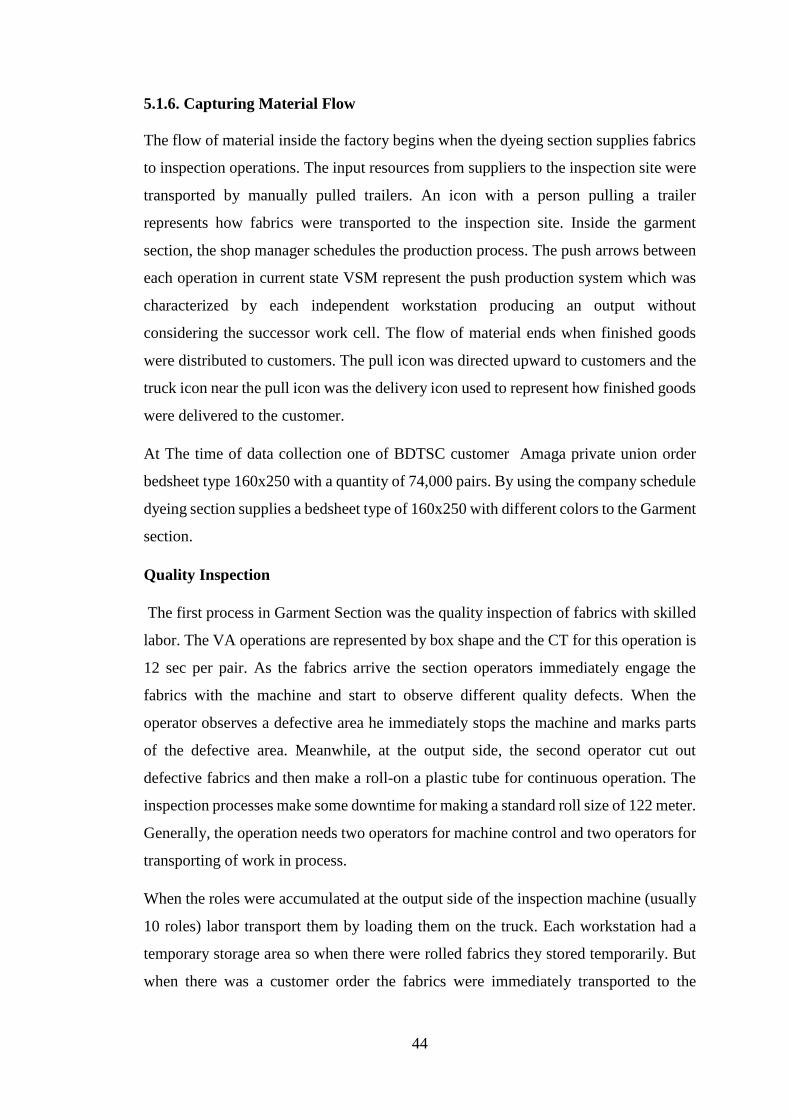
44
5.1.6. Capturing Material Flow
The flow of material inside the factory begins when the dyeing section supplies fabrics
to inspection operations. The input resources from suppliers to the inspection site were
transported by manually pulled trailers. An icon with a person pulling a trailer
represents how fabrics were transported to the inspection site. Inside the garment
section, the shop manager schedules the production process. The push arrows between
each operation in current state VSM represent the push production system which was
characterized by each independent workstation producing an output without
considering the successor work cell. The flow of material ends when finished goods
were distributed to customers. The pull icon was directed upward to customers and the
truck icon near the pull icon was the delivery icon used to represent how finished goods
were delivered to the customer.
At The time of data collection one of BDTSC customer Amaga private union order
bedsheet type 160x250 with a quantity of 74,000 pairs. By using the company schedule
dyeing section supplies a bedsheet type of 160x250 with different colors to the Garment
section.
Quality Inspection
The first process in Garment Section was the quality inspection of fabrics with skilled
labor. The VA operations are represented by box shape and the CT for this operation is
12 sec per pair. As the fabrics arrive the section operators immediately engage the
fabrics with the machine and start to observe different quality defects. When the
operator observes a defective area he immediately stops the machine and marks parts
of the defective area. Meanwhile, at the output side, the second operator cut out
defective fabrics and then make a roll-on a plastic tube for continuous operation. The
inspection processes make some downtime for making a standard roll size of 122 meter.
Generally, the operation needs two operators for machine control and two operators for
transporting of work in process.
When the roles were accumulated at the output side of the inspection machine (usually
10 roles) labor transport them by loading them on the truck. Each workstation had a
temporary storage area so when there were rolled fabrics they stored temporarily. But
when there was a customer order the fabrics were immediately transported to the

45
spreading section. In this case, the customer order was much more important than
making to stock.
Cutting Operation
Next to inspection, the second VA operation was cutting operation. As indicated earlier
in the value stream map the work station needs 6 workers and aiming to spread and
finally cut fabrics with a cycle time of 11.2 sec. In this process, each role of fabric was
loaded on the spreader and spread on the table making multiple layers of fabrics. After
spreading operation the empty plastic tube was discarded and replaced with a new one.
Finally when the spreading process is over the next process will be cutting with the size
of the pillowcase and bedsheets. The uptime of cutting operation is about 91.3%. The
spreading process currently produces two times per shift and can produce 1193 pairs of
bed sheets.
Figure 5.3: Inventory three
The spreading operation produces cut fabrics two times per shift. These cut components
are counted and bundled with units having ten pieces. The cut bundle was then sent to
a temporary storage area for next day use. The waiting time for inventory three was
around 420 min.
Sewing Work Station
The third VA operation was sewing and it was composed of stitching and sewing
activities on pillowcases and bedsheets respectively. The sewing operation was carried
out with a sewing machine and had a cycle time of 97 sec per pair. In addition, the
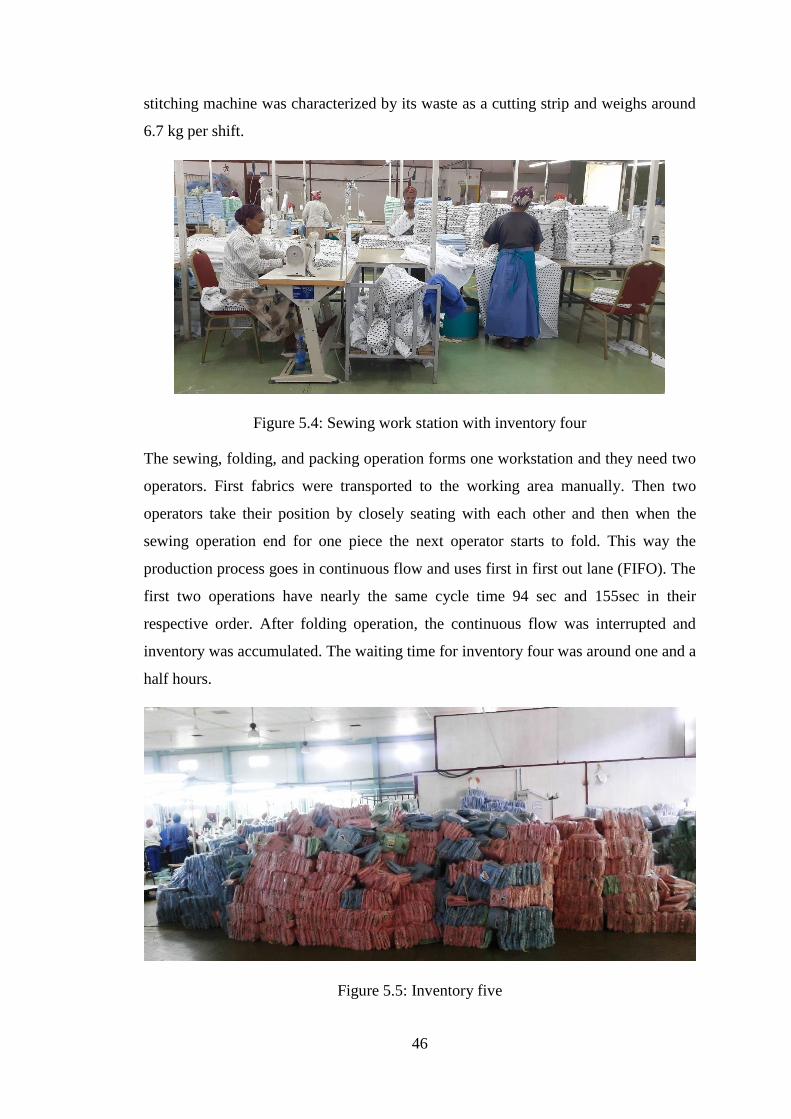
46
stitching machine was characterized by its waste as a cutting strip and weighs around
6.7 kg per shift.
Figure 5.4: Sewing work station with inventory four
The sewing, folding, and packing operation forms one workstation and they need two
operators. First fabrics were transported to the working area manually. Then two
operators take their position by closely seating with each other and then when the
sewing operation end for one piece the next operator starts to fold. This way the
production process goes in continuous flow and uses first in first out lane (FIFO). The
first two operations have nearly the same cycle time 94 sec and 155sec in their
respective order. After folding operation, the continuous flow was interrupted and
inventory was accumulated. The waiting time for inventory four was around one and a
half hours.
Figure 5.5: Inventory five
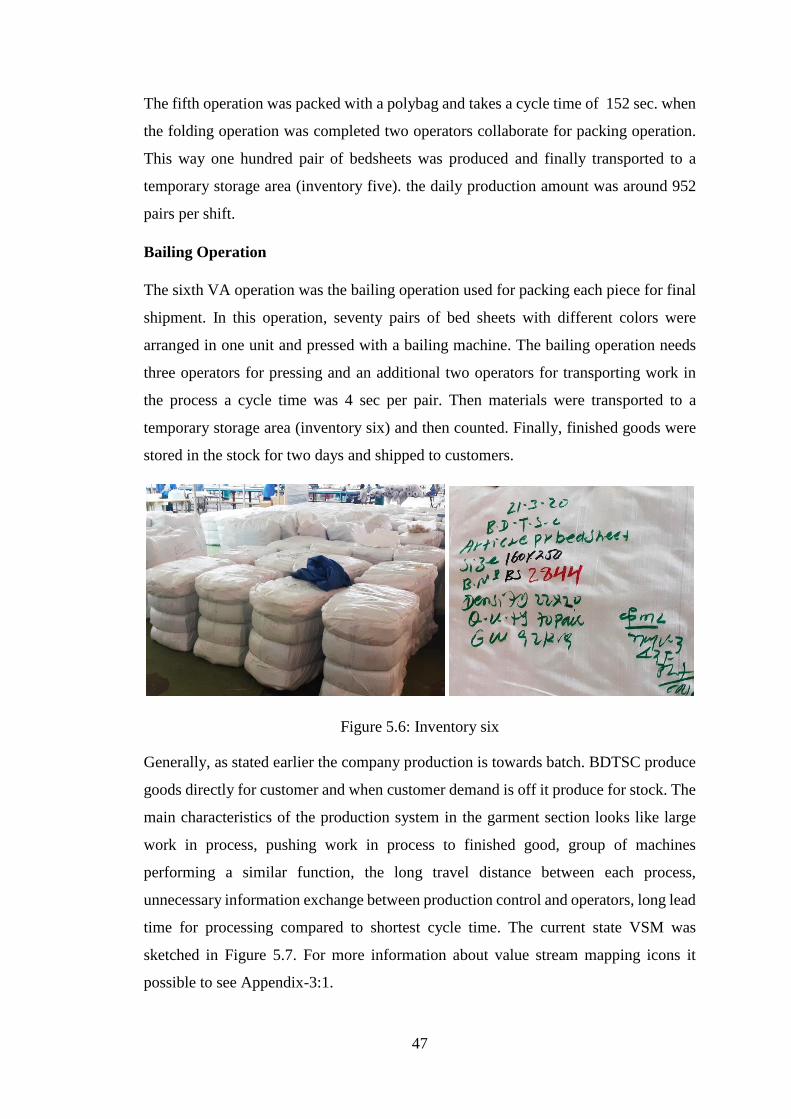
47
The fifth operation was packed with a polybag and takes a cycle time of 152 sec. when
the folding operation was completed two operators collaborate for packing operation.
This way one hundred pair of bedsheets was produced and finally transported to a
temporary storage area (inventory five). the daily production amount was around 952
pairs per shift.
Bailing Operation
The sixth VA operation was the bailing operation used for packing each piece for final
shipment. In this operation, seventy pairs of bed sheets with different colors were
arranged in one unit and pressed with a bailing machine. The bailing operation needs
three operators for pressing and an additional two operators for transporting work in
the process a cycle time was 4 sec per pair. Then materials were transported to a
temporary storage area (inventory six) and then counted. Finally, finished goods were
stored in the stock for two days and shipped to customers.
Figure 5.6: Inventory six
Generally, as stated earlier the company production is towards batch. BDTSC produce
goods directly for customer and when customer demand is off it produce for stock. The
main characteristics of the production system in the garment section looks like large
work in process, pushing work in process to finished good, group of machines
performing a similar function, the long travel distance between each process,
unnecessary information exchange between production control and operators, long lead
time for processing compared to shortest cycle time. The current state VSM was
sketched in Figure 5.7. For more information about value stream mapping icons it
possible to see Appendix-3:1.
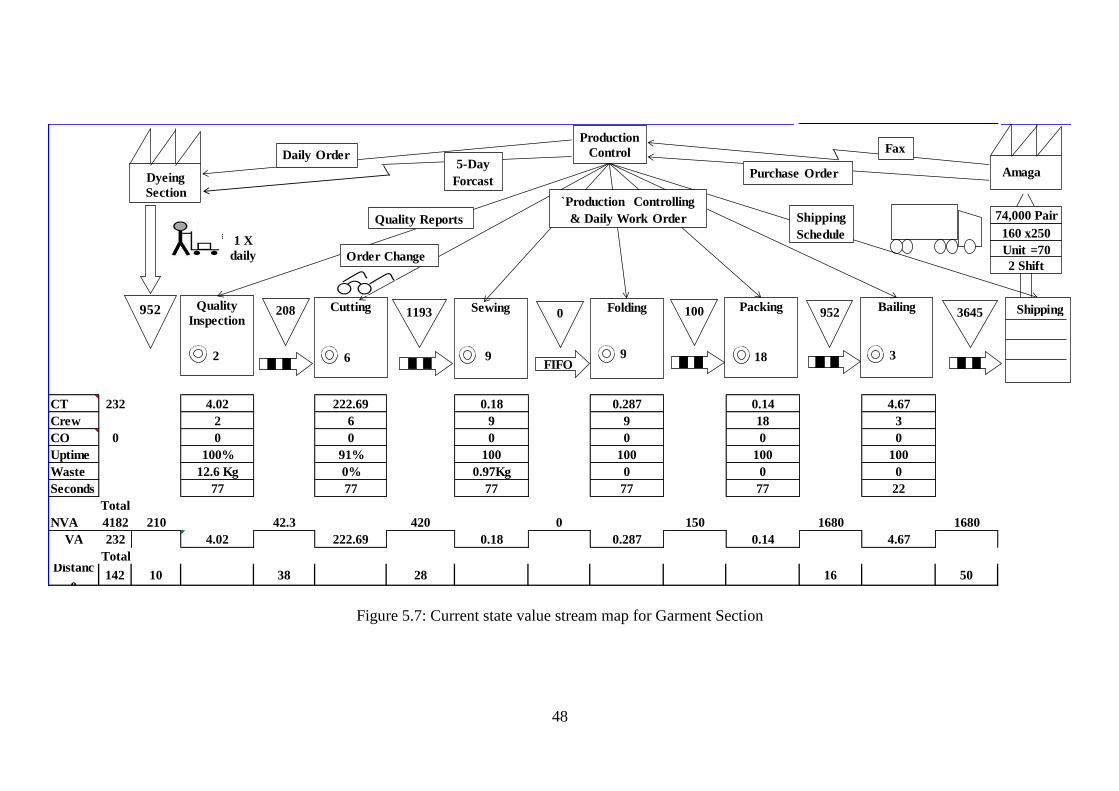
48
Figure 5.7: Current state value stream map for Garment Section
Instructions
© 2017 KnowWare
CT 232 4.02 222.69 0.18 0.287 0.14 4.67
Crew 2 6 9 9 18 3
CO 0 0 0 0 0 0 0
Uptime 100% 91% 100 100 100 100
Waste 12.6 Kg 0% 0.97Kg 0 0 0
Seconds 77 77 77 77 77 22
Total
NVA 4182 210 42.3 420 0 150 1680 1680
VA 232 4.02 222.69 0.18 0.287 0.14 4.67
TotalDistanc
e 142 10 38 28 16 50
Quality
Inspection208 Cutting 1193 Sewing 0 Folding 100
Dyeing
Section
Packing 952 Bailing 3645
Production
Control
FIFO2 6 9 9 18 3
`Production Controlling
& Daily Work Order Shipping
Schedule
Shipping
Quality Reports
Fax
Purchase Order
1 X
daily
Daily Order5-Day
Forcast
Order Change
Amaga
74,000 Pair
160 x250
Unit =70
pair2 Shift
952
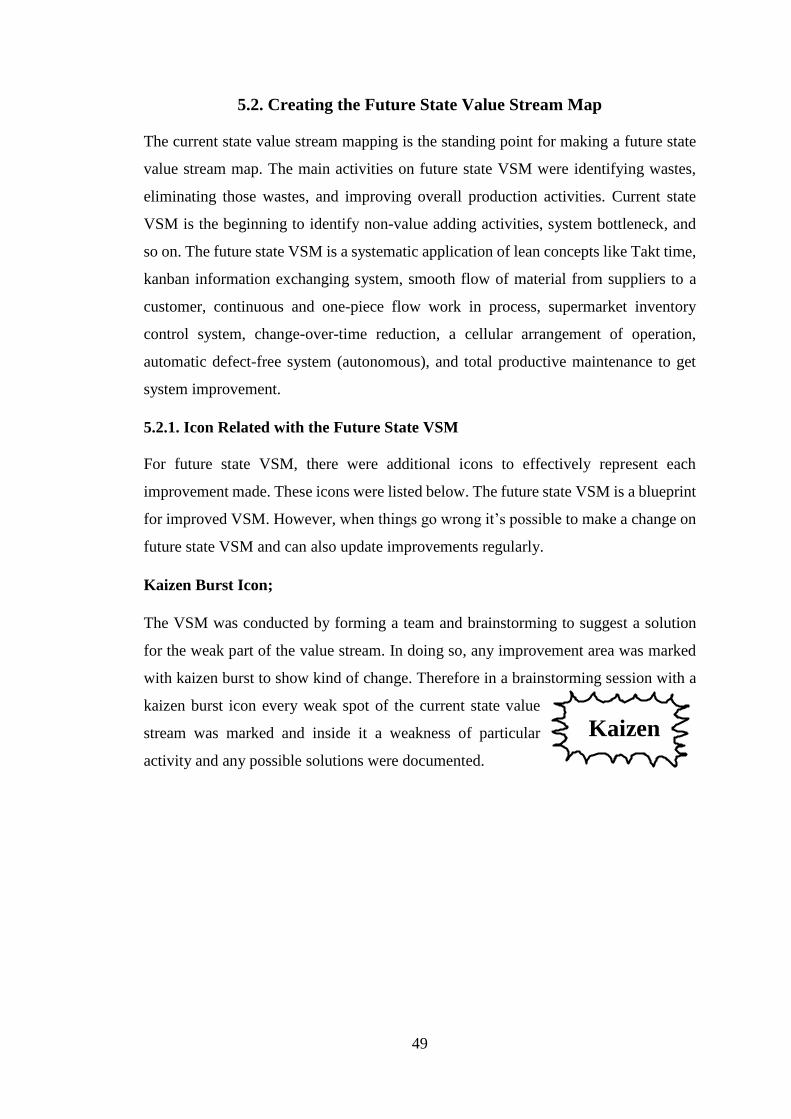
49
5.2. Creating the Future State Value Stream Map
The current state value stream mapping is the standing point for making a future state
value stream map. The main activities on future state VSM were identifying wastes,
eliminating those wastes, and improving overall production activities. Current state
VSM is the beginning to identify non-value adding activities, system bottleneck, and
so on. The future state VSM is a systematic application of lean concepts like Takt time,
kanban information exchanging system, smooth flow of material from suppliers to a
customer, continuous and one-piece flow work in process, supermarket inventory
control system, change-over-time reduction, a cellular arrangement of operation,
automatic defect-free system (autonomous), and total productive maintenance to get
system improvement.
5.2.1. Icon Related with the Future State VSM
For future state VSM, there were additional icons to effectively represent each
improvement made. These icons were listed below. The future state VSM is a blueprint
for improved VSM. However, when things go wrong it’s possible to make a change on
future state VSM and can also update improvements regularly.
Kaizen Burst Icon;
The VSM was conducted by forming a team and brainstorming to suggest a solution
for the weak part of the value stream. In doing so, any improvement area was marked
with kaizen burst to show kind of change. Therefore in a brainstorming session with a
kaizen burst icon every weak spot of the current state value
stream was marked and inside it a weakness of particular
activity and any possible solutions were documented.
Kaizen
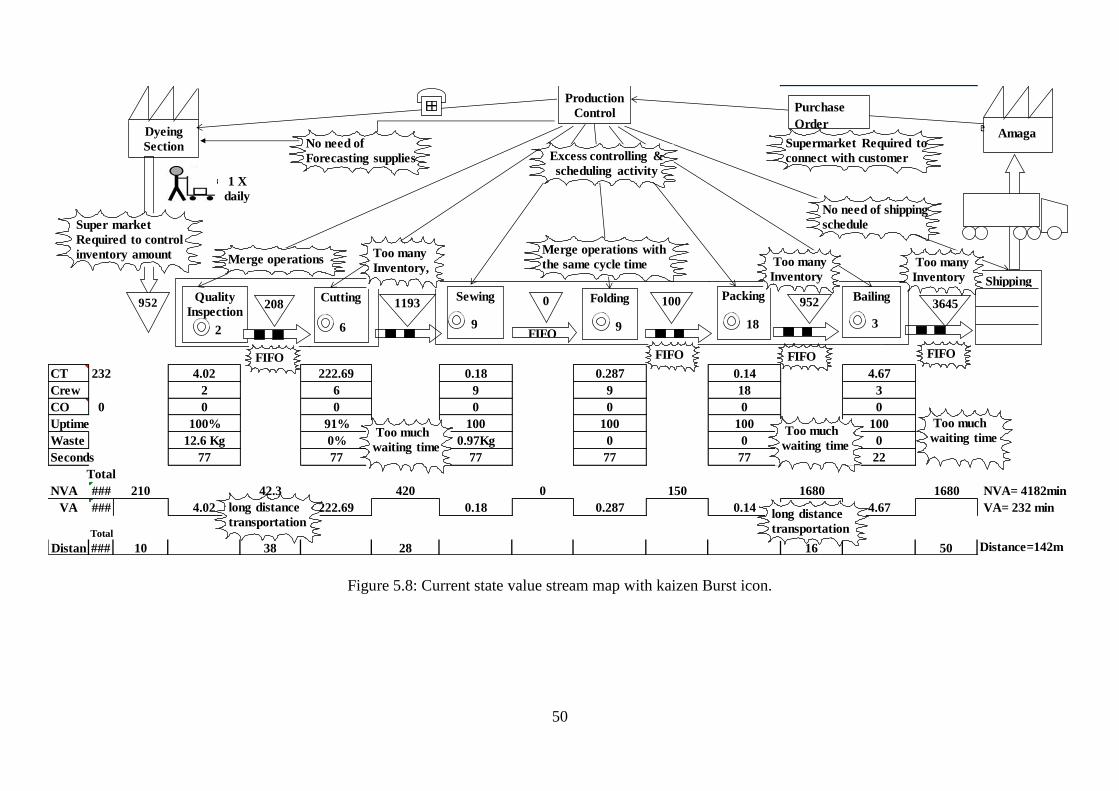
50
Figure 5.8: Current state value stream map with kaizen Burst icon.
Instructions
© 2017 KnowWare
CT 232 4.02 222.69 0.18 0.287 0.14 4.67
Crew 2 6 9 9 18 3
CO 0 0 0 0 0 0 0
Uptime 100% 91% 100 100 100 100
Waste 12.6 Kg 0% 0.97Kg 0 0 0
Seconds 77 77 77 77 77 22
Total
NVA ### 210 42.3 420 0 150 1680 1680 NVA= 4182min
VA ### 4.02 222.69 0.18 0.287 0.14 4.67 VA= 232 min
Total
Distan ### 10 38 28 16 50 Distance=142m
Quality
Inspection208
Cutting1193
Sewing 0 Folding 100
CustomeDyeing
Section
Packing952 Bailing
3645
Production
Control
FIFO2 6 9 9 18 3
Fax
Purchase
Order
Shipping
Super market
Required to control
inventory amount
No need of
Forecasting supplies
1 X
daily
FIFO FIFO FIFO
Merge operations with
the same cycle time
Too much
waiting time
Too many
Inventory
Excess controlling &
scheduling activity
No need of shipping
schedule
Too much
waiting time
Supermarket Required to
connect with customer
Too many
Inventory,
Too much
waiting time
Too many
Inventory
long distance
transportation
FIFO
long distance
transportation
Merge operations
952
Amaga
51
The Supermarket icon
The Supermarket icon was related to the pull flow in which customer requirements were
necessary to continue the production. In lean practice, the pull flow needs to be
continuous but when the flow is disrupted due to the nature of operation the inventory
needs to be controlled. The supermarket pull is a system used to control the production
amount of supplier, operation, and output of the production system. Supermarket pull
system uses card like information exchange system known as kanban. The card is used
as a signal when the amount of inventory is depleted below a certain level in the
supermarket and in return to make an order of production (replenishment signal). The
production team had a mandate to control how to use this kanban system.
Withdrawal kanban icon
Facilitate the flow of work in process in the downstream operations. This card is
attached with work in process and passes in each operation up to the finishing line and
when the product is sent to other processes the withdrawal kanban sends back to the
supermarket to replenish the previous one.
Production kanban icon
The production kanban icon is the information required to continue production activity
in the supplying operation. The production order for successive operations is obtained
from the kanban box. The production kanban can go further to the upstream operations
and even outside of production to the suppliers for the smooth flow of material. The
information exchange system between the suppliers and the production system is
carried out using kanban posts.
Signal kanbans icon
The signal kanbans icon represents replenishment signals for the supplying process to
have more bins or boxes. Signal kanban is represented by an inverted triangle box.
First in first out (FIFO)
The FIFO system materials are flowing in each decoupled operation without the use of
a kanban system and can substitute the supermarket pull system. This is carried out by
using bins that can hold a small amount of work in process and by letting to pass in
52
each process in their respective order. The flow of work in process is stopped when the
finished goods are not further required by customers.
5.2.2. Communication Flow in a future state VSM
The flow of information begins when customers purchase goods from the supermarket.
in return sells representative daily count empty spaces on shelves and sent the order for
supplies electronically by using electronic data interchange) to a production control
unit. Here the need for a product was sent when the total amount of empty spaces were
reached one kanban. One kanban is equivalent to 70 pairs of bedsheets. Then the
production control unit schedule to produce products with available facilities as per
customer need. The production order was then sent immediately to each section
electronically and the sections need to produce with an improved system according to
customer needs.
The flow of material was assisted by kanban cards and this card initiates the flow of
work in process in the garment section. Inside the garment section, the shop manager
controls the production process by using information sent from the inspection site, work
cell 2, and shipping section. At the inspection site by using withdrawal kanban the
amount of fabric received was sent electronically to the control unit. The pace of overall
operation and the amount of produced items were controlled by pitch increment of work
at work cell 2. The amount of produced and shipped items are controlled by information
sent from the shipping site. The information exchange system listed above was
vertically between the control unit and each operation. The vertical information
exchange system must be assisted by a local area networking system. On the other hand,
there is also a lateral information exchange system between operations. This way of
information exchange system reduces unnecessary information flow and was carried
out by using kanban cards.
5.2.3. Synchronizing Customer Need with the Available Production Rate
The process of determining production output is a crucial thing for companies' success
to eliminate the overproduction and problem of stock out. There are many ways for
determining production output among them forecasting techniques and producing with
customer orders are commonly used. The former way uses a large amount of customer
requirement data collected previously and using that it predicts the future demand.
Although it can predict future demand it has a problem related to deviation from actual
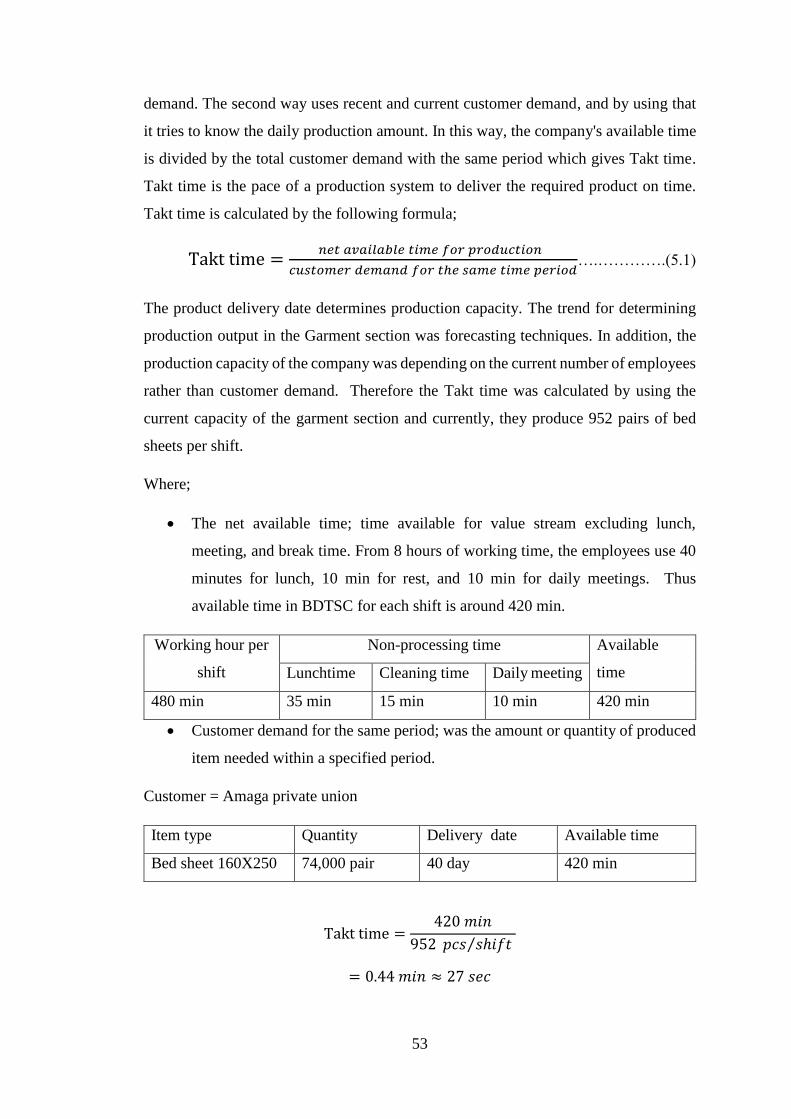
53
demand. The second way uses recent and current customer demand, and by using that
it tries to know the daily production amount. In this way, the company's available time
is divided by the total customer demand with the same period which gives Takt time.
Takt time is the pace of a production system to deliver the required product on time.
Takt time is calculated by the following formula;
Takt time =𝑛𝑒𝑡 𝑎𝑣𝑎𝑖𝑙𝑎𝑏𝑙𝑒 𝑡𝑖𝑚𝑒 𝑓𝑜𝑟 𝑝𝑟𝑜𝑑𝑢𝑐𝑡𝑖𝑜𝑛
𝑐𝑢𝑠𝑡𝑜𝑚𝑒𝑟 𝑑𝑒𝑚𝑎𝑛𝑑 𝑓𝑜𝑟 𝑡ℎ𝑒 𝑠𝑎𝑚𝑒 𝑡𝑖𝑚𝑒 𝑝𝑒𝑟𝑖𝑜𝑑….………….(5.1)
The product delivery date determines production capacity. The trend for determining
production output in the Garment section was forecasting techniques. In addition, the
production capacity of the company was depending on the current number of employees
rather than customer demand. Therefore the Takt time was calculated by using the
current capacity of the garment section and currently, they produce 952 pairs of bed
sheets per shift.
Where;
The net available time; time available for value stream excluding lunch,
meeting, and break time. From 8 hours of working time, the employees use 40
minutes for lunch, 10 min for rest, and 10 min for daily meetings. Thus
available time in BDTSC for each shift is around 420 min.
Working hour per
shift
Non-processing time Available
time Lunchtime Cleaning time Daily meeting
480 min 35 min 15 min 10 min 420 min
Customer demand for the same period; was the amount or quantity of produced
item needed within a specified period.
Customer = Amaga private union
Item type Quantity Delivery date Available time
Bed sheet 160X250 74,000 pair 40 day 420 min
Takt time =420 𝑚𝑖𝑛
952 𝑝𝑐𝑠 𝑠ℎ𝑖𝑓𝑡⁄
= 0.44 𝑚𝑖𝑛 ≈ 27 𝑠𝑒𝑐
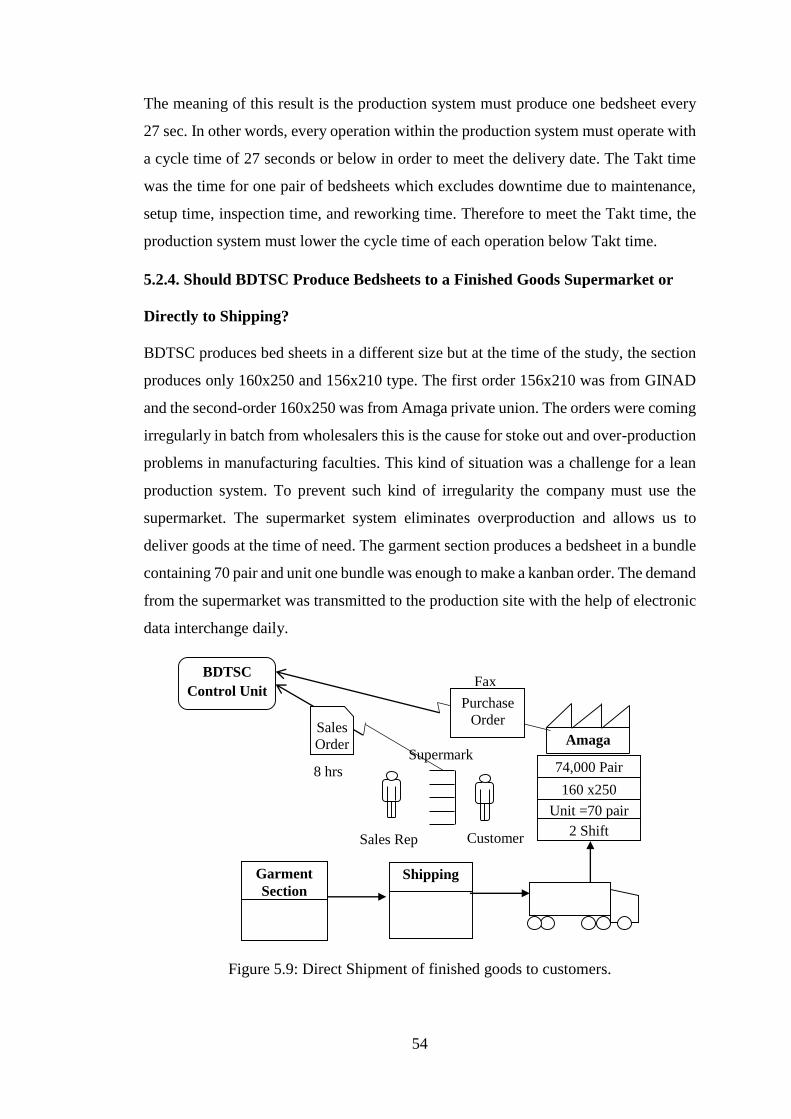
54
The meaning of this result is the production system must produce one bedsheet every
27 sec. In other words, every operation within the production system must operate with
a cycle time of 27 seconds or below in order to meet the delivery date. The Takt time
was the time for one pair of bedsheets which excludes downtime due to maintenance,
setup time, inspection time, and reworking time. Therefore to meet the Takt time, the
production system must lower the cycle time of each operation below Takt time.
5.2.4. Should BDTSC Produce Bedsheets to a Finished Goods Supermarket or
Directly to Shipping?
BDTSC produces bed sheets in a different size but at the time of the study, the section
produces only 160x250 and 156x210 type. The first order 156x210 was from GINAD
and the second-order 160x250 was from Amaga private union. The orders were coming
irregularly in batch from wholesalers this is the cause for stoke out and over-production
problems in manufacturing faculties. This kind of situation was a challenge for a lean
production system. To prevent such kind of irregularity the company must use the
supermarket. The supermarket system eliminates overproduction and allows us to
deliver goods at the time of need. The garment section produces a bedsheet in a bundle
containing 70 pair and unit one bundle was enough to make a kanban order. The demand
from the supermarket was transmitted to the production site with the help of electronic
data interchange daily.
Figure 5.9: Direct Shipment of finished goods to customers.
Sales Rep Customer
Supermark
et 8 hrs
Sales
Order
BDTSC
Control Unit
Garment
Section
Shipping
Fax
Amaga
Purchase
Order
74,000 Pair
160 x250
Unit =70 pair
2 Shift
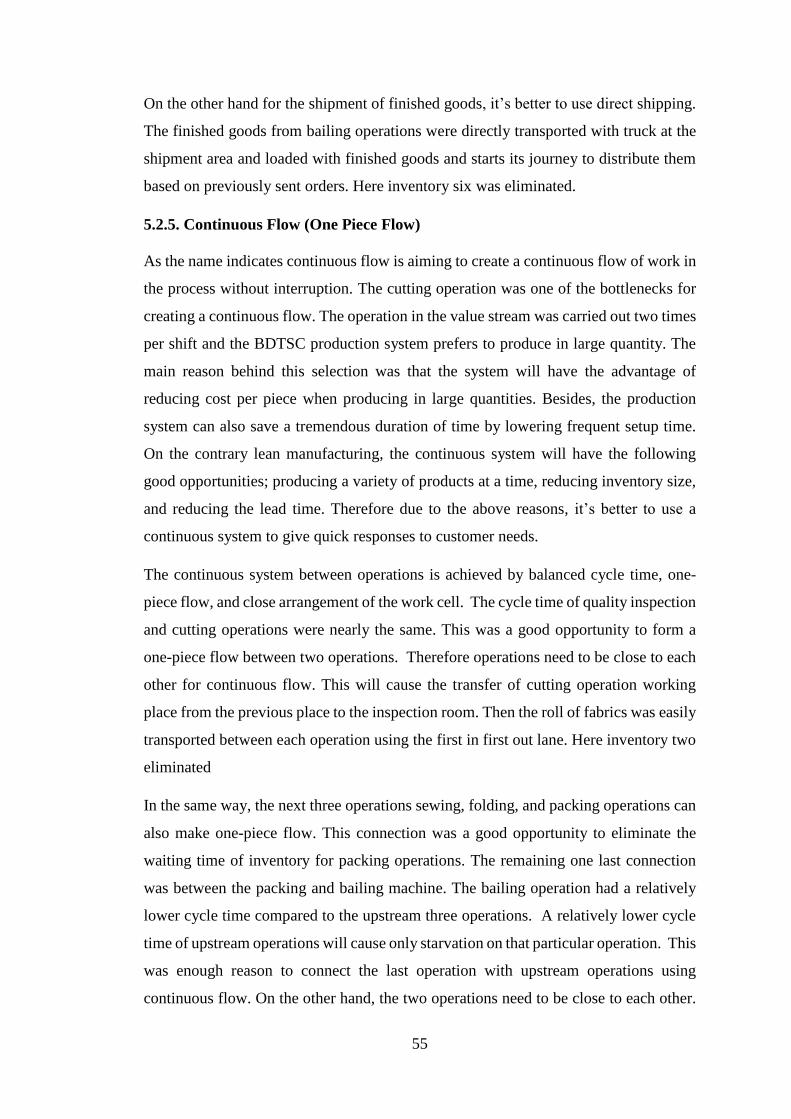
55
On the other hand for the shipment of finished goods, it’s better to use direct shipping.
The finished goods from bailing operations were directly transported with truck at the
shipment area and loaded with finished goods and starts its journey to distribute them
based on previously sent orders. Here inventory six was eliminated.
5.2.5. Continuous Flow (One Piece Flow)
As the name indicates continuous flow is aiming to create a continuous flow of work in
the process without interruption. The cutting operation was one of the bottlenecks for
creating a continuous flow. The operation in the value stream was carried out two times
per shift and the BDTSC production system prefers to produce in large quantity. The
main reason behind this selection was that the system will have the advantage of
reducing cost per piece when producing in large quantities. Besides, the production
system can also save a tremendous duration of time by lowering frequent setup time.
On the contrary lean manufacturing, the continuous system will have the following
good opportunities; producing a variety of products at a time, reducing inventory size,
and reducing the lead time. Therefore due to the above reasons, it’s better to use a
continuous system to give quick responses to customer needs.
The continuous system between operations is achieved by balanced cycle time, one-
piece flow, and close arrangement of the work cell. The cycle time of quality inspection
and cutting operations were nearly the same. This was a good opportunity to form a
one-piece flow between two operations. Therefore operations need to be close to each
other for continuous flow. This will cause the transfer of cutting operation working
place from the previous place to the inspection room. Then the roll of fabrics was easily
transported between each operation using the first in first out lane. Here inventory two
eliminated
In the same way, the next three operations sewing, folding, and packing operations can
also make one-piece flow. This connection was a good opportunity to eliminate the
waiting time of inventory for packing operations. The remaining one last connection
was between the packing and bailing machine. The bailing operation had a relatively
lower cycle time compared to the upstream three operations. A relatively lower cycle
time of upstream operations will cause only starvation on that particular operation. This
was enough reason to connect the last operation with upstream operations using
continuous flow. On the other hand, the two operations need to be close to each other.
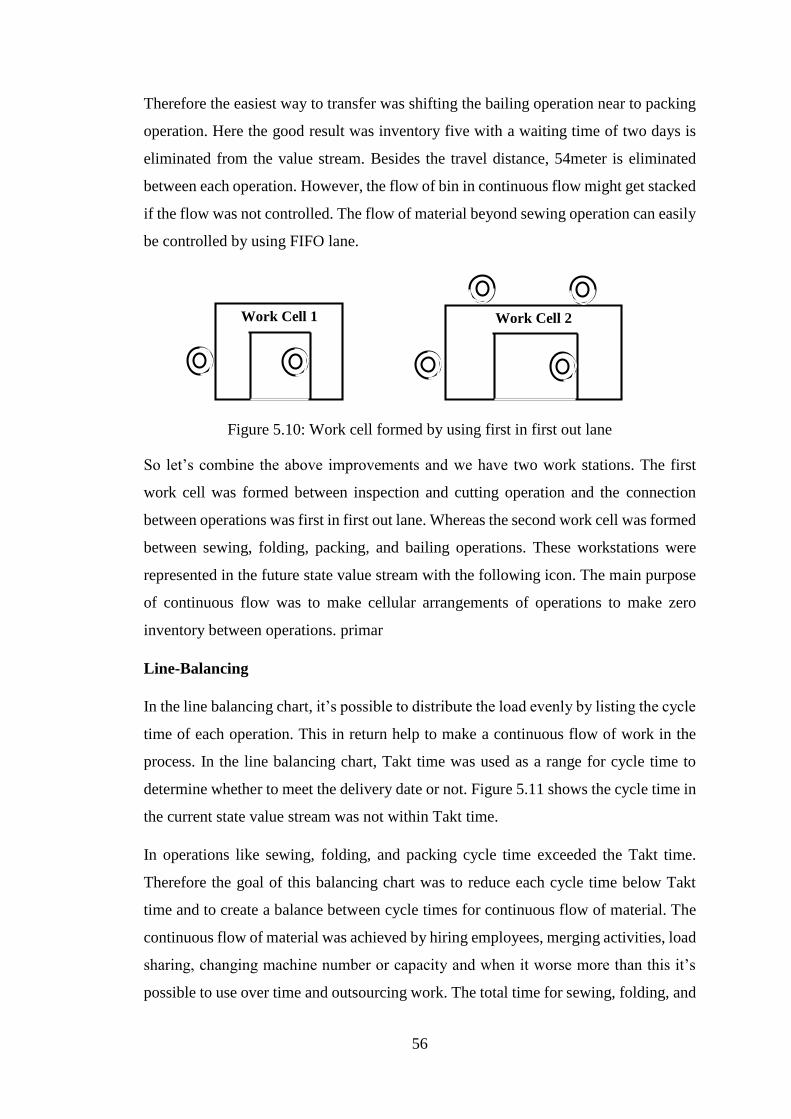
56
Therefore the easiest way to transfer was shifting the bailing operation near to packing
operation. Here the good result was inventory five with a waiting time of two days is
eliminated from the value stream. Besides the travel distance, 54meter is eliminated
between each operation. However, the flow of bin in continuous flow might get stacked
if the flow was not controlled. The flow of material beyond sewing operation can easily
be controlled by using FIFO lane.
Figure 5.10: Work cell formed by using first in first out lane
So let’s combine the above improvements and we have two work stations. The first
work cell was formed between inspection and cutting operation and the connection
between operations was first in first out lane. Whereas the second work cell was formed
between sewing, folding, packing, and bailing operations. These workstations were
represented in the future state value stream with the following icon. The main purpose
of continuous flow was to make cellular arrangements of operations to make zero
inventory between operations. primar
Line-Balancing
In the line balancing chart, it’s possible to distribute the load evenly by listing the cycle
time of each operation. This in return help to make a continuous flow of work in the
process. In the line balancing chart, Takt time was used as a range for cycle time to
determine whether to meet the delivery date or not. Figure 5.11 shows the cycle time in
the current state value stream was not within Takt time.
In operations like sewing, folding, and packing cycle time exceeded the Takt time.
Therefore the goal of this balancing chart was to reduce each cycle time below Takt
time and to create a balance between cycle times for continuous flow of material. The
continuous flow of material was achieved by hiring employees, merging activities, load
sharing, changing machine number or capacity and when it worse more than this it’s
possible to use over time and outsourcing work. The total time for sewing, folding, and
Work Cell 1 Work Cell 2
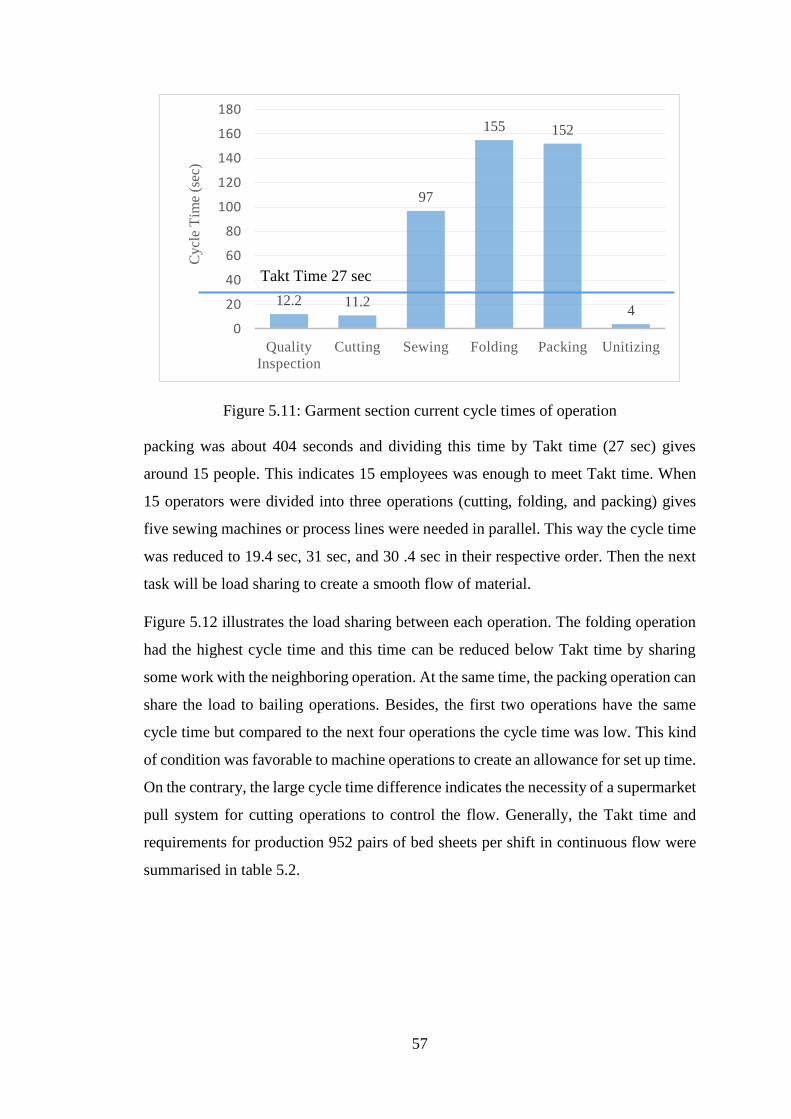
57
Figure 5.11: Garment section current cycle times of operation
packing was about 404 seconds and dividing this time by Takt time (27 sec) gives
around 15 people. This indicates 15 employees was enough to meet Takt time. When
15 operators were divided into three operations (cutting, folding, and packing) gives
five sewing machines or process lines were needed in parallel. This way the cycle time
was reduced to 19.4 sec, 31 sec, and 30 .4 sec in their respective order. Then the next
task will be load sharing to create a smooth flow of material.
Figure 5.12 illustrates the load sharing between each operation. The folding operation
had the highest cycle time and this time can be reduced below Takt time by sharing
some work with the neighboring operation. At the same time, the packing operation can
share the load to bailing operations. Besides, the first two operations have the same
cycle time but compared to the next four operations the cycle time was low. This kind
of condition was favorable to machine operations to create an allowance for set up time.
On the contrary, the large cycle time difference indicates the necessity of a supermarket
pull system for cutting operations to control the flow. Generally, the Takt time and
requirements for production 952 pairs of bed sheets per shift in continuous flow were
summarised in table 5.2.
12.2 11.2
97
155 152
4
0
20
40
60
80
100
120
140
160
180
Quality
Inspection
Cutting Sewing Folding Packing Unitizing
Cycl
e T
ime
(sec
)
Takt Time 27 sec
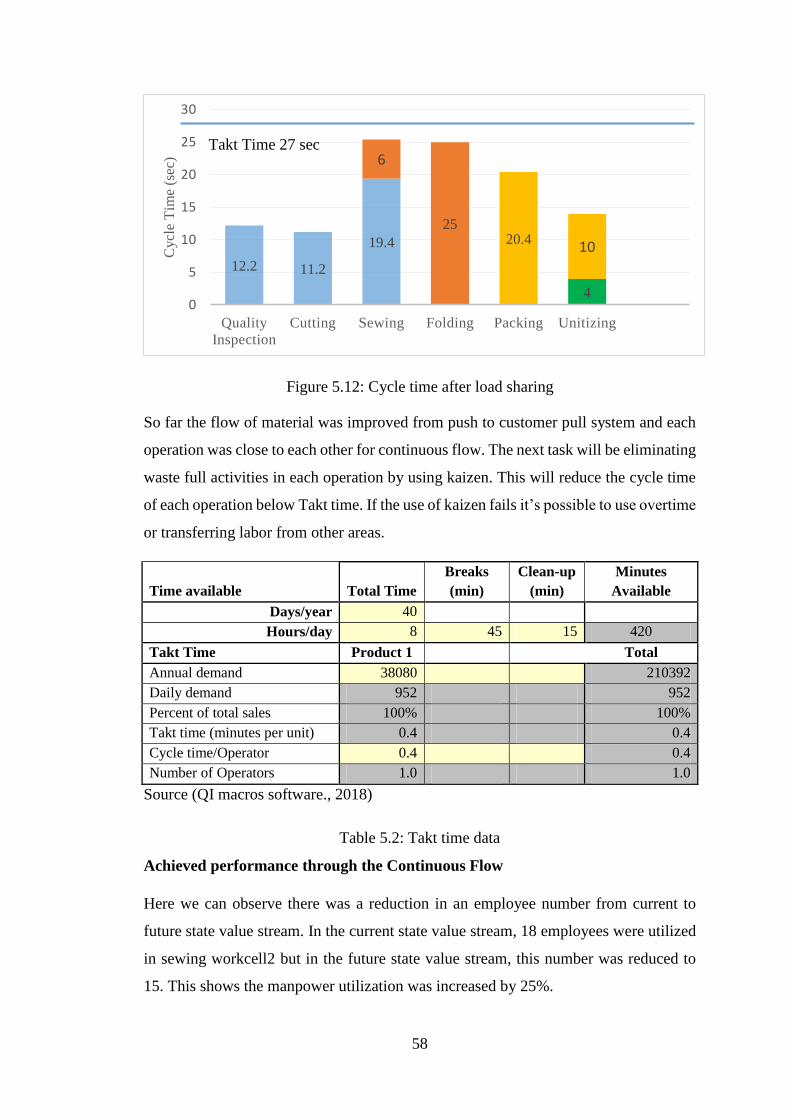
58
Figure 5.12: Cycle time after load sharing
So far the flow of material was improved from push to customer pull system and each
operation was close to each other for continuous flow. The next task will be eliminating
waste full activities in each operation by using kaizen. This will reduce the cycle time
of each operation below Takt time. If the use of kaizen fails it’s possible to use overtime
or transferring labor from other areas.
Time available Total Time
Breaks
(min)
Clean-up
(min)
Minutes
Available
Days/year 40
Hours/day 8 45 15 420
Takt Time Product 1 Total
Annual demand 38080 210392
Daily demand 952 952
Percent of total sales 100% 100%
Takt time (minutes per unit) 0.4 0.4
Cycle time/Operator 0.4 0.4
Number of Operators 1.0 1.0
Source (QI macros software., 2018)
Table 5.2: Takt time data
Achieved performance through the Continuous Flow
Here we can observe there was a reduction in an employee number from current to
future state value stream. In the current state value stream, 18 employees were utilized
in sewing workcell2 but in the future state value stream, this number was reduced to
15. This shows the manpower utilization was increased by 25%.
12.2 11.2
19.4
2520.4
4
6
10
0
5
10
15
20
25
30
Quality
Inspection
Cutting Sewing Folding Packing Unitizing
Cycl
e T
ime
(sec
)
Takt Time 27 sec

59
𝑀𝑎𝑛 𝑝𝑜𝑤𝑒𝑟 𝑟𝑒𝑑𝑢𝑐𝑡𝑖𝑜𝑛 =𝑛𝑜 𝑜𝑓 𝑤𝑜𝑟𝑘𝑒𝑟 𝑖𝑛 𝐹𝑆 − 𝑛𝑜 𝑜𝑓 𝑤𝑜𝑟𝑘𝑒𝑟 𝑖𝑛 𝐶𝑆
𝑛𝑜 𝑜𝑓 𝑤𝑜𝑟𝑘𝑒𝑟 𝑖𝑛 × 100
=29 − 26
29× 100
𝑇𝑜𝑡𝑎𝑙 𝑚𝑎𝑛 𝑝𝑜𝑤𝑒𝑟 𝑟𝑒𝑑𝑢𝑐𝑡𝑖𝑜𝑛 = 10.34%
𝑃𝑟𝑜𝑑𝑢𝑐𝑡𝑖𝑜𝑛 𝑅𝑎𝑡𝑒 =1 𝑝𝑎𝑖𝑟
27 𝑠𝑒𝑐⁄ = 2.22 𝑝𝑎𝑖𝑟 𝑚𝑖𝑛⁄ Since there are 5
manufacturing lines.
𝑃𝑟𝑜𝑑𝑢𝑐𝑡𝑖𝑜𝑛 𝑟𝑎𝑡𝑒 𝑝𝑒𝑟 𝑙𝑖𝑛𝑒 =2.22 𝑝𝑎𝑖𝑟/𝑚𝑖𝑛
5 𝑙𝑖𝑛𝑒⁄ = 0.44𝑝𝑎𝑖𝑟/𝑚𝑖𝑛/𝑙𝑖𝑛𝑒
𝑃𝑟𝑜𝑑𝑢𝑐𝑡𝑖𝑜𝑛 𝑟𝑎𝑡𝑒 8 𝑚𝑎𝑛𝑓 𝑙𝑖𝑛𝑒 = 0.44 𝑝𝑎𝑖𝑟/ min/ line × 6 𝑙𝑖𝑛𝑒 = 2.64 𝑝𝑎𝑖𝑟/𝑚𝑖𝑛
𝑃𝑟𝑜𝑑𝑢𝑐𝑡𝑖𝑜𝑛 𝑜/𝑝 𝑝𝑒𝑟 𝑠ℎ𝑖𝑓𝑡 = 2.64𝑝𝑎𝑖𝑟
𝑚𝑖𝑛× 420 𝑚𝑖𝑛 = 1108 𝑝𝑎𝑖𝑟
In the current state value stream with 5 manufacturing lines, the production rate was
2.22 pairs per minute. On the contrary, in the future state value stream 26 operator’s
forms, 6 manufacturing line and the production rate is 2.64 pair per minute. When we
multiply the above outputs with a daily available time of 420 minutes gives 933 pair
and 1108 pair respectively in two states. The production output was increased by 60 %.
𝑃𝑟𝑜𝑑𝑢𝑐𝑡𝑖𝑜𝑛 𝑜/𝑝 =𝑂/𝑝 𝑖𝑛 𝑓𝑢𝑡𝑢𝑟𝑒 𝑠𝑡𝑎𝑡𝑒 − 𝑂/𝑝 𝑐𝑢𝑟𝑟𝑒𝑛𝑡 𝑠𝑡𝑎𝑡𝑒
𝑂/𝑝 𝑐𝑢𝑟𝑟𝑒𝑛𝑡 𝑠𝑡𝑎𝑡𝑒 × 100
𝑃𝑟𝑜𝑑𝑢𝑐𝑡𝑖𝑜𝑛 𝑜/𝑝 =1108 − 952
952× 100
𝑃𝑟𝑜𝑑𝑢𝑐𝑡𝑖𝑜𝑛 𝑜𝑢𝑡𝑝𝑢𝑡 = 16.4%
Likewise, an increase in output will have its effect on reducing the time. Based on future
state value stream if 1108 pair was produced in one shift then the current state
production output of 952 pair need only 360.9 minutes. Therefore the time utilization
was increased by 36.2 %. All the improvements were summarized in figure 5.13.
𝑇𝑖𝑚𝑒 𝑈𝑡𝑖𝑙𝑖𝑧𝑎𝑡𝑖𝑜𝑛
=𝑇𝑖𝑚𝑒 𝑢𝑠𝑒𝑑 𝑖𝑛 𝑓𝑢𝑡𝑢𝑟𝑒 𝑠𝑡𝑎𝑡𝑒 − 𝑇𝑖𝑚𝑒 𝑢𝑠𝑒𝑑 𝑖𝑛 𝑐𝑢𝑟𝑟𝑒𝑛𝑡 𝑠𝑡𝑎𝑡𝑒
𝑇𝑖𝑚𝑒 𝑢𝑠𝑒𝑑 𝑐𝑢𝑟𝑟𝑒𝑛𝑡 𝑠𝑡𝑎𝑡𝑒 × 100
𝑇𝑖𝑚𝑒 𝑈𝑡𝑖𝑙𝑖𝑧𝑎𝑡𝑖𝑜𝑛 =360 − 420
420× 100
𝑇𝑖𝑚𝑒 𝑈𝑡𝑖𝑙𝑖𝑧𝑎𝑡𝑖𝑜𝑛 = 14.07%
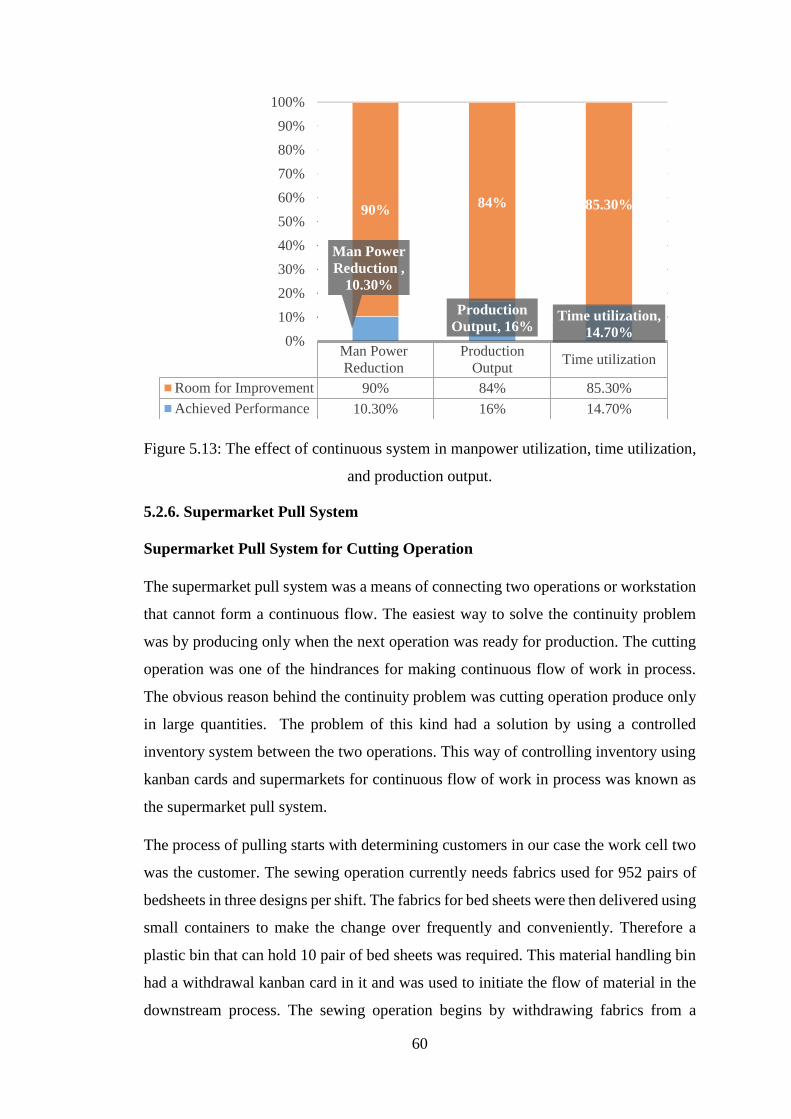
60
Figure 5.13: The effect of continuous system in manpower utilization, time utilization,
and production output.
5.2.6. Supermarket Pull System
Supermarket Pull System for Cutting Operation
The supermarket pull system was a means of connecting two operations or workstation
that cannot form a continuous flow. The easiest way to solve the continuity problem
was by producing only when the next operation was ready for production. The cutting
operation was one of the hindrances for making continuous flow of work in process.
The obvious reason behind the continuity problem was cutting operation produce only
in large quantities. The problem of this kind had a solution by using a controlled
inventory system between the two operations. This way of controlling inventory using
kanban cards and supermarkets for continuous flow of work in process was known as
the supermarket pull system.
The process of pulling starts with determining customers in our case the work cell two
was the customer. The sewing operation currently needs fabrics used for 952 pairs of
bedsheets in three designs per shift. The fabrics for bed sheets were then delivered using
small containers to make the change over frequently and conveniently. Therefore a
plastic bin that can hold 10 pair of bed sheets was required. This material handling bin
had a withdrawal kanban card in it and was used to initiate the flow of material in the
downstream process. The sewing operation begins by withdrawing fabrics from a
Man Power
Reduction
Production
OutputTime utilization
Room for Improvement 90% 84% 85.30%
Achieved Performance 10.30% 16% 14.70%
Man Power
Reduction ,
10.30%
Production
Output, 16%Time utilization,
14.70%
90%84% 85.30%
0%
10%
20%
30%
40%
50%
60%
70%
80%
90%
100%
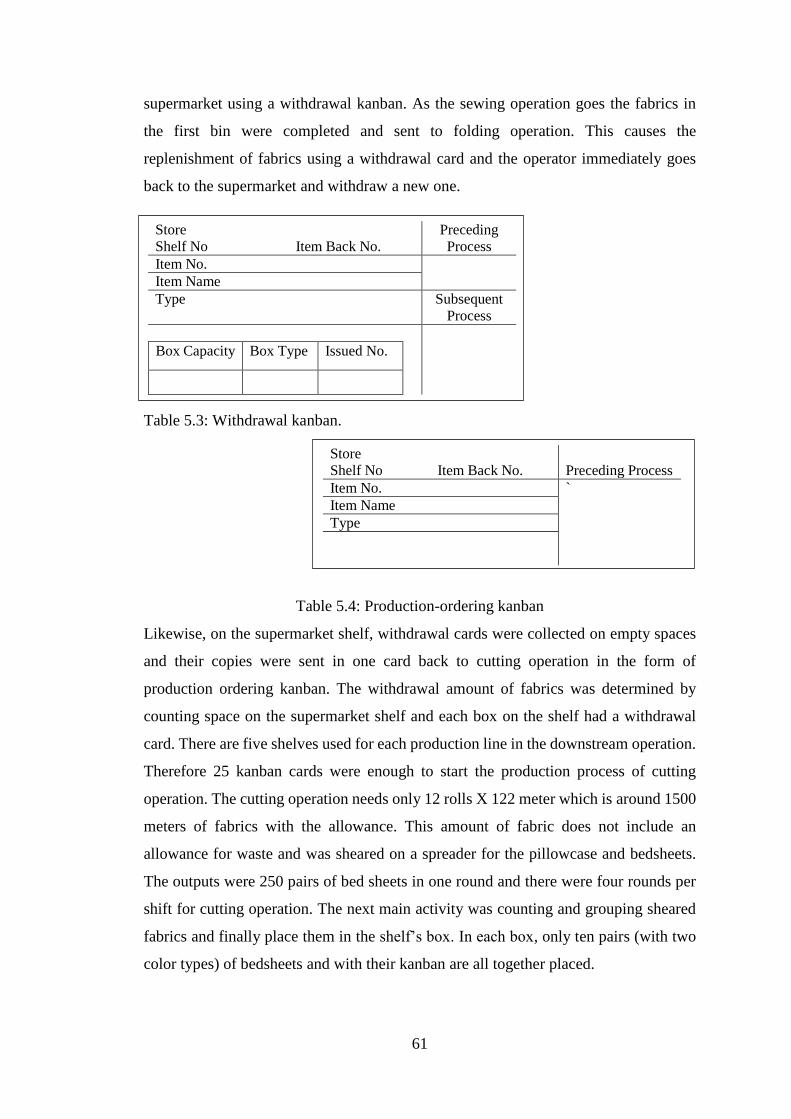
61
supermarket using a withdrawal kanban. As the sewing operation goes the fabrics in
the first bin were completed and sent to folding operation. This causes the
replenishment of fabrics using a withdrawal card and the operator immediately goes
back to the supermarket and withdraw a new one.
Table 5.3: Withdrawal kanban.
Table 5.4: Production-ordering kanban
Likewise, on the supermarket shelf, withdrawal cards were collected on empty spaces
and their copies were sent in one card back to cutting operation in the form of
production ordering kanban. The withdrawal amount of fabrics was determined by
counting space on the supermarket shelf and each box on the shelf had a withdrawal
card. There are five shelves used for each production line in the downstream operation.
Therefore 25 kanban cards were enough to start the production process of cutting
operation. The cutting operation needs only 12 rolls X 122 meter which is around 1500
meters of fabrics with the allowance. This amount of fabric does not include an
allowance for waste and was sheared on a spreader for the pillowcase and bedsheets.
The outputs were 250 pairs of bed sheets in one round and there were four rounds per
shift for cutting operation. The next main activity was counting and grouping sheared
fabrics and finally place them in the shelf’s box. In each box, only ten pairs (with two
color types) of bedsheets and with their kanban are all together placed.
Store
Shelf No Item Back No.
Preceding
Process
Item No.
Item Name
Type Subsequent
Process
Box Capacity Box Type Issued No.
Store
Shelf No Item Back No.
Preceding Process
Item No. `
Item Name
Type
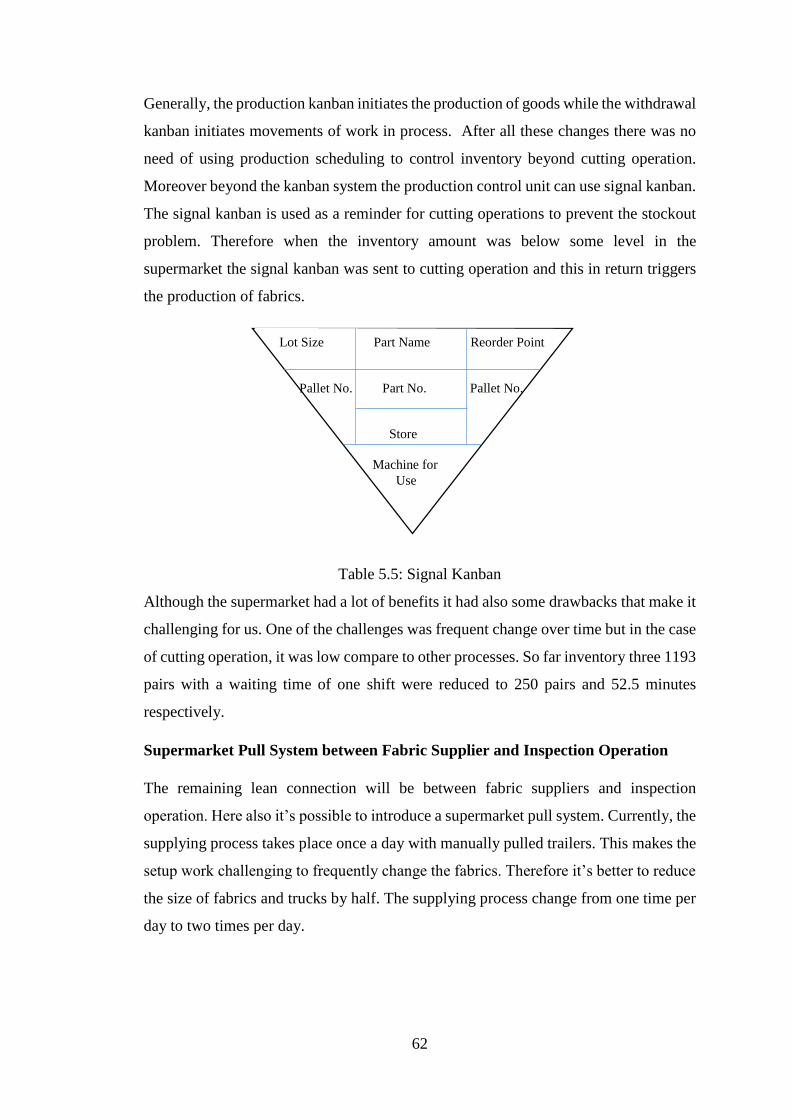
62
Generally, the production kanban initiates the production of goods while the withdrawal
kanban initiates movements of work in process. After all these changes there was no
need of using production scheduling to control inventory beyond cutting operation.
Moreover beyond the kanban system the production control unit can use signal kanban.
The signal kanban is used as a reminder for cutting operations to prevent the stockout
problem. Therefore when the inventory amount was below some level in the
supermarket the signal kanban was sent to cutting operation and this in return triggers
the production of fabrics.
Table 5.5: Signal Kanban
Although the supermarket had a lot of benefits it had also some drawbacks that make it
challenging for us. One of the challenges was frequent change over time but in the case
of cutting operation, it was low compare to other processes. So far inventory three 1193
pairs with a waiting time of one shift were reduced to 250 pairs and 52.5 minutes
respectively.
Supermarket Pull System between Fabric Supplier and Inspection Operation
The remaining lean connection will be between fabric suppliers and inspection
operation. Here also it’s possible to introduce a supermarket pull system. Currently, the
supplying process takes place once a day with manually pulled trailers. This makes the
setup work challenging to frequently change the fabrics. Therefore it’s better to reduce
the size of fabrics and trucks by half. The supplying process change from one time per
day to two times per day.
Lot Size Part Name Reorder Point
Pallet No. Part No. Pallet No.
Store
Machine for
Use
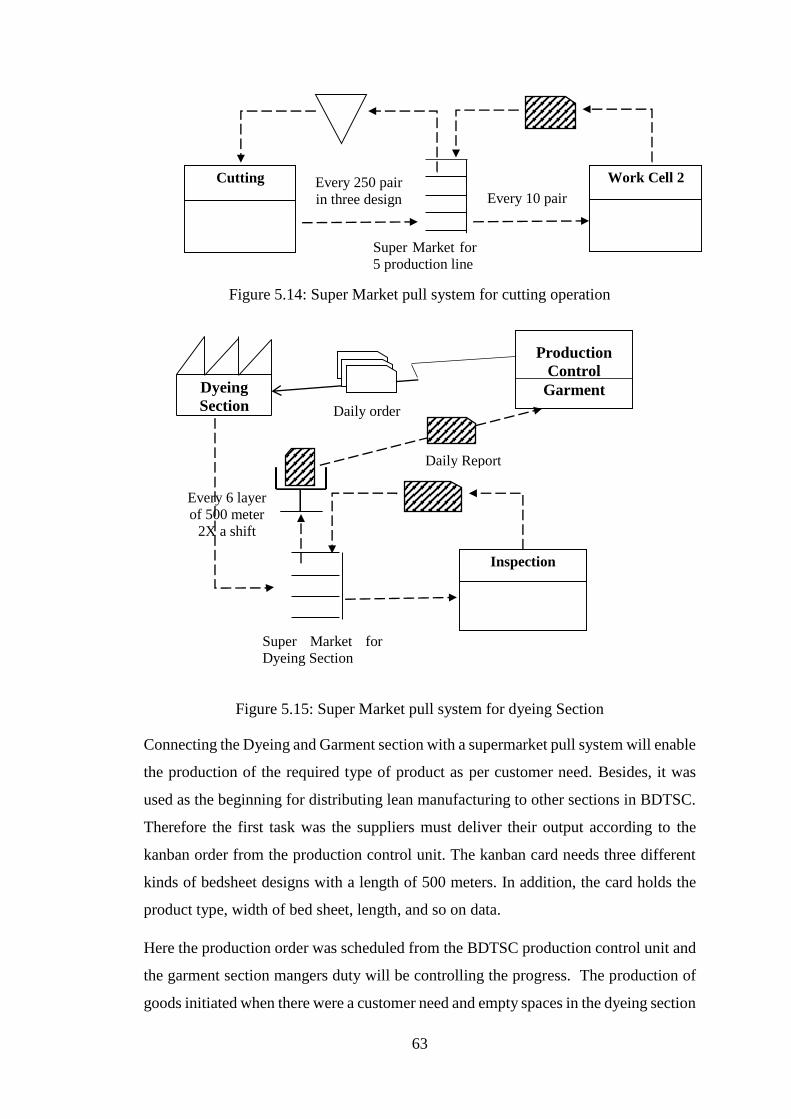
63
Figure 5.14: Super Market pull system for cutting operation
Figure 5.15: Super Market pull system for dyeing Section
Connecting the Dyeing and Garment section with a supermarket pull system will enable
the production of the required type of product as per customer need. Besides, it was
used as the beginning for distributing lean manufacturing to other sections in BDTSC.
Therefore the first task was the suppliers must deliver their output according to the
kanban order from the production control unit. The kanban card needs three different
kinds of bedsheet designs with a length of 500 meters. In addition, the card holds the
product type, width of bed sheet, length, and so on data.
Here the production order was scheduled from the BDTSC production control unit and
the garment section mangers duty will be controlling the progress. The production of
goods initiated when there were a customer need and empty spaces in the dyeing section
Every 250 pair
in three design Every 10 pair
Cutting Work Cell 2
Super Market for
5 production line
Daily order
Super Market for
Dyeing Section
Every 6 layer
of 500 meter
2X a shift
Inspection
Dyeing
Section
Production
Control
Garment
Daily Report
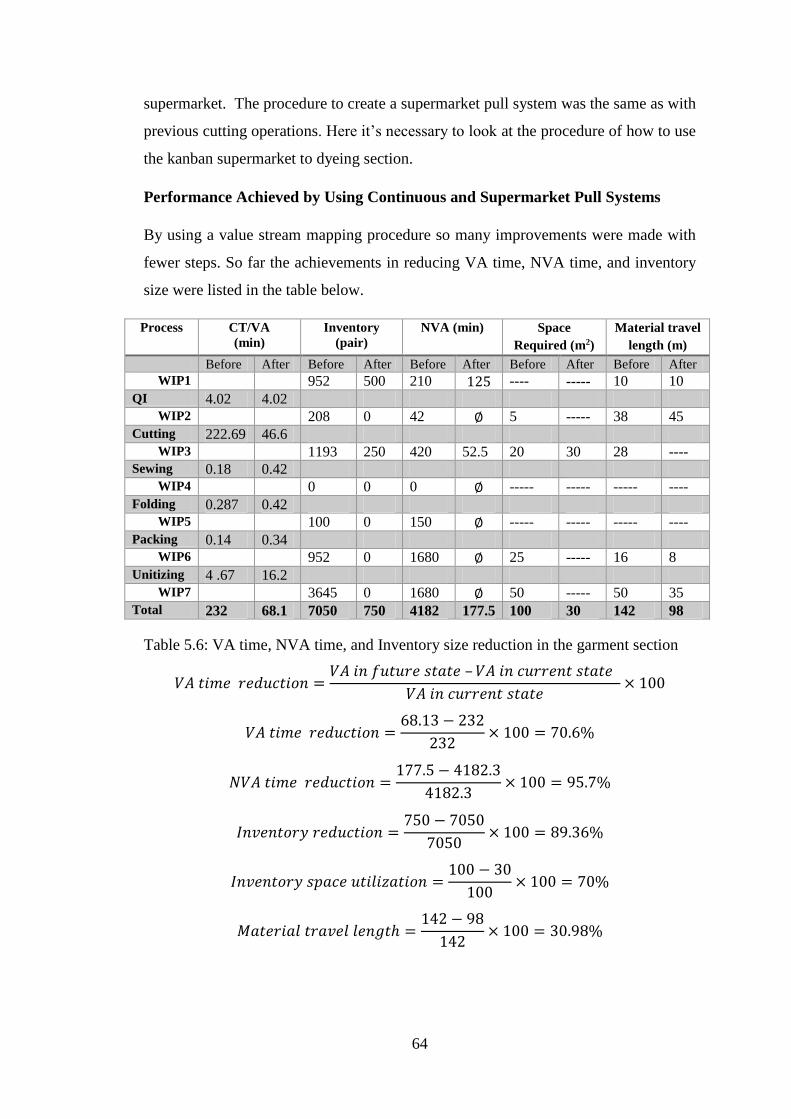
64
supermarket. The procedure to create a supermarket pull system was the same as with
previous cutting operations. Here it’s necessary to look at the procedure of how to use
the kanban supermarket to dyeing section.
Performance Achieved by Using Continuous and Supermarket Pull Systems
By using a value stream mapping procedure so many improvements were made with
fewer steps. So far the achievements in reducing VA time, NVA time, and inventory
size were listed in the table below.
Process CT/VA
(min)
Inventory
(pair)
NVA (min) Space
Required (m2)
Material travel
length (m)
Before After Before After Before After Before After Before After
WIP1 952 500 210 125 ---- ----- 10 10
QI 4.02 4.02 WIP2 208 0 42 ∅ 5 ----- 38 45
Cutting 222.69 46.6 WIP3 1193 250 420 52.5 20 30 28 ----
Sewing 0.18 0.42 WIP4 0 0 0 ∅ ----- ----- ----- ----
Folding 0.287 0.42 WIP5 100 0 150 ∅ ----- ----- ----- ----
Packing 0.14 0.34 WIP6 952 0 1680 ∅ 25 ----- 16 8
Unitizing 4 .67 16.2 WIP7 3645 0 1680 ∅ 50 ----- 50 35
Total 232 68.1 7050 750 4182 177.5 100 30 142 98
Table 5.6: VA time, NVA time, and Inventory size reduction in the garment section
𝑉𝐴 𝑡𝑖𝑚𝑒 𝑟𝑒𝑑𝑢𝑐𝑡𝑖𝑜𝑛 =𝑉𝐴 𝑖𝑛 𝑓𝑢𝑡𝑢𝑟𝑒 𝑠𝑡𝑎𝑡𝑒 – 𝑉𝐴 𝑖𝑛 𝑐𝑢𝑟𝑟𝑒𝑛𝑡 𝑠𝑡𝑎𝑡𝑒
𝑉𝐴 𝑖𝑛 𝑐𝑢𝑟𝑟𝑒𝑛𝑡 𝑠𝑡𝑎𝑡𝑒× 100
𝑉𝐴 𝑡𝑖𝑚𝑒 𝑟𝑒𝑑𝑢𝑐𝑡𝑖𝑜𝑛 =68.13 − 232
232× 100 = 70.6%
𝑁𝑉𝐴 𝑡𝑖𝑚𝑒 𝑟𝑒𝑑𝑢𝑐𝑡𝑖𝑜𝑛 =177.5 − 4182.3
4182.3× 100 = 95.7%
𝐼𝑛𝑣𝑒𝑛𝑡𝑜𝑟𝑦 𝑟𝑒𝑑𝑢𝑐𝑡𝑖𝑜𝑛 =750 − 7050
7050× 100 = 89.36%
𝐼𝑛𝑣𝑒𝑛𝑡𝑜𝑟𝑦 𝑠𝑝𝑎𝑐𝑒 𝑢𝑡𝑖𝑙𝑖𝑧𝑎𝑡𝑖𝑜𝑛 =100 − 30
100× 100 = 70%
𝑀𝑎𝑡𝑒𝑟𝑖𝑎𝑙 𝑡𝑟𝑎𝑣𝑒𝑙 𝑙𝑒𝑛𝑔𝑡ℎ =142 − 98
142× 100 = 30.98%
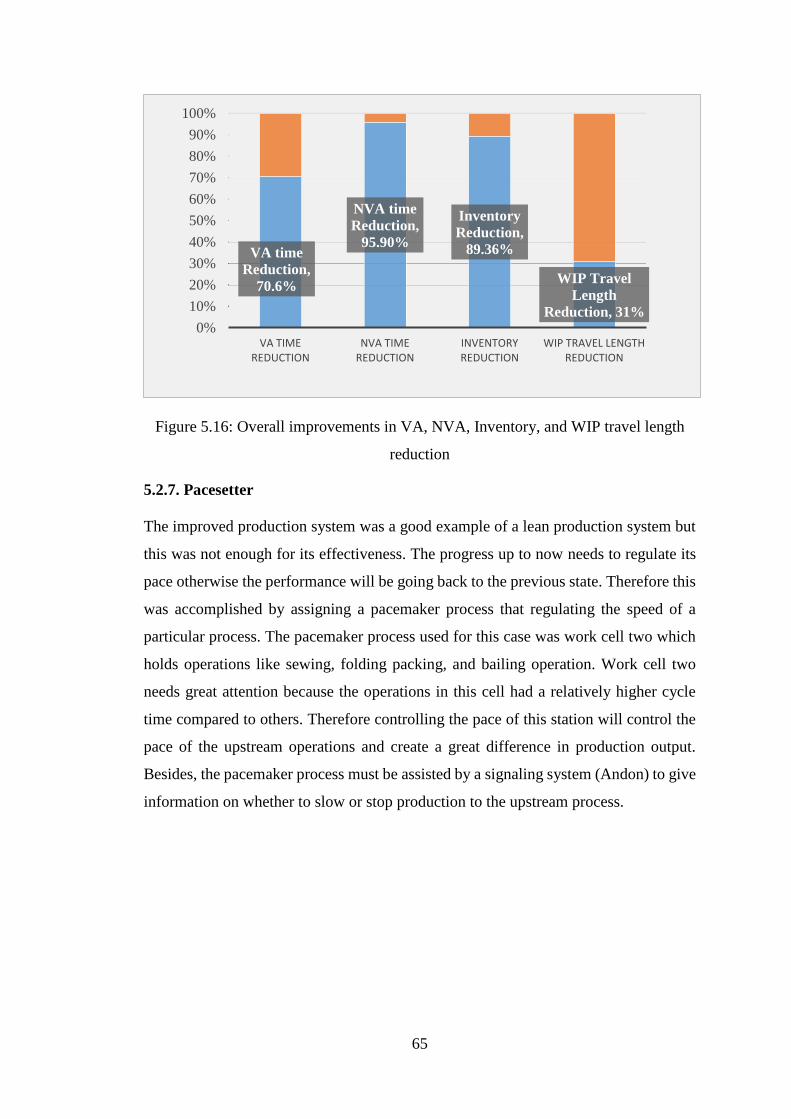
65
Figure 5.16: Overall improvements in VA, NVA, Inventory, and WIP travel length
reduction
5.2.7. Pacesetter
The improved production system was a good example of a lean production system but
this was not enough for its effectiveness. The progress up to now needs to regulate its
pace otherwise the performance will be going back to the previous state. Therefore this
was accomplished by assigning a pacemaker process that regulating the speed of a
particular process. The pacemaker process used for this case was work cell two which
holds operations like sewing, folding packing, and bailing operation. Work cell two
needs great attention because the operations in this cell had a relatively higher cycle
time compared to others. Therefore controlling the pace of this station will control the
pace of the upstream operations and create a great difference in production output.
Besides, the pacemaker process must be assisted by a signaling system (Andon) to give
information on whether to slow or stop production to the upstream process.
VA time
Reduction,
70.6%
NVA time
Reduction,
95.90%
Inventory
Reduction,
89.36%
WIP Travel
Length
Reduction, 31%0%
10%
20%
30%
40%
50%
60%
70%
80%
90%
100%
VA TIME REDUCTION
NVA TIME REDUCTION
INVENTORY REDUCTION
WIP TRAVEL LENGTH REDUCTION
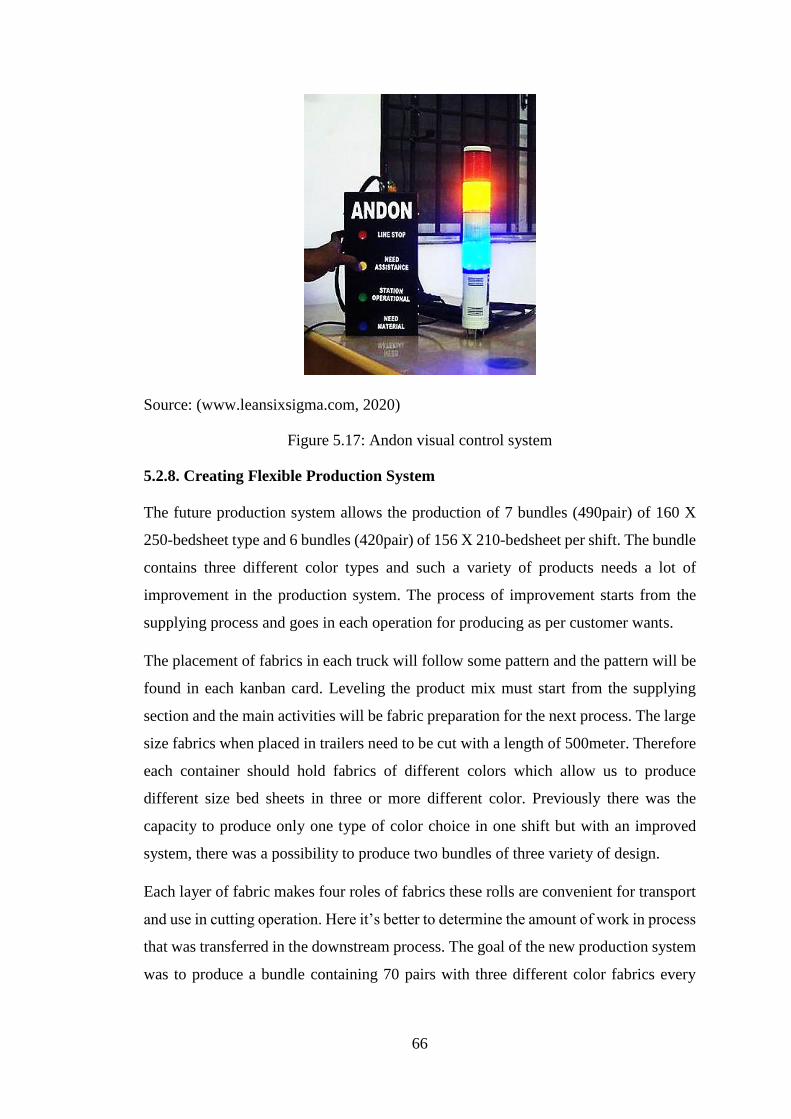
66
Source: (www.leansixsigma.com, 2020)
Figure 5.17: Andon visual control system
5.2.8. Creating Flexible Production System
The future production system allows the production of 7 bundles (490pair) of 160 X
250-bedsheet type and 6 bundles (420pair) of 156 X 210-bedsheet per shift. The bundle
contains three different color types and such a variety of products needs a lot of
improvement in the production system. The process of improvement starts from the
supplying process and goes in each operation for producing as per customer wants.
The placement of fabrics in each truck will follow some pattern and the pattern will be
found in each kanban card. Leveling the product mix must start from the supplying
section and the main activities will be fabric preparation for the next process. The large
size fabrics when placed in trailers need to be cut with a length of 500meter. Therefore
each container should hold fabrics of different colors which allow us to produce
different size bed sheets in three or more different color. Previously there was the
capacity to produce only one type of color choice in one shift but with an improved
system, there was a possibility to produce two bundles of three variety of design.
Each layer of fabric makes four roles of fabrics these rolls are convenient for transport
and use in cutting operation. Here it’s better to determine the amount of work in process
that was transferred in the downstream process. The goal of the new production system
was to produce a bundle containing 70 pairs with three different color fabrics every
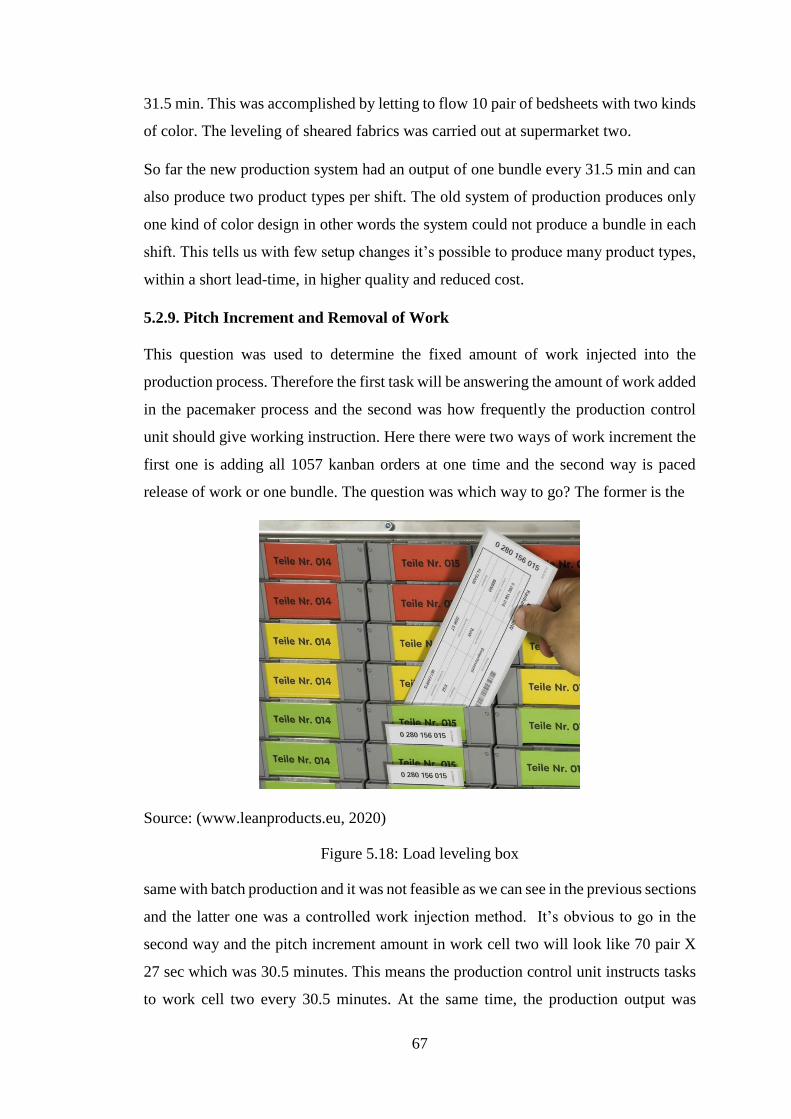
67
31.5 min. This was accomplished by letting to flow 10 pair of bedsheets with two kinds
of color. The leveling of sheared fabrics was carried out at supermarket two.
So far the new production system had an output of one bundle every 31.5 min and can
also produce two product types per shift. The old system of production produces only
one kind of color design in other words the system could not produce a bundle in each
shift. This tells us with few setup changes it’s possible to produce many product types,
within a short lead-time, in higher quality and reduced cost.
5.2.9. Pitch Increment and Removal of Work
This question was used to determine the fixed amount of work injected into the
production process. Therefore the first task will be answering the amount of work added
in the pacemaker process and the second was how frequently the production control
unit should give working instruction. Here there were two ways of work increment the
first one is adding all 1057 kanban orders at one time and the second way is paced
release of work or one bundle. The question was which way to go? The former is the
Source: (www.leanproducts.eu, 2020)
Figure 5.18: Load leveling box
same with batch production and it was not feasible as we can see in the previous sections
and the latter one was a controlled work injection method. It’s obvious to go in the
second way and the pitch increment amount in work cell two will look like 70 pair X
27 sec which was 30.5 minutes. This means the production control unit instructs tasks
to work cell two every 30.5 minutes. At the same time, the production output was
68
transferred to the shipment area. Therefore with this pitch increment, the production
capacity will be 13.33 bundles or 933pair per shift.
The process of paced release and take away of work was assisted by a load-leveling
box. In the load-leveling box, each box represents the paced release of work and in
every 30.5 minutes, there was a paced release of work to work cell two. If the unit
bundle was not completed within pitch time there was some problem at one of the
operations and need to be solved.
5.2.10. What Process Improvements will be necessary for BDTSC's?
The process improvement tools used for BDTSC garment sections were specified in the
previous sections. Some of the techniques used in the previous section were production
with Takt time, continuous system, supermarket pull system, kanban information
exchange system, flexible production system, cellular production system, and
pacesetting are major. Here one last main improvement technique is setup time
reduction. The major improvement elements were reducing the changeover time and
size of the batch. The setup time reduction was used to create a flexible manufacturing
system for changing customer demand. This in return allows producing every part every
day.
Let’s see the improvements made to create a flexible manufacturing system. At the
supplier's side, the truck size was reduced by half this will reduce the weight of the
trailer and was helpful for a convenient changeover. The truck must build from
lightweight material to make easier the transportation of goods. Operators in
downstream painting machines must use the equipment for automatic mark-up and
shearing of fabric. This will enable the downstream operation to produce the required
amount of products. Next to the shearing activity, the material handler must create a
product mix in each truck to produce a variety of products that can satisfy various
customer choices. This way materials were prepared for the garment section and
stocked in the supermarket.
Likewise, the same improvements were made at supermarket two which was the
preparation stage for creating a unit bundle. These changes were much more important
for producing each part each day. Here bin used for holding 10 items was required to
facilitate the flow and it must be lightweight and convenient for use. Here it’s better to
design bins by considering ergonomic factors.
69
5S
5S is a system used to create a favorable working condition in the production site by
removing unnecessary materials, arranging tools, and inventories in the production site.
Besides it improve the quality of the product by removing unnecessary dust. The
sources of wastes at the production site were first, long set-up time because of tools
arrangement, and space for an easy setup change. Second, inventory handling of
Defected materials (rags and cutting strip) was the cause for lower employee morale.
Third, a dirty working place was the cause of health-related problems for employees
also it reduces the quality of finished goods. 5S was a cleanup activity in the workplace
which represents Japanese words Seiri, Seiton, Seison, Seiketsu, and Shitsuke.
Seiri: was a way of separating necessary things from unnecessary ones. Some of the
activities required for separating necessary elements from unnecessary ones were the
following.
1. The establishment of a red label (usable) project; was the level of
undertaking a red label project (usable) which was at the workplace level daily
and the company level annually.
2. Determination of objects to be sealed; In this case fabrics in different places
must be separated from defective ones therefore defected fabrics were selected.
3. Determining leveling criteria; in the first level cutting strips, rags, and
defective fabrics that were not used for bedsheets were selected. In the second
round, noncritical defective fabrics that can be used for bedsheets were selected.
In the last round work in process with no defect was selected.
4. The preparation of labels; looked like in the figure below.
5. Evaluation of sealed items and recommended actions; In this step cutting
strips and defective fabrics were discarded or sold to customers as a rag.
Defected noncritical units were utilized for other rounds and were stored in red
label storage.
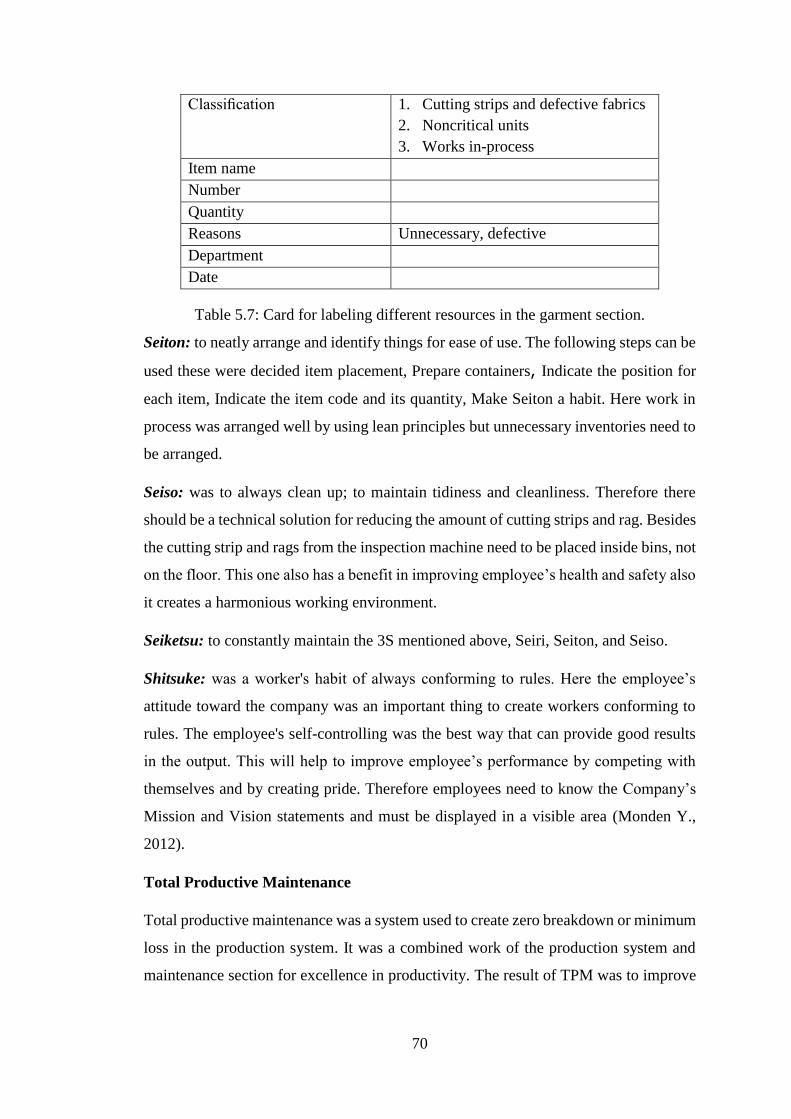
70
Classification 1. Cutting strips and defective fabrics
2. Noncritical units
3. Works in-process
Item name
Number
Quantity
Reasons Unnecessary, defective
Department
Date
Table 5.7: Card for labeling different resources in the garment section.
Seiton: to neatly arrange and identify things for ease of use. The following steps can be
used these were decided item placement, Prepare containers, Indicate the position for
each item, Indicate the item code and its quantity, Make Seiton a habit. Here work in
process was arranged well by using lean principles but unnecessary inventories need to
be arranged.
Seiso: was to always clean up; to maintain tidiness and cleanliness. Therefore there
should be a technical solution for reducing the amount of cutting strips and rag. Besides
the cutting strip and rags from the inspection machine need to be placed inside bins, not
on the floor. This one also has a benefit in improving employee’s health and safety also
it creates a harmonious working environment.
Seiketsu: to constantly maintain the 3S mentioned above, Seiri, Seiton, and Seiso.
Shitsuke: was a worker's habit of always conforming to rules. Here the employee’s
attitude toward the company was an important thing to create workers conforming to
rules. The employee's self-controlling was the best way that can provide good results
in the output. This will help to improve employee’s performance by competing with
themselves and by creating pride. Therefore employees need to know the Company’s
Mission and Vision statements and must be displayed in a visible area (Monden Y.,
2012).
Total Productive Maintenance
Total productive maintenance was a system used to create zero breakdown or minimum
loss in the production system. It was a combined work of the production system and
maintenance section for excellence in productivity. The result of TPM was to improve
71
uptime which increases the reliability and maintainability of equipment and the system
as a whole.
New Product Development
The invention is the act of realization of developing a solution to a problem. Innovation
is the economic use of the invention and this will lead to increased market share.
Product development was the same with innovation in which it was an effort to
introduce innovation to a market. A company like BDTSC can produce improved
products and compete for the market by looking at the demand.
Innovation and product portfolio management: here the strategic decision was either to
open a new business, introducing a new product, and entering into the market or exit
(i.e closing the business unit down). For BDTSC new product development was the
only option to stay in the market. Therefore the company can pursue an adaptive way
and in the future, it's possible to use the proactive move. The adaptive way was the easy
way to get market share by imitating the products available in the market. But to get a
high market share in the future it’s better to use a proactive move (Marco C., &
Francesca M., 2016).
BDTSC garment section can produce a variety of products with available company
output but if the input fabric type had lower variety it possible to buy and make different
product types. The company's lower competitiveness problem in a large market was a
rise from a lower quality product. Therefore BDTSC should produce products with
great care when it is required for export standard. On the other hand for a small market,
it’s possible to produce with a short time to manufacture and limited investment.
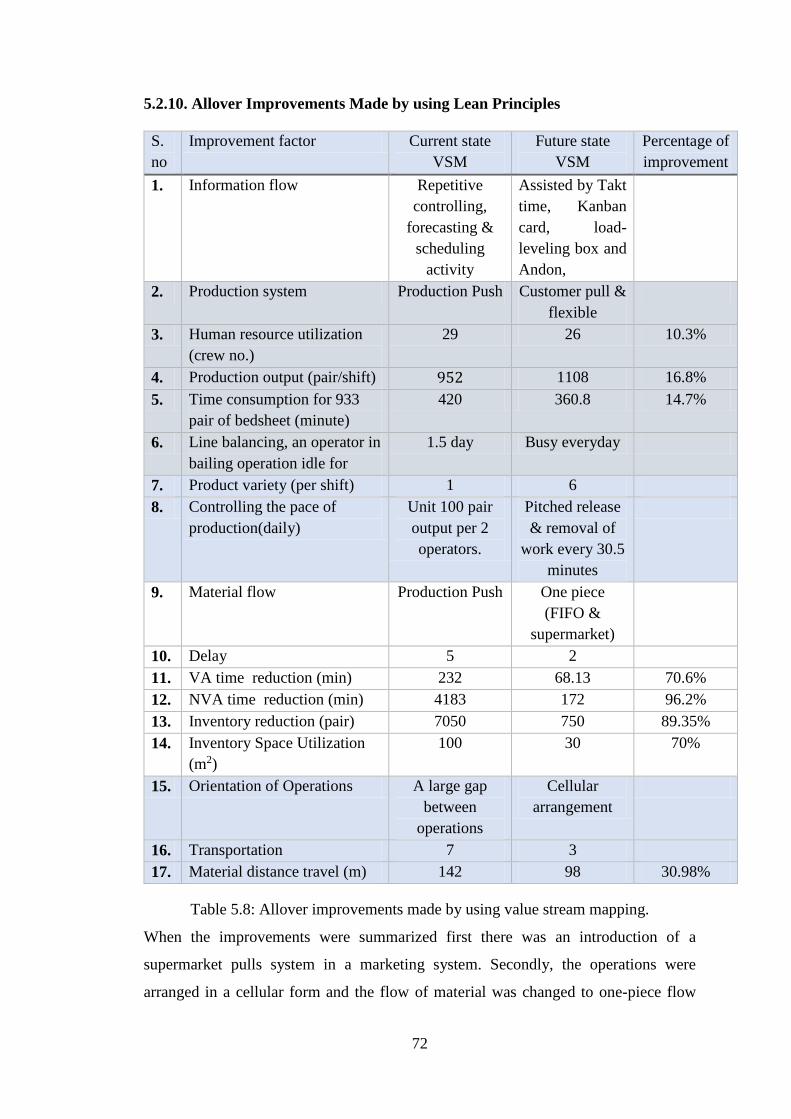
72
5.2.10. Allover Improvements Made by using Lean Principles
S.
no
Improvement factor Current state
VSM
Future state
VSM
Percentage of
improvement
1. Information flow Repetitive
controlling,
forecasting &
scheduling
activity
Assisted by Takt
time, Kanban
card, load-
leveling box and
Andon,
2. Production system Production Push Customer pull &
flexible
3. Human resource utilization
(crew no.)
29 26 10.3%
4. Production output (pair/shift) 952 1108 16.8%
5. Time consumption for 933
pair of bedsheet (minute)
420 360.8 14.7%
6. Line balancing, an operator in
bailing operation idle for
1.5 day Busy everyday
7. Product variety (per shift) 1 6
8. Controlling the pace of
production(daily)
Unit 100 pair
output per 2
operators.
Pitched release
& removal of
work every 30.5
minutes
9. Material flow Production Push One piece
(FIFO &
supermarket)
10. Delay 5 2
11. VA time reduction (min) 232 68.13 70.6%
12. NVA time reduction (min) 4183 172 96.2%
13. Inventory reduction (pair) 7050 750 89.35%
14. Inventory Space Utilization
(m2)
100 30 70%
15. Orientation of Operations A large gap
between
operations
Cellular
arrangement
16. Transportation 7 3
17. Material distance travel (m) 142 98 30.98%
Table 5.8: Allover improvements made by using value stream mapping.
When the improvements were summarized first there was an introduction of a
supermarket pulls system in a marketing system. Secondly, the operations were
arranged in a cellular form and the flow of material was changed to one-piece flow
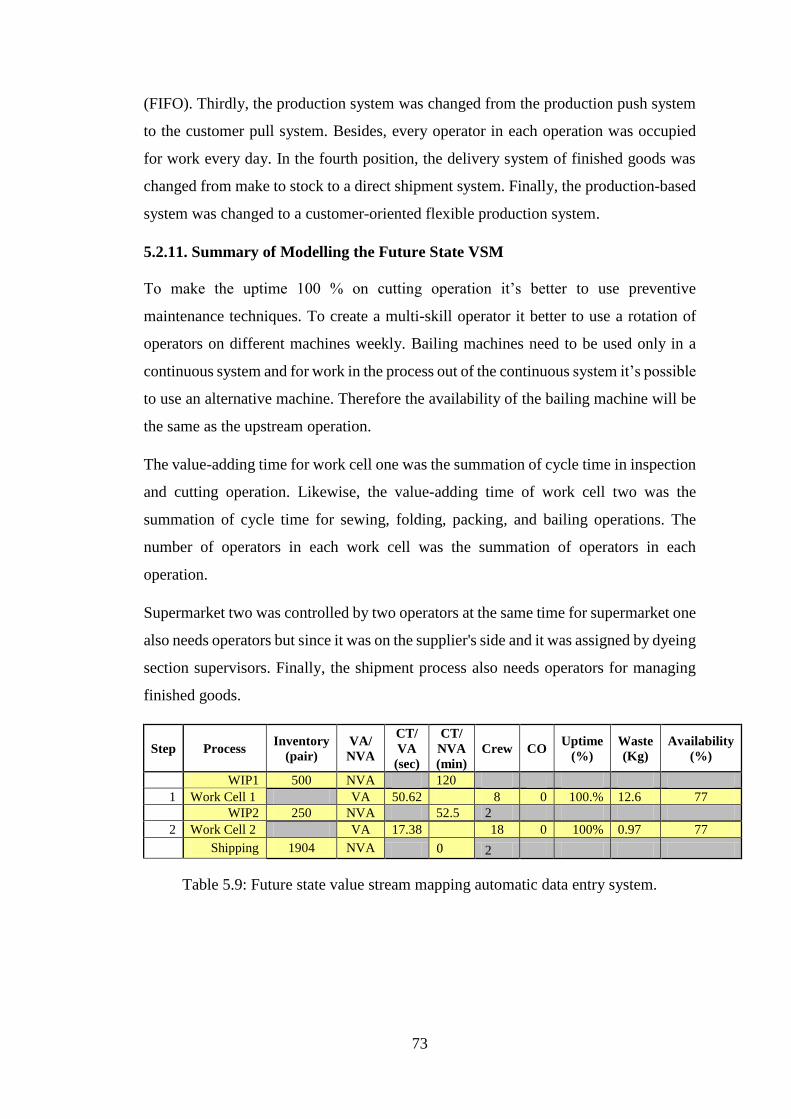
73
(FIFO). Thirdly, the production system was changed from the production push system
to the customer pull system. Besides, every operator in each operation was occupied
for work every day. In the fourth position, the delivery system of finished goods was
changed from make to stock to a direct shipment system. Finally, the production-based
system was changed to a customer-oriented flexible production system.
5.2.11. Summary of Modelling the Future State VSM
To make the uptime 100 % on cutting operation it’s better to use preventive
maintenance techniques. To create a multi-skill operator it better to use a rotation of
operators on different machines weekly. Bailing machines need to be used only in a
continuous system and for work in the process out of the continuous system it’s possible
to use an alternative machine. Therefore the availability of the bailing machine will be
the same as the upstream operation.
The value-adding time for work cell one was the summation of cycle time in inspection
and cutting operation. Likewise, the value-adding time of work cell two was the
summation of cycle time for sewing, folding, packing, and bailing operations. The
number of operators in each work cell was the summation of operators in each
operation.
Supermarket two was controlled by two operators at the same time for supermarket one
also needs operators but since it was on the supplier's side and it was assigned by dyeing
section supervisors. Finally, the shipment process also needs operators for managing
finished goods.
Step Process Inventory
(pair)
VA/
NVA
CT/
VA
(sec)
CT/
NVA
(min)
Crew CO Uptime
(%)
Waste
(Kg)
Availability
(%)
WIP1 500 NVA 120
1 Work Cell 1 VA 50.62 8 0 100.% 12.6 77
WIP2 250 NVA 52.5 2
2 Work Cell 2 VA 17.38 18 0 100% 0.97 77
Shipping 1904 NVA 0 2
Table 5.9: Future state value stream mapping automatic data entry system.
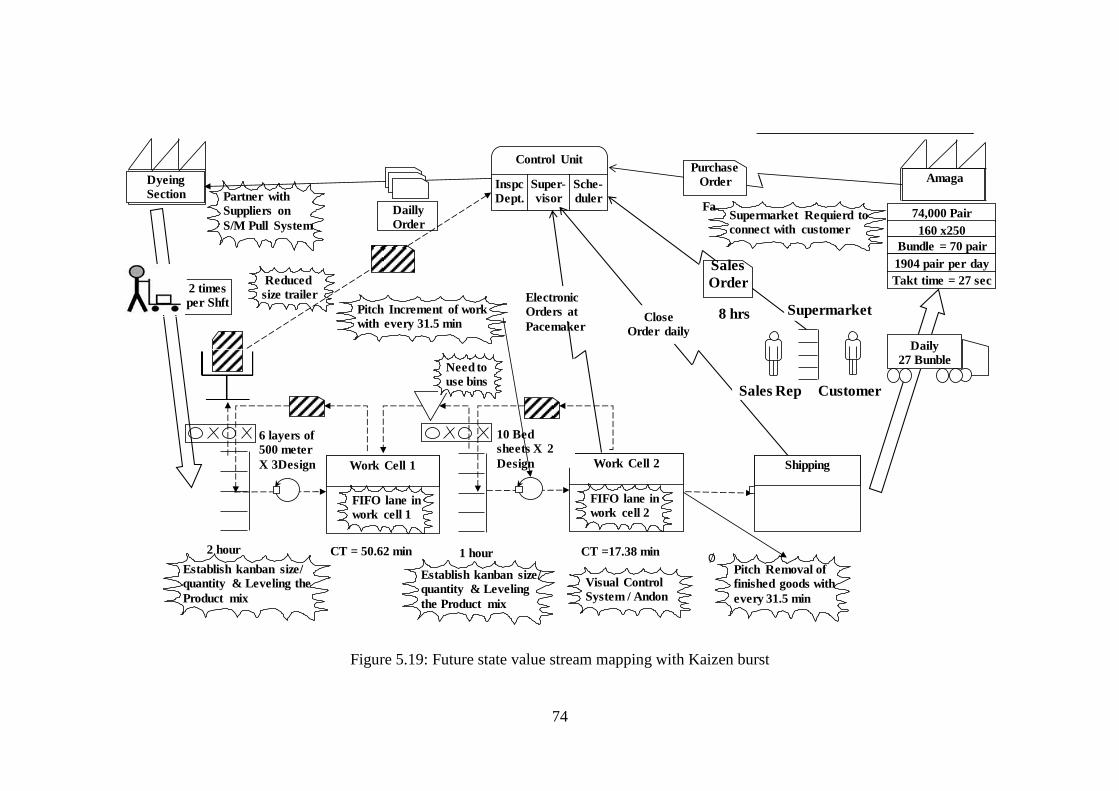
74
Figure 5.19: Future state value stream mapping with Kaizen burst
© 2017 KnowWare
Dyeing
Section
Daily
27 Bunble
1 hour2 hour∅
Establish kanban size/
quantity & Leveling the
Product mix
Partner with
Suppliers on
S/M Pull System
Work Cell 1
FIFO lane in
work cell 1
Work Cell 2
FIFO lane in
work cell 2
Control Unit
Inspc
Dept.
Sche-
duler
Super-
visorFa
74,000 Pair
160 x250
Bundle = 70 pair
1904 pair per day
Amaga
Takt time = 27 sec
Electronic
Orders at
PacemakerClose
Order daily
Reduced
size trailer2 times
per Shft
Visual Control
System / Andon
6 layers of
500 meter
X 3Design
Establish kanban size/
quantity & Leveling
the Product mix
10 Bed
sheets X 2
Design
Need to
use bins
Pitch Increment of work
with every 31.5 min
Pitch Removal of
finished goods with
every 31.5 min
CT = 50.62 min CT =17.38 min
Dailly
Order
Purchase
Order
Supermarket Requierd to
connect with customer
Sales Rep
Supermarket
Customer
8 hrs
Sales
Order
Shipping
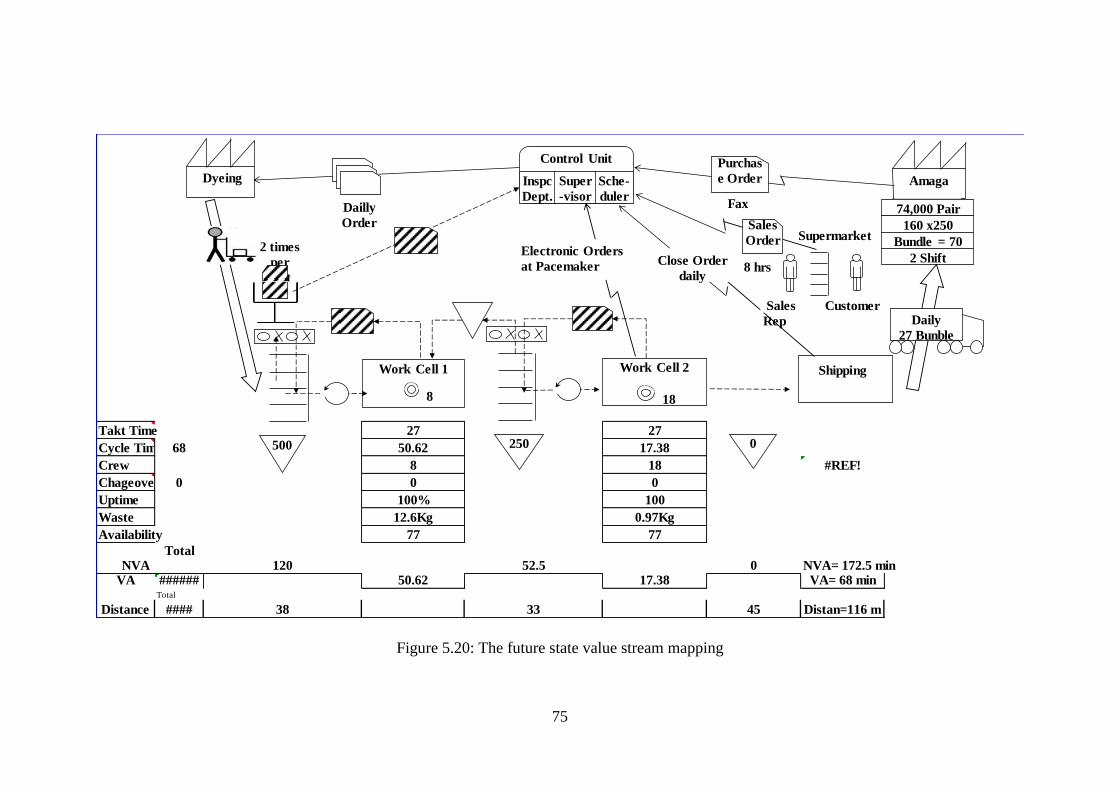
75
Figure 5.20: The future state value stream mapping
Instructions
© 2017 KnowWare
Takt Time 27 27
Cycle Time 68 50.62 17.38
Crew 8 18 #REF!
Chageover 0 0 0
Uptime 100% 100
Waste 12.6Kg 0.97Kg
Availability 77 77
Total NVA 120 52.5 0 NVA= 172.5 min
VA ###### 50.62 17.38 VA= 68 minTotal
Distance #### 38 33 45 Distan=116 m
500 250 0
Dyeing
Work Cell 1
8
74,000 Pair
160 x250
Bundle = 70
pair2 Shift
Amaga
Dailly
Order
Work Cell 2
18
Daily
27 Bunble
Fax
Purchas
e Order
2 times
per
Shft
Control Unit
Inspc
Dept.
Sche-
duler
Super
-visor
Electronic Orders
at Pacemaker Close Order
daily
Sales
Rep
Supermarket
Customer
8 hrs
Sales
Order
Shipping
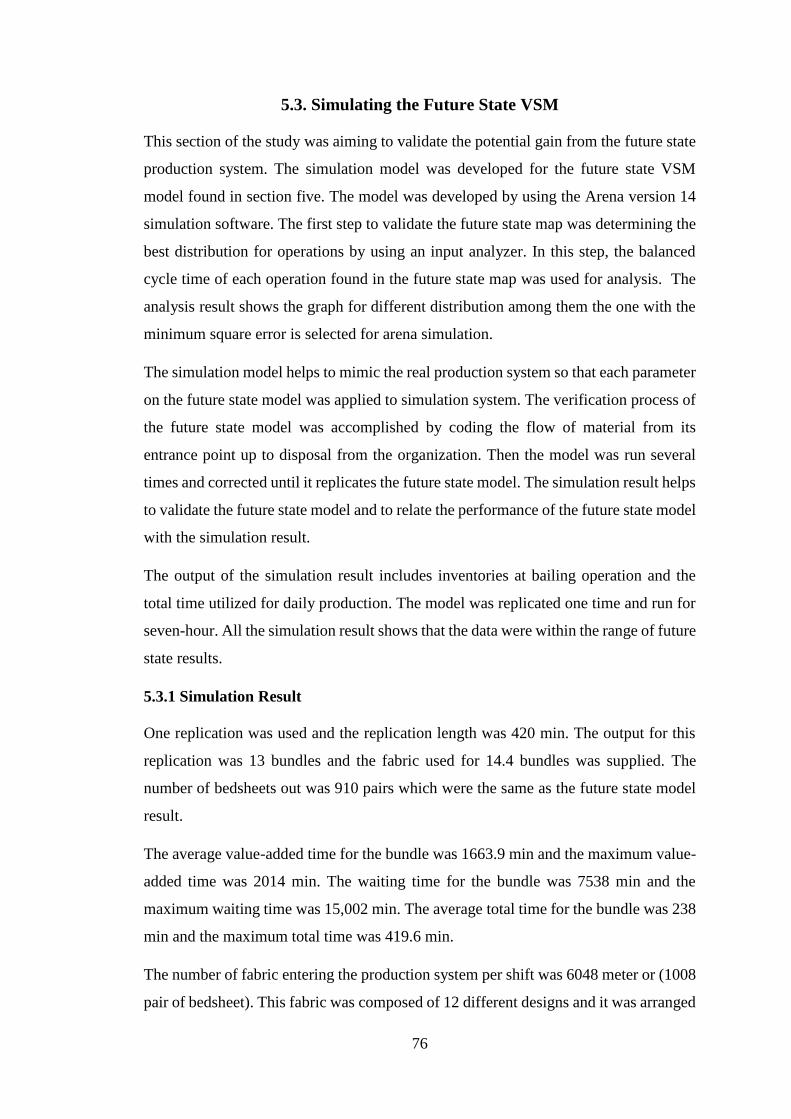
76
5.3. Simulating the Future State VSM
This section of the study was aiming to validate the potential gain from the future state
production system. The simulation model was developed for the future state VSM
model found in section five. The model was developed by using the Arena version 14
simulation software. The first step to validate the future state map was determining the
best distribution for operations by using an input analyzer. In this step, the balanced
cycle time of each operation found in the future state map was used for analysis. The
analysis result shows the graph for different distribution among them the one with the
minimum square error is selected for arena simulation.
The simulation model helps to mimic the real production system so that each parameter
on the future state model was applied to simulation system. The verification process of
the future state model was accomplished by coding the flow of material from its
entrance point up to disposal from the organization. Then the model was run several
times and corrected until it replicates the future state model. The simulation result helps
to validate the future state model and to relate the performance of the future state model
with the simulation result.
The output of the simulation result includes inventories at bailing operation and the
total time utilized for daily production. The model was replicated one time and run for
seven-hour. All the simulation result shows that the data were within the range of future
state results.
5.3.1 Simulation Result
One replication was used and the replication length was 420 min. The output for this
replication was 13 bundles and the fabric used for 14.4 bundles was supplied. The
number of bedsheets out was 910 pairs which were the same as the future state model
result.
The average value-added time for the bundle was 1663.9 min and the maximum value-
added time was 2014 min. The waiting time for the bundle was 7538 min and the
maximum waiting time was 15,002 min. The average total time for the bundle was 238
min and the maximum total time was 419.6 min.
The number of fabric entering the production system per shift was 6048 meter or (1008
pair of bedsheet). This fabric was composed of 12 different designs and it was arranged
77
in supermarket 1. This number of fabrics forms 48 rolls of fabric in inspection
operation. Then in the cutting operation, each roll forms 21 bedsheets and at the end of
the day, 91box (910 cut fabric) passed the bailing operation. Here the number of cut
fabric passing the supermarket 2 were 100 boxes. The final output of the system for 7
hours available time was 13 bundles.
On the other hand, the average number of work in process formed by fabric arrival in
the line was 614 bedsheets (7.27 fabric) and the maximum value for this fabrics were
1008 pair (6048-meter fabric). In supermarket 1 and inspection operation the work in
process was 3.41 fabric and the maximum value was 12 fabric. The Work in process
formed by roll was one which was the result of the continuous system. Likewise, for
cut fabrics, the average number was 29 boxes (290 pairs) and the maximum number of
WIP formed by this sheared fabric was 58 boxes. Lastly, the maximum number of WIP
formed by bundles was 1.
The average waiting time for inspection and sewing operation was 101 min and 94 min.
respectively. These waiting times were higher up to 202 min and 186.6 min. The
average waiting number in inspection and sewing operation was 2.8 fabric and 23 boxes
of cut fabric (230 bedsheets). The maximum waiting number in inspection and sewing
operation was 11 fabric and 480 bedsheets.
As we can see in the queue table, the waiting number for cutting, folding, packing, and
bailing operation were zero. Likewise, the waiting time on the above operation was 6
min, 1 min, and zero respectively. This indicates the continuous flow (first in first out
lane) in the future state value stream works well.
The instantaneous resource utilization was composed of operators and machine
utilization. The instantaneous operator utilization for inspection operator was 26.48%,
cutting operator 7.39%, sewing operator was 95.47, folding operator 93.2%, packing
operator 75.42%, and bailing was 16.7%. On the other hand, machine utilization looks
like an inspection machine 52.95%, cutting machine 44.35%, sewing machine 95.47%,
and bailing machine 49.99%.
When we see the number of resources scheduled in each operation in inspection
operation there were 2 operators and 1 machine was assigned, in cutting operation 6
operators and 1 machine was assigned, in sewing operation 5 operator and 5 machines,
in folding operation there were 5 folding operators, in packing operation 5 operators
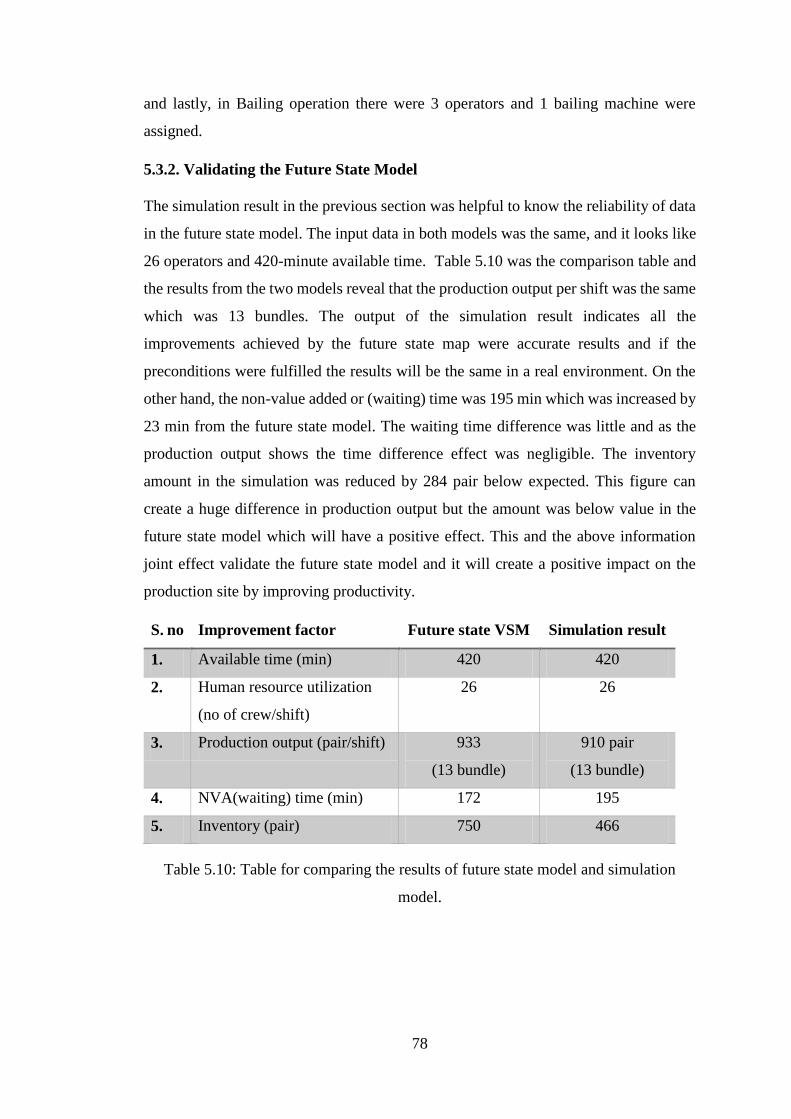
78
and lastly, in Bailing operation there were 3 operators and 1 bailing machine were
assigned.
5.3.2. Validating the Future State Model
The simulation result in the previous section was helpful to know the reliability of data
in the future state model. The input data in both models was the same, and it looks like
26 operators and 420-minute available time. Table 5.10 was the comparison table and
the results from the two models reveal that the production output per shift was the same
which was 13 bundles. The output of the simulation result indicates all the
improvements achieved by the future state map were accurate results and if the
preconditions were fulfilled the results will be the same in a real environment. On the
other hand, the non-value added or (waiting) time was 195 min which was increased by
23 min from the future state model. The waiting time difference was little and as the
production output shows the time difference effect was negligible. The inventory
amount in the simulation was reduced by 284 pair below expected. This figure can
create a huge difference in production output but the amount was below value in the
future state model which will have a positive effect. This and the above information
joint effect validate the future state model and it will create a positive impact on the
production site by improving productivity.
S. no Improvement factor Future state VSM Simulation result
1. Available time (min) 420 420
2. Human resource utilization
(no of crew/shift)
26 26
3. Production output (pair/shift) 933
(13 bundle)
910 pair
(13 bundle)
4. NVA(waiting) time (min) 172 195
5. Inventory (pair) 750 466
Table 5.10: Table for comparing the results of future state model and simulation
model.
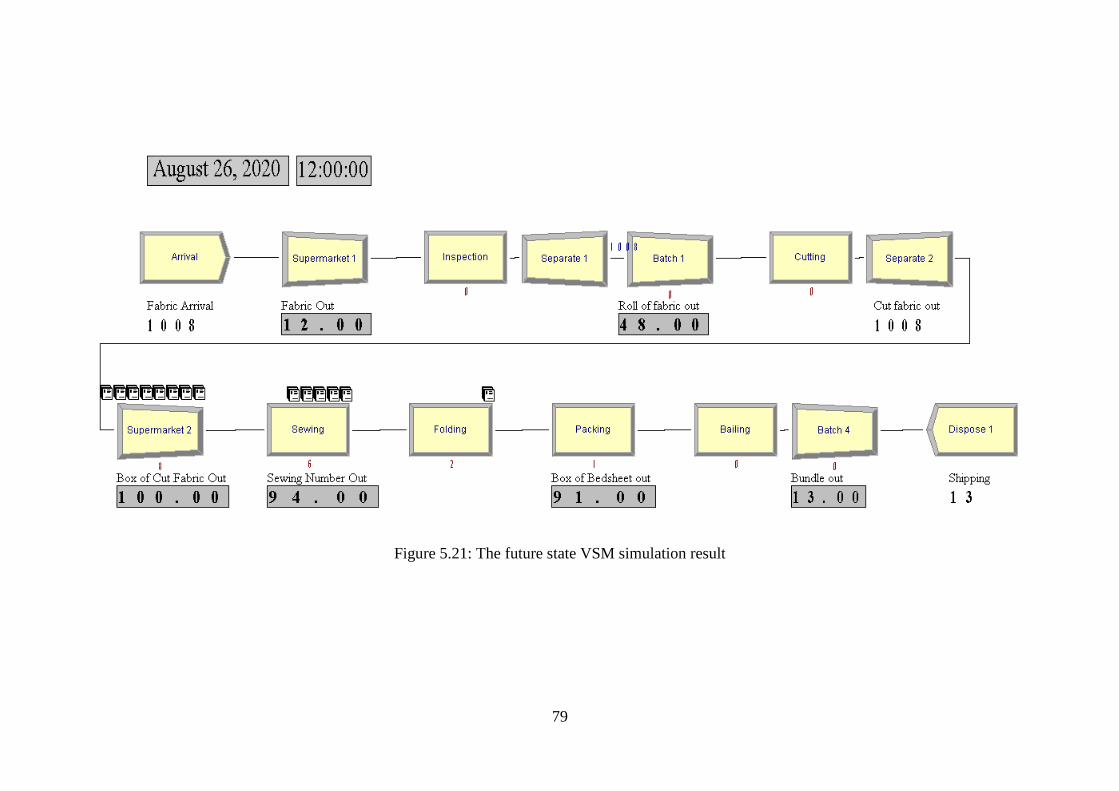
79
Figure 5.21: The future state VSM simulation result
80
6. CONCLUSIONS AND RECOMMENDATIONS
6.1. Conclusions
The case company used for this study is Bahir Dar Textile Share Company. The
garment section is one of the bottlenecks for company profitability associated with poor
manufacturing practice and lower effort to address a customer need. The waste type in
the current production system were overproduction, lower resource utilization, excess
inventories and waiting time, transportation, unnecessary information flow, and lower
flexibility are the main characteristics of the shop. Therefore the study mainly uses lean
manufacturing principles to overcame those wastes and improve productivity.
The case study integrates the value stream mapping with simulation system.
Throughout the study, the findings reveal that the simulation validation was an essential
and useful part of the study. The simulation part was helpful to reach a common
consensus about the future state VSM, and to visualize the VSM model.
The main aim of the study was to improve productivity by using lean manufacturing in
the production system. Productivity improvement had a direct relationship with
eliminating wastes. The study reveals that the improved production system reduces the
lead time from 73.57hour to 4.09hour by 94.4 percent, non-value-added time from 4183
min to 172 min by 96.2 %, the inventory was reduced from 7050 pair to 750 pair by
89.35%. Besides through connected operations, the distance travel was reduced from
142 m to 98 m (improved by 30.98%). On the other hand, by using a flexible production
system the product variety was increased from one to six bedsheet types per day.
Furthermore, the production system was changed from push to customer pull system,
and the number of human resources was reduced from 29 to 26 which is by 10.3 %, the
production output was increased from 952 to 1108 pair per shift by 16%.

81
6.2. Recommendations
The lean production system was an effective tool to improve the productivity of
garment production in textile industry. The study will give good results if it is applied
in less productive sections with unnecessary information exchange systems and
scheduling tasks, with lower resource utilization and flexibility, and lastly in a
production system with excess inventories, waiting time, and transportation.
This study recommends taking the following measure in the production system. The
multi-skill operator is an important thing to meet the dynamics of customer need
therefore it’s better to use a rotation of operator. The quality of the product can be
improved by using 5s. The uptime of equipment and availability can be improved by
using total productive maintenance. Lastly, for producing a variety of products
according to customer need and for better resource utilization it's better to use the new
product development approach known as the adaptive way.
6.3. Future Work
There are many future application areas associated with this study. Primarily, the VSM
can combine with other improvement tools to get better results on a process that was
not properly explained. Secondly, for different conditions, there is another simulation
software that can give good results when combined with VSM. The third application
area beyond the production system was in the supply chain system. Therefore future
studies can be carried out to improve the supply chain system.
82
REFERENCES
Abdulmalek F., & Rajgopal J. (2007). Analyzing the benefits of lean manufacturing
and value stream mapping via simulation: A process sector case study.
International Journal of Production Economics, 107(1), 223–236.
https://doi.org/10.1016/j.ijpe.2006.09.009
Ali S. et al. (2009). Productivity: MIS 517 Operations Management.
Amare M. (2010). Model Development of Quality Management System for Ethiopian
Textile Industries.
Amdework G. (2019). Production Lead Time Improvement through Lean
Manufacturing (Case Study in Hibiret Manufacturing & Machine Building
Industry).
Anil K. et al. (2008). Production and Operations Management (Second Edition), New
Age International, New Delhi.
Bahir Dar Textile Share Company. (2020). Daily Company Report.
Baysan S., Kabadurmus O., & Cevikcan E. (2019). A simulation-based methodology
for the analysis of the effect of lean tools on energy efficiency : An application in
power distribution industry. Journal of Cleaner Production, 211, 895–908.
https://doi.org/10.1016/j.jclepro.2018.11.217
Braglia M., Carmignani G., & Zammori F. (2017). A new value stream mapping
approach for complex production systems. 7543(August).
https://doi.org/10.1080/00207540600690545
Bruce M., (2006). Buyer behavior for fast fashion’, Journal of Fashion Marketing and
Management. Journal of Fashion Marketing and Management, Vol. 10(No. 3).
Retrieved from pp.329–344
Derbe T. (2018). Productivity Analysis and Improvement in Ethiopian Metal
Manufacturing Industries “ A Case of Yesu Metals Manufacturing .”
Daniel P. (2013). Diagram depicting the parts of a value stream map. U.S. Patent No.
CC BY-SA 3.0 US
Deshkar A., Kamle S., Giri J., & Vivek K. (2018). Mapping ( VSM ) for a plastic bag
manufacturing unit. Materials Today: Proceedings, 5(2), 7668–7677.

83
https://doi.org/10.1016/j.matpr.2017.11.442
Gebrehiwot A. (2017). Practicing Lean Manufacturing Tools For Productivity
Improvement. A Case study in Knit to Finish Garment PLC.”
Hans G. (2012). International productivity comparisons at the industry level. Alfred
Weber Institute. Universidad Heidelberg.
James P., & Daniel T., (1990). The Machine That Changed the World (1st ed.). New
York.
James P., & Daniel T. (2003). Lean Thinking: banish waste and create wealth in your
corporation. New York: FREE PRESS.
Kendrick J. and Creamer D., (1965), Measuring company productivity Handbook with
case studies, New York.
Kunz G. (2007). Going Global. The Textile and Apparel Industry.
Liker J. (2004). The Toyota Way Fieldbook-14 Management Principles from the
World’s Greatest Manufacturer. New York: McGraw-Hill.
Lugert et al. (2018). Dynamization of Value Stream Management by technical and
managerial approach. Procedia CIRP, 72, 701–706.
https://doi.org/10.1016/j.procir.2018.03.284
Marco C., & Francesca M. (2016). Management of Innovation and Product
Development. In Management of Innovation and Product Development.
https://doi.org/10.1007/978-1-4471-6723-5
Mike R., & John S. (1999). Learning to See Value Stream Mapping to Add Value and
Eliminate MUDA’.
Mikell P. (2008). Automation production system and computer integrated
manufacturing (3rd edition; P. NJ, Ed.). Prentince hall.
Monden Y. (2012). TOYOTA Production System: An Integrated Approach to Just-In-
Time (4th Edi). CRC Press.
Neeraj et al. (2018). Modeling and simulation of discrete manufacturing industry.
Science Direct, 5(11), 24971–24983. https://doi.org/10.1016/j.matpr.2018.10.298
Andris F., (2009). Methods, Standards, and Work Design, (12th Edition). Minnesota:
84
McGraw-Hill.
QI macros software, (2018). qimacros.com
Rahel S. (2010). Performance Measurement and Improvement of Ethiopian Garment
Industries.
Romero L., & Arce A. (2017). Applying Value Stream Mapping in Manufacturing: A
Systematic Literature Review. IFAC-PapersOnLine, 50(1), 1075–1086.
https://doi.org/10.1016/j.ifacol.2017.08.385
Sime H. (2019). Feasibility of using simulation technique for line balancing in apparel
industry. Procedia Manufacturing, 30, 300–307.
https://doi.org/10.1016/j.promfg.2019.02.043
Stadnicka D., & Litwin P. (2019). Value stream mapping and system dynamics
integration for manufacturing line modeling and analysis. International Journal of
Production Economics, 208(December 2018), 400–411.
https://doi.org/10.1016/j.ijpe.2018.12.011
Statistics, car sales. (2018). (full year) international: global top car brands.
Tadesse A. (2011). Design of Productivity Improvement Method for Ethiopian Garment
Industries.
Tyler D., & Heeley J. (2006). Supply chain influences on new product development in
fashion clothing. Journal of Fashion Marketing and Management, Vol. 10(No. 3).
Retrieved from pp.316–328
www.assolombarda.it. (2020). Bahir Dar Textile Share Company ’ s Profile. Retrieved
from www.assolombarda.it website: 200498175949-78
www.bahirdartextile.com/en/. (2020). Bahir Dar Textile Share Company.
www.leanproducts.eu (2020). system box-2
www.leansixsigma.com (2020). andon
85
APPENDIX
Appendix-1 Questionnaire
Dear respondent,
I am a postgraduate student in Bahir Dar Institute of Technology with a program of
production engineering and management, Bahir Dar University. Currently, I am
undertaking a study entitled “Productivity Improvement through Lean Manufacturing
principles in garment section of Bahir Dar Textile Share Company.” You are one of the
respondents selected to participate in this study. Please assist me by giving correct and
complete information to present a representative finding on the current status of the
Assessment on lean manufacturing Case of Bahir Dar Textile Share Company. Your
participation is entirely voluntary and the questionnaire is completely anonymous.
Finally, I confirm that the information that you share with me will be kept confidential
and will be used only for the academic purpose. No individual responses will be
identified and the identity of persons responding will not be published or released to
anyone. Thank you in advance for your kind cooperation.
Sincerely,
Abrham Temesgen
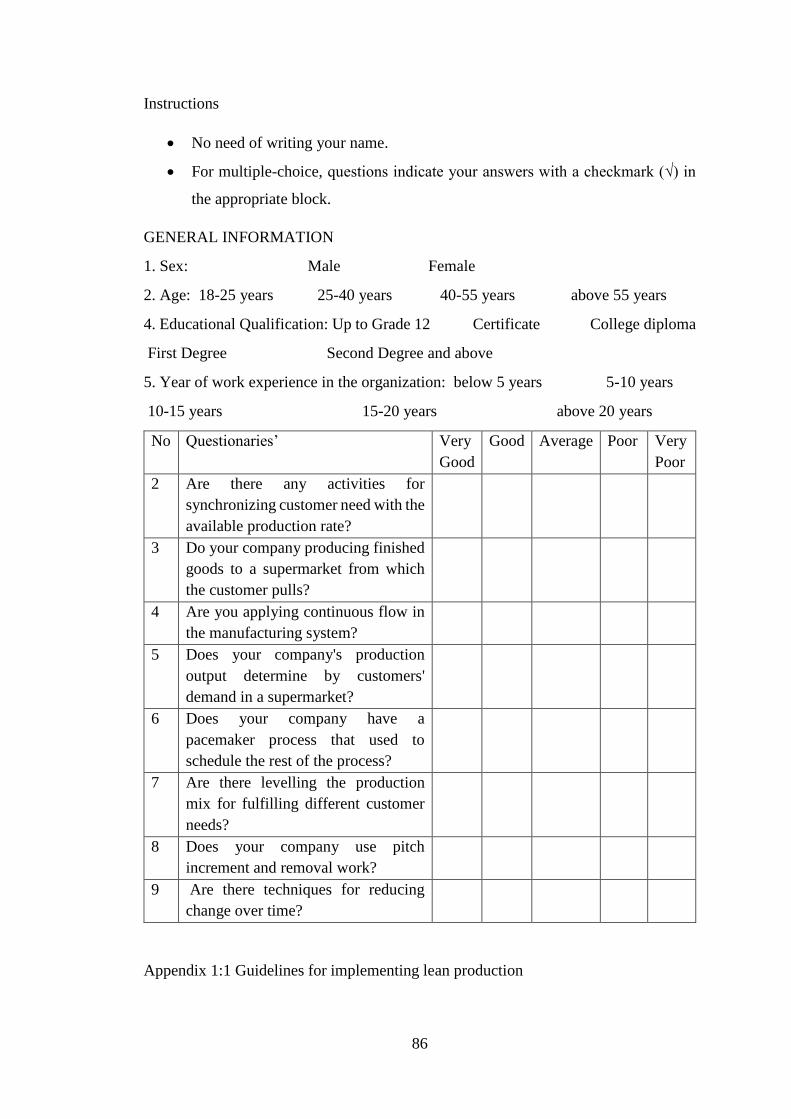
86
Instructions
No need of writing your name.
For multiple-choice, questions indicate your answers with a checkmark (√) in
the appropriate block.
GENERAL INFORMATION
1. Sex: Male Female
2. Age: 18-25 years 25-40 years 40-55 years above 55 years
4. Educational Qualification: Up to Grade 12 Certificate College diploma
First Degree Second Degree and above
5. Year of work experience in the organization: below 5 years 5-10 years
10-15 years 15-20 years above 20 years
No Questionaries’ Very
Good
Good
Average
Poor
Very
Poor
2 Are there any activities for
synchronizing customer need with the
available production rate?
3 Do your company producing finished
goods to a supermarket from which
the customer pulls?
4 Are you applying continuous flow in
the manufacturing system?
5 Does your company's production
output determine by customers'
demand in a supermarket?
6 Does your company have a
pacemaker process that used to
schedule the rest of the process?
7 Are there levelling the production
mix for fulfilling different customer
needs?
8 Does your company use pitch
increment and removal work?
9 Are there techniques for reducing
change over time?
Appendix 1:1 Guidelines for implementing lean production

87
Appendix 1:3 Descriptive analysis result for questionnaire
Row1 Row2 Row3 Row4 Row5 Row6 Row7 Row8
Mean 2.423077 2.038462 2.692308 2.961538 2.5 2.807692 2.692308 2.461538
Standard Error 0.176923 0.195965 0.164263 0.187951 0.201914 0.192308 0.198217 0.16853
Median 2 2 3 3 2 3 2.5 2
Mode 2 1 3 3 2 3 2 2
Standard Deviation 0.902134 0.99923 0.837579 0.958364 1.029563 0.980581 1.010712 0.859338
Sample Variance 0.813846 0.998462 0.701538 0.918462 1.06 0.961538 1.021538 0.738462
Kurtosis -0.46909 1.367885 1.235434 0.108473 -1.05948 -0.71458 -0.37562 -0.43495
Skewness 0.425372 0.960678 0.659796 -0.21411 0.23824 -0.41118 0.433608 0.12849
Range 3 4 4 4 3 3 4 3
Minimum 1 1 1 1 1 1 1 1
Maximum 4 5 5 5 4 4 5 4
Sum 63 53 70 77 65 73 70 64
Count 26 26 26 26 26 26 26 26

88
Appendix-2 More Findings
Loation; Bahir dar Summary
Activity; Garment Event Present Proposed Saving
Date;15-03-20 Operation 5 5
Supervisor; Eshet Analist; Abrham Transport 7 3
Circle appropriate method and type
Method; Present Proposed
Type; Worker Material Machine
Delay 6 2
Inspection 1 1
Storage 1 0
Remark; Time (min) 4204.29 240.5
Distance (m) 142 98
Event Description Symbol Time
(min)
Distance
(m)
Method
Recomendtion
Travel to Inspection O → D □ ∇ --- 10
Delay O → D □ ∇ 210
Inspection O → D □ ∇ 4.02
Delay O → D □ ∇ 42.3
Travel to Cutting section O → D □ ∇ --- 38
Cutting O → D □ ∇ 222.69
Travel to temporary storage O → D □ ∇ --- 23
Delay O → D □ ∇ 420
Travel to Sewing O → D □ ∇ --- 5
Sewing O → D □ ∇ 0.18
Folding O → D □ ∇ 0.287
Delay O → D □ ∇ 150
packing O → D □ ∇ 0.14
Travel to temporary storage O → D □ ∇ --- 9
Delay O → D □ ∇ 1680
Travel to Unitizing O → D □ ∇ --- 7
Unitizing O → D □ ∇ 4.67
Travel to temporary storage O → D □ ∇ -- 5
Delay O → D □ ∇ 1680
Travel to final stock area O → D □ ∇ 45
Final stock O → D □ ∇
Appendix 2:1 Flow process chart (material) for production of bedsheet.
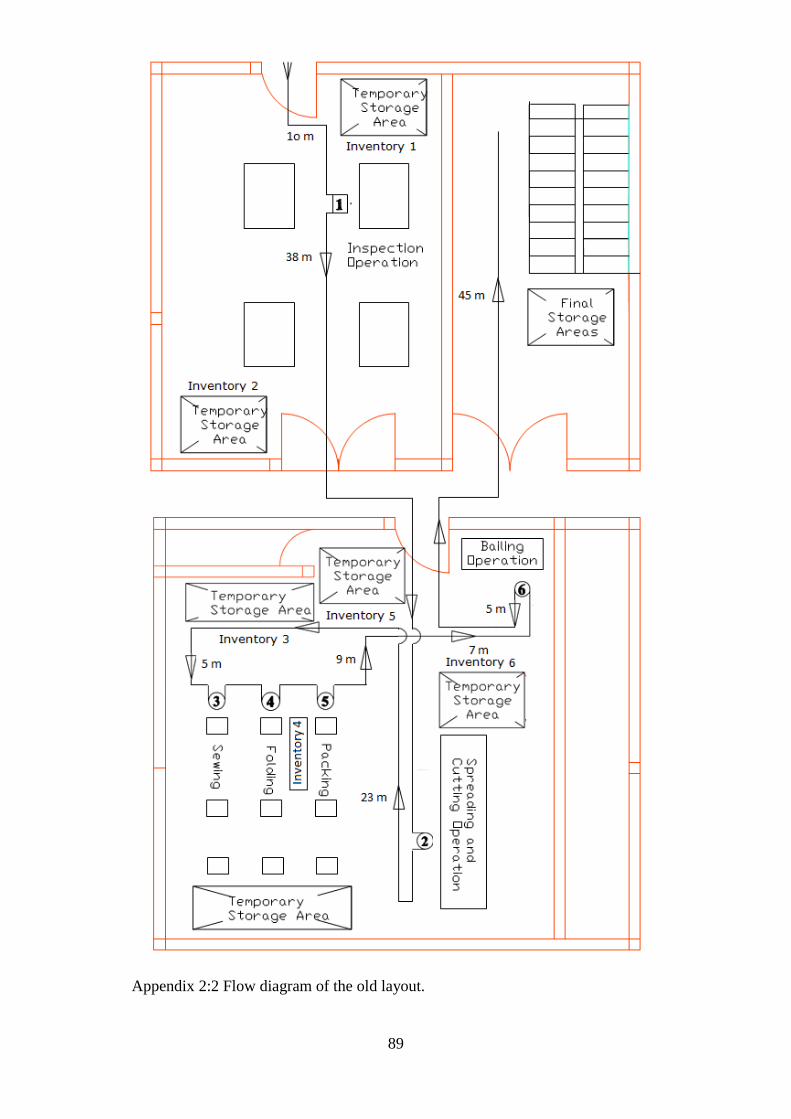
89
Appendix 2:2 Flow diagram of the old layout.
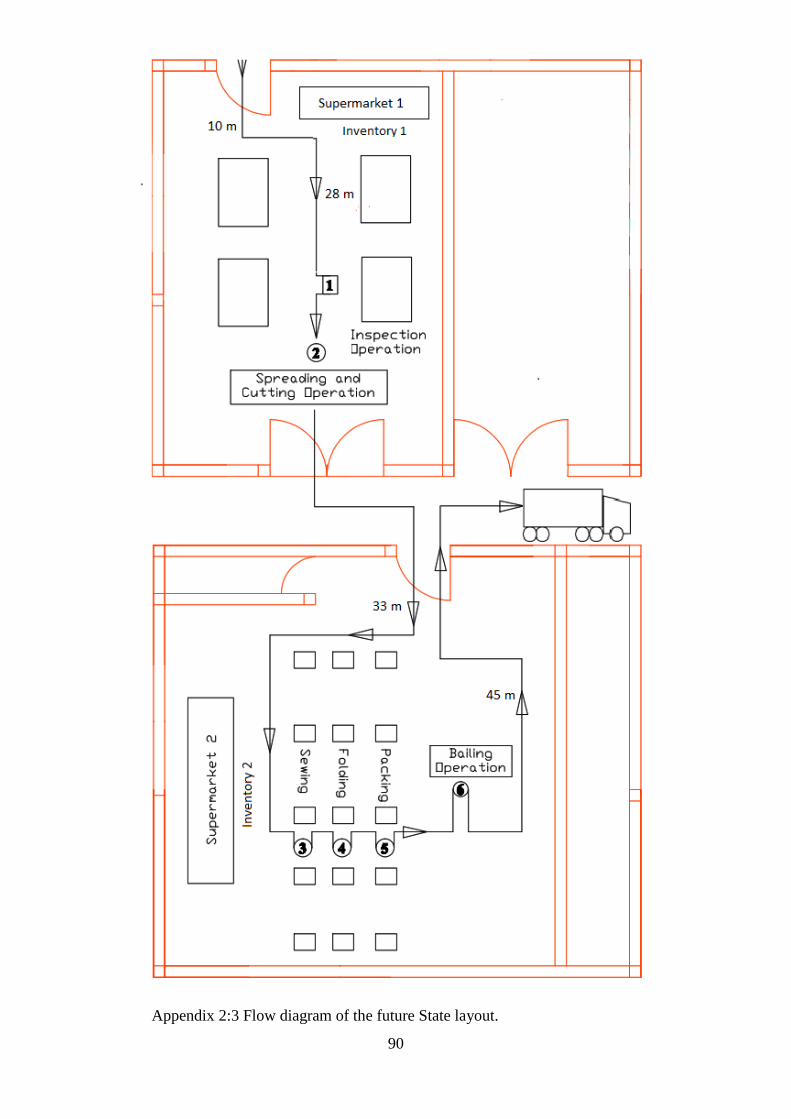
90
Appendix 2:3 Flow diagram of the future State layout.
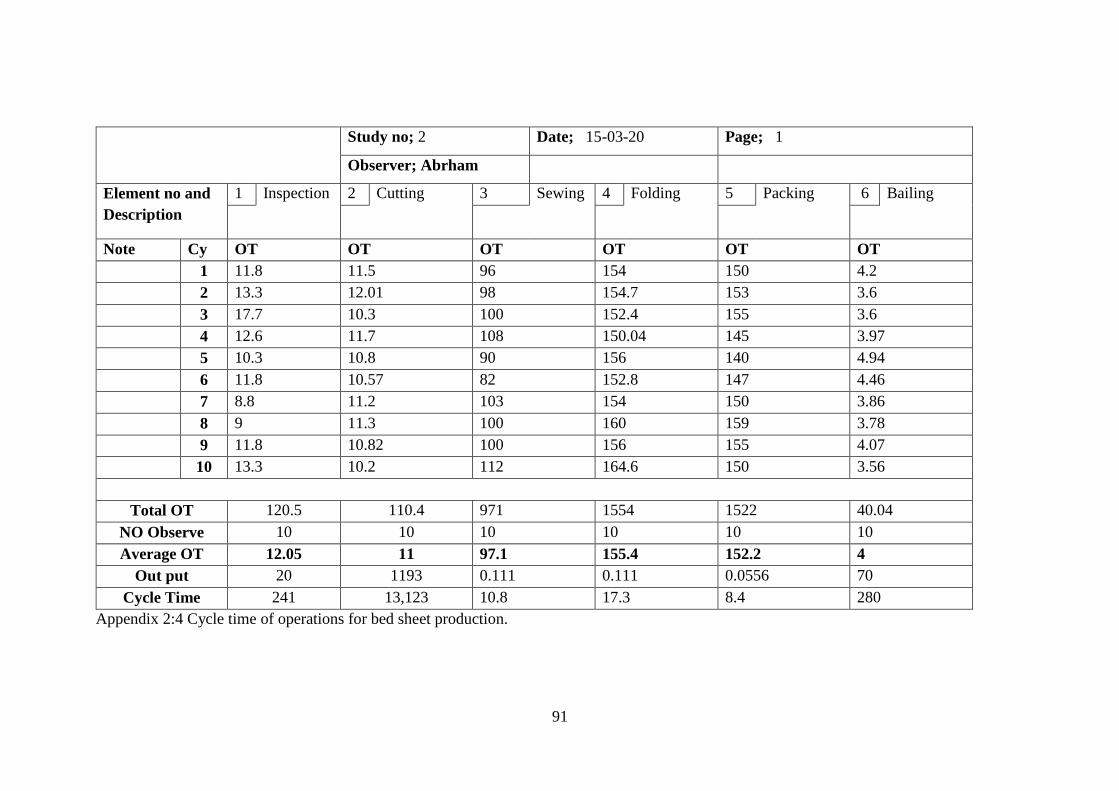
91
Appendix 2:4 Cycle time of operations for bed sheet production.
Study no; 2 Date; 15-03-20 Page; 1
Observer; Abrham
Element no and
Description
1 Inspection 2 Cutting 3 Sewing 4 Folding 5 Packing 6 Bailing
Note Cy OT OT OT OT OT OT
1 11.8 11.5 96 154 150 4.2
2 13.3 12.01 98 154.7 153 3.6
3 17.7 10.3 100 152.4 155 3.6
4 12.6 11.7 108 150.04 145 3.97
5 10.3 10.8 90 156 140 4.94
6 11.8 10.57 82 152.8 147 4.46
7 8.8 11.2 103 154 150 3.86
8 9 11.3 100 160 159 3.78
9 11.8 10.82 100 156 155 4.07
10 13.3 10.2 112 164.6 150 3.56
Total OT 120.5 110.4 971 1554 1522 40.04
NO Observe 10 10 10 10 10 10
Average OT 12.05 11 97.1 155.4 152.2 4
Out put 20 1193 0.111 0.111 0.0556 70
Cycle Time 241 13,123 10.8 17.3 8.4 280
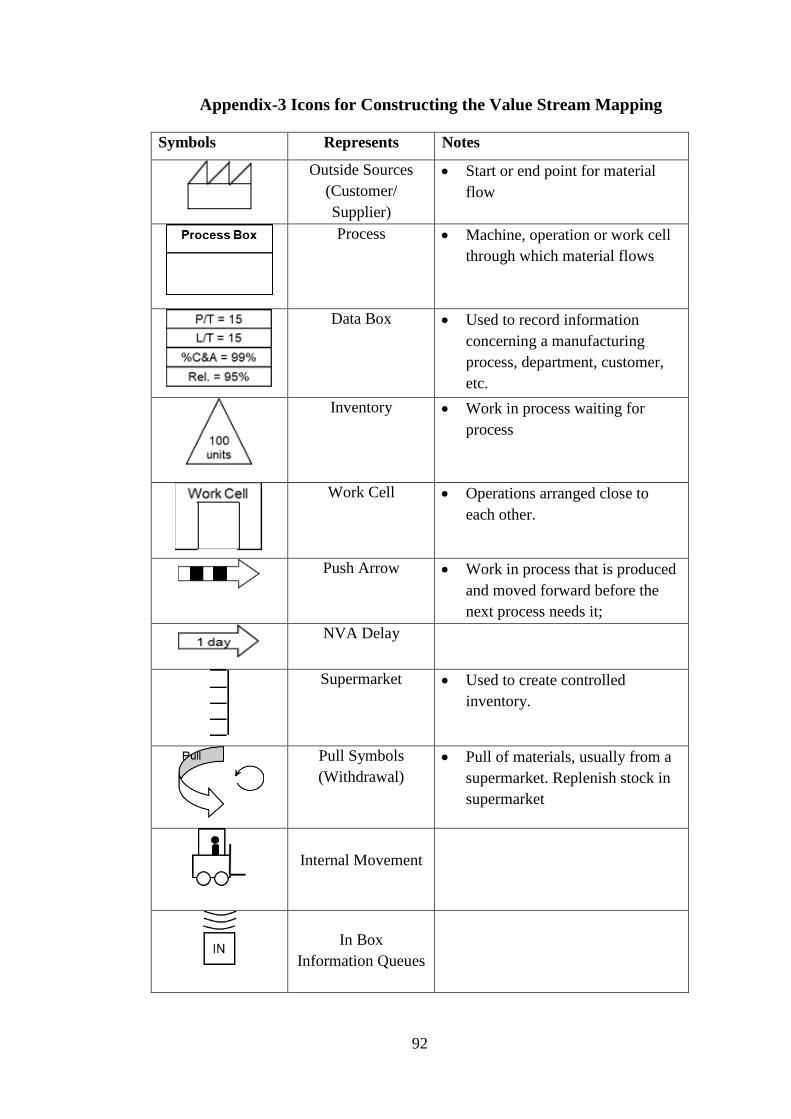
92
Appendix-3 Icons for Constructing the Value Stream Mapping
Symbols Represents Notes
Outside Sources
(Customer/
Supplier)
Start or end point for material
flow
Process
Machine, operation or work cell
through which material flows
Data Box Used to record information
concerning a manufacturing
process, department, customer,
etc.
Inventory Work in process waiting for
process
Work Cell Operations arranged close to
each other.
Push Arrow Work in process that is produced
and moved forward before the
next process needs it;
NVA Delay
Supermarket
Used to create controlled
inventory.
Pull Symbols
(Withdrawal)
Pull of materials, usually from a
supermarket. Replenish stock in
supermarket
Internal Movement
In Box
Information Queues
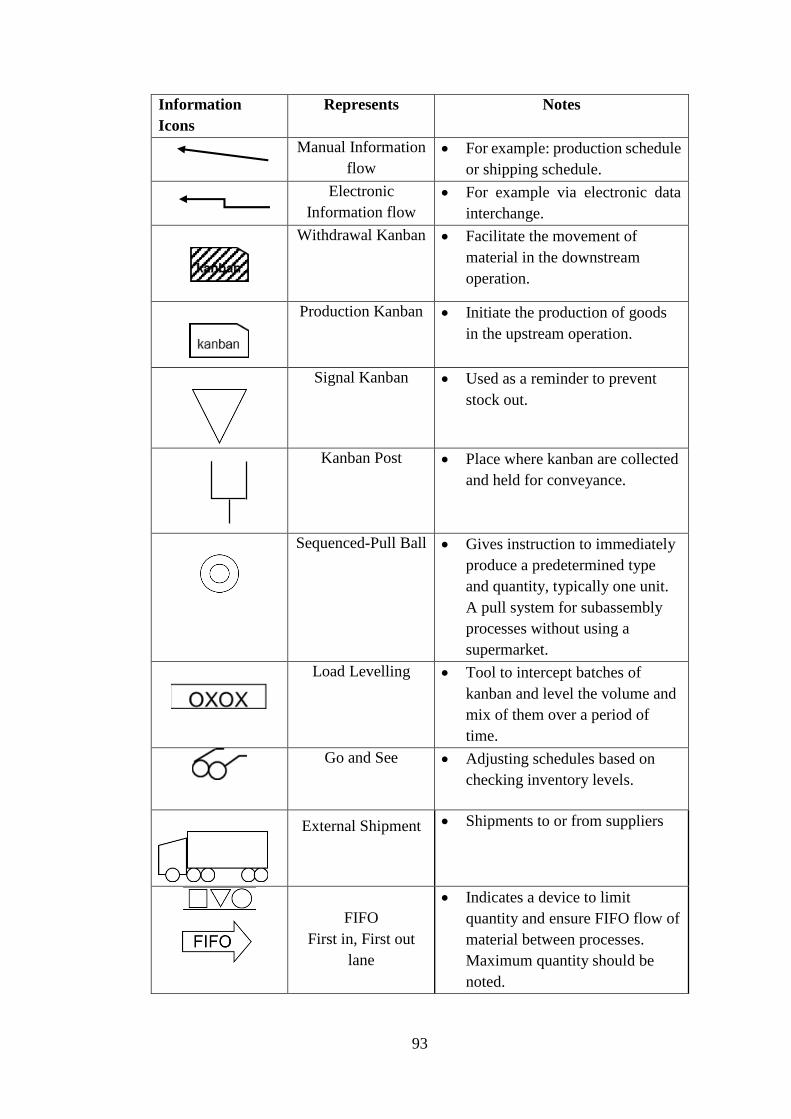
93
Information
Icons
Represents Notes
Manual Information
flow
For example: production schedule
or shipping schedule.
Electronic
Information flow
For example via electronic data
interchange.
Withdrawal Kanban Facilitate the movement of
material in the downstream
operation.
Production Kanban
Initiate the production of goods
in the upstream operation.
Signal Kanban
Used as a reminder to prevent
stock out.
Kanban Post
Place where kanban are collected
and held for conveyance.
Sequenced-Pull Ball
Gives instruction to immediately
produce a predetermined type
and quantity, typically one unit.
A pull system for subassembly
processes without using a
supermarket.
Load Levelling Tool to intercept batches of
kanban and level the volume and
mix of them over a period of
time.
Go and See Adjusting schedules based on
checking inventory levels.
External Shipment
Shipments to or from suppliers
FIFO
First in, First out
lane
Indicates a device to limit
quantity and ensure FIFO flow of
material between processes.
Maximum quantity should be
noted.
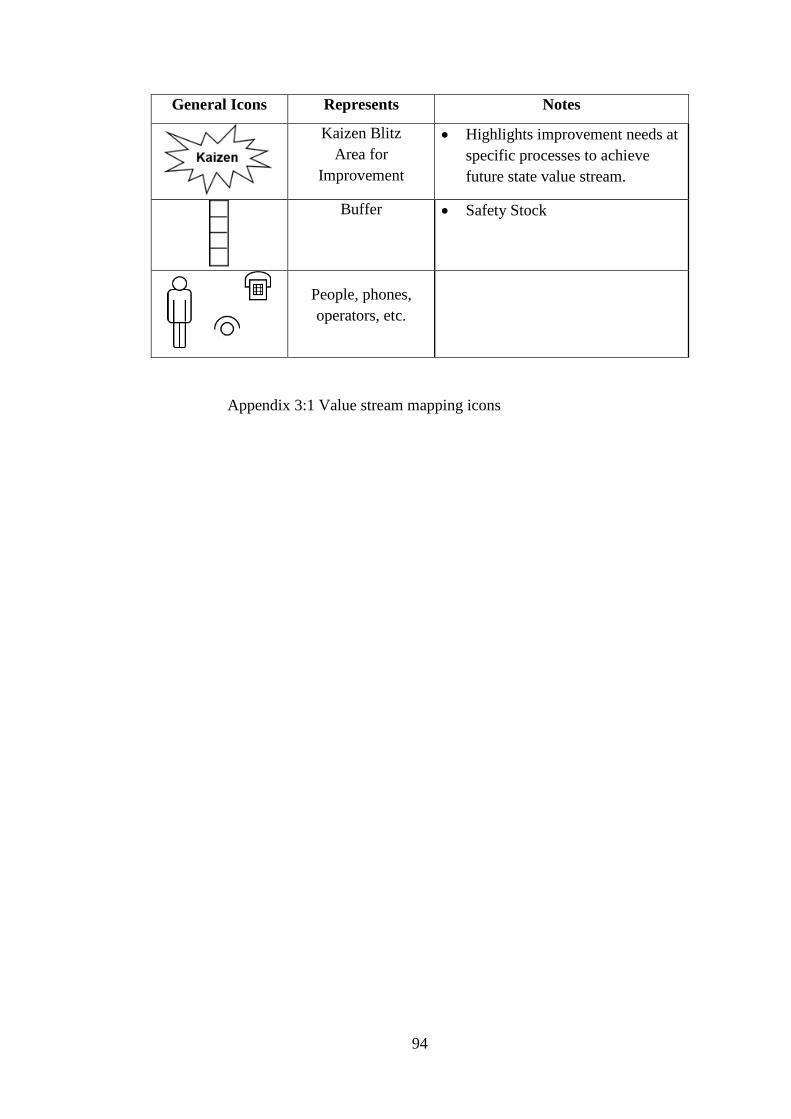
94
General Icons Represents Notes
Kaizen Blitz
Area for
Improvement
Highlights improvement needs at
specific processes to achieve
future state value stream.
Buffer
Safety Stock
People, phones,
operators, etc.
Appendix 3:1 Value stream mapping icons
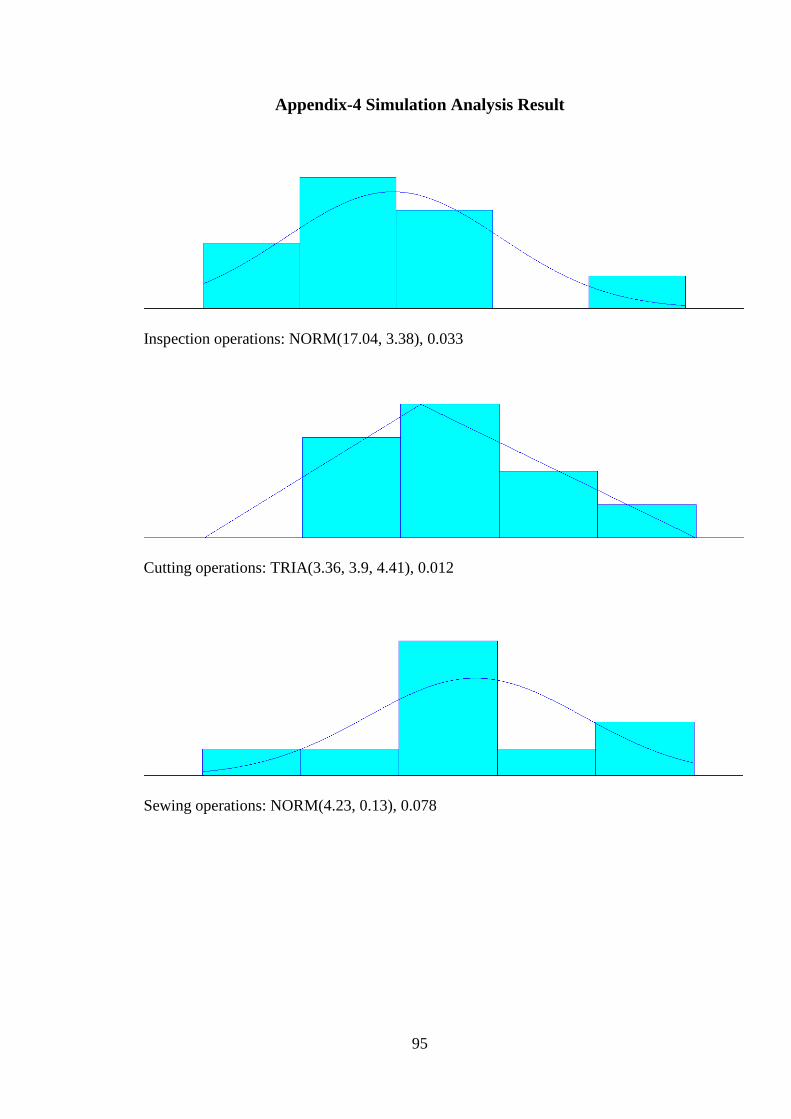
95
Appendix-4 Simulation Analysis Result
Inspection operations: NORM(17.04, 3.38), 0.033
Cutting operations: TRIA(3.36, 3.9, 4.41), 0.012
Sewing operations: NORM(4.23, 0.13), 0.078
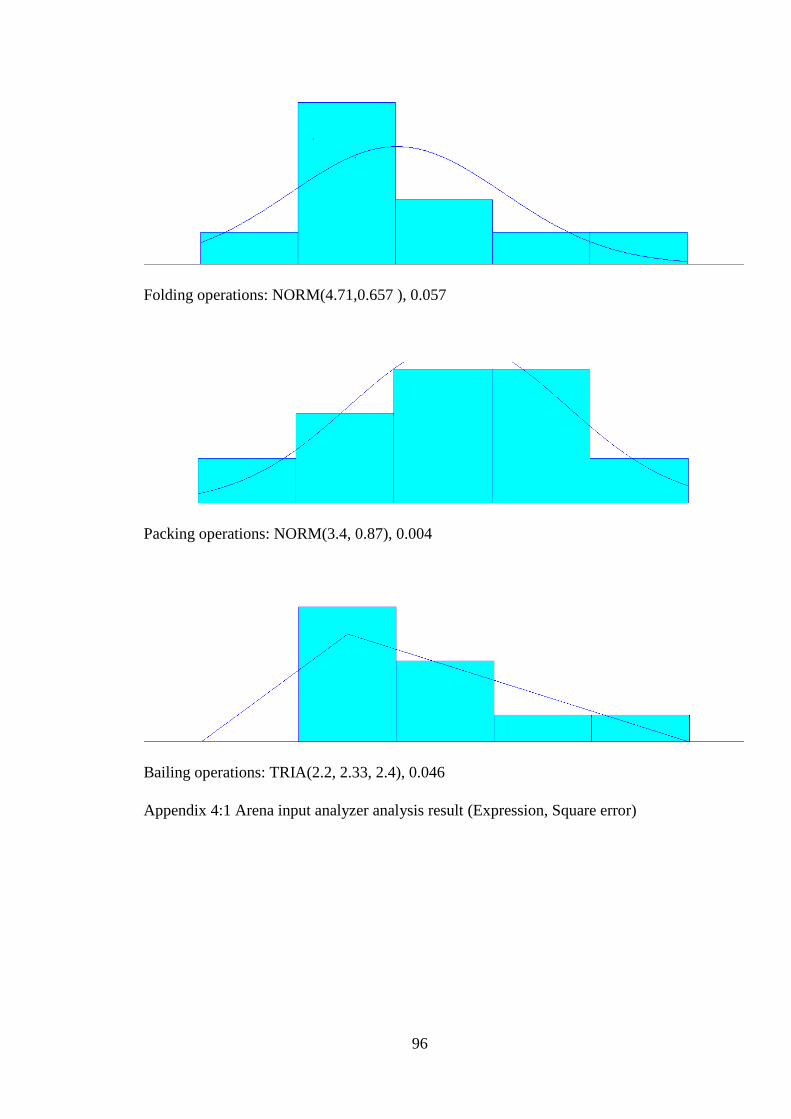
96
Folding operations: NORM(4.71,0.657 ), 0.057
Packing operations: NORM(3.4, 0.87), 0.004
Bailing operations: TRIA(2.2, 2.33, 2.4), 0.046
Appendix 4:1 Arena input analyzer analysis result (Expression, Square error)
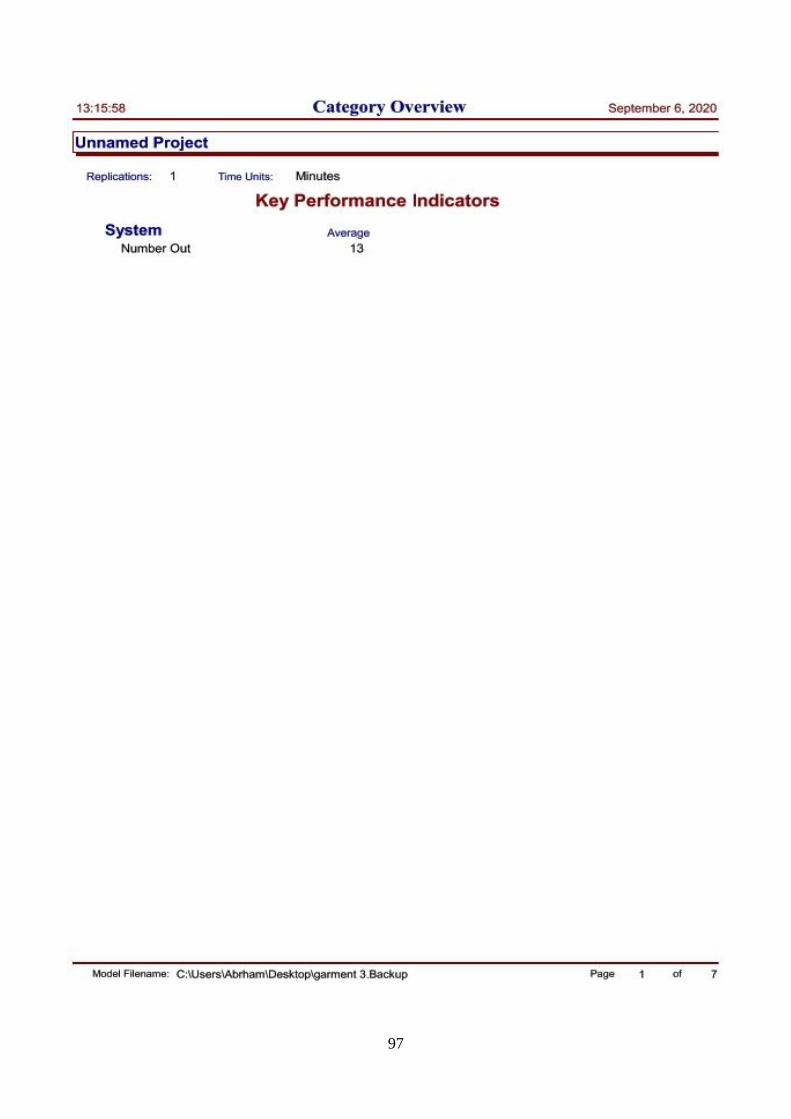
97
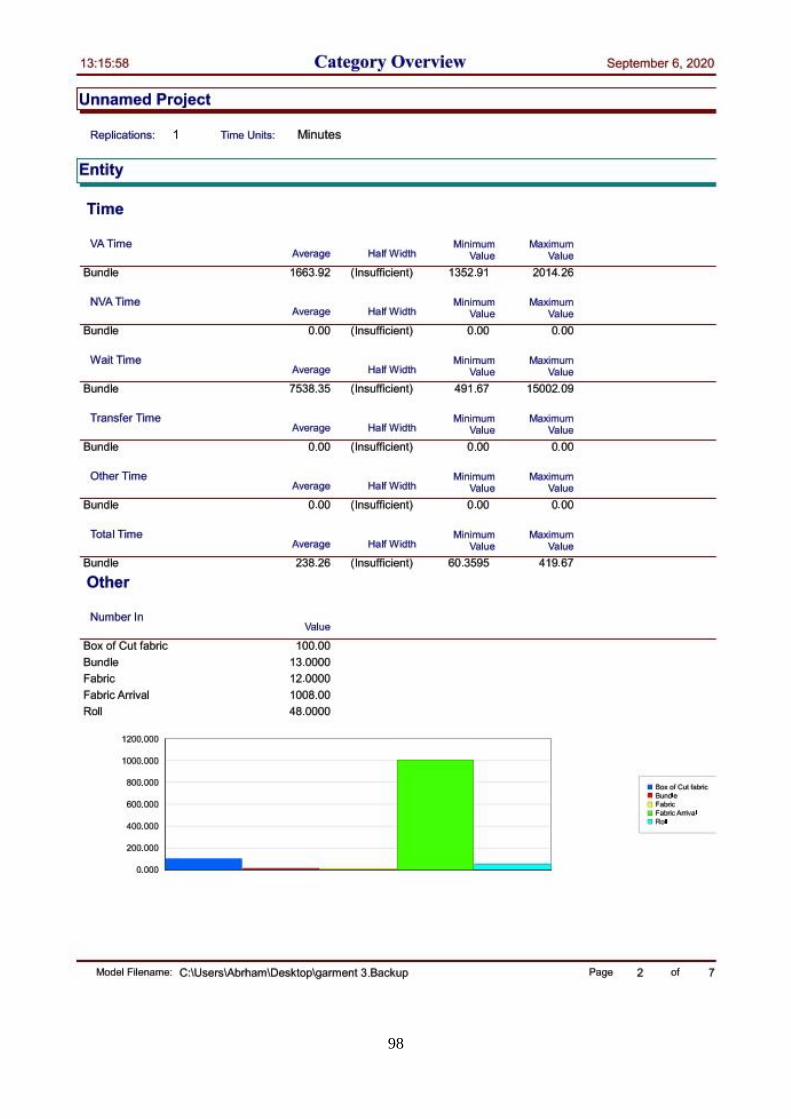
98
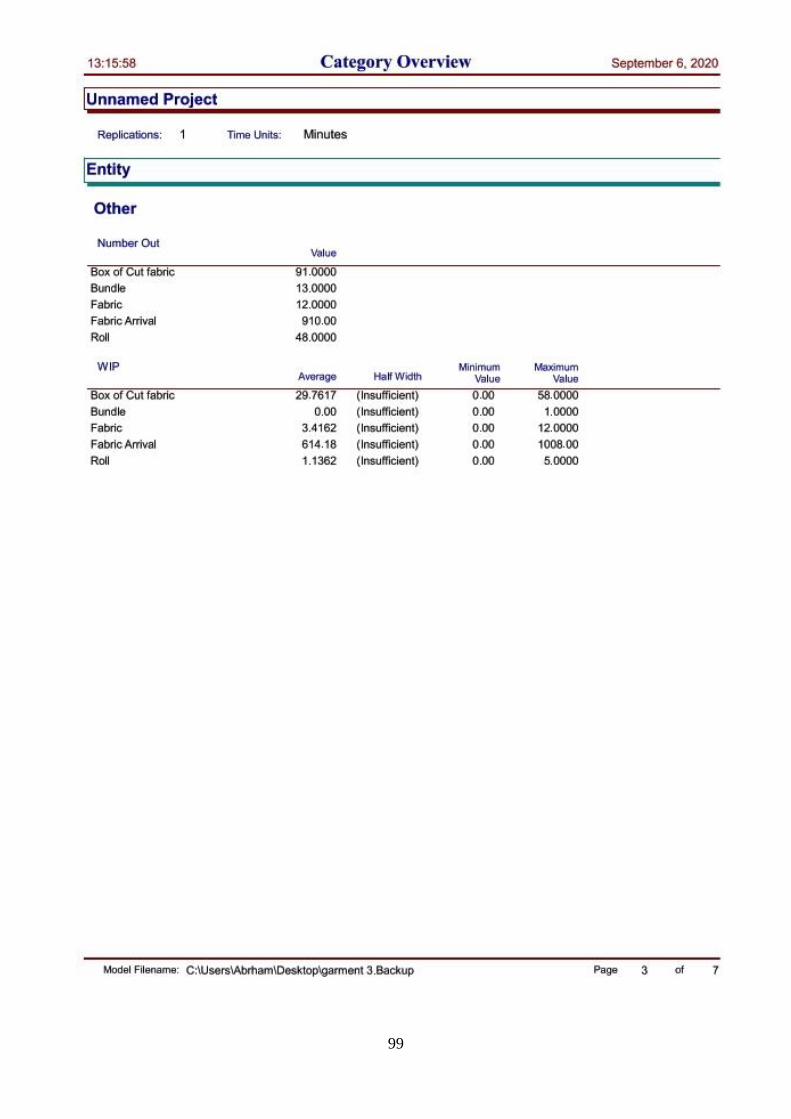
99
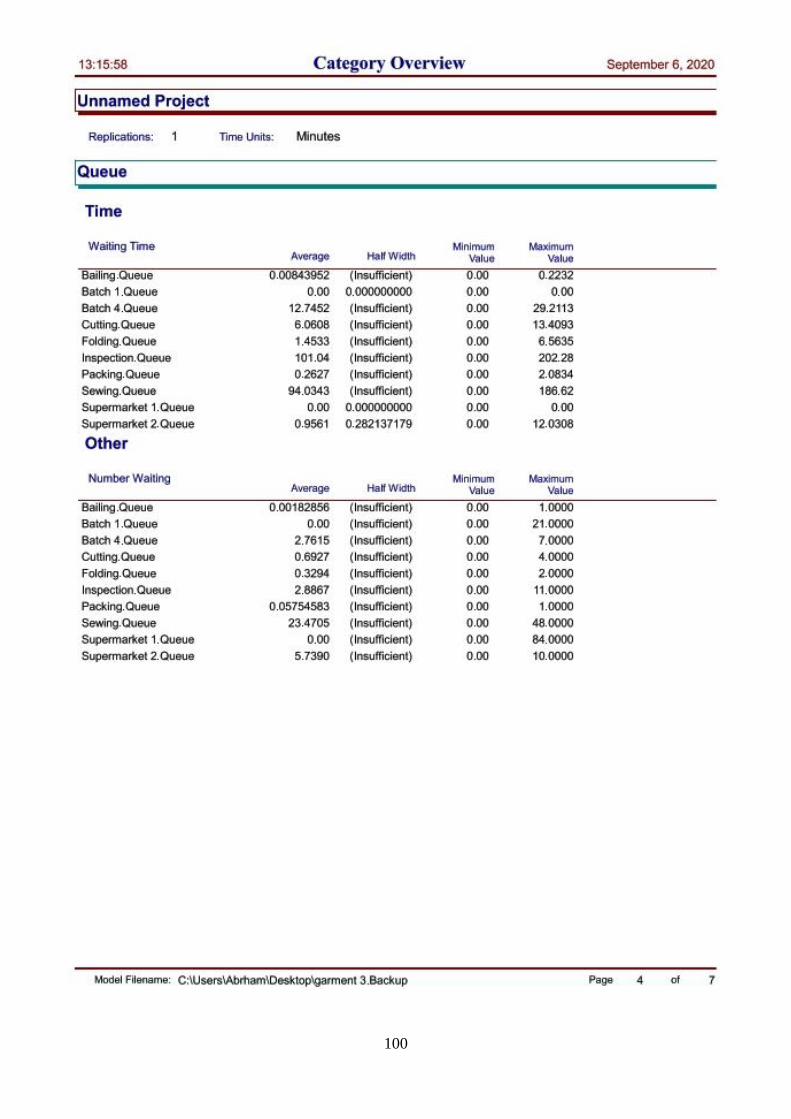
100
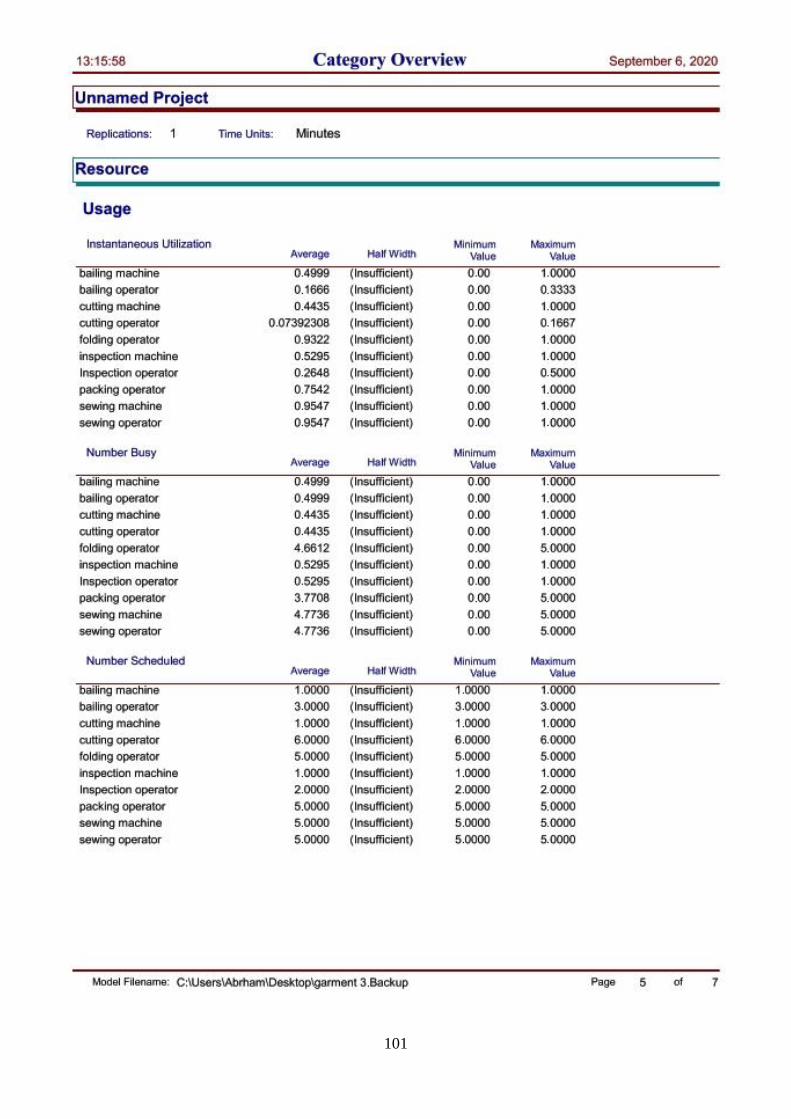
101
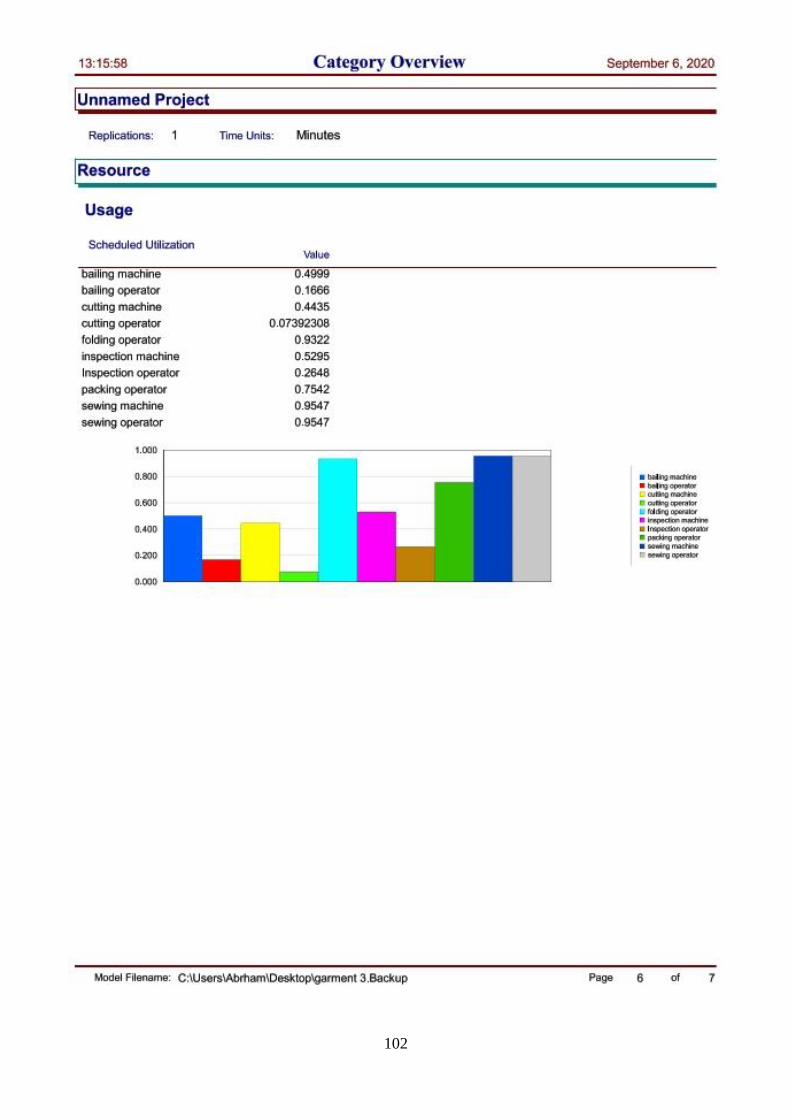
102
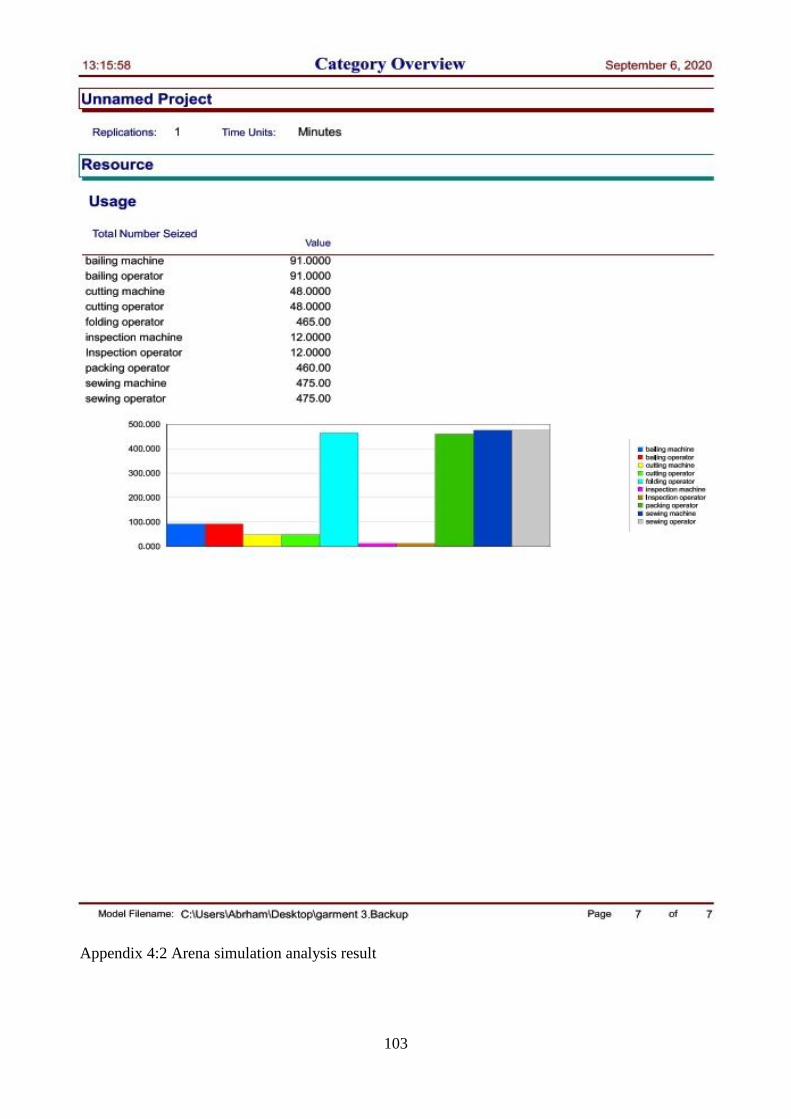
103
Appendix 4:2 Arena simulation analysis result