productivity, human capital formation policy, and ... human capital formation policy, and...
TRANSCRIPT

Productivity, Human Capital Formation Policy, and Redistribution:
Do Government Policies Promote Productivity?
Takayuki Sakamoto
Department of Policy Studies University of Kitakyushu
4-2-1 Kitagata, Kokuraminami-ku Kitakyushu, Japan 802-8577
E-mail: [email protected] Phone: +81-93-647-6614
Abstract Productivity is an important determinant of national wealth and standards of living. Scholars have shown that different welfare production regimes pursue distinct human capital formation policies to promote productivity. But do those government policies actually promote the productivity of the economy? This paper analyzes whether such policies improve multifactor productivity in industrial democracies, after briefly presenting a human capital investment explanation for why they should help productivity. It finds that family and education policies promote productivity. While such policies with redistributive effects are productivity-enhancing, however, there is no strong evidence that direct redistribution itself (when simply and only measured as poverty or inequality reduction through taxes and transfers) promotes MFP growth, once other human capital formation policies are controlled for. Evidence of pro-productivity effects of ALMP is also not detected. Thus, the analysis finds reason for governments to pursue human capital policies to promote productivity and ultimately standards of living, but they should do so selectively by choosing appropriate policy tools. Keywords: human capital; public policy; education; growth; income distribution Word count: 8,274 An early version of this paper was prepared for the annual meeting of the American Political Science Association, New Orleans, 2012. The research was supported by Grants-in-Aid for Scientific Research, Japan Society for the Promotion of Science.
Productivity is an important determinant of national wealth and standards of living. Scholars
have shown that different welfare production regimes (WPRs) pursue distinct human capital
formation policies to promote productivity (Boix, 1998; Pontusson, 2005; Iversen and Stephens,
2008). But do governments’ human capital formation policies actually promote the productivity
of the economy? The literature has suggested, for instance, that Nordic social market economies
(SMEs) promote productivity by making human capital investments through public education
and vocational training. But whether those policies successfully promote productivity has not
yet been scrutinized. This paper analyzes whether such policies improve multifactor
productivity (MFP) in industrial democracies, after briefly presenting a human capital investment
explanation for why they should help productivity. In the explanation, governments can promote
human capital investments and productivity by reducing the costs of investments, and increasing
their net benefits with public policy. The empirical analysis examines the determinants of MFP
in manufacturing, service, and the total economy separately, as the dynamics of productivity may
vary across those sectors.
The analysis of this paper finds that some human capital formation policies—like family
and education policies—promote productivity. While such policies with redistributive effects
are productivity-enhancing, however, there is no strong evidence that direct redistribution itself
(when simply and only measured as poverty or inequality reduction through taxes and transfers)
promotes MFP growth, once other human capital formation policies are controlled for. Thus, the
analysis finds good reason for governments to pursue human capital policies to promote
productivity and ultimately standards of living, but they should do so selectively by choosing
appropriate policy tools.
2
I also consider whether it is actually WPRs as a whole—rather than individual policies—
that affect productivity growth. The results tentatively show that human capital formation
policies seem to have primary pro-productivity effects, and the effects of WPRs disappear when
those policies are controlled for (although WPRs are significantly associated with MFP growth
when entered without the policy variables). That is, at least according to the results, WPRs do
not seem to have additional pro-productivity effects on top of their education and family policies.
But this does not necessarily mean that WPRs do not matter, since those policies are some of the
defining characteristics of WPRs and they are correlated. When examined at the regime level
(when entered without the policy variables), Nordic SMEs that make large public human capital
investments successfully promote productivity in manufacturing and the total economy (also
continental SMEs, to a lesser extent), but LMEs with less public human capital investments also
succeed in promoting productivity in the service sector. Thus, there tentatively seem to be two
paths to high MFP growth, depending on sectors.
In the next section, I explain what productivity is. The third section reviews previous
explanations and findings. In the fourth, I offer a brief explanation for how governments’ human
capital formation policies can promote productivity. In the fifth, I present the empirical analysis
of the determinants of productivity, using data from 17 OECD countries. I then conclude.
MULTIFACTOR AND LABOR PRODUCTIVITY
Productivity is one of the most important factors determining the wealth of national economies
and their standards of living. Wealthy nations are wealthy because they can produce more output
from the same quantity of resources than less wealthy countries—wealthy nations are more
productive. Krugman (1997) writes, ‘Productivity isn’t everything, but in the long run it is
3
almost everything. A country’s ability to improve its standard of living over time depends
almost entirely on its ability to raise its output per worker’ (p. 11).
Despite its importance, productivity has received little analytical attention in political
science (a few exceptions are Iversen and Wren, 1998; Boyer, 2004; Kenworthy, 2004;
Pontusson, 2005). Productivity concerns political scientists, since it crucially affects economic
growth and improvements in living standards, which governments and citizens care about. It is
appropriate to study whether their human capital formation policies actually work as intended,
because governments pursue such policies with a view partly toward promoting productivity and
economic growth. This paper fills the gap in the analysis of the political economy of
productivity.
In contrast to productivity, GDP growth has received wide attention in political science
(just to name a few, Alesina, et al., 1997; Garrett, 1998; Clark, 2003; Pontusson, 2005).
However, productivity and GDP growth is conceptually and empirically different. On the
empirical side, when we compare OECD countries’ ranking orders between labor productivity
and per capita GDP growth rates, many countries move from one side of the OECD average line
to the other. For instance, Japan has higher-than-average labor productivity growth, but lower-
than-average GDP growth. So do Sweden and Germany. In contrast, the Netherlands,
Luxembourg, and Spain have lower-than-average labor productivity growth, but higher-than-
average GDP growth. A country can theoretically create GDP growth by just increasing labor
utilization (numbers of workers or hours worked), without improving productivity.1 Thus,
productivity growth deserves attention, separate from GDP growth. Below, I describe what labor
productivity and MFP are, how they differ, and what affects them.
1 Real GDP growth = labor productivity growth + labor utilization growth.
4

Labor Productivity
GDP per capita is a commonly used indicator of national wealth and standards of living, and its
growth that of improvements therein. Labor productivity growth, in turn, is an important
determinant of per capita GDP growth.2 It explains at least half of per capita GDP growth in
OECD countries in the 1990s (OECD, 2003).
Labor productivity is derived from a standard Cobb-Douglas production function with
constant returns to scale:
LAKY 1 (1)
where Y is output, K is capital input, is labor input, L A is MFP, and is elasticity of output
to labor. Dividing (1) by and rearranging, we get: L
1
L
KA
L
Y (2)
Y/L is labor productivity—the amount of output produced per hour worked, measured by
dividing real GDP (value added) by total hours worked. K/L is the capital-labor ratio—the stock
of physical capital per hour worked.
Taking natural logarithms and differentiating with respect to time yields:
LK
LK
A
A
LY
LY
/
)/()1(
/
)/(
(3)
Defining , , and , we get: Y/Ly Aa K/Lk
k
k
a
a
y
y
)1( (4)
Thus, labor productivity growth is a function of growth in MFP and in the capital-labor ratio.
From (4), we can derive MFP growth as:
2 See footnote 1.
5
k
k
y
y
a
a
)1( (5)
Labor productivity measures how efficiently labor (combined with the stock of physical capital
available per worker and technology) converts inputs into outputs. The capital-labor ratio
contributes to labor productivity, because a higher ratio means that each worker has more
physical capital (e.g., machinery and equipment) to work with, so can produce more output.
Thus, physical capital investments promote labor productivity. Increases in the capital-labor
ratio (capital deepening) account for about 45% of labor productivity growth in the recent decade,
and MFP growth explains the rest (OECD, 2007). Thus, labor productivity growth is an
important determinant of per capita GDP growth, and MFP is that of labor productivity growth
(and of per capita GDP growth).
MFP
MFP is, approximately, a measure of technological progress. It reflects the efficiency with
which all inputs are converted into outputs. In the presence of technological shifts, the same
amount of labor and capital inputs can produce more outputs. It is measured as the part of GDP
that cannot be explained by all other inputs combined, like labor and capital. As such, it is a
residual concept, but despite the definitional fuzziness, it is an indispensable component of
analysis of economic output and growth in economics.
What promotes MFP? Though the following factors are not an exhaustive list and are not
cleanly separable, for purposes of concise description, we can think of 1) improvements in
human capital; 2) technological advances; and 3) efficiency gains from other sources.
First, high skills and knowledge possessed by workers facilitate innovation and the
absorption and diffusion of technological advances. Human capital development, in turn, is
6
promoted by education, vocational training, and the like.3 Second, technological advances
promote MFP. They can come in embodied or disembodied form. Embodied change is
advances in the quality of capital inputs in the forms of new products, machinery, equipment,
and designs. Disembodied change includes innovations in: management, organization, or
production procedures; scientific knowledge; or spillovers from inputs. High human capital also
facilitates these changes, since it is well-trained, creative scientists, engineers, managers, and
workers that generate, adopt, or implement the changes.
Third, efficiency gains can come from other sources, such as circumstances, institutional
environment, or policies that increase competition or the incentives of workers and firms to
generate innovation or adopt and diffuse new technologies. Competition is generally considered
to promote productivity, as it encourages firms and individuals to innovate and adopt new
technologies in order to survive competition. Product market regulations and employment
protection are argued to be unconducive to productivity, since they restrict competition, the exit
and entry of firms in the market, and labor resource reallocation and adjustments to new
technologies and change in market demand.
As we have seen, not all MFP growth is from improvements in human capital. Yet,
human capital is important for both hard and soft technologies to materialize their pro-
productivity potential, because even advanced technologies may not help productivity much,
unless workers and firms who use them figure out innovative or skillful ways to take advantage
of them to raise efficiency. For instance, economists believe that it took the IT revolution years
3 Skills and knowledge also directly improve the quality of labor and contribute to MFP, unless
they are explicitly renumerated and incorporated into a measure of labor inputs in which case
their contribution is captured by labor inputs.
7
to start showing its productivity effects because it took workers and firms time to put it to
productive use (Krugman and Wells, 2005).
PREVIOUS EXPLANATIONS AND FINDINGS ABOUT THE EFFECTS OF POLICY
Political-economic analyses that empirically study the effects of policy on productivity are not
many. But in the available literature, more work has been done on the role of product market
regulations and employment protection legislation (EPL), which researchers consider to
negatively affect productivity by suppressing competition, innovation, adoption of technology,
adjustments to change in market and demand, and resource allocation efficiency. Nicoletti and
Scarpetta (2003) empirically find that product market regulations generally slow down MFP
growth, but that productivity benefits from deregulation in manufacturing are larger when
countries are farther from the technological frontier. By contrast, Amable et al. (2010) argue that
the effect of regulation on innovation can be positive, when industries are close to the
technological frontier (their dependent variable is innovation).4
Meanwhile, OECD (2007) and Bassanini and Venn (2007) show that stringent EPL
reduces productivity growth (cf. Amable et al., 2010). They also find that minimum wages
increase productivity levels either because they give better incentives to invest in training or
because of substitution of high-skilled workers for low-skilled ones; and that parental leave
increases productivity probably because it encourages women’s labor market participation and
enables them to make use of previous investments in firm- or industry-specific skills.
There is also research that suggests an impact of inequality on productivity. Though
inequality itself is not a policy, it becomes relevant because it can affect human capital
4 Amable et al. point out that the relationship between regulation and innovation is not as clear as
suggested by the literature, theoretically and empirically.
8
investments by individuals, and because most governments conduct some level of redistribution
to reduce inequality. Aghion et al. (1999) theoretically argue that in the presence of capital
market imperfections, individuals’ endowments (family wealth) determine their investments in
education, and the unequal distribution of wealth reduces aggregate productivity and output
growth, because the poor’s limited borrowing capacity restricts their investment opportunities in
education and their marginal productivity of investment is relatively high due to decreasing
returns to individual capital investments. If their theoretical conjecture is correct, one might
expect government redistribution (reducing inequality) to be conducive to productivity growth.
Conversely, one can also theoretically conceive negative effects of equality when it is achieved
by government redistribution. Redistribution through income tax may create an incentive
problem and reduce the incentive to invest in human (or physical) capital, lowering growth.5 To
the best of my knowledge, there have not been empirical investigations to test the effect of
redistribution on productivity growth. This paper tests it.
Though it is not about the effects of policy, there is empirical research that examines the
relationship between education (human capital) and productivity or economic growth. Perotti
(1996) argues that income equality boosts secondary school enrollment (his proxy for investment
in education), which in turn leads to higher economic growth. Englander and Gurney (1994) and
de la Fuente and Donenech (2000) show that secondary school enrollment and years of schooling
5 Though not about productivity growth, empirical evidence is mixed about the relationship
between inequality and economic growth. See, for instance, Alesina and Rodrik (1994) and
Perotti (1996) for a negative association; Arjona et al. (2001) for no association; Forbes (2000)
for a positive association.
9

boost productivity.6 These studies find positive impacts of education on productivity or
economic growth, but their independent variables are the stock of human capital measured by
educational attainment or school enrolment and do not allow one to test whether governments’
education policy affects productivity growth (human capital stocks can be a result of other
factors as well as public policy). So I test the role of education policy in the empirical analysis.
In political science, a few studies have hinted at a link between human capital policy and
productivity (Boix, 1998; Pontusson, 2005; Iversen and Stephens, 2008), but it has not been put
to an empirical test.
As we have seen, with the exceptions of some labor and product market policies, the
productivity effects of government policy have not been empirically examined. Such empirical
analysis is what this paper pursues. The next section explains the theoretical basis for public
policy’s effects on productivity through human capital investments.
HUMAN CAPITAL INVESTMENT PERSPECTIVE
Individuals get education and training necessary to maximize their utility. They will get
education and training up to a point where the marginal costs of them equal the marginal benefits
of doing so. The net benefits perceived by individuals determine their decisions about skill
investments.
The perceived net benefits differ across individuals. Individuals differ in their financial
resources and socioeconomic conditions. In a free market without government intervention,
these factors are largely determined by individuals’ family and environment.
6 Research also reports a robust relationship between cognitive skills measured by test scores and
economic growth (OECD, 2010b; Hanushek and Woessmann, 2012).
10

For individuals from low-income families, the costs of education are relatively high (i.e.,
the costs constitute a larger share of their income), because their ability to finance education is
more limited than individuals from wealthy families (limited borrowing capability) (Aghion et
al., 1999).7 The higher costs reduce the net benefits of education for individuals with less wealth.
As a result, they underinvest in education and skills, which in turn leads to less human capital
and lower productivity.8
However, income distribution and education in the real world do not take place in the
total absence of government intervention. Governments engage in redistribution to ease
inequality and poverty. They also provide public education, family support, job training, and
other services to improve the quality of citizens’ lives or to fill the gap left by the market, albeit
to varying degrees. Some governments also use these policies as a strategy to promote human
capital formation and the competitiveness and growth of their economy. Other governments
leave more of these to market provision and private (individual) self-help.
Governments can help promote human capital investments by individuals in two related
ways. One is by reducing the costs of investments and increasing their net benefits by using
policies in education, redistribution, welfare, and the labor market. The other is by creating a
social environment (with policies and institutions) where human capital investments pay and/or
individuals believe it. The second serves to increase the net benefits of education understood by
individuals.
Reducing the Costs of Human Capital Investments and Increasing Net Benefits
7 See also Galor and Zeira (1993). 8 I here ignore countervailing disincentives for high- and middle-income households; i.e., the
negative effects on human capital investments and productivity of disincentives caused by the
relative absence of inequality.
11

Policies of redistribution, public education, welfare, and labor market programs can reduce the
costs of education/training and boost their net benefits, thereby correcting for underinvestment in
skills and promoting human capital formation and productivity.
In education, governments can provide a free or low-cost high-quality public education,
directly lowering the costs of education. In redistribution, they can increase the incomes of low-
income households and reduce the relative costs of human capital investments as a share of
disposable incomes. Various welfare programs providing cash transfers and in-kind services can
directly or indirectly increase the incomes of low-income households and reduce the relative
costs.9
Likewise, ALMP—job training, placement services, employment incentives, work
experience programs, and job creation—reduces the costs of skill formation by directly
providing job training or indirectly supporting employment or job experiences. It can also
enhance job seekers’ prospects of landing a job and thereby increase the benefits of skill
formation perceived by individuals (it helps them believe that they can gain employment or
better jobs and be better off, if they invest in education/training). Passive labor market programs
such as unemployment benefits may also reduce the costs of education/training by providing the
unemployed with time and financial means to invest in skills without worrying about earning a
living, although they may also work against skill investments and productivity if they create
work disincentives.
9 There is some indirect evidence to suggest that redistribution encourages education and better
academic and wage outcomes—the OECD (2010a) reports that individual income tax
progressivity and unemployment benefits are correlated with a smaller influence of parental
socioeconomic background on children’s academic achievement and their wages.
12
In addition to their effect of reducing skill investment costs, education and job training
directly improve the quality of labor and contribute to productivity.
Institutional Incentive Structure, Information, and Beliefs
The incentive structure, information, and beliefs also affect individuals’ skill investments. As for
information and beliefs, individuals make decisions under incomplete information. They can
have inaccurate beliefs about the net benefit of skill investments and consequently may make
sub-optimal decisions. If so, it is important that individuals have accurate information, so that
they do not incorrectly discount or overestimate the benefits of investments. Society or
government can help individuals correctly calculate the net benefit and make appropriate
decisions. If an educational system is of high quality and successfully keeps students, parents,
and citizens informed of the value of education, individuals do not have to be misinformed about
or to underestimate the net benefits of education. A high-quality education or training system
may also be able to better nurture or discover talents in individuals.
The easier it is to receive education/training and to see their benefits, the easier skill
investments are, and the more common they will become in society. Low-cost high-quality
public education, employment-enhancing labor market programs, and family support10 help
create an environment where people feel more positively about skill investments.
Such a system works better if there is a well-functioning constellation of labor market
policy and institutions, where individuals can find suitable or better jobs with additional
education or training. If finding a job were difficult, they would not make investments. In this
10 For instance, widely available low-cost daycare makes it easy for parents to go to school or
receive job training (on top of the productivity benefit that high quality daycare prepares children
for better academic achievements and eventually improves the quality of labor).
13

sense, placement services and job incentives or creation programs should help because they
improve job prospects.
Regimes
In contrast to the view that individual policies affect productivity, one could also posit that it is
actually the whole constellation of WPRs as a regime that affects productivity. The varieties of
capitalism (VoC) and WPR literature and their predecessors may suspect such a regime effect
(e.g., Boix, 1998; Garrett, 1998; Hall and Soskice, 2001). In this view, individual policies (and
institutions) are constitutive parts of a regime that complement each other and that may not
produce outcomes in isolation. In the empirical analysis below, the presence of such regime
effects is also tested to gauge whether it is policies or regimes that affect productivity.
My hypotheses can be summarized as follows:
H1: Widely-available, low-cost, high-quality public education boosts MFP, as it promotes human
capital investments by reducing the costs of education and increasing its net benefits (and as it
improves the quality of labor);
H2: Family support policy boosts MFP, as it encourages human capital investments by reducing
the costs of skill formation and increasing its benefits;
H3: ALMP boosts MFP, as it promotes skill investments by reducing the costs of job training
and increasing the net benefits (and as it improves the quality of labor);
H4: Redistribution boosts MFP, because poverty and income inequality suppress MFP by
increasing the relative costs of skill formation and discouraging human capital investments, and
redistribution eases poverty and inequality;
H5: R&D promotes MFP by facilitating technological advances and innovation;
14

H6: WPRs as a whole (not individual policies) affect MFP. Nordic SMEs with large public
human capital investments should have high MFP growth. Continental SMEs with lower
investments should have lower MFP growth than Nordic ones. LMEs with still less investments
should have yet lower growth.
The empirical analysis below will test the reduced form of the hypotheses. It will test the
relationships between the above policies and MFP growth—not the policies’ effects on the
amount of human capital investments or the stock of human capital.
DATA ANALYSIS
Data
I analyze industry-specific data from 17 OECD countries from 1990 to 2006, to examine the
relationships between government policies and MFP growth.11 I analyze three sectors—
manufacturing, service, and the total economy (‘service’ here is market service and does not
include the public sector). The starting year is set to 1990. The length of the time-series is
limited by the availability of consistent time-series cross-national data on policy variables, as
many of the data only start sometime during the 1980s or 1990s (education, 1992-; family
support, 1980-; ALMP, 1985-; EPL, 1985-).
Dependent Variable
The dependent variable is MFP growth (the first difference of natural logs, ∆lnMFP).12 I use EU
KLEMS Database (November 2009 Release) for MFP data (see Timmer et al. (2007) for a
description of the database).
11 They are Australia, Austria, Belgium, Canada, Denmark, Finland, France, Germany, Ireland,
Italy, Japan, the Netherlands, Portugal, Spain, Sweden, the United Kingdom, and the United
States. Luxembourg, New Zealand, Norway, and Switzerland are excluded for lack of MFP data. 12 11 /)log()log( ttt YYYY
15
The statistical test using EU KLEMS’ MFP represents a strong test for the productivity
effects of human capital investment policies, since the effects of educational attainment
(measured by degrees), gender, and age (job experience) are already removed from the measure
of MFP. Even if human capital investment policies have positive effects on productivity through
their effects on educational attainment or on job training, such effects do not count as the
policies’ positive effects on productivity. The productivity effects of educational attainment and
job experience are attributed to labor inputs (L).
With this measure of MFP, many of actual improvements in the quality of human
capital—e.g., what workers actually learn and what quality of skills and knowledge they achieve
as a result of education and vocational training—are not captured by labor inputs. The
productivity effects of these and other unmeasured improvements are captured by MFP.
The statistical test using the EU KLEMS’s data is a strong test, also because the data do
not include Norway (a high-productivity economy with large public spending on human capital
formation) and New Zealand (a low-productivity economy with small public spending). If the
exclusion of the two countries has any effect on the results, it will be against the pro-productivity
effects of human capital formation policies.
Independent Variables
The estimation of the impact of policies on MFP here uses public spending levels or ratios for
most independent variables. These variables should ideally be measured also by their
substantive properties or quality. But coding such data for quantitative cross-national analysis is
16

not immediately easy and needs to await future projects. The independent variables are the
following.13
Family, Univ, PrimarySec, Preprimary, ALMP, RedisPoverty, and RedisGini are policy
variables that are hypothesized to affect MFP growth. Family is public spending on family
support, such as child allowances, childcare support, income support during parental leave, and
single parent payments (real spending per head (US$ in PPPs) in natural logs). Univ is public
spending on university education as a percentage of GDP. PrimarySec and Preprimary are
similarly public spending on primary-secondary and pre-primary education.
ALMP is public spending on ALMP, such as job training, employment services including
counseling and vocational guidance, youth measures, direct job creation, and employment
incentives and subsidies (real spending per head (US$ in PPPs) in natural logs).
RedisPoverty and RedisGini are measures of redistribution by government. RedisPoverty
measures redistribution in terms of poverty reduction (gross minus net poverty rates divided by
gross rates). RedisGini measures redistribution in terms of reduction in income inequality (gross
minus net Gini coefficients of working-age household income as a percentage of gross Gini
coefficients).
R&D is gross government domestic expenditure on R&D as a percentage of GDP. R&D
spending in general is expected to positively affect MFP by promoting technological advances
and innovation, but there is a question as to whether all spending—public and private—is
equally conducive. A possibility is that public spending may not be as efficient as private
13 I tested the left-party control of government as an independent variable, but subsequently
dropped it, as it was not significant.
17

spending or may crowd out private spending. So I will also test total R&D spending including
private funding.
The original raw data for all these spending/economic independent variables are from
OECD.Stat (http://stats.oecd.org).
Economic Controls
EPL is a measure of strictness of EPL.14 In the literature, EPL is suspected to be unconducive to
productivity, because it can curb competition, innovation, and adoption of new technologies,
retard the reallocation of human and other resources, and/or impair the ability of firms to adjust
to changes in market demand and technology. Restrictive EPL can make hiring and firing
difficult. Innovation and productivity growth are importantly driven by the turnover of firms and
workers, and EPL can restrict the turnover (OECD, 2003). In addition, with secure employment
thanks to EPL, workers can potentially have less incentive to maximize work efforts or to invest
in skill acquisition.
On the other hand, EPL may also serve a productive function, as job security and tenure
enabled by EPL may improve employers’ and employees’ incentives to invest in training and
skill acquisition. So its overall effects may depend on how these effects stack up against each
other. Empirical evidence is mixed (OECD, 2007).
The lagged level of real GDP per capita (US$ PPPs) in natural logs is also entered to
control for a convergence (catch-up) effect (GDPcapita).15
14 The overall summary indicator of the OECD Indicators on Employment Protection (Version 1,
1985-2008). 15 I use the lagged level of per capita GDP, instead of its initial level, since the latter (time-
invariant) creates perfect collinearity with country FEs. For robustness check, I estimated pooled
18

All independent variables are lagged by one year. It is natural to think that lags of
educational spending (e.g., primary/secondary school spending) should be longer. But I
arbitrarily opted not to use longer lags for mainly two reasons. First, we do not know the real lag
structure, and the issue is complicated, considering that the first and last years of
primary/secondary schooling are already 11 years apart. Second, the time-series for educational
spending is 15 years, and longer lags would sacrifice the number of years available for analysis.
Later in the empirical section, I will also examine the effects of WPRs as regimes. LME
is a dummy variable for LMEs (Australia, Canada, Ireland, Japan, the United Kingdom, United
States), Nordic for Nordic SMEs (Denmark, Finland, Sweden), Continental SME for continental
SMEs (Austria, Belgium, France, Germany, the Netherlands), and Others for Italy, Portugal,
Spain.
Estimation
I estimate both pooled OLS and fixed effects (FEs) models. All estimation uses panel-corrected
standard errors (PCSEs) to correct for panel heteroskedasticity and contemporaneous correlation
of errors (Beck and Katz, 1995). The results of random effects (REs) models are not reported
(except when pooled OLS and FEs produce conflicting results), as the Breusch and Pagan
Lagrange multiplier test and Hausman test reject REs.
I estimate both pooled OLS and FEs models to compensate for the potential problems of
each method. The reason is as follows. Pooled OLS leaves open the possibility of omitted
variable biases. The omitted variable problem can be avoided by using FEs models. But FEs
models use only within variance, and do not utilize between variance. When variables have
OLS and REs models with the latter. The results did not change. If anything, the significance of
the human capital investment variables becomes stronger.
19
small within variance and most of their variance is between variance, the results of FEs models
can be unreliable. If one wants to avoid missing any potential effect of between-variance-
dominant variables (which happen often in time-series cross-national analysis), it is advisable to
check the results of pooled OLS (and REs, but REs are rejected by specification tests). In the
models reported below, while the F test rejects the null of no fixed effects, individual country
FEs are not significant except for a couple of countries, which seems to suggest paying attention
also to pooled OLS results.
The estimation reported here does not correct for autocorrelation, as autocorrelation is not
a problem. In LM tests, none of manufacturing equations and the FEs models for service and the
total economy show any significant autocorrelation. The service and total-economy models
without FEs show small autocorrelation (.23 and .15). So I checked the results, using Prais-
Winsten estimation with common AR(1) error process. The results remain the same, except for
ALMP which turns from significant to marginally insignificant. Overall, autocorrelation is not
likely to be a problem, since the dependent variable enters as a first difference of natural logs,
and first differencing usually eliminates unit root concerns and removes most autocorrelation.
I ran many regressions, adding and dropping different variables in different combinations,
to check the stability of coefficients and significance. The reported results are those that are
relatively stable across different specifications, unless otherwise noted.16
16 The reason I enter human capital investment policy spending in levels rather than in change is
what the existing literature suggests. Previous empirical studies have repeatedly failed to find a
positive correlation between growth in human capital and productivity or economic growth (e.g.,
Benahabib and Spiegel, 1994; Islam, 1995, 2003; Mason et al., 2009). The coefficient on human
capital growth in these studies has consistently turned out either negative or insignificant. The
finding of no or negative effect is robust to different specifications and measurements of human
20

The Results
Table 1a presents the results of the baseline models. The results suggest that public policy plays
a significant role in MFP growth in manufacturing, market service, and the total economy (with
variations across policies and sectors).
To begin with, family support spending boosts MFP growth in manufacturing, service,
and the total economy. The coefficient is all positive and mostly significant.17 Since family
support (unlike education and job training) does not directly act on individuals’ skills and
knowledge, the results tentatively suggest that it promotes productivity by making human capital
investments easier for families and their children by, for instance, improving their financial
means. Or family support like paid parental leave and childcare may give parents the incentive
for sustained skill investments and facilitate human capital accumulation by making it easy to
continue their careers while raising children. It could also be possible that high-quality childcare
provided by governments benefits children’s education and careers later and eventually
contributes to productivity.
-- Tables 1a and 1b about here --
University education spending also significantly boosts MFP growth across all sectors.
The pro-productivity result of this spending is the most stable of all variables. The results of
capital (see, e.g., Benahabib and Spiegel, 1994; but for positive findings, see Hanushek and
Woessmann (2012) who use cognitive skills as a proxy for human capital). However, studies
commonly have found a positive and significant correlation between the level of human capital
and productivity growth. These patterns are also replicated in my results. When I enter them in
change, most of the human capital investment variables turn out negative and insignificant. 17 Family in pooled OLS is also significant in the total economy and service, when the lagged
level of per capita GDP is replaced with the initial level of per capita GDP. In REs models, it is
significant in manufacturing and service.
21

primary/secondary school spending are less stable. It is positive and significant in manufacturing
and service in FEs. But in pooled OLS, it is indistinguishable from zero in the two sectors, and
negative and significant in the total economy (this is the only time PrimarySec is significantly
negative). In REs, it is insignificant in all sectors (results not shown).
As the education spending variables are correlated with each other, I also ran the
regressions without Univ (results not shown). PrimarySec becomes positive and significant in all
three sectors in FEs, though in pooled OLS, it is insignificant in all sectors. In REs, it is positive
and significant in manufacturing, and positive but insignificant in service and the total economy.
When entered only with the economic controls, PrimarySec is positive and significant in both
FEs and pooled OLS (with the exception of service in pooled OLS where it is insignificant).
Since these estimates may be biased by omitted variables, we should not attach too much
meaning, but considering all, the productivity effect of primary/secondary spending may still be
positive. But we need more research to find the real answer.
There is little evidence that pre-primary school spending promotes MFP growth (not
reported). It is positive and significant only in service in FEs, and becomes negative and
significant in pooled OLS. With university spending removed, it is indistinguishable from zero
in all models. In models only with the economic controls, it is all positive but significant only in
service in FEs. So there is a possibility that it may promote MFP in service, which would be
consistent with the view that general skills nurtured in early childhood education facilitate
economic performance in the service sector (Pontusson, 2005). But evidence is weak for
preprimary education.
So, there is much evidence that public spending on university boosts MFP growth.
Primary/secondary school spending may also boost it. But there is little evidence that pre-
22

primary spending affects growth (with the possible exception of service). Research has hinted at
beneficial effects of early childhood education in promoting workers’ cognitive skills (hence,
human capital and productivity by implication), income equality, competitiveness in ICT, and
students’ academic achievement at later stages (e.g., Pontusson, 2005; Iversen and Stephens,
2008; OECD, 2010a). But the results here suggest, at least, that the sheer amount of spending on
pre-primary school is not associated with MFP growth. More empirical tests using better
measures capturing the quality and quantity of education are necessary. It may be the type,
quality, or accessibility of pre-primary education that matters. Also, we may need to use longer
lags for pre-primary spending, as much time lapses from pre-primary education to a professional
life (longer lags were difficult to execute in this paper, as this variable’s time-series is short). Or
positive effects of pre-primary spending may be absorbed in those of primary/secondary or
college education. Further research is required.
The results of ALMP do not support our human capital investment hypothesis. ALMP is
negative and significant in service and the total economy. The negative sign is robust to
different specifications (pooled OLS, FEs, and REs). Only when all other human capital
investment variables and R&D are removed, does it become positive and significant only in
pooled OLS in manufacturing and the total economy (not reported).18 The lack of positive
results is noteworthy in light of a literature suggesting beneficial effects of ALMP on various
economic performance measures (e.g., employment, labor market adjustments, adoption of
technologies) (e.g., Pontusson, 2005; OECD, 2006, 2007; Nelson and Stephens, 2012).
ALMP encompasses different programs with varying objectives and effects (public
placement services, job training, activation, and employment incentives), and it may be that not
18 In REs, it is positive and insignificant in all sectors.
23

all programs are designed to improve human capital. So I replaced ALMP with public spending
on job training which should work more directly on productivity if it ever does (Training, Table
1b). But it was insignificant in all sectors.19
To further check the robustness of the negative sign of ALMP and job training, I ran the
regressions with an interaction term between ALMP (and training) and the SME dummy to
explore the possibility that ALMP boosts MFP only in a supportive or coherent institutional
environment, à la the VoC literature (results not shown). The results confirm the lack of
evidence for a positive effect of ALMP. Both the interaction term and the marginal effect of
ALMP conditional on SMEs are negatively signed, and the marginal effect is even significant in
the total economy and manufacturing in pooled OLS and REs (i.e., ALMP has a more negative
effect on MFP in SMEs than LMEs).20 The results are similar for job training.
Why no positive result for ALMP? There are several possibilities. First, Pontusson
(2005, p. 128) writes that during high unemployment periods, ALMP tends to lose its active side
and turn into income support for the unemployed under a different name. In such cases, ALMP
may not be particularly productivity-enhancing. Some high ALMP spenders have high
unemployment and low MFP (Belgium, Denmark). Relatedly, some countries with large ALMP
spending also have large passive unemployment spending and low MFP growth (Belgium in all
sectors and Denmark in manufacturing). It may be that large passive spending cancels out the
productivity benefits of ALMP spending, and these countries weaken the association between
ALMP and MFP growth in the sample. To check for these possibilities, I ran the regressions
excluding Belgium and Denmark. But the results do not change. Of course, the combination of
19 In REs, it is negative and insignificant in all sectors. 20 ALMP remains negative and significant also when using a sub-sample consisting of only
SMEs.
24

large spending on both unemployment and ALMP does not automatically mean low MFP: some
countries have large spending on both, and their MFP growth is high (Finland, Sweden, and to a
lesser extent, the Netherlands).
Second, ALMP here is simple spending levels and does not take account of qualitative
properties of ALMP programs, such as type, quality, accessibility, and effectiveness. Quality
may be more important than quantity. But this is difficult to immediately test in the absence of
such cross-national data, and needs to await the construction of a dataset. Third, ALMP may not
have any pro-productivity effect left over after controlling for other human capital policies.
Last but not least, ALMP may simply not improve MFP growth. Although it is not about
productivity effects, there is micro (individual) level research on the impact of ALMP on
employment. Such research shows that ALMP’s impact varies considerably across individual
programs and is not always clear-cut, and some of them are ineffective (e.g., Cahuc and
Zylberberg, 2006; Card et al., 2010; but see Nelson and Stephens (2012) for macro data showing
that ALMP spending increases employment). The results are also sensitive to different
performance measurements, presumed time horizons for program effects, and the duration of
programs themselves. Considering these mixed employment results and the robustness of
ALMP’s negative coefficient for productivity effects in this paper, little to negative or mixed
effect of ALMP on MFP growth is possible. More complexity may underlie the relationship
between ALMP and productivity. There is also the possibility that if ALMP successfully
promotes employment as it is intended to, increased employment can lead to lower productivity
because it increases the share of low-skill workers among all employed workers (the composition
effect), while this is less likely because the composition effect is controlled for in the EU
KLEMS data. Further research is needed for an answer.
25
We do not get clear results with RedisPoverty. I estimated many specifications, dropping
and adding other policy variables, but the direction of the coefficient flips between FEs and
pooled OLS and across sectors, and it is not always significant. The results in Table 1a suggest
that redistribution (poverty reduction) is associated with lower MFP growth in manufacturing
and the total economy, according to the FEs results, and it is not statistically distinguishable from
zero in the other models.21 In other models with an interaction term mentioned below,
redistribution almost always pushes down MFP growth, when significant. So there is some,
though weak, indication that redistribution may slow down MFP growth, when measured simply
and only by the size of poverty reduction.
When the equations are stripped down to just RedisPoverty and the economic controls
(when the other human capital variables are not controlled for), it becomes positive and
significant in pooled OLS in manufacturing and the total economy (still negative in FEs but
significant only in service, results not shown), although these estimates may be biased by omitted
variables. On the whole, we need caution in interpreting these weak, unstable results and should
not attach more meaning than is warranted. But if we were to take care not to dismiss potentially
significant and useful information, the interpretation would be: redistribution in the broad sense
of the term—including poverty reduction as well as redistributive elements in other human
capital investment policies (partly since they are not controlled for in the stripped down
equations), and when estimation also uses the cross-national variance—may facilitate human
capital investments and productivity growth, but in the presence of family support and education
policies (when we control for them), there is not much additional productivity benefit from
redistribution itself (measured only by poverty reduction), or it may even have negative effects.
21 It is also insignificant in REs models.
26

It may be that, compared to some other better targeted programs such as public education, only a
portion of redistribution (transfers) is spent on human capital investments by households, and as
a result, transfers are less effective in promoting human capital formation and productivity than
other targeted programs. But this is just a speculation based on unstable results, so further
research is needed for clearer evidence and firmer answers.
There is still the possibility that redistribution (poverty reduction) is effective when used
with other human capital investment policies. To explore this possibility, I entered an interaction
term of redistribution with ALMP, job training, public education, and family support,
respectively. In short, there is little evidence of positive interaction effects of redistribution with
any of the other human capital investment policies. The respective interaction term is almost
always negative and insignificant (with a few exceptions of a negative and significant
coefficient). Further, judging from the sign, magnitude, and significance of the coefficients for
the constitutive and interactive terms, it is also unlikely that RedisPoverty has a positive marginal
effect conditional on any of the other human capital investment policies.22
The results of RedisGini (inequality reduction) are weaker than RedisPoverty: it is mostly
not significant, but in manufacturing (only in pooled OLS), it is negatively associated with MFP
growth (not reported). When entered just with the economic controls, it is positively associated
with growth in the total economy (significant only in pooled OLS). Overall, there is no strong
evidence that redistribution (when measured simply and only as poverty or inequality reduction
through taxes and transfers) itself is conducive to MFP growth. But these are only two of the
22 I also checked the interaction of redistribution and SMEs to explore the possibility that
redistribution boosts MFP growth only in a fitting institutional environment. There is little
evidence to show either way. The interaction term flips its sign and is mostly not significant.
27

many ways of operationalizing and measuring redistribution. Other operationalizations and
measures need to be tried before reaching firmer conclusions.
Government R&D spending is positive and significant in manufacturing and the total
economy in pooled OLS, indicating it promotes MFP growth. In FEs, the coefficient is negative,
but statistically not distinguishable from zero, except in the total economy. We cannot say which
results—pooled OLS or FEs—to trust. But with caution, we lean toward the positive results of
pooled OLS. Pooled OLS uses both between and within variance, and government spending,
including R&D, tends to have more between variance than within variance (whereas FEs only
use within variance and cannot tell whether cross-national difference in government spending
leads to different cross-national MFP performance). Further, both REs and between effects
models show that government R&D is positive and significant in manufacturing and the total
economy (results not shown). Per capita R&D spending (public + private) produces similar
results (not shown). It is positive and significant in manufacturing and the total economy in
pooled OLS. In FEs, it is negative but never significant.
As for the economic controls, there is no strong stable evidence for EPL; the sign flips
and significance changes across different models, including many other models I estimated to
check sensitivity. Lagged per capita GDP is negative most of the time, as expected from the
convergence effect, but is significant only one-third of the time in these and other models I have
tried.
Do WPRs Matter in MFP Growth?
Before concluding that policies matter, we need to consider a distinctive possibility that it is
actually the type of WPRs—rather than individual policies—that matters to productivity growth.
Explanations such as VoC, WPRs, and coherent regimes (Garrett, 1998) hint at the effects of
28

such regimes as a whole on economic performance. So I use dummy variables for WPRs to
estimate if some regime has higher MFP growth than others. These regime dummies create
collinearity with country dummies, which makes it impossible to keep all the necessary variables
in an FEs setting. So, only the results of pooled OLS is reported.
-- Table 2 about here --
Models 1-3 in Table 2 show the results of the regressions only with regime dummies and
the economic controls. Thus, they are the results, not controlling for human capital formation
policies. The excluded dummy is LME, so that is the reference regime. In manufacturing, both
Nordic and continental SMEs (that make larger public human capital investments) have
significantly higher MFP growth than LMEs (that have smaller public human capital
investments).
In market service, Continental SME is negative and significant, suggesting their MFP
growth is lower than LMEs’. Nordic is also negative but not significant. But when Nordic and
continental SMEs are combined together as ‘All-SMEs’, their MFP growth is significantly lower
than LMEs (results not reported). In the total economy, Nordic is positive and significant.
Continental SME is also positive and not far from significance (p=.126). When combined, All-
SMEs is positive and significant against LMEs (p=.074).
All in all, Nordic SMEs have higher MFP growth than LMEs in manufacturing and the
total economy. Continental SMEs’ growth in the two sectors may not be as high as Nordic
SMEs’, but probably higher than LMEs’. If trusted, these results for the two sectors are
consistent with the expectations by the human capital investment explanation—Nordic SMEs
with large public human capital investments perform best, and continental SMEs with not as
29
large investments as Nordic SMEs but larger investments than LMEs perform less well than
Nordic SMEs but better than LMEs.
In service, in contrast, LMEs have higher MFP growth than SMEs despite small public
human capital investments, results not exactly consistent either with the human capital
explanation or with other researchers’ view that LMEs’ economic growth depends (rather than
on productivity growth) on labor utilization (Pontusson, 2005) and/or on the abilities of firms to
hire workers at low wages (Iversen and Wren, 1998), in that LMEs, too, achieve high
productivity, depending on sectors.
So is it regimes or policies that matter? It is difficult to estimate their individual
contribution to MFP growth by entering both regime and policy variables in the same equations,
since the latter are some of the defining characteristics of the former and they are correlated. We
should note that the estimates on the regime dummies in the presence of the policy variables in
the same equations do not mean what they meant in their absence in Models 1-3 of Table 2. In
the presence of the policy variables, the coefficients on the regime dummies are estimates of
their effects when all the effects of the policy variables are removed from them (controlled for).
‘Nordic SMEs’ without their family, education, and labor market policies are not extremely
useful from the standpoint of human capital formation policies.
For lack of a better option within the scope of this paper, however, I entered both the
regime dummies and policy variables in the equations to see whose statistical associations
survive (Models 4-6). As it turns out, the policy variables except Family retain their statistical
significance reported in Table 1a, but the regime dummies are no longer significant, except
Others (Italy, Portugal, Spain) and Continental SME in service. Though not reported, Family is
also significant and positive in the total economy and service in FEs models (though three
30
country dummies drop out due to perfect collinearity). Thus, the results of the policy variables
are more stable than those of the regime dummies. Though further research is required on this
issue, we may tentatively say that it is human capital formation policies that seem to have
primary productivity effects, or that a large portion of productivity effects of regimes is through
their human capital formation policies. But again, since the regimes are tautologically those that
have those distinct human capital formation policies (as well as other institutional and policy
factors), anything conclusive needs to await further research.
DISCUSSIONS
This paper started with the question, ‘Does governments’ public policy promote productivity
growth?’ I suggested a study of the role of public policy in productivity growth from the
perspective of human capital investments. The empirical results suggest the following: Family
support policy seems effective in improving MFP growth. So does public education, particularly
university education. Family support and education seem to be a promising avenue to
governments’ efforts to promote productivity. If trusted, the results also suggest that these
policies may enable governments to promote both productivity and equality, since they also tend
to counter inequality (Pontusson, 2005; Iversen and Stephens, 2008).
Contrary to our expectations, ALMP (or job training) is not positively associated with
MFP growth, and we even detect a negative association. Likewise, we fail to find stable
evidence of pro-productivity effects of direct redistribution (when measured only by poverty or
inequality reduction through taxes and transfers). These results contradict the hypotheses
generated from the human capital investment perspective. Some possible reasons for the results
have been mentioned in the previous section, and I will not repeat them here. In future research,
we first need to find out whether these policies are really not productivity-enhancing and, if not,
31
why they are unconducive to productivity. For redistribution, for example, an obvious
possibility is that the operationalization or measurement of redistribution used here (the size of
poverty or inequality reduction through taxes and transfers) is not appropriate for estimating the
productivity effects of redistribution. This narrow measure of redistribution misses many aspects
and components of redistribution in general, so our results do not necessarily mean that
redistribution does not help productivity growth. Other operationalization and measurement
should be tried before drawing conclusions.
Another possibility is that while redistribution has productivity benefits, its efficiency
costs outweigh the benefits. Or the particular way industrial governments have gone about
redistribution may not have been well-designed to aid productivity growth while minimizing
efficiency costs. More research is required to find the answer.
The results of this paper also suggest another area where more research is necessary. The
productivity benefits of family and education policies are detected in all three sectors, including
market service. However, in the regime level analysis where those policies are not controlled for,
LMEs have higher MFP growth in service than SMEs. While there is a possibility that regimes
do not matter once policies are controlled for, we also cannot eliminate the possibility that they
do matter (particularly when divergent human capital formation policies are a definitional
characteristic of the regimes). If they matter, the LMEs result is an indication that governments
may be able to promote MFP growth without large public investments in human capital,
depending on circumstances, at least in the service sector. Economists generally attribute high
productivity growth in the U.S. service sector to high ICT use which, according to them, is
facilitated by high competition (due to low regulations) and resulting low prices and to better
incentive structure. Growth is high particularly in sectors with high ICT use or high-skill
32

workers (OECD, 2008), and market service is one of the most intensive users of new technology
and skilled labor (Inklaar et al., 2008).23 This may suggest that governments potentially have
two ways to achieve high MFP growth (depending on sectors): one is public investments in
human capital, and the other is competition. The market solution to high productivity may be
only specific to the service sector. If so, we need to understand why the market solution
produces high productivity in service.
Different countries generate productivity growth in different circumstances and in
different combinations of policies. The mechanisms of growth generation and the role of
government policies should be uncovered further.
23 R&D spending is also high in LMEs.
33
REFERENCES
Aghion, P., Caroli, E. and Garcia-Penalosa, C. (1999) ‘Inequality and Economic Growth: The
Perspective of the New Growth Theories’, Journal of Economic Literature, 37, 1615-
1660.
Alesina, A. and Rodrik, D. (1994) ‘Distributive Politics and Economic Growth’, Quarterly
Journal of Economics, 109, 465-490.
Alesina, A., Roubini, N. and Cohen, G.D. (1997) Political Cycles and the Macroeconomy,
Cambridge, MIT Press.
Amable, B., Demmou, L. and Ledezma, I. (2010) ‘Product Market Regulation, Innovation, and
Distance to Frontier’, Industrial and Corporate Change, 19, 117-159.
Arjona, R., Ladaique, M. and Pearson, M. (2001) ‘Growth, Inequality and Social Protection’,
OECD Labour Market and Social Policy Occasional Papers, No. 51, OECD.
Bassanini, A. and Venn, D. (2007) ‘Assessing the Impact of Labour Market Policies on
Productivity: A Difference-in-Differences Approach’, OECD Social, Employment and
Migration Working Papers No. 54, OECD.
Beck, N. and Katz, J.N. (1995) ‘What to do (and not to do) with time-series cross-section data’,
American Political Science Review, 89, 634–647.
Benhabib, J. and Spiegel, M.M. (1994) ‘The Role of Human Capital in Economic Development:
Evidence from Aggregate Cross-Country Data’, Journal of Monetary Economics, 34,
143-173.
Boix, C. (1998) Political Parties, Growth and Equality: Conservative and Social Democratic
Economic Strategies in the World Economy, Cambridge, Cambridge University Press.
34

Cahuc, P. and Zylberberg, A. (2006) The Natural Survival of Work: Job Creation and Job
Destruction in a Growing Economy, Cambridge, MIT Press.
Card, D., Kluve, J. and Weber, A. (2010) ‘Active Labour Market Policy Evaluations: A Meta-
Analysis’, Economic Journal, 120, F452-F477.
Clark, W.R. (2003) Capitalism, Not Globalism: Capital Mobility, Central Bank Independence,
and the Political Control of the Economy, Ann Arbor, University of Michigan Press.
de la Fuente, A. and Donenech, R. (2000) ‘Human Capital in Growth Regressions: How Much
Difference Does Data Quality Make?’ OECD Economics Department Working Papers,
No. 262, OECD.
Englander, S. and Gurney, A. (1994) ‘Medium-Term Determinants of OECD Productivity’,
OECD Economic Studies, No. 22.
Forbes, K.J. (2000) ‘A Reassessment of the Relationship between Inequality and Growth’,
American Economic Review, 90, 869-887.
Galor, O. and Zeira, J. (1993) ‘Income Distribution and Macroeconomics’, Review of Economic
Studies, 60, 35-52.
Garrett, G. (1998) Partisan Politics in the Global Economy, Cambridge, Cambridge University
Press.
Hall, P.A. and Soskice, D. (eds) (2001) Varieties of Capitalism: The Institutional Foundations of
Comparative Advantage, Oxford, Oxford University Press.
Hanushek, E.A. and Woessmann, L. (2012) ‘Do better schools lead to more growth? Cognitive
skills, economic outcomes, and causation’, Journal of Economic Growth, 17, 267-321.
Inklaar, R., Timmer, M.P. and van Ark, B. (2008) ‘Market Services Productivity Across Europe
and the US’, Economic Policy, 23, 139-194.
35

Islam, N. (1995) ‘Growth Empirics: A Panel Data Approach’, Quarterly Journal of Economics,
110, 1127-1170.
Islam, N. (2003) ‘Productivity Dynamics in a Large Sample of Countries: A Panel Study’,
Review of Income and Wealth, 49, 247-272.
Iversen, T. and Stephens, J.D. (2008) ‘Partisan Politics, the Welfare State, and Three Worlds of
Human Capital Formation’, Comparative Political Studies, 41, 600-637.
Iversen, T. and Wren, A. (1998) ‘Equality, Employment, and Budgetary Restraint: The Trilemma
of the Service Economy’, World Politics, 50, 507-546.
Kenworthy, L. (2004) Egalitarian Capitalism: Jobs, Incomes, and Growth in Affluent Countries,
New York, Russell Sage Foundation.
Krugman, P. (1997) The Age of Diminished Expectations: U.S. Economic Policy in the 1990s, 3rd
Ed., Cambridge: MIT Press.
Mason, G., O’Leary, B. and Vecchi, M. (2009) ‘Revisiting the Impact of Human Capital on
Productivity: New Cross-Country Evidence at Sector Level’, Middlesex University
Business School, Discussion Paper 130.
Nelson, M. and Stephens, J.D. (2012) ‘Do Social Investment Policies Produce More and Better
Jobs?’. In Morel, N., Palier, B. and Palme, J. (eds) Towards a Social Investment Welfare
State?: Ideas, Policies and Challenges, Bristol, The Policy Press, pp. 205-234.
Nicoletti, G. and Scarpetta, S. (2003) ‘Regulation, Productivity and Growth: OECD Evidence’,
Economic Policy, 18, 9-72.
OECD. (2003) The Sources of Economic Growth in OECD Countries, Paris, OECD.
OECD. (2006) Employment Outlook, Paris, OECD.
OECD. (2007) Employment Outlook, Paris, OECD.
36

37
OECD. (2008) Economic Policy Reforms: Growth for Growth 2008, Paris, OECD.
OECD. (2010a) ‘A Family Affair: Intergenerational Social Mobility across OECD Countries’. In
OECD, Economic Policy Reforms: Going for Growth, Paris, OECD, pp. 181-98.
OECD. (2010b) The High Cost of Low Educational Performance: The Long-Run Economic
Impact of Improving PISA Outcomes, Paris, OECD.
Perotti, R. (1996) ‘Growth, Income Distribution, and Democracy: What the Data Say’, Journal
of Economic Growth, 1, 149-187.
Pontusson, J. (2005) Inequality and Prosperity: Social Europe vs. Liberal America, Ithaca,
Cornell University Press.
Timmer, M., O’Mahony, M. and van Ark, B. (2007) ‘The EU KLEMS Growth and Productivity
Accounts: An Overview’, University of Groningen and University of Birmingham,
http://www.euklems.net.
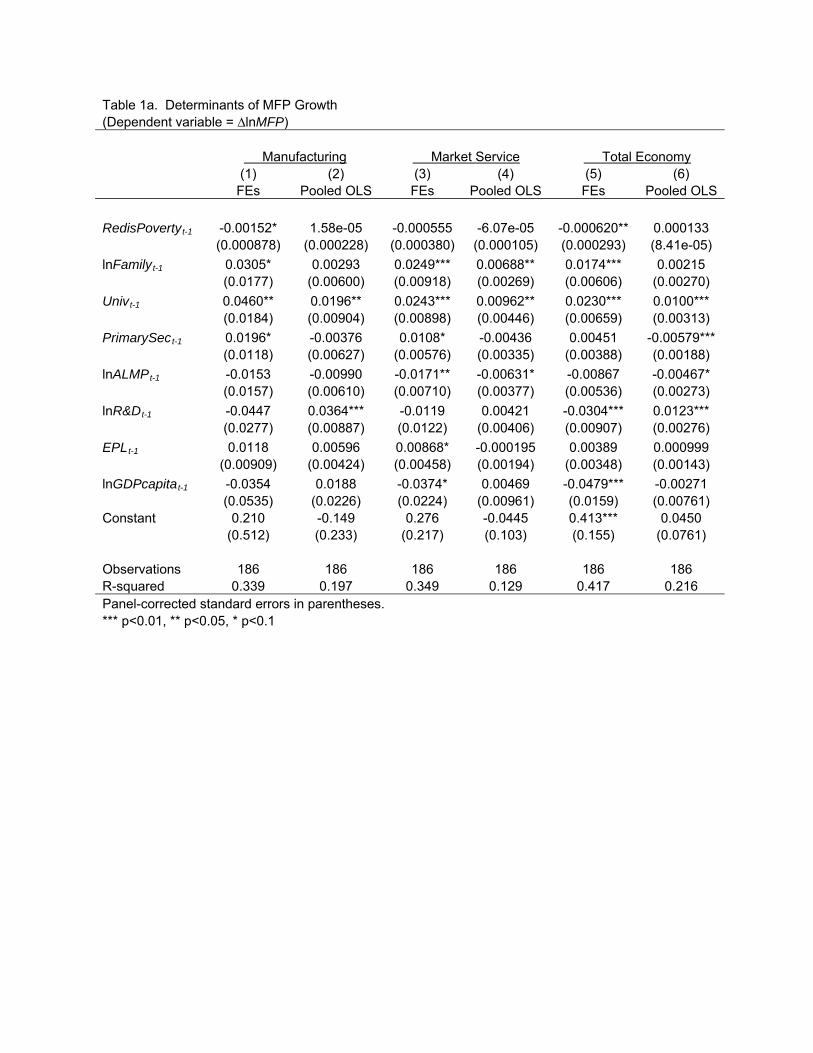
Table 1a. Determinants of MFP Growth (Dependent variable = ∆lnMFP) Manufacturing Market Service Total Economy (1) (2) (3) (4) (5) (6) FEs Pooled OLS FEs Pooled OLS FEs Pooled OLS
RedisPovertyt-1 -0.00152* 1.58e-05 -0.000555 -6.07e-05 -0.000620** 0.000133 (0.000878) (0.000228) (0.000380) (0.000105) (0.000293) (8.41e-05)
lnFamilyt-1 0.0305* 0.00293 0.0249*** 0.00688** 0.0174*** 0.00215 (0.0177) (0.00600) (0.00918) (0.00269) (0.00606) (0.00270)
Univt-1 0.0460** 0.0196** 0.0243*** 0.00962** 0.0230*** 0.0100*** (0.0184) (0.00904) (0.00898) (0.00446) (0.00659) (0.00313)
PrimarySect-1 0.0196* -0.00376 0.0108* -0.00436 0.00451 -0.00579*** (0.0118) (0.00627) (0.00576) (0.00335) (0.00388) (0.00188)
lnALMPt-1 -0.0153 -0.00990 -0.0171** -0.00631* -0.00867 -0.00467* (0.0157) (0.00610) (0.00710) (0.00377) (0.00536) (0.00273)
lnR&Dt-1 -0.0447 0.0364*** -0.0119 0.00421 -0.0304*** 0.0123*** (0.0277) (0.00887) (0.0122) (0.00406) (0.00907) (0.00276)
EPLt-1 0.0118 0.00596 0.00868* -0.000195 0.00389 0.000999 (0.00909) (0.00424) (0.00458) (0.00194) (0.00348) (0.00143)
lnGDPcapitat-1 -0.0354 0.0188 -0.0374* 0.00469 -0.0479*** -0.00271 (0.0535) (0.0226) (0.0224) (0.00961) (0.0159) (0.00761) Constant 0.210 -0.149 0.276 -0.0445 0.413*** 0.0450 (0.512) (0.233) (0.217) (0.103) (0.155) (0.0761) Observations 186 186 186 186 186 186 R-squared 0.339 0.197 0.349 0.129 0.417 0.216 Panel-corrected standard errors in parentheses. *** p<0.01, ** p<0.05, * p<0.1
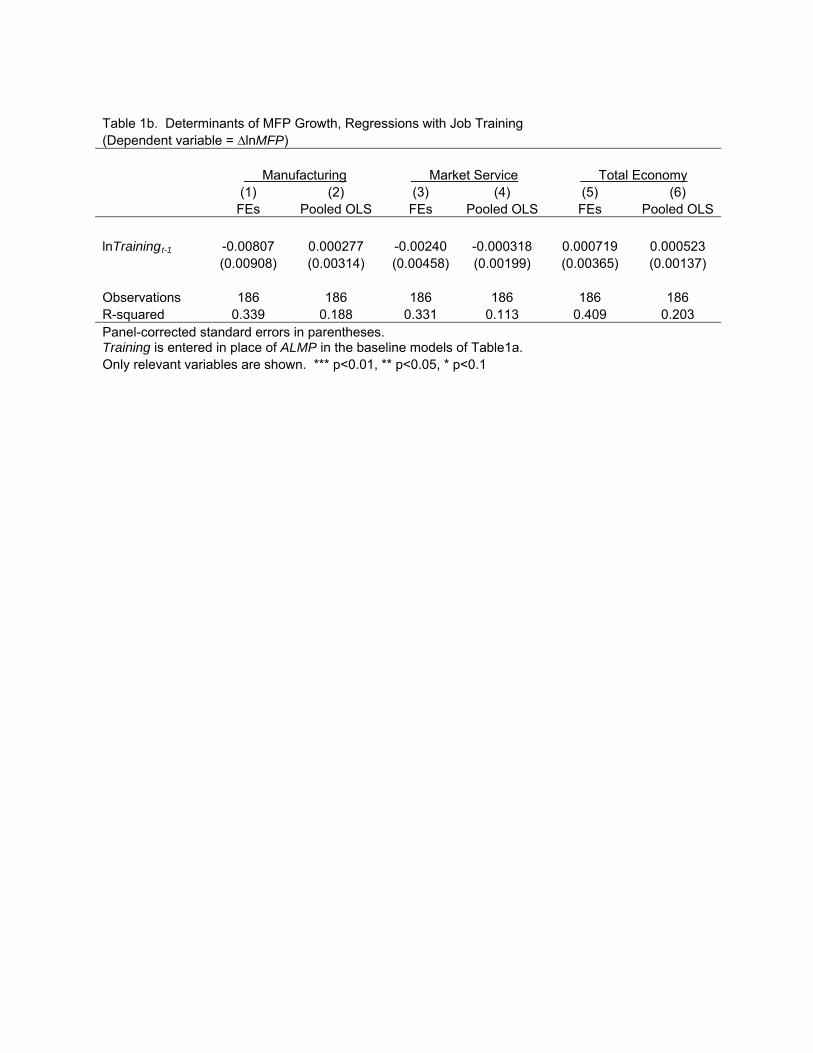
Table 1b. Determinants of MFP Growth, Regressions with Job Training (Dependent variable = ∆lnMFP) Manufacturing Market Service Total Economy (1) (2) (3) (4) (5) (6) FEs Pooled OLS FEs Pooled OLS FEs Pooled OLS
lnTrainingt-1 -0.00807 0.000277 -0.00240 -0.000318 0.000719 0.000523 (0.00908) (0.00314) (0.00458) (0.00199) (0.00365) (0.00137) Observations 186 186 186 186 186 186 R-squared 0.339 0.188 0.331 0.113 0.409 0.203 Panel-corrected standard errors in parentheses. Training is entered in place of ALMP in the baseline models of Table1a. Only relevant variables are shown. *** p<0.01, ** p<0.05, * p<0.1
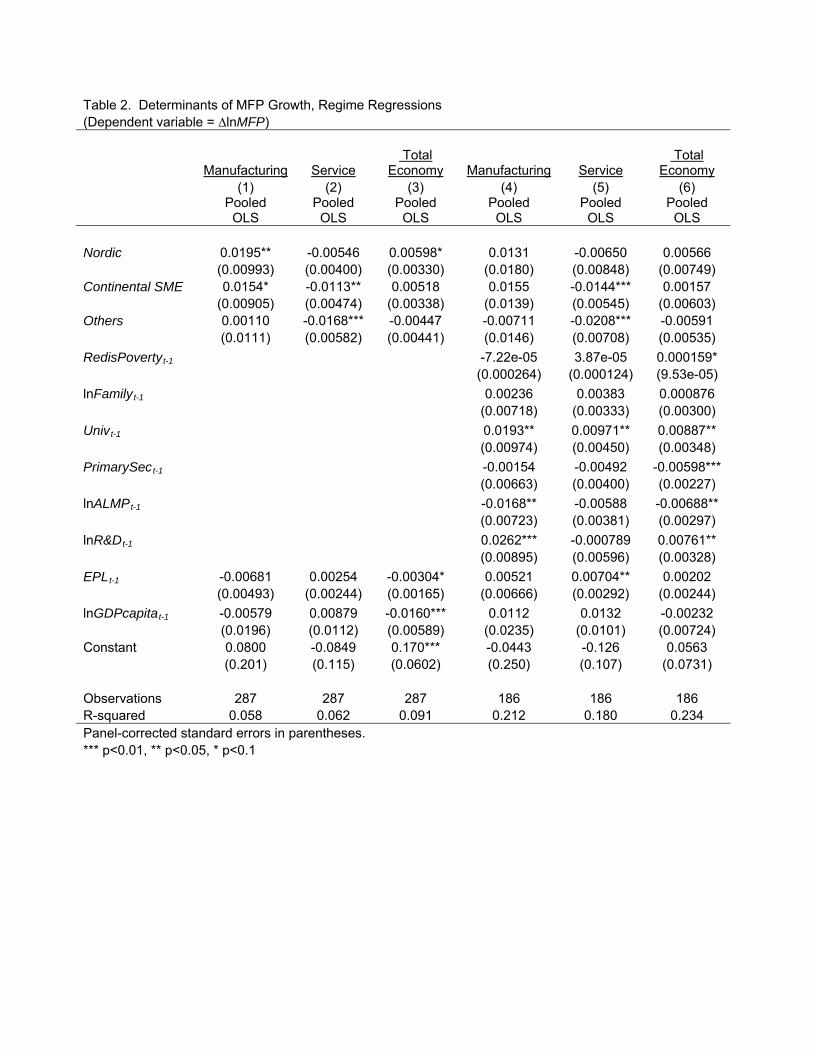
Table 2. Determinants of MFP Growth, Regime Regressions (Dependent variable = ∆lnMFP)
Manufacturing Service Total
Economy Manufacturing Service Total
Economy (1) (2) (3) (4) (5) (6)
Pooled
OLS Pooled
OLS Pooled
OLS Pooled
OLS Pooled
OLS Pooled
OLS Nordic 0.0195** -0.00546 0.00598* 0.0131 -0.00650 0.00566 (0.00993) (0.00400) (0.00330) (0.0180) (0.00848) (0.00749) Continental SME 0.0154* -0.0113** 0.00518 0.0155 -0.0144*** 0.00157 (0.00905) (0.00474) (0.00338) (0.0139) (0.00545) (0.00603) Others 0.00110 -0.0168*** -0.00447 -0.00711 -0.0208*** -0.00591 (0.0111) (0.00582) (0.00441) (0.0146) (0.00708) (0.00535)
RedisPovertyt-1 -7.22e-05 3.87e-05 0.000159* (0.000264) (0.000124) (9.53e-05)
lnFamilyt-1 0.00236 0.00383 0.000876 (0.00718) (0.00333) (0.00300)
Univt-1 0.0193** 0.00971** 0.00887** (0.00974) (0.00450) (0.00348)
PrimarySect-1 -0.00154 -0.00492 -0.00598*** (0.00663) (0.00400) (0.00227)
lnALMPt-1 -0.0168** -0.00588 -0.00688** (0.00723) (0.00381) (0.00297)
lnR&Dt-1 0.0262*** -0.000789 0.00761** (0.00895) (0.00596) (0.00328)
EPLt-1 -0.00681 0.00254 -0.00304* 0.00521 0.00704** 0.00202 (0.00493) (0.00244) (0.00165) (0.00666) (0.00292) (0.00244)
lnGDPcapitat-1 -0.00579 0.00879 -0.0160*** 0.0112 0.0132 -0.00232 (0.0196) (0.0112) (0.00589) (0.0235) (0.0101) (0.00724) Constant 0.0800 -0.0849 0.170*** -0.0443 -0.126 0.0563 (0.201) (0.115) (0.0602) (0.250) (0.107) (0.0731) Observations 287 287 287 186 186 186 R-squared 0.058 0.062 0.091 0.212 0.180 0.234 Panel-corrected standard errors in parentheses. *** p<0.01, ** p<0.05, * p<0.1
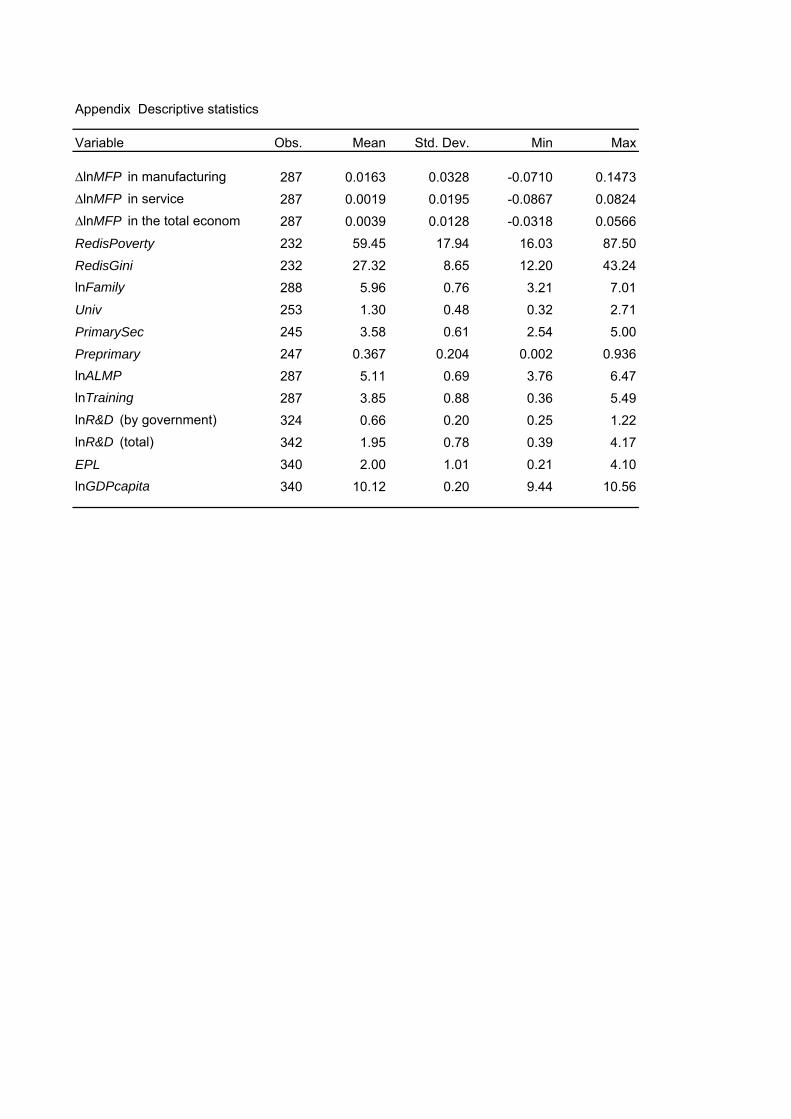
Appendix Descriptive statistics
Variable Obs. Mean Std. Dev. Min Max
∆lnMFP in manufacturing 287 0.0163 0.0328 -0.0710 0.1473
∆lnMFP in service 287 0.0019 0.0195 -0.0867 0.0824
∆lnMFP in the total econom 287 0.0039 0.0128 -0.0318 0.0566
RedisPoverty 232 59.45 17.94 16.03 87.50
RedisGini 232 27.32 8.65 12.20 43.24
lnFamily 288 5.96 0.76 3.21 7.01
Univ 253 1.30 0.48 0.32 2.71
PrimarySec 245 3.58 0.61 2.54 5.00
Preprimary 247 0.367 0.204 0.002 0.936
lnALMP 287 5.11 0.69 3.76 6.47
lnTraining 287 3.85 0.88 0.36 5.49
lnR&D (by government) 324 0.66 0.20 0.25 1.22
lnR&D (total) 342 1.95 0.78 0.39 4.17
EPL 340 2.00 1.01 0.21 4.10
lnGDPcapita 340 10.12 0.20 9.44 10.56