productivity considerations for online help systems
TRANSCRIPT

PRODUCTIVITY CONSIDERATIONS FOR ONLINE
HELP SYSTEMS
DISSERTATION
Presented to the Graduate Council of the
University of North Texas in Partial
Fulfillment of the Requirements
For the Degree of
DOCTOR OF PHILOSOPHY
by
Charles R. Shultz, Jr., B.B.A., M.B.A.
Denton, Texas
May, 1994

Shultz, Jr., Charles R., Productivity Considerations
for Online Help Systems. Doctor of Philosophy (Business
Computer Information Systems), May, 1994, 186 pp., 7 tables,
7 figures, 10 appendixes, bibliography, 74 titles.
The purpose of this study was to determine if task
type, task complexity, and search mechanism would have a
significant affect on task performance. The problem
motivating this study is the potential for systems online
help designers to construct systems that can improve the
performance of computer users when they need help. Task
type (mathematical and verbal) and task complexity (high
complexity, low complexity) and search mechanism (keyword,
semantic) were the independent variables. The dependent
variable was task performance. The surrogate was task
accomplishment measured by the score the subject received
for the task set assigned.
The researcher conducted a protocol analysis to
determine the words and phrases users expect when searching
for help information. From the results of the protocol
analysis, the researcher constructed a semantic online help

system. This research compared the traditional keyword
based online help with the semantic system by assigning
tasks to users where the users had to use the online help
systems to accomplish the tasks. The researcher graded the
users on performance. This study compared the two
performance levels to identify any significant differences.
The results of the research support the hypothesis that
the type of online help search mechanism made a significant
difference in the performance of the subjects. Task
complexity was not a significant factor in affecting
performance. Task type was also a significant variable in
performance.
Researchers will benefit by using the framework
developed in this experiment. End users will benefit from
the higher level of productivity provided through the use of
the newer online help systems.

PRODUCTIVITY CONSIDERATIONS FOR ONLINE
HELP SYSTEMS
DISSERTATION
Presented to the Graduate Council of the
University of North Texas in Partial
Fulfillment of the Requirements
For the Degree of
DOCTOR OF PHILOSOPHY
by
Charles R. Shultz, Jr., B.B.A., M.B.A.
Denton, Texas
May, 1994

Copyright
Charles R. Shultz, Jr.
1993
A V
(fj
1 i
jM' (j

ACKNOWLEDGEMENTS
I would like to thank Dr. Vanecek for his patience and
understanding during this dissertation. I would also like
to thank my parents because without their help, I would have
been unable to finish.

TABLE OF CONTENTS
LIST OF TABLES ix
LIST OF FIGURES x
Chapter
I. THE INADEQUACY OF ONLINE HELP 1
Statement of the Problem 4 Purpose of the Study 6 Significance of the Study 9 General Help Considerations 11
Keyword Help System 11 Semantic Help System 12 Context Sensitive Help 13
Methodology Overview 13 Data Collection Overview 16 Analysis of the Data 18 Limitations of the Study 18 Summary 19
II. BACKGROUND 20
Introduction 20 Help Systems Literature 22
Help Systems Research Literature 22 Designing Help Systems Literature . . . . 30
Related Literature 32 Task Type Literature 32 Task Complexity Literature 35 Adaptive User Interface 40
Conclusions 41
III. THEORETICAL AND OPERATIONAL DEVELOPMENT . . . . 43
Research Model Overview 43 Independent Variables 47
Search Mechanism 47

Task Complexity 48
Task Type 50
Dependent Variable 50
Demographic Variables 53
Hypotheses 53
IV. RESEARCH DESIGN 59
Experimental Design 59
Research Design . . 61
Operational Model 61
Operationalization of the Variables 63
Measurement of the Variables - . 66
Demographic Data 67
Subjects and Population 68
Pre-experimental Procedures 69
Protocol Analysis 70
Semantic Help Design 73
Expert Panel 75
Task Set Design 76
Experimental Data Collection 78
Key Assumptions 81
V. DATA COLLECTION 83
Pre-Experimental Preparation 84
Pre-protocol Investigation 85
Protocol Task Sets 86
Protocol Data 86
Expert Panel Feedback On Proposed
Pilot I Data and Semantic
Help System 88
Pilot I Test Data 90
Expert Panel Feedback On Proposed
Pilot II Data and Task Sets 90
Pilot II Test Data 91
Experimental Test Data 92
VI. DATA ANALYSIS 93
Pre-experimental Data Analysis 94
Analyze and Develop Protocol Task Sets . . 94 Analysis of the Protocol Data 95

Expert Panel Feedback On Proposed Pilot I Data and Semantic System . . . 98
Analysis of Pilot I Data 98 Analysis of Feedback On Proposed
Pilot II Task Sets 99 Analysis of Pilot II Data 100
Conclusions From The Pilot Studies 100 Experimental Data Analysis 101
General Demographics 102 Linear Regression Model 105 Individual Cell Data 108 Interaction Effects 108 Results by Hypotheses 109
VII. CONCLUSIONS Ill
Conclusions For Each Hypothesis 112 Research Conclusions and Recommendations . . 120 Limitations of the Research 122 Direction for Future Research 123 Summary 124
APPENDIXES
A. List of Definitions 126
B. An Informed Consent Document 130
C. Pre-experimental Protocol Task List 132
D. Expert Panel Rankings 140
E. Semantic Help System Interfaces 146
F. Standard Help System Interfaces 149
G. Pilot 1 Pre-experimental Task List 152
H. Example Help Scripts for Semantic System . . . . 163
I. Pilot II and Experimental Data Collection Task List 166

J. Questionnaire For Experimental Data Collection . 177
BIBLIOGRAPHY 179

LIST OF TABLES
Table page
1. Relevant Online Help Research 21
2. Pilot II Data 101
3. Demographic Data 104
4. Experimental Cell Sizes 105
5. Results from the Linear Analysis 107
6. Cell Statistics 108
7. Results For Each Hypothesis 110

LIST OF FIGURES
Figure page
1. Ives, Hamilton, and Davis Research Model . . . . 44
2. Research Model Used For This Study 45
3. Help Systems Variables List 46
4. Relationships of the Variables 62
5. Operational Model 63
6. Experimental Design 79
7. Task Complexity Gradient 121

Research Model Overview 43 Independent Variables 47
Search Mechanism 47 Task Complexity 48 Task Type 50
Dependent Variable 50 Demographic Variables 53 Hypotheses 53
IV. RESEARCH DESIGN 59
Experimental Design 59 Research Design 61 Operational Model 61 Operationalization of the Variables . . . . 63 Measurement of the Variables 66 Demographic Data 67 Subjects and Population 68 Pre-experimental Procedures 69
Protocol Analysis 70 Semantic Help Design 73 Expert Panel 75 Task Set Design 76
Experimental Data Collection 78 Key Assumptions 81
V. DATA COLLECTION 83
Pre-Experimental Preparation 84 Pre-protocol Investigation 85 Protocol Task Sets 86 Protocol Data 86 Expert Panel Feedback On Proposed
Pilot I Data and Semantic Help System 88
Pilot I Test Data 90 Expert Panel Feedback On Proposed
Pilot II Data and Task Sets . . . . , 90 Pilot II Test Data 91
Experimental Test Data 92
xv

VI. DATA ANALYSIS 93
Pre-experimental Data Analysis 94 Analyze and Develop Protocol Task Sets . . 94 Analysis of the Protocol Data 95 Expert Panel Feedback On Proposed
Pilot I Data and Semantic System . . . 98 Analysis of Pilot I Data 98 Analysis of Feedback On Proposed
Pilot II Task Sets 99 Analysis of Pilot II Data 100
Conclusions From The Pilot Studies 100 Experimental Data Analysis 101
General Demographics 102 Linear Regression Model 105 Individual Cell Data 108 Interaction Effects . . 108 Results by Hypotheses 109
VII. CONCLUSIONS Ill
Conclusions For Each Hypothesis 112 Research Conclusions and Recommendations . . 120 Limitations of the Research 122 Direction for Future Research 123 Summary 124
APPENDIXES
A. List of Definitions 126
B. An Informed Consent Document 130
C. Pre-experimental Protocol Task List 132
D. Expert Panel Rankings 140
E. Semantic Help System Interfaces 146
F. Standard Help System Interfaces 149
v

G. Pilot 1 Pre-experimental Task List 152
H. Example Help Scripts for Semantic System . . . . 163
I. Pilot II and Experimental Data Collection
Task List 166
J. Questionnaire For Experimental Data Collection . 177
BIBLIOGRAPHY 179
VI

LIST OF TABLES
Table page
1. Relevant Online Help Research 21
2. Pilot II Data 101
3. Demographic Data 104
4. Experimental Cell Sizes 105
5. Results from the Linear Analysis 107
6. Cell Statistics 108
7. Results For Each Hypothesis 110
vxi

LIST OF FIGURES
Figure page
1. Ives, Hamilton, and Davis Research Model . . . . 44
2. Research Model Used For This Study 45
3. Help Systems Variables List 46
4. Relationships of the Variables 62
5. Operational Model 63
6. Experimental Design 79
7. Task Complexity Gradient 121
vxii

CHAPTER I
THE INADEQUACY OF ONLINE HELP
Advanced development tools related to online help
systems have not been available until recent times. Most of
the traditional online help systems have used a keyword
based method where the user accepts a word from a list of
help words and subjects. After a keyword is chosen, the
help system provides the user with a more specific word list
on the topic in question. Finally, the keyword based online
help system provides a script that contains the relevant
help information.
Recently many tools have become available that allow
online help systems builders to construct many different
search mechanisms of help information. In Windows® from
Microsoft, a mouse click presents the user with several
possible choices for obtaining information. One method
provides a list of the contents in the help system. A
second method lets the user see information about the
keyboard. A third method presents the prompt "How do I" to

the user. Once the user clicks on the "How do I" choice
with a mouse, a list of activities is presented. A fourth
method presents a list of the letters in the alphabet. If
the user knows the word of the function in question, the
user can click on a letter and jump to a list of words that
start with the letter. From there, the user scrolls down
the keyword list until the user finds the word he/she seeks.
After clicking on that word, he/she is provided the
requested information by the help system. A fifth method of
using the online help system is to click on an icon about
using the help system. After the user clicks on the help
icon, information is presented to the user on how to use the
help system. A sixth method of obtaining help is by using
the "What is" icon. If the user clicks on the icon, the
cursor becomes a question mark. At that point, if
the user clicks on anything, the help system will tell the
user all about the item identified.
Another example of recent help systems improvements
includes the integration of online help systems in a
windowing environment as described by R. Duncan (1993) in
the article "Integrating Windows Help: A Strategic Review."

The author discusses the implementation methodologies that
can be used in building a help system in Windows®. It is
possible to design a context sensitive help system by
implementing a "MAP". The map contains hooks that can be
used to enter the help system at different points, thereby
producing the context-sensitive information.
Another example of one of the newer help type
interfaces is the "wizard". Once the user calls up the
wizard, the computer presents a step-by-step instruction
list of how to accomplish a given task. The user learns how
to do a given task by stepping through it with the wizard.
Quattro® Pro from Borland has the new wizard feature.
Borland presented many of its new products and their
features during a seminar called "The Borland Productivity
Series" in Chicago on September 13, 1993.
Meyer (1991) points out that there is an important
trend emerging. The trend of the use of end-user
information retrieval systems is on the increase. The end-
user information retrieval phenomenon is on the rise because
it is easier and less expensive for companies to provide
documentation on CD-ROM's than to publish paper-based

manuals for end-users. One method the user may use to learn
how to employ the searching facilities to obtain information
from the CD-ROM is through the online help system. Since
the help system is an important tool in guiding end-users
toward needed information, end-users will need correctly
designed searching mechanisms to the help information.
Statement of the Problem
There are several problems related to online help
systems research. The first problem is a lack of a
comprehensive model relative to online help systems research
and productivity. The second is a lack of linkage between
productivity and the help function in general. The third is
a lack of understanding of how beginners think and relate
when searching for help type information.
An issue that has been a concern of many researchers in
the past is that online help does not adequately meet the
informational needs of the user. When the lack of
understanding occurs, the user may be unable to obtain the
needed information, or the user may not understand the
information presented. Frustration and non-task

accomplishment are the usual outcomes. Frustration and non-
task accomplishment have been identified in earlier studies.
For example, according to Rockart and Flannery (1983), help
methods, as described by Maguire (1982), do not adequately
meet the needs of beginning, non-programming end user
computer users. Cohill and Williges (1985), in another
earlier study, suggest that many help facilities are
difficult to use and often contain too much jargon. Today's
help systems are still difficult to use and still contain
too much jargon. As a result, help information may confuse
rather than help users. Help systems should not hinder
users. Also, Carroll and Carrithers (1984) concluded that
new users of complex systems are often frustrated and
confused by errors they make in the early stages of
learning. These new learners are unable to obtain
information from the system to accomplish a given task, and
the failure in task accomplishment causes frustration on the
part of the user. The difficulties of learning to use a
computer is an ongoing historic problem. According to Mack,
Lewis and Carroll (1983), persons learning to use new
computer systems often have great difficulty because they do

not understand how to use the help system effectively. In
their efforts to correct these difficulties, new users often
take side tracks and get into error tangles. This is a
state in which the user has been given an error code and is
provided with information, but is unable to decipher it and
can not make any progress. As a result, recovery, or even
diagnosis, is difficult or impossible. Such learning
difficulties can be costly if tutorial help is required from
trained personnel (Seybold 1981). The same condition is
still true today.
Recent writers have reported that online help systems
are still ineffective. According to Slack (1991), recent
research has shown that in many cases online help is not
effective. The user is unable to get the information that
is needed for task accomplishment. The consequence of the
lack of information and subsequent inability to accomplish a
task is the loss of productivity for computer users.
Purpose of the Study
The study had several purposes. The main purpose of
this study was to determine if different search techniques

used by non-programming end users, as described by Rockart
and Flannery (1983), affect their productivity. This
investigation is a significant step in the contribution to
the advancement of research on online help systems. Also,
if it is true that search mechanism to help information
significantly impacts on task performance, then it is
possible to design help systems that help people perform
tasks faster. The result would be that help system design
could be changed to maximize end user productivity.
Another purpose of the study was to determine if task
type had a significant impact on task performance. Not all
tasks have the same set of characteristics'. The reason this
purpose is included in this research is to extend the
research concerning online help systems on this topic. Most
of the research to date has categorized all tasks into one
generic type. If task type is a significant variable, this
finding would be important.
Another purpose of this research is to determine if
task complexity has a significant impact on task
performance. Task complexity has been used in other
research areas as an important variable. On line help

systems research has not included this type of variable in
the past.
Many activities had to be undertaken so that the
purposes of this study could be accomplished. One of the
activities was to learn what information is needed for the
completion of a given task by a novice user. If a novice
user does not have that information and subsequently obtains
the information from the computer, then the novice user can
accomplish the given task. The help system should be able
to provide the needed information. A second activity was to
identify the words and phrases the novice user might employ
or expect to see in searching for information. If the help
system contains the words and phrases familiar to the novice
user, finding the needed information will be faster. To
accomplish the first purposes of this research a protocol
analysis was conducted. The protocol analysis research
methodology was used to identify what the user needs to know
to accomplish a given task. The information concerning task
accomplishment is included in the help system. Protocol
analysis was also used to determine what words and phrases
the novice might use to search for the information. The

words and phrases identified during the protocol analysis
were incorporated into the semantic help system. All the
information gathered was used to construct a semantic online
help system. By comparing the outcomes from using the
custom online help system with the traditional keyword based
system, a performance analysis was done.
To accomplish the second purpose of determining if task
type had a significant impact, tasks given the subjects were
classified into two types. The first type was mathematical.
The second type was verbal.
Significance of the Study
The primary benefit of this research is the extension
of human-computer interface theory in the context of online
help systems. An important aspect of this study is the
identification of basic informational pieces which are
needed by users for the completion of their computer based
tasks. The identification of specific information necessary
for task completion makes it possible to construct specific
help systems which provide the needed pieces of information.
Information identification research is basic to the

10
construction of online help systems. Both what users need
to know and how to search for information are addressed. By
using the information on task accomplishment and words
associated with the task, one can construct online help
systems which allow the user to search and retrieve
information more efficiently and effectively.
As technology and time have progressed, computer human
interfaces, specifically online help systems, have become
adaptable to the user. The adaptation process could be
accomplished in two ways: (1) users could change the
interface to suit their likes and dislikes, or (2) the
system could change to address the usage patterns of the
users. The lack of information about the process is why
basic research is still needed.
In addition, the results of this research will help
future information system designers construct efficient help
facilities as part of the larger scope of the user
interface. Future researchers can also use the theoretical
framework to guide their research in online help systems.

11
This study uses terminology having specific and
important meaning relative to understanding the study. A
terminology and concept list is located in Appendix A.
General Help Considerations
Help information can be obtained by many different
methods. This research focuses on computer generated help
after the user starts looking for help information.
Specifically, help is sought when subjects have difficulty
completing tasks and need additional information. Subjects
then generate a request, usually by command, whether by a
function key or a mouse click, to obtain that needed
information.
This research is a study of search mechanisms once a
help system is invoked. Whether the help system is called
by a function key, a mouse click or by some other mechanism
is not addressed here.
Keyword Help System
Many help systems use a keyword search mechanism. An
example is shown in Appendix F. When invoking the help
system, it is called up by clicking the mouse or hitting a

12
function key and a set of words is displayed. The user then
chooses a word or phrase in order to display information or
a more detailed set of key words and phrases from which to
choose. The use of the function key to enter the help
system has no relationship to the search mechanism once the
help system is functioning. The traditional spreadsheet and
word processing help systems are constructed using the
function key access approach.
Windowing type interfaces have become a de facto
standard in the micro-computer world. If the beginner is
using a program that covers the entire screen, such as a DOS
type program, or if the program is running in a window,
these two different scenarios have no impact on the help
system search mechanism. In either environment, multiple
screens may be implemented. The help system search
mechanism once the help system is activated was
investigated.
Semantic Help System
The semantic help system is similar to the keyword help
system except that the semantic help system allows a user to

13
build a sentence that should have more meaning to the user
than one or more abstract words. An example is shown in
Appendix E. The semantic help system and the keyword help
system may both be invoked by a function key or a mouse
click or another activity but the difference between the two
systems occurs when both are called into action. With the
semantic system, users can choose phrases from a list until
a complete sentence is constructed. The semantic help
system is more grammatical and "English-like" in nature.
Context Sensitive Help
Another type of help system characteristic is context
sensitivity. With a context sensitive type help system, the
user is attempting to do an activity but can not complete
it. If the help system is invoked in the middle of the
procedure, the help system is "intelligent enough" to
retrieve information about the task being attempted.
Methodology Overview
A research model was constructed by including
significant variables from past research. The operational

14
model was developed from the research model and used to
construct the testable hypotheses.
The objective of the research was to study what the
impact task type, task complexity, and help search
mechanisms have on task performance. The following
activities were conducted to help accomplish this research
objective.
The first research activity was to identify computer
based mathematically and verbally oriented tasks and the
information needed to complete those tasks. Protocol
analysis was conducted to identify the tasks and the
information needed by a person to complete the tasks.
Protocol analysis was the most appropriate research tool
available to accomplish the identification of information
relevant to the task.
Another research activity was to identify the words and
phrases beginners may expect to see when trying to find
needed information. Again, protocol analysis was used to
identify those words and phrases.
The first research objective was to determine if a
significant difference exists between levels of task

15
performance when using a keyword driven help system or a
semantic help system for a given task type and level of task
complexity. A semantic online help system was constructed
from the information obtained in the second phase of the
protocol analysis. An expert panel of judges was used to
validate the words and phrases, the information needed for
task accomplishment and design of the semantic online help
system. The semantic help system was tested in pilot
studies. The results from the pilot test dictated a change
in the tasks developed initially. The results were taken
back to the expert panel and re-verified. A new task set
was designed and the second pilot study was done. The
results from the second pilot suggested the research design
was acceptable. The process of collecting the experimental
data was conducted.
The keyword online help system was used in the
comparison against the semantic online help system which was
already implemented in commercial products used as test
instruments. The study used an off-the-shelf word processor
and a spreadsheet package as implementational tools. The
test subjects used either the keyword help features supplied

16
by the commercial package or the constructed semantic help
system. The beginners were told how to invoke the help
system before the main data collection phase. If the
beginners were in the keyword help group they were
instructed to access the help function in one way. If the
beginners were in the semantic based help system, they were
told to access the help system using a different set of key
strokes.
In addition to access mechanism grouping, subjects were
also assigned either to verbal or to mathematical task types
of varying complexity. A single measurement instrument was
used to measure the level of productivity of all groups.
Data Collection Overview
The data were collected in two stages. The first stage
consisted of the protocol analysis, the pilot studies, and
expert panel reviews. Following the completion of these
preliminary research design activities, the second stage
which consisted of the controlled experiment was done.
During the first stage, a subject was asked to sit in
front of a computer and accomplish a list of tasks. During

17
that time, he/she was questioned on a variety of items. All
of the protocol data was recorded and compiled for later
analysis. The later analysis revealed patterns in
information that related to the task the user was attempting
to accomplish. A custom semantic online help system was
constructed using the results from the protocol analysis.
This process involved analyzing the words and phrases that
were used by the beginners. These words and phrases were
included in the semantic system.
Once the semantic online help system was finalized and
supported by validation procedures, the experiment was
conducted. The experimental design consisted of eight
different groups (two task types, two levels of task
complexity, and two different search mechanisms).
Participation in each group was randomly assigned. Each
group had a different set of treatments. Since three
different variables were being tested, eight different
combinations were possible.

18
Analysis of the Data
Linear regression and t-tests were used to determine
the significance of the results. The major variables of
task type, search mechanism and task complexity were all
analyzed. The regression models started with all the
independent variables. Then a step-wise procedure was used
to delete the least significant variable, one at a time. The
demographic data were also analyzed to determine if any of
the characteristics might significantly impact task
performance.
Limitations of the Study
This study has several limitations. A concern is
always present when using students to simulate the
environment of the business world. The concern is that
student characteristics do not match the population in the
business environment, and that the presence of
characteristics mismatch can affect the inferences that may
be drawn about the business community. Typing speed
required for the accomplishment of the different tasks
during the allotted time frame was kept to a minimum. Task

19
domain was kept very general so that business knowledge or
experience were not a factor. The complexities of actual
business use and demands could increase the intensity of the
activity. However, the study assumed that underlying
fundamentals are not influenced by the environment. Current
online help systems have many different methods of obtaining
help information. This study limited the search mechanisms
to just two different types.
Summary
This chapter discussed the development of the problem
as it relates to the design of online help systems and its
potential linkage with user productivity. Chapter 2
presents a review of the relevant online help systems
literature and other literature relevant to this research.
Chapter 3 describes the development and application of the
literature relevant to the research and operational models.
Chapter 4 presents the research design. Chapter 5 contains
data collection procedures. Chapter 6 presents the analysis
of the data. Finally, Chapter 7 discusses the implications
of and provides directions for future research.

CHAPTER II
BACKGROUND
This chapter contains a comprehensive analysis of the
research related to online help, including those of
historical importance. The literature review documents a
pattern of investigation into the help interface prevalent
in information systems. An overview of task complexity and
task type is also presented. Each topic includes a
discussion of the findings of researchers in their
respective fields. Table 1 contains a list of the
theoretical relationships used by the major researchers.
These variables are important in the construction of a
research model.
Introduction
The following review of online system research includes
several different topics. These topics include: (1)
general interface design, (2) adaptive systems, and (3)
online help systems interface design.

21
The variables used in prior help related research are
discussed in this chapter. The strengths and weaknesses of
those studies are analyzed.
Table 1
Relevant Online Help Research
AUTHOR(S) INDEPENDENT VARIABLES
DEPENDENT VARIABLES
Magers {1983) User Characteristics
Online Help Implementation
Task Performance User
Satisfactions
Cohill and Williges (1985)
Help Initiator Help Sequence Help Format
Task Performance
Borenstein (1985)
Help Text Quality Help Search
Mechanism
Task Performance
Smith (1988) Experience Online Help Type Documentation
Format User Interface
Task Performance User Satisfaction User Attitudes
Coventry (1991) User Characteristics
Task Performance
Slack (1991) Access Points Task Performance

22
Help Systems Literature
Interest in help systems is growing. The growing
interest is evident by the number of articles specifically
related to the design and implementation of help systems.
There are three types of articles: (1) those that present
research on different help systems (2) those that examine
how to design help systems and (3) those that present ideas
and concepts that can be adapted and used in help systems.
Help Systems Research Literature
In an experiment with non-programmers in two different
help environments, Magers (1983) found that both user
characteristics and the implementation of online help
documentation affected the subsequent task performance and
satisfaction. Mager's experiment had several methodological
problems. He used three methods whereby help could be
attained: (1) from the computer, (2) from the manuals, and
(3) from a human helper. Although the use of all three
methods at once could potentially influence the results of
the experiment, no explanation was given concerning how the
problem of multiple influences was addressed. The crossover

23
of information flow could have affected the results by-
diluting the treatment affect. Also, Magers1 subjects were
administered the Learning Stvle Inventory (Kolb 1976) in
order to classify their cognitive processing abilities. The
classification scheme used in the Learning Style Inventory
may not have been appropriate in the environment of help
systems because learning is not necessarily required.
Learning is "a permanent change in behavior" and using a
help system may only affect the subjects' behavior at the
time the task is completed.
Cohill and Williges (1985) tested several variables:
(1) help initiator {computer versus human) as one variable,
(2) the help sequence chosen (computer versus human
specified) as a second variable and (3) the format used
(online versus hard copy) as a third variable. They
concluded that novices work faster at editing when the
novice users do the requesting. They also concluded that
users work faster at the editing function when a manual is
available and when they can manage the help function. The
only task tested was the editing function.

24
Several problems were also evident in the Cohill and
Williges (1985) study. First, they categorized college
students who had fewer than eleven hours of formal class
instruction on interactive computer systems as naive. With
the beginning widespread use of microcomputers, the
classification scheme used to categorize naive users may
have been inappropriate. Since subjects were not randomly
selected and were paid a fee for their participation in the
experiment, it may have affected their motivation and, thus,
the results of the study.
Borenstein (1985) conducted an experiment under the
UNIX operating system. He wrote a program in LISP and C
which defined the screen into five areas: (1) small, to be
ignored, (2) help texts, where the help information was to
be displayed, (3) keyword list which displayed topics on
which help could be obtained, (4) command area where the
user could type in commands to get help information, and (5)
system response area. He concluded that the most important
aspect of a help system was the text produced by the help
facility and that search methods were less important.

25
Borenstein's conclusions were based on the assumption
that the users are using a non-intelligent type of help
system. If the users had been using an intelligent type
help system, the results may have been different.
Borenstein also concluded that expert users do not benefit
as much from sophisticated help systems as do novice users.
This conclusion may be task related. The tasks in his
research may not have been difficult or complex enough to
require help. The experts may not have needed much help.
Smith (1988) conducted research on the help function.
The variables used in his research included experience,
online help availability, help type, task performance, and
user satisfaction. The lab experiment used a 3 x 2 x 2 full
factorial between subjects design varying existence or non-
existence of a user interface and media of help
documentation (either online or written) while blocking for
levels of user experience. Three conclusions from Smith's
study were: (1) experience was the most significant
influence on productivity, (2) online help had a positive
influence on task performance, and (3) the subjects were
generally pleased with the online help system.

26
Palmer, Duffy, Gomoll, K.f and Gomoll, T. (1988) found
differences in the vocabulary sets of novices, intermediates
and experts. The authors found that the vocabulary set was
much larger for the experts than for the beginners.
Frankel and Balci (1989) describe the characteristics
of a good help system as it relates to a complex model
building facility. Good help system characteristics
include: (1) consistent availability of assistance, (2)
accurate information and (3) reasonable cost for developing
and maintaining the help system. The help system they
presented, called the Assistance Manager, is one of their
tools in their Simulation Model Development Environment
(SMDE). No experiment was conducted on the help system.
Granda, Halstead-Nussloch, and Winters (1990) conducted
a field study in which they asked 229 computer users to
complete questionnaires. Each user was asked to describe a
situation where information was required to use a computer.
Then the person was asked to specify all the information
sources that were consulted, judge the degree to which each
met their information needs, and estimate the time required
to obtain the information. They found that computer users

27
generally rate human helpers as most beneficial and online
help systems as least useful or helpful. The reasons given
why humans were more advantageous than the computer were:
(1) humans are interactive speakers and listeners, (2)
humans can be selective in the information presented, (3)
humans can query at multiple levels during the communication
process, and (4) humans can assess the relevance of the
information presented by the person. Paper based
documentation was rated along with the other two mechanisms
of obtaining help. Data for the study were collected for
from one to several weeks after the computer experience.
Coventry (1991), in her dissertation on help systems,
investigated the relationship of individual differences to
the use of computers and online help. The observational
study of real users of UNIX showed that subjects used very
few commands and that great variability existed among
subjects in the use of UNIX. She identified "Field
Dependency" as a potential source of the variation between
users. She conducted two experiments to assess the effects
of Field Dependency, as measured by the Embedded Figures
Test (EFT). The researcher assigned subjects a number of

28
tasks to be carried out with help provided via a human
expert or an online help systems. The help system developed
was configured to behave either actively or passively. The
study covered two different user communities: (1) computer
science students and (2) women trainees. Both experiments
found Field Dependency to be correlated with the number of
commands known by users: the more field-independent a user,
the more commands are known. Field dependency did not
correlate with the use of the help system as a whole. All
the female subjects completed fewer tasks than the male
subjects, although they asked for less help. The computer
science students did not like the computer generated active
help. They preferred the passive help systems. The
students preferred to do their own browsing in the help
system. On the other hand, the Technology Centre trainees
preferred the active help system. This system provided
specific help on the tasks to be accomplished by the
subjects. Since the information provided was specific in
nature and the trainees spent less time with the help
system, they tended to be more productive concerning task
accomplishment. The subjects accomplished a higher number

29
of tasks in a given amount of time. A problem with the
research could have been cell sizes used in the analysis.
The total subject population was 32. Eleven in one group
and twenty one in the other, Some subgroups had as few as
three in them.
Slack (1991) examined the use of online help while
subjects were searching an online library system. Slack
then analyzed the transaction logs. The problem areas the
subjects addressed included: (1) the general library system
interface, (2) inputting of search terms, (3) refining the
search strategy, and (4) subject description. Analysis
showed that only one third of the subjects used the online
help system. Even when the online system was used, the
subjects had a difficult time successfully completing
subject searches. With a little human help, the subjects
easily completed the subject search tasks. A second help
system was designed and tested. The newer system was used
less frequently but when used, the subjects were more
successful.

30
Designing Help Systems Literature
Another group of literature examines the issues
associated with the construction of help systems. For
example, Kearsley (1988) in his book about help systems
discusses: (l) why help systems are needed, (2) design
alternatives, (3) several different examples of online help
systems, and (4) how to implement online help systems.
Kearsley also proposed the following guidelines in help
system design:
1. Make the help system easy to access. 2. Make it easy to return to the entry point. 3. Make helps as specific as possible. 4. Give the user as much control as possible. 5. Different types of users need different types of
help. 6. Help messages must be accurate and complete.
Shneiderman (1992) devoted a chapter to help systems in
his book Designing the User Interface Strategies for
Effective Human-Computer Interaction. He presented a list
of design strategies related to menu-based systems that are
relevant to this study. His list included:

31
1. Use task semantics to organize menu structure. 2. Give position in organization of help system by
graphic design, numbering, and titles. 3. Items become titles in walking down a tree. 4. Make meaningful groupings of items in a menu. 5. Make meaningful sequences of items in a menu. 6. Items should be brief and consistent in
grammatical style. 7. Permit type-ahead, jump-ahead, or other short-
cuts . 8. Permit jumps to previous and main menu. 9. Use consistent layout and terminology.
10. Consider novel selection mechanisms and devices. 11. Consider response time and display rate impact. 12. Consider screen size. 13. Offer help facilities.
Shneiderman also proposed "Eight Golden Rules of Dialog
Design". His rules were:
1. Strive for consistency. 2. Enable frequent users to use shortcuts 3. Offer informative feedback. 4. Design dialogues to yield closure. 5. Offer simple error handling. 6. Permit easy reversal of actions. 7. Support internal locus of control. 8. Reduce short-term memory load.
Pilkington (1992) examined the process of specifying a
question-answering help facility in the context of UNIX
mail. The developer, Pilkington, based the system on
expert-user facilitative dialogues. The method he used to

32
develop the system included analyzing the dialogues with a
classification scheme developed for that purpose. The
developer used patterns of answers to devolop the interface
between the machine and the user.
Kirk (1990) believes that users cannot remember all the
facilities of a complex system. He developed an online help
system to assist people while they are using, a large record
system called COSTAR (Computer Stored Ambulatory Record
System). With the help system in place, the users required
less training time individually and in group session.
Related Literature
Literature that identifies, and classifies, and
categorizes levels is also relevant to this study. The next
section addresses these issues, as related to help systems,
and identifies some of the inconsistencies in existing
research.
Task Type Literature
Task characteristics and complexity have previously
been used to classify tasks. Researchers have studied help
facilities, task characteristics and task complexity as

33
important variables. None of the research has combined all
three in one research effort. Bloom (1956) proposed a task
classification scheme related to educational objectives that
includes, from lowest to highest, knowledge of specifics,
comprehension, application, analysis, synthesis and
evaluation. Bloom's (Bloom 1959, pl5) taxonomy is as
follows:
Evaluation -- making judgments about the value, for some purpose, of ideas, works, solutions, methods, material, etc. .
Synthesis -- putting together parts so as to form a whole.
Analysis -- breaking down the material into its constituent parts and detecting the relationships of the parts and the way they are organized.
Application -- remembering and bringing to bear upon given material the appropriate generalizations or principles.
Comprehension -- grasping the meaning and intent of the material.
Knowledge of Specifics -- the recall of specific and isolatable bit(s) of information.
Gardner (1986) classified tasks using two dimensions
The first was the perception of core job characteristics

34
scales from the Job Diagnostic Survey. The analysis from
the JDS resulted in a motivating potential score (additive
formula) which showed the enrichment level as perceived by
the subject relating to a specific task. Gardner also
developed a second perceived task characteristic measure
which he based on activation theory constructs {visual,
intensity, complexity, meaningfulness, novelty, and
variation of stimulation). Gardner hypothesized that
complex tasks required lower levels of activation to achieve
maximum performance than simple tasks.
Hearne and Lasley (1985), who used mathematics and
verbal ability scales in their research regarding
predictions of computer aptitude, used the Stanford
Achievement Test to obtain ability ratings. An extension of
the application of the Stanford Achievement Test to computer
aptitude is making the assumption that a link exists between
task and ability.
DeSanctis and Gallupe (1987) outlined a categorization
scheme for the assessment of tasks in a group decision
environment. Their task types included planning,

35
creativity, intellective, preference, cognitive conflict,
and mixed-motive.
Hard and Vanecek (1991) conducted an experiment using
task performance as the dependent variable and task type and
presentation format as the independent variables. The
authors chose Bloom's taxonomy to classify the processes of
decision making. The groups developed by the authors
included: (1) accumulation (2) recognition (3) estimation
and (4) projection. Their results showed that presentation
format, with respect to the task being performed, did have a
relationship to the decision-making process of financial
decision makers.
Task Complexity Literature
Jarvenpaa (1989) concluded that graphical presentation
format and task complexity were significant in determining
the decision quality of where to locate a restaurant.
Graphical decision aids was one of the independent
variables. The conclusions were inconclusive in the early
trials. The reasons given were varied. One was that the
subjects did not have sufficient problem identification

36
skills. Another was the poor design of the graphs being
presented to the subjects.
Kozlowski and Hultz (1986) associated task complexity
with the job performance of engineers. They investigated
task complexity by studying engineers in a research and
development organization. These authors measured task com-
plexity using the Job Characteristics Inventory (Sims,
Szilagyi and Keller, 1976). Previous research (Dunham,
1976; Roberts and Glick, 1983) suggests that the
classification of job characteristics can be done by using a
single task complexity construct. The authors suggested
that a simple sum is the most appropriate method to use in
obtaining task complexity.
It is possible to classify task complexity using dif-
ferent schemes. Wichman and Oyasato (1983) varied the level
of complexity in their research by using one-letter numbered
pairs versus four-letter numbered pairs in experiments in
prospective remembering. They reported that task complexity
was a significant contributor to subject performance in
regard to remembering the character strings.

37
Gawron (1982) used still another classification scheme
for task complexity. She classified a simple task as one in
which the subjects do one task at a time. For the complex
task, the subjects do dual tasks. She found that the task
complexity factor was significant.
Johnson and Payne (1985) defined task variables as
"those associated with general characteristics of the
decision problem." An example is the number of alternatives
which is not dependent on the particular values of the
objects. The results of Johnson and Payne's study suggest
that heuristic strategies can be highly accurate. On the
other hand, these strategies may substantially reduce the
effort required as they relate to the normative procedures.
They found that the accuracy and effort of strategies,
however, were highly contingent upon characteristics of the
choice task.
Kleinmuntz (1985) studied the dynamic decision environ-
ment . Characteristics of the dynamic decision environment
include the subjects cognitive abilities as they relate to
the problem domain, to computational complexity of the
decision task, and to the engagement of probabilistic

38
behavior by the subjects. The structure of the environment
can influence the decision making behavior of subjects
(Brunswik, 1952; Postman and Tolman, 1959; Simon, 1981).
Two other task characteristics used by Kleinmuntz (1985)
were task size and task related information feedback.
Zmud (1984) included task complexity in his study of
the management of software groups. His complexity measure
was a combination of the percentage of projects that: (1)
took longer than six months to develop, (2) required more
than twenty-five man-months of effort and (3) cost more than
$20,000 to develop. Zmud found a relationship between task
complexity and the adoption of innovative technologies.
Most researchers who have used task complexity in the
past have not considered task type. However, task
complexity may take on different dimensions and elicit
different properties in light of the task type being
investigated.
Although several researchers such as Magers (1983),
Cohill and Willinges (1985) , Borenstein (1985), Smith
(1988), Slack (1991), and Coventry (1991) have suggested
that many constructs may influence performance when using

39
the help function, none has presented generalized formal
theoretical frameworks in their investigations. However,
theoretical frameworks may be implied by the variables used.
The theoretical framework developed from all the variables
used by past researchers includes: user characteristics,
task characteristics, information characteristics and user
environmental characteristics as the independent variables
and task performance as the dependent variable.
A comprehensive literature review was unable to find
research in help systems using task type as an independent
variable. The lack of inclusion of task type could be a
significant oversight. In a research setting that is
investigating the help function, it would seem logical to
assume that task complexity could play an important role in
the outcome. If the task complexity is not high enough, the
help system is not needed and if task complexity is too
high, no online help systems will be able to assist the
user.

40
Adaptive User Interface
In a concept oriented article written by Trumbly
(1990), he proposes that the six design principles of a good
human factors program are: (l) supply feedback, (2) be
consistent, (3) minimize human memory requirements, (4) keep
the program simple, (5) match the program to the user's
skill level, and (6) sustain the orientation of the user.
In another article (Kuo, Karimi, Jahangir 1988), the authors
present three types of user interfaces: (1) question-
answer, (2) menu-form, and (3) command language. They
propose that all systems should support all three types of
interfaces. In the scenario where all help system types are
available, the users choose whichever they wanted. It is
possible users could choose a different type of interface
for a different situation.
An adaptive interface can be implemented in one of two
ways. The first is to let the user choose the interface
design. When the users choose their own interface, it would
be known as user-directed adaptation. The second method
would be for the computer to adapt to users as they use the
system. The computer directed adaptation process would

41
require some form of intelligence on the part of the
computer system. This intelligence could be implemented in
the form of a rule base. Then the rules could be developed
either by using protocol analysis or by gleaning information
from a group of experts.
Conclusions
Traditionally, help systems research has not included
some variables that may have a significant impact on the
findings. Task complexity needs to be included to
determine if it may be a significant variable. Another
variable that has been untested is task type. Help related
research usually tests different providers of information
and how to obtain information from the viewpoint of the
subject, but none has included a research effort that
included different task types in the same research effort.
Although several studies suggest that the overriding
variable is experience in relation to performance of a task,
many problems exist concerning past research. Since the
research has not been framework based, definite conclusions
are suspect. Because no foundation was laid, any

42
assumptions that arise from this line of research may be
questionable. In addition, many researchers used multiple
treatments at the same time, compounding the problem of
determining impact. It is difficult to isolate causes from
multiple sources. None of the researchers used a task
classification scheme. This may, in itself, be enough to
invalidate the research, because help research may be
significantly effected by task type.

CHAPTER III
THEORETICAL AND OPERATIONAL DEVELOPMENT
This chapter presents the development of the research
and the operational models. All of the variables were
derived from previous literature. The hypotheses were a
direct result of the variables used in the operational
model.
Research Model Overview
Several frameworks have been proposed and developed by-
management information systems researchers in the past
(Chervany, Dickson, and Kozar, 1971; Gorry and Scott-Morton,
1971; Ives, Hamilton, and Davis, 1980; Lucas, 1973; Mason
and Mitroff, 1973; Mock, 1973). These frameworks were used
as a foundation for the development of the theoretical
framework for this study. Figure 1 shows the Ives,
Hamilton, and Davis model. The study used an adaptation of
the Ives, Hamilton, and Davis (1980) model (Figure 1). The

44
adaptation process resulted in the research model used in
this study (Figure 2).
The External Environment The Organizational Environment
User
Environment
The Use
Process
IS Development Environment
The Development
Process
IS Operations
Environment
The Information Subsystem
The Operation Process
Figure 1. Ives, Hamilton, and Davis IS Research Model.
The main difference between the Ives, Hamilton, and
Davis Model and the research model used in this study is the
addition of the task performance variable. The operation

45
variable does not specifically include the performance
dimension.
Task Characteristics
Informational Characteristic#
P r o e m Characteristic®
Environment External Organizational Uaer
IS Development IS Operational
Figure 2. Research Model used for this study.
The categories of variables chosen for this research
were user characteristics, task characteristics, process
characteristics, and task performance. Task type and
complexity were both independent variables selected from the
task characteristics category. The search mechanism to
information was the independent variable selected from the

46
process characteristics category. The user characteristics
category included experience, age and gender. Quantity of
output was the dependent variable selected from the task
performance category.
INDEPENDENT
VARIABLES
User Characteristics
•Experience
Reading Skill
Typing Speed
Cognitive Style
"Age
•Gender
Satisfaction
Reward
Attitude
Task Characteristics
*Task Type
Mathematical and Verbal
•Task Complexity
Information Characteristics
Information Quality
Response Time
Process Characteristics
^Search Mechanism to Information—
Information Generating Mechanism
Environmental Characteristics
Emotional Pressure
Ergonomics
•Variables studied in this research
DEPENDENT
VARIABLES
*Task Performance
Quality of Output
» 'Quantity of Output
Time to Copmpletion
User Satisfaction
Figure 3. Help Systems Variables List.
A list of the variables used in the model follows. The
reasons for including these variables are also presented.

47
Independent Variables
This study used task type, task complexity and access
mechanism to information as primary independent variables.
These variables were chosen because prior researchers
believed that task characteristics are a prime determinant
of human decision making. (Einhorn and Hogarth 1981, Newell
and Simon 1972, Sage 1981). These variables were chosen
because of their demonstrated importance as variables by
Magers (1983). Hearne and Lasley (1985) used mathematics
and verbal ability variables in their research. Their
categorization scheme was adapted and included in this
research because those variables may be important in
affecting task performance.
Search Mechanism
Smith (1988) conducted research on help systems. He
concluded that the presence of a help system improved the
performance of the user. This study takes help systems
research one step farther. This research categorizes the
type of search mechanism the user may use in obtaining help
from the computer.

48
Search mechanisms to information can be easy or
difficult to use, especially for beginners. Since this
research concerns beginners, a logical assumption and
proposed hypothesis is that the easier it is to acquire the
needed information, the faster the person will be in
completing the task set.
The level of complexity for a beginner may involve
a situation where the beginner does not know the meanings of
the words that are on the screen. If the beginner does not
understand, the beginner cannot appropriately use the words
to search for the help information. If the words on the
screen are familiar to the beginner, it is more likely that
the beginner can use those words and phrases effectively in
getting the system to generate the needed help information.
The surrogate variable of search mechanism was keyword
driven versus a semantically based help system. Help
systems have traditionally been keyword driven.
Task Complexity
Task complexity was found to be a significant variable
in the Jarvenpaa, Dickson and DeSanctis (1985) research.

49
They tested the effect of task complexity on decision
performance and on decision confidence. They found that by
lowering the complexity of the decision environment, the
subjects detected a higher percentage of the problems.
Simon (1981) proposed that a complex system is "one
made up of a large number of parts that interact in a non-
simple way." He also stated that "how a system is
described" affects the complexity level of that structure.
Since the task complexity variable is affected by task
type, the task types used for this study conform to the
classification scheme used by Bloom (1956). Bloom describes
six different task activities. For this research, subjects
were required to function at Bloom's comprehension level.
Task complexity was monitored and tested in this
research. None of the research to date has included task
complexity. If tasks are very simple for subjects, then the
help mechanisms are not tested at all. On the reverse side,
if tasks are too complex, no amount of generic help can
enable users to complete the task. In the case where the
task is very complex, specific information related to the
task of the subject was needed. Most implementations of the

50
help function do not provide a very detailed level of
support.
Task Type
The surrogates for task type were mathematical and
verbal task types. Jarvenpaa, Dickson and DeSanctis (1985)
proposed that task type may be a significant variable in the
information systems research. Hearne and Lasley (1985) used
mathematics and verbal ability scales in their research
regarding predictions of computer aptitude and they used the
Stanford Achievement Test to obtain ability ratings. Hard
and Vanecek (1991) found that task type can be a significant
variable in affecting task performance. The potential
impact of task type needs to be studied.
Dependent Variable
The one major dependent variable in the model, task
performance, is defined as the quantity of output. In the
business world, there are degrees of completion with regard
to tasks. It is logical that the degree of completion be
taken into consideration when conducting research that will
be applied to a business setting.

51
Another dimension to task performance is quality.
Quality is also important when considering task performance.
Vasilash (1992) investigated the automation process
concerning the conversion of design concepts all the way
through to actual appliances. Productivity was the main
concern, but another issue was that the assurance the number
of mistakes in the process would not increase and lower
quality. This study assumes constancy of the quality level.
The tasks are either accomplished or they are not.
A major goal of this research is the identification of
the important factors that may affect task performance.
Productivity is an important consideration in a business
environment. Task accomplishment is related to that
concept. The more tasks that can be accomplished in a given
amount of time, the more productive the person, given a
constant level of quality. Surynt and Augustine (1993)
discussed the issues surrounding resource allocation and
end-user productivity in an educational environment. The
goal of resource allocation was to help maximize end-user
productivity and minimize waste of the institutional
resources. The desired effect on the students was to

52
provide an adequate resource level so they could effectively
learn.
The dependent variable of task performance was chosen
for the purpose of evaluating the effects of access
mechanism, task type and task complexity. Magers (1983)
found that both user characteristics and the implementation
of online help documentation affected the subsequent task
performance. Cohill and Williges (1985) concluded that
users worked faster when the help system was not the
initiator. If the user did the requesting, the user tended
to work faster. If the system prompted the user to see if
he/she needed help, the user tended to work slower. Smith
(1988) concluded online help had a positive influence on
task performance. Coventry (1991) in her dissertation on
help systems investigated the relationship of individual
differences to the use of computers and online help. She
found that individual differences had an effect on usage
rates of the computer. Slack (1991) examined the use made
of online help during subject searching. She found that
when the help system was redesigned even though the usage
rate dropped, the accomplishment of successful searches

53
increased. From the literature, task performance has been
used as a dependent variable. This study uses task
performance also as a dependent variable.
Demographic Variables
Demographic data about the subjects could be an
important consideration since past research has found that
one characteristic such as experience level was a
significant determination in task performance (Smith 1988).
Data collected concerning demographics include age, gender,
experience in general and experience with the test
instrument (either the spreadsheet or the word processor).
This was done to determine prior knowledge of the test
instruments.
Hypotheses
The primary hypothesis of this study was that the level
of task performance would vary with the access mechanism
used. It was then hypothesized that task performance is a
function of the search mechanism. Stated in the null form:

54
HoAl: There will be no difference in task performance between subjects using the keyword and semantic help systems.
This hypothesis is consistent with previous research,
such as Borenstein (1985.) He used search mechanism as one
of the independent variables in his dissertation.
No prior research on the topic of complexity levels and
task performance relative to help systems is known to exist.
Jarvenpaa, Dickson and DeSanctis (1985) found that task
complexity was a significant variable in their research.
This study investigated the application of task complexity
and task performance relative to help systems. Hence,
stated in the null form:
HoA2: There will be no difference in task performance between subjects performing high complexity tasks and low complexity tasks.
No prior research on the topic of task type relative to
help systems is known to exist. Jarvenpaa, Dickson and
DeSanctis (1985) proposed that task type may be a
significant variable in the information systems research.
Hearne and Lasley (1985) who used mathematics and verbal

55
ability scales in their research regarding predictions of
computer aptitude, also used the Stanford Achievement Test
to obtain ability ratings. This study investigated the
application of task type to help systems. Stated in the
null form:
HoA3: There will be no difference in task performance between subjects performing verbal and mathematical tasks.
A secondary hypotheses set was developed. Based on
prior research, subjects should perform tasks better when
using the semantic help system, and they should perform
better on the higher level of complexity tasks. Stated in
the null form:
HoBl: There will be no difference in task performance between subjects using the semantic online help system and subjects using the keyword driven help system when the subjects are given a low complexity level verbal task.
Based on prior research, the subjects should perform
better when using the semantic online system when the tasks
are complex. Stated in the null form:

56
HoB2: There will be no difference in task performance between subjects using the semantic online help system and subjects using the keyword driven help system when the subjects are given a high complexity level verbal task.
Another secondary hypothesis is that task performance
will be related to the access mechanism given a low
complexity mathematical task type. Stated in the null form:
HoCl: There will be no difference in task performance between subjects using the semantic online help system and subjects using the keyword driven help system when the subjects are given a low complexity level mathematical task.
Another secondary hypothesis is that task performance
will be related to the access mechanism given a high
complexity mathematical task type. Stated in the null form:
HoC2: There will be no difference in task performance between subjects using the semantic online help system and subjects using the keyword driven help system when the subjects are given a high complexity level mathematical task.
Another secondary hypothesis is that task performance
will be related to verbal type and task complexity given the
semantic online help system. Stated in the null form:

57
HoDl: There will be no difference in task performance between subjects using the semantic online help system given a verbal task type and varying the task complexity.
And another secondary hypothesis is that task
performance will be related to verbal type and task
complexity given the menu-driven online help system. Stated
in the null form:
HoD2: There will be no difference in task performance between subjects using the keyword driven online help system given a verbal task type and varying the task complexity.
The seventh secondary hypothesis is that task
performance will be related to task complexity given the
semantic online help system and the mathematical task type.
Stated in the null form:
HoEl: There will be no difference in task performance between subjects using the semantic online help system given a mathematical task type and varying the task complexity.
The final secondary hypothesis is that task performance
will be related to task complexity given the keyword driven

58
online help system and the mathematical task type. Stated
in the null form:
HoE2: There will be no difference in task performance between subjects using the keyword driven online help system given a mathematical task type and varying the task complexity.

CHAPTER IV
RESEARCH DESIGN
This chapter discusses the research design used in the
study. The chapter covers the following activities: (1)
development of experimental design, (2) development of the
research design, (3) operational model development, (4)
operationalization of the variables, (5) discussion on the
measurement of the variables, (6) discussion of demographic
data, (7) discussion of subjects and population, (8) pre-
experimental procedures development, and (9) a discussion
on experimental procedures, and (10) a presentation of the
key assumptions.
Experimental Design
A research framework, which was presented in Figure 3
of Chapter III, was developed to identify variables used in
prior help systems research. The categories of variables
chosen for this research were task performance, task
characteristics and process characteristics. The
independent variables of task type and of task complexity

60
were selected from the task characteristics category. The
independent variable search mechanism was chosen from the
process characteristics category. The user characteristics
category included demographics of experience, age and
gender. The dependent variable of quantity of output was
chosen from the task performance category. The surrogate
of quantity of output was score measure by the number of
tasks completed by the subjects.
This study used four different experimental
instruments. The four instruments were developed to
represent two levels of the independent variables: (1)
task complexity and (2) task type. Task complexity had
two classes: (1) high and (2) low. Task type had two
classes: (1) mathematical and (2) verbal.
A laboratory experiment was used to test the
hypotheses. The experimental design was a post-test- only
control group between groups 2X2X2 factorial design (design
6, Campbell and Stanley, 1963). Subjects were randomly
assigned to one of the two search mechanism groups and to
one of the two task groups and to one of two complexity
levels (eight different treatment groups). The research
design is represented in Figure 4. The anonymity of each

61
subject was maintained. Each subject completed either a
high or a low complexity task set using either Lotus or
word processor. Subjects were allotted a specific amount
of time. Both the spreadsheet and word processor parts had
either a high complexity task set or a low complexity task
set.
Research Design
Figure 4 that follows illustrates the overall research
design. It is a pictorial representation of the variables
under investigation. The study investigated three factors.
Each factor had two levels. Each subject was assigned to
one group.
Operational Model
The variables listed in Figure 3 of chapter III were
used as inputs into the construction of the operational
model in Figure 5 of this study. All of the independent
variables listed on the left in Figure 3 are assumed to be
variables that have a significant impact on the dependent
variables.

62
Research Design
Search Mechanism
Semantic Keyword
Task Complexity
Task Type
:z:
Low
High
Task Performance
Task Performance
Task Performance
Task Performance
Math
V Verbal
Figure 4. Relationships of the variables
The operational model in Figure 5 was developed from
the research model. Task performance was included from the
dependent variables list. Task type and task complexity
were used from the independent variable -- task
characteristics. Search mechanism to information was
chosen from the list of process characteristics.

63
Y 1(2,3,4,s,6,7,8 = f (Xj given xa given x3)
Y = task performance (SCORE) for eight different task sets
x-i = search mechanism (Semantic versus Keyword) x2 = task complexity level (high or low) x3 = task type (mathematical or verbal)
Figure 5. Operational Model
Qperationalization of the Variables
Task performance in an educational setting usually
involves grades. The dependent measure developed in this,
research was grade achieved on the task set (SCORE). The
grading scale was adjusted according to input from a panel
of experts. All task sets were graded using a scoring
sheet for each task set. Therefore, the surrogate for
quantity of output was performance on the task set.
Quantity was measured by the number of questions answered
correctly on the task set during the timed experiment.
Search mechanism was operationalized into two
categories. The first category was the keyword based
search mechanism. The second category was the semantic
based help system. Subjects using the second semantic

64
based help system chose words and phrases that were
combined into sentences. When the sentences were complete,
the help system would display on the screen the requested
information.
Task type was operationalized into two categories.
The first was the mathematical type. The problems the
subjects had to solve included mathematical concepts. The
subjects used a spreadsheet to address the mathematical
problems. The second was the verbal type. This verbal
task type involved the use and manipulation of words,
phrases, sentences, paragraphs and a document. The
subjects had to use a word processor for the verbal task
type.
The surrogate variables used in this experiment were:
(1) test scores on the task set of each subject for
performance, (2) the spreadsheet and the word processor
application programs for task types, (3) a high versus low
task complexity level which was validated by the expert
panel, and (4) keyword versus semantic help systems for
search mechanism. The surrogate for dependent variable
task performance was the score students received on the
assignment. The score was generated by using a standard

65
evaluation form which was also validated by the expert
panel.
The surrogate for the independent variable search
mechanism was determined by whether the subject used the
semantic help system or the keyword system provided by the
manufactures of the spreadsheet and the word processor
programs. The surrogate for the independent variable task
complexity was initially measured by the researcher who
used a number of elements: (l) the depth required in the
command system of the spreadsheet and word processor (the
higher number of levels that need to be traversed in the
command structure, the higher the level of complexity), (2)
the experience and knowledge the researcher had concerning
beginners and how they perceive and learn computer
concepts, and (3) the number of steps required to
accomplish a given task. No mathematical formulas were
used to assign the complexity level to any one task.
Instead, assignment was based on a combination of personal
experiences of the researcher and the observation, over the
previous five years, of beginners while they were learning.
The classification scheme and the value of the assigned
complexity level to each of the tasks were validated by the

66
expert panel before each of the pilot tests. The expert
panel achieved agreement with regard to the scheme used and
the values assigned.
Measurement of the Variables
At the beginning of the experiment, all subjects were
asked to complete a consent form and a demographic
questionnaire. The information gathered from the
questionnaire included subjects' age, gender, experience
with computers, education, and experience with word
processors and spreadsheets in general and experience with
the test word processor and the test spreadsheet in
particular.
The tasks were graded on an accomplished/not
accomplished basis. The files from the computers provided
sufficient information so subjects could be given credit
for accomplishing tasks that did not require the generation
of paper output. Each file and/ or paper submitted was
graded against the grading scale developed during the pre-
experimental phase. All grading was done by the
researcher. This was done to prevent the introduction of
any grading bias by another individual. Although the

67
grading criterion was very specific, another person may
have inadvertently graded differently.
Demographic Data
Demographic data about the subjects were collected
including age, gender, experience in general and experience
with the test instrument (spreedsheet or wordprocessor).
The demographic data were used for several reasons: (1)
there had to be a method of rejecting subjects who were not
beginners, (2) there needed to be a method of determining
if age was a significant influence on the outcome, and (3)
the gender variable was investigated to determine if there
was a performance difference between them.
Subjects who scored themselves higher than a three for
prior knowledge about the software being used or about the
software category in general were excluded from the data
analysis. Exclusion prevented the data from having a bias
with non-novices. The exclusion process was conducted
after random assignment; the subjects that were excluded
were eliminated from the experiment.

68
Subjects and Population
Student subjects have been used extensively in
research. Gordon, Slade, and Schmitt (1986) showed that
student populations were similar in characteristics and
demographic data to non-student populations. However,
studies of Copeland, Francia, and Strawser (1973) and Soley
and Reid (1983) demonstrated significant differences
between student populations and business populations.
Because the ability to make inferences regarding the work
world was a concern in this research, business students
were included.
The subjects for this study were obtained from
beginning computer classes (BCIS 2610) in the Business
Computer Information Systems Department at the University
of North Texas in Denton, Texas. Three hundred and twenty
students participated during the 1990 fall semester. Most
of the participants were classified as sophomores and
juniors.
Students who participated in the study were asked to
complete a demographic questionnaire which included
questions regarding their age, gender, education, computer
experience and experience with test spreadsheet and test

69
word processor in particular. Since the research effort
was a class assignment, subjects were given the opportunity
to refuse to participate. In retrospect/ using a class
assignment as part of the research effort was not a
problem.
This research was designed to be projected toward a
general population of workers in the business world who are
inexperienced in the use of computers. There are many
individuals in the business world who fit the description
of general beginners with regard to computer use.
Pre-experimental Procedures
The tasks used in the study were developed with the
help and input from a panel of experts. The reason for
selecting the particular tasks was that they were the kinds
of tasks business peopl§ encounter.
The pre-experimental procedures were designed to
facilitate the validation of the task sets, the scoring
system and the online semantic help system. The pre-
experimental procedures included the following nine steps:

70
1. Development of the initial math and verbal tasks.
2. Conduct the protocol analysis to determine search words and levels of complexity as perceived by the subjects and develop the initial scoring assignments.
3. Validate the data with an expert panel. 4. Develop the semantic help system. 5. Test the task sets and the help systems
in the first pilot test. 6. Add tasks to the task sets. 7. Re-validate the task sets, scores and
perceived levels of complexity of the two help systems by the expert panel.
8. Conduct the second pilot study. 9. Analyze the results from the pilot study.
The procedures, task sets, and help systems were pilot
tested with undergraduate students. The primary purposes
of the pilot testing were to validate the semantic online
help system, to validate the task sets, and to ensure that
a discriminatory condition would exist between the task
sets.
Protocol Analysis
This section contains an overview of the research tool
protocol analysis. The following chapters on data
collection and analysis contain specific details on what
occurred during the protocol process stage. The Data
Collection chapter presents the method of collection and

71
the Data Analysis chapter presents the method used to
analyze the data obtained.
Data collection about how people search for
information and what types of information they seek has
been difficult or impossible in the past. It is possible,
however, to observe subjects as they use the computer. The
limitation of observational methodology is that the
researcher can see the activities of the subject, but he
cannot determine the underlying motivation of the behavior.
Observational research often leaves a void in the kinds of
information available to the researcher. It is not enough
for the researcher to know, for example, that the subject
hit the F3 key; the researcher needs to know why that
activity occurred. This reasoning information is vital in
designing effective and efficient systems interfaces.
Protocol analysis is a tool that can be used to investigate
the cognitive processes being used by a subject.
Protocol analysis is the collection of data whereby
subjects verbalize their feelings, thoughts and/or
information to the researcher. Watson (1920) was the first
to use the protocol analysis technique. Newell and Simon
(1972) gave protocol analysis a second look. Then Ericsson

72
and Simon (1984) developed the protocol analysis technique
when they developed a framework of the human thought
process. This framework could then be used as a guide for
interpretation.
This study used protocol analysis to gather data about
how beginners, when given a task set, interact with the
computer. This provided insight into the thinking patterns
of beginners as they attempted their tasks. The semantic
help system was constructed using the information collected
during the protocol analysis phase of the research.
Specifics of the protocol analysis data collection process
are given in the Data Collection chapter. The technique of
protocol analysis is unique to the research on help systems
and provides significant insight into the process.
The subjects for the protocol analysis phase had the
same characteristics as the subjects in the full study. By
using students in the protocol phase of the research, the
researcher ensured consistency of subject population
characteristics between the protocol phase and the regular
data collection phase.

73
Semantic Help Design
The semantic online help system was developed during
the pre-experimental process. The following is a list of
the steps that were taken in the development and testing of
the semantic help system.
1. Develop the semantic words and phrases. 2. Develop the information needed for task
accomplishment. 3. Code the system. 4. Contact expert panel - validate complexity
of the help system, the phrases and the information provided.
5. Test validated semantic system.
An example of how the protocol information was used
follows. The first three lines of the protocol data show
the discussion on the save process. From the feedback
obtained during the protocol analysis phase, the save
process was included. The resulting screen that included
this concept is shown in Appendix E of the word processor
semantic help screen. Another example of a concept that
was discussed in the protocol data was how to move the
cursor around in a document. An example of the help script
created to teach a person how to do that activity is shown
in Appendix H of the word processor help scripts.

74
From the protocol information and feedback from the
expert panel, the semantic help system was constructed
using Pascal. Pascal was chosen because it was relatively
easy to develop the TSR feature of the pop-up help system
on a DOS machine. Appendix E contains the example screen
used in the semantic help system.
The design specifications of the semantic help system
included: (1) the ability to be called up from a function
key, (2) windows would be placed on the screen with words
and phases in them, (3) a cursor could be moved around
which would enable the user to construct a sentence, (4)
once the sentence is constructed, the helpful information
would be displayed on the screen, (5) if the amount of
information will not fit on one screen, a scrolling
mechanism must be included, and (6) once the semantic help
system is exited, the user should be right back at the
point of entry. The example screen used in the semantic
help system is shown in Appendix E. The keyword help
system interface is shown in Appendix F.
In contrast to the functioning of the semantic help
system, the keyword help system functioned differently.
When the subject called up the keyword help system, a list

75
of words was presented on the screen. The user had to
choose one of the words to access another list of words
that were more specific to a given topic. Depending on the
number of levels the user had to traverse, the keyword help
system would finally provide the help information
requested.
Expert Panel
An expert panel was included in the research process
for several reasons. The expert panel provided validation
for the following: (1) task categories, (2) task
complexity rating system, (3) scoring system and (4) the
semantic help system. They may provide insight into
unanticipated problems. None was encountered. The word
processing experts were consulted about word processing
tasks and concepts, and the spreadsheet experts were
consulted concerning spreadsheet tasks and concepts.
The panel members consisted of two word processing
specialists certified by the word processing corporation
and three spreadsheet specialists who received specific
training and certification by the spreadsheet corporation.

76
According to Rockart and Flannery (1983) such experts are
classified as functional support personnel.
The expert panelists were chosen from a list provided
by the respective companies that developed the word
processor and the spreadsheet. Initial contact was made
through telephone. During the pre-experimental phase of
the research, meetings were used to obtain feedback from
these experts. The organizations provided the names of
people who had undergone the training sessions and had
passed competency tests the organizations provided. Being
on the official list allowed the experts to advertise that
they were certified by the organizations. All of the
experts enlisted on the panel were practicing trainers in
the field.
Task Set Design
The process of task set design required many steps.
The first task set was acquired by the researcher. All of
the task sets used were designed by the researcher and
validated by the expert panel. The first task set was the
homework assigned to the students in the BCIS 2610 class.
This task set was acquired before the protocol analysis

77
occurred. The researcher had 5 years of experience
teaching the BCIS 2610 class. A more detailed account of
the task set development is presented in the Data
Collection and Data Analysis chapters.
Since Hearne and Lasley (1985) used mathematics and
verbal ability scales in their research regarding
predictions of computer aptitude, their classification
scheme was adapted for this research.
A verbal task involves the use of words. A
mathematical task involves the use of numbers. An example
of a verbal task is shown in Appendix D for the word
processing questionnaire. Verbal tasks include the use and
manipulation of words, phrases, sentences, paragraphs and
documents. One example in the questionnaire is deletion of
text in a document which the expert panel classified as a
simple task. An example of a complex task as defined by
the expert panel in the use of different fonts in a
document.
A mathematical task involves the use and manipulation
of numbers. A list of mathematical tasks is shown in the
spreadsheet questionnaire of Appendix D. An example of a
low complexity mathematical task as defined by the expert
78
panel would be entering a number in a spreadsheet. An
example of a high complexity mathematical task is
conducting data sorts on numbers.
Experimental Data Collection
Once the task sets were finalized through the
validation process, collection of the experimental data
occurred. A detailed account of the process is presented
in the Data Collection chapter.
Before the experimental data were gathered, each of
the subjects received a preliminary teaching seminar. The
training session ensured that all subjects had the same
relative knowledge about how computers worked and how the
test spreadsheet and the test word processor functioned.
The pre-data collection lecture was written and
standardized and given by the researcher.
The experimental process took place over a period of a
week for all subjects. Eight different sessions were
included. The following is a representation of the
research design:

79
R x„ on
Where R — randomization xn — the different treatment conditions 0 = observation n = 1...8
Figure 6. Experimental Design: Posttest-only control group, Design 6. Adapted from Campbell and Stanley
The experiment was administered in eight sessions at
the beginning of the semester. The experiment was given
early in the semester so the subjects would not learn
information that would bias the experiment. Random
assignment of the treatments to each session ensured that
each subject had an equal probability of receiving either
of the two complexity levels, and either of the two task
types and either of the two help system types. At each of
the experimental sessions, subjects completed a demographic
questionnaire and the administrator used a timing device.
During the forty five minute timed experiment, the subjects
reviewed the task sets and responded to the assigned tasks.
Subjects need only a basic understanding of the
keyboard and the hardware, such as the printer, to complete

80
the tasks. This information was provided by the researcher
in a short presentation given prior to their beginning the
experiment. All the presentations were given by the same
person from a previously developed list of concepts
(keyboard, printer, and accessing the help system). The
presentation was given to ensure the same level of
knowledge prior to the experiment about the environment of
the experiment.
Subjects were instructed to work the list of tasks
within the allotted time. At the end of the allotted forty
five minutes, all subjects ceased working, and the
materials were collected. The subjects were instructed not
to talk with any of the other subjects. They were also
instructed not to ask any questions. If the subjects
needed information, they were instructed to use the help
system on the computer.
After the subjects turned in their papers, the
researcher saved all the files from the computers. These
files were later analyzed for task completion even if the
subject produced no output. The activity of grading those
files ensured that there would not be a bias in the data
based on output production versus no output production.

81
The scoring system listed in the appendix materials
was not present for evaluation by the subjects. The reason
for this was to prevent bias in task selection by the
subjects. The subject may have had a different analysis of
the less complex and more complex tasks as compared with
those of the expert panel. The bias may have influenced
the results.
Key Assumptions
One of the assumptions in this research concerning
beginners is that they do not have the critical mass of
computer related information on which to make decisions.
Another assumption is that all beginners are alike. This
assumption is not so. There is a vast difference between a
beginner with keyword experience and one without. An
experimental training process and the random assignment of
subjects were used to alleviate the problem of keyboarding
knowledge and skill. To eliminate the impact of
keyboarding knowledge, the researcher also designed the
tasks so that keyboarding skills would not be a significant
factor in the task accomplishment. The other method used
to eliminate the impact of different levels of knowledge

82
was a teaching session just before the task sets were
assigned to the subjects. This teaching session was given
by the researcher alone and the content was common to all
subjects.
Another assumption is that task complexity increases
when the number of tasks increase or when the number of
interrelationships between/among the tasks increase. By
definition, task complexity is the level of elements and
the inter-relationships among the elements. If the level
of elements increases, then the level of task complexity
increases. As a practical matter, adding vary simple tasks
to the task list will theoretically increase the task
complexity component; but, since this increase is so small,
the impact is negligible.

CHAPTER V
DATA COLLECTION
The study consisted of pre-experimental and
experimental stages. Each stage has a number of steps.
The data collection and data analysis processes have many
steps in common but there are some steps that are unique to
each.
The data collection process had several activities.
The first main activity was the data acquisition of data to
facilitate the construction of the semantic help system.
The second main activity was to provide feedback to
facilitate the validation process for the task sets. The
third main activity was to provide data for the evaluation
of the research objective.
This chapter covers the data collection process. The
following activities were associated with this process:

84
A. Pre-experimental stage. 1. Pre-expert panel process.
a. Develop the initial task sets. b. Conduct the protocol analysis.
al. Obtain information on words and phrases associated with tasks.
bl. Obtain information on information needed for task accomplishment.
c. Develop semantic help system. 2. Expert panel feedback.
a. Validate the task sets. b. Validate the semantic help system. c. Validate the scoring system.
3. Pilot I test. 4. Additional expert panel feedback.
a. Validate the task sets. b. Validate the semantic help system. c. Validate the scoring system.
5. Pilot II test. B. Experimental stage.
1. Test the task sets and the help systems.
Pre-Experimental Preparation
The pre-experimental stage had several activities. One
was to construct a task set that was short enough so
beginners could complete all the tasks within the allotted
time of forty five minutes. Another was to build a
semantic online help system that most beginners understood
from the words and phrases which were collected during the
protocol analysis process.

85
Many different sets of data were collected during the
pre-experimental phase. The following is a list in
sequential order:
1. Protocol task sets, verbal and mathematical. 2. Protocol data. 3. Expert panel data on task sets, help system and
scoring. 4. Pilot I results. 5. Expert panel data on Pilot I results of task
sets, help system and scoring. 6. Pilot II results. 7. Experimental data.
Pre-Protocol Investigation
The task sets were divided into low and high
complexity. The researcher assigned the task sets to their
respective groups based on experience and knowledge. The
results of this process are listed in Appendix C. The low
complexity tasks were activities, such as, editing and
inputting text as shown in Appendix C for the word
processor tasks. Less complex menu-based tasks did not
require the use of the menu command structure more than two
levels deep in the spreadsheet. More complex tasks were
those which were defined as the special functions in the
spreadsheet and the word processor which required the use
of the command menu more than two levels deep in the word

86
processor. The more complex tasks, for example, were
similar in difficulty to generating a mail merge list.
Examples of the more complex tasks assigned are listed in
Appendix C in the high complexity tasks assigned.
Protocol Task Sets
The mathematical and verbal task sets used in the
protocol process were developed by acquiring an original
assignment sheet for BCIS 2610 students. These two task
sets are listed in Appendix C.
Protocol Data
The process of collecting the protocol data involved
several steps. These steps were:
1. Post a signup sheet on the wall to enlist volunteers.
2. Schedule times for the volunteers. 3. Attend and record the sessions with a voice
recording device. 4. Transcribe the verbal data into a computer file. 5. Print the file for later analysis.
Subject interviews were conducted on a one-to-one
basis. The subject would sit in front of a computer. The
subject was given the task set. The researcher would start
the voice recorder. As the subject attempted to complete

87
the tasks on the list, the researcher observed the subject.
Periodically, the researcher asked the subject questions.
Several examples of the questions asked are: (1) "What are
you trying to do?", (2) "What are you thinking?", (3) "What
information do you want?", (4) "What task are you trying to
accomplish?", and (5) "What do you think the assignment
wants you to do?". Another form of communication that
occurred was the response of the researcher to questions.
Most of the subjects were at ease with the tape recorder.
Those who were hesitant in the beginning soon settled down
and concentrated on the tasks at hand. (Protocol data
available on request).
The protocol data collection process was undertaken by
ten subjects in a beginning computer class (BCIS 2610 at
University of North Texas). Ten subjects were used because
that was the number of students who volunteered on the
signup sheet. Before the subjects took part in the
protocol analysis phase, each was required to sign an
informed consent document (Appendix B).

88
Expert Panel Feedback On Proposed Pilot I Data and Semantic Help System
The data obtained from the protocol sessions and the
data concerning the task sets were broken down into
concepts. These concepts were listed in a form that was
presented to the expert panel in their respective fields.
These forms are listed in Appendix D. The semantic help
system was designed and constructed after the protocol
analysis phase and before the first meeting with the expert
panel. The semantic help screens are shown in Appendix E.
When a panelist and the researcher had a meeting they
discussed the following issues: (1) would the two help
systems have the same perceived level of complexity for a
beginner?, (2) was there anything the panelist would change
about the semantic help system?, (3) were the search terms
appropriate for the tasks?, (4) were the information/help
files appropriate for the given tasks?, (5) were the
scoring values appropriate for the given tasks assigned by
the other panelist(s)?, (6) how would the panelist rate
each of the concepts listed in the form (Appendix D)?, (7)
was the classification scheme being appropriately applied?,
and (8) would the panelist change any of the task

89
assignments with regard to high or low complexity that had
been assigned by the researcher? Answers to these
questions were as follows: (1) yes, (2) no, (3) yes, (4)
yes, (5) yes, (6) their values are listed in Appendix D,
(7) yes, and (8) no. All of the experts agreed with the
assignments made and the semantic system developed by the
researcher.
The expert panel was given a set of tasks on paper,
and each member rated these from 0 to 100 on a task
complexity scale. A 0 represented an absence of complexity
and 100 represented the greatest complexity possible
(Appendix D). Some of the panel members wanted
clarification of the term complexity. The feedback given
to all the members by the researcher was an example: 0
means the subject needs no help in accomplishing the task
and the subject perceives the task as very simple, and 100
means there is no way the subject could solve the task
accomplishment problem without some additional human help
and perceives the task as very complex.
There was some misunderstanding initially about the
term task complexity. All the expert panelists thought the
researcher meant task difficulty. Once the term task

90
complexity was explained to the panelists, they seemed to
acknowledge the difference. The expert panelists kept the
definition of task complexity in mind when they filled out
the forms (Appendix D).
Pilot I Test Data
The scores for the first pilot test were obtained by
administering the pre-data collection teaching session.
Then the task sets were administered to the subjects on a
one-to-one basis. The subjects were placed in front of
computers. They were presented the standardized training
information by the researcher. They were asked to complete
the task set in front of them. No questions were answered
by the researcher during the pilot I data collection
procedure. Eight subjects were chosen for this pilot study
because that was the minimum number needed to fill all of
the different combinations of treatments.
Expert Panel Feedback On Proposed Pilot II Data and Task Sets
Because of the result from the first pilot (the result
is discussed in the Data Analysis chapter), the expert
panel had to be re-contacted for additional feedback. This

91
feedback was required because the task sets had to be
changed. This change process is discussed in the Data
Analysis chapter.
The new task sets had to be validated by the expert
panel. The resulting feedback was acquired in the same
manner as the first process used for the pre-pilot I
process.
Pilot II Test Data
The pilot II test data collection process used the
same procedures that were used in the pilot I testing
process. The first eight student volunteers were chosen
for this stage. Each student was administered the task set
by the researcher. The researcher saved and graded the
file(s) that were used if the printout was not generated by
the student. All eight of the students took the pilot II
test at different times during a one-to-one session. All
eight students were given the same instructional teaching
information before starting the process. No questions were
answered during the pilot II data collection process.

92
Experimental Test Data
The process used to collect the experimental test
data was the same as used in the previous pilot tests (I
and II). The questionnaire in Appendix J was given to all
the subjects. The only difference was that each session
had many subjects, not just one. Some subjects tried to
ask questions at the beginning of the data collection
process. When they were referred to the help systems, they
seemed resigned to the process. They probably would have
preferred getting answers from the researcher. That would
have been the "easiest" thing for them to do when they had
a problem. The subjects were reluctant to use the search
mechanism which they perceived, in the beginning of the
session, to be more demanding than asking the researcher.

CHAPTER VI
DATA ANALYSIS
The study consisted of pre-experimental and
experimental stages. Each stage has a number of steps.
The data collection process and data analysis process have
many steps common to each but there are some steps that are
unique to each.
The activities of the data analysis process were to
analyze the data obtained and in the pre-experimental
phase, to make changes where appropriate in the semantic
help system, the scoring assignments, and/or to the task
sets. After the experimental data was collected, an
analysis was conducted to determine if the research
objective had been attained.
This chapter covers the pre-experimental and
experimental data analysis process. The following
activities were associated with these processes:

94
A. Pre-experimental data collection. 1. Analyze and develop the initial task sets. 2. Analyze protocol data. 3. Analyze expert panel feedback from protocol. 4. Analyze data from pilot I. 5. Analyze expert panel feedback from pilot I. 6. Analyze the pilot II data.
B. Experimental data collection 7. Analyze experimental data.
Pre-experimental Data Analysis
The following list of activities occurred during the
pre-experimental data collection process. They are
depicted in chronological order.
Analyze And Develop Protocol Task Sets
The process of acquiring the original task sets was
uneventful. The researcher chose the beginning word
processing and spreadsheet assignments given to the
beginning students of a BCIS 2610 class. The initial goal
of the task set design was to keep the expected time of
completion of each of the task sets to under forty five
minutes. Because of the length of time it took to collect
the protocol data from students, the number of tasks was
shortened in each of the task sets by the researcher. The
modification of the task sets was conducted. The result of

95
that process is the change in task sets from Appendix C to
Appendix G.
Analysis of the Protocol Data
The process of analyzing the protocol data involved
searching through the interviews to determine if any common
concepts occurred in the discussions. If a concept kept
occurring in the questioning process, it was included in
the list of concepts implemented in the semantic help
system. Another method was a matching process between the
assigned tasks and the questions asked by the subjects.
Both of these techniques were used to develop the list of
words and phrases that were implemented in the semantic
help system. Appendix E contains the results of that
effort.
An example of how the protocol information was used
follows. The first three lines of the protocol data show
the discussion on the save process. From the feedback
obtained during the protocol analysis phase, the save
process was included in the semantic phrasing and a text on
saving was included in the textual body.

96
Expert Panel Feedback On Proposed Pilot I Data and Semantic System
The data collected from the first round of the expert
panel are shown in Appendix D. The answers to the
validation questions are listed in the Data Collection
chapter. The conclusion was that everything the researcher
had done seemed to be correct and that no changes to the
semantic help system, to the task sets or to the
preliminary scoring system were needed. The answers
validated the task sets and the semantic help system
perceived complexity level and appropriateness.
An unanticipated bias seemed to affect the answers of
some of the expert panel members as observed by the
researcher. The bias was a feeling and not statistically
measurable (judgmental) perception. The bias was a feeling
the researcher had when asking questions about help systems
in general. Since it was the business of all the expert
panel members to train beginners and others on how to use
these programs, they may have felt threatened by the
possibility that a help system would replace/change their
jobs. The expert panel members felt that everyone must go
through some formal training before using their prospective

97
packages. In other words, true beginners should not be
using the packages; training should come first. The bias
seemed to increase the overall complexity scores during the
first round of the expert panel input.
When the expert panel was shown the completed semantic
help system and asked for advice about the validity of the
help system and its completeness, the panel of experts
suggested that the help information be kept short and
concise. (The semantic help system already exhibited those
characteristics.) The reasoning behind these suggestions
was in their experience beginners have a more difficult
time dealing with situations when there is a higher volume
of information in the beginning. The semantic help system
was constructed with the same level of visual and apparent
complexity (breadth, depth and number of combinations) as
the keyword based help system. The implementation of this
design goal was to prevent perceived differences of help
systems characteristics from affecting the performance of
the subjects. If the semantic help system was too "small",
then the complexity levels of the help systems themselves
might have affected the outcome of the study.

98
Analysis of Pilot I Data
All of the subjects completed all of the tasks in the
allotted time. Every subject made the maximum of 20
points. This was the original goal of the experiment.
Because of this goal, there was no differentiation of
scores among the groups. As a result of this situation,
the researcher added tasks to the task sets in order to
make them longer. This was done after the researcher
consulted with the research committee. The research
committee deemed this action appropriate since no
discrimination in scoring was evident. Since there was no
differentiation in the scores, there was no way to
determine performance differences of the two help systems.
Because task performance can be considered as output
over some time interval, the task list for each group was
increased. The goal of the lengthened task list was that
most subjects would not finish all tasks. The desired
result would be that the average number of tasks performed
would be higher with the semantic help system after
instigating the new time constraints. If lengthening the
task list had not been done, then differentiation of the
treatments would not have been possible.

99
The researcher took tasks that were assigned low
numbers by the experts in the first round or he modified
slightly these tasks that were already in one particular
category and re-entered that modified task or new task into
the task set.
The task sets from the pilot I test to the pilot II
test were modified by the researcher. This difference is
shown from Appendix G to Appendix I. For example, three
tasks were added to the high complexity word processing
task list and six tasks were added to the low complexity
word processing list by the researcher.
An example of the one of the tasks that was added to the
high complexity spreadsheet set was the assignment of
sorting the data in the spreadsheet. The pilot I task sets
are shown in Appendix G and the new task sets used in pilot
II are shown in Appendix I.
Analysis Of Feedback On Proposed Pilot II Task Sets
These new task sets were shown to the expert panel.
They agreed with the classifications of the new task sets,
and they had no recommended changes to make in either the
task sets or in the semantic help system.

100
The scoring system was not fully developed until after
the results of the first pilot data was collected. The
scoring system was finalized by the researcher before the
expert panel was contacted the second time. During the
second meeting the experts validated (with agreement) the
scoring system that was originally designed by the
researcher.
Analysis Of The Pilot II Data
It was evident from the results from pilot II that the
scores the subjects received were clearly different between
the semantic and the keyword help systems. The decision to
conduct the experiment was positive. The results are
listed on the following page.
Conclusions From The Pilot Studies
The subjects had very low motivation levels with
regard to using computer generated help. The low
motivation levels were still true even with a help system
that was highly relevant to what the subject was trying to
accomplish. The low motivation levels may be attributable
to human nature and, thus, future research into the
motivational issue may be useful.

101
Table 2
Pilot II Data
System Complexity Task Score
Semantic Low Verbal 18
Semantic Low Math 17
Semantic High Verbal 11
Semantic High Math 12
Keyword Low Verbal 9
Keyword Low Math 7
Keyword High Verbal 3
Keyword High Math 0
Experimental Data Analysis
Linear regression models were used to analyze the
differences between the performance levels of each
variable. An analysis was done to determine if there were
a significant impact from any of the user characteristics.
A breakdown was conducted to determine if task type
significantly affected performance. A comparison between
the two different application programs was conducted to see
if the help systems might be application dependent.
Demographic data from the demographic data sheet are
provided in this chapter. Sections describing the

102
dependent measure development, interaction effects, and
results from the hypotheses are also included. T-tests
were done to determine if there were differences between
the levels of performance of the paired cells associated
with the secondary hypotheses set.
General Demographics
All of the subjects were enrolled in BCIS 2610, which
is a required beginning computer course for business
majors. The age of the subjects ranged from eighteen to
sixty three years, with a mean of 22.5 years. Fifty nine
percent of the subjects were male. Ninety four out of
three hundred and twenty subjects were eliminated because
they had too high a level of computer experience for the
assigned task or for the assigned program. Only subjects
who ranked their level of computer experience a 3 or less
on the Likert-type scale were included in the study
(Appendix J). Students who ranked themselves as 4 or
higher on a particular application program were excluded
from the data analysis. Three hundred twenty students
participated in the experiment. The total of 213
acceptable subjects were determined after the advanced

103
students were removed. One hundred seven students were not
eligible for their assigned task set.
Subjects who ranked themselves as high experience with
spreadsheet, yet low for word processing and word
processor, were still included in the word processor group
if they were originally assigned there. The assumption was
that knowledge is so different between the concepts of word
processors and spreadsheets that the knowledge does not
transfer across into the other domain. This still
maintains random assignment principles.
The students1 mean for knowledge of spreadsheets was
1.4 with a range from 1 to 5. Students' mean for knowledge
of word processors in general was 2.2 with a range from 1
to 5. The mean for students' knowledge of the spreadsheet
being used in the experiment was 1.3 with a range from 1 to
4. Students' mean for the last indicator, knowledge of the
word processor being tested, was 2.0 with a range of 1 to
5. The subjects were somewhat more knowledgeable about
word processing than about spreadsheets.
The number of subjects for the demographic data in
Table 3 was 213. The mean scores shown in the same table
were all based on a Likert scale which had 5 categories as

104
shown in Appendix J. The scores in Table 3 were a result
of the self rating process of the students. Some of the
students may have exaggerated their scores while others may
have been conservative. The affect should have been evenly
distributed because of random assignment.
Table 3
Demographic Data
Mean Age For All in Years 22.5
Male Percent 59%
Female Percent 41%
Mean for Spreadsheet Knowledge 1.4
Mean for Word Processing Knowledge
2.2
Mean for Tested Spreadsheet 1.3
Mean for Tested Word Processor 2.0
Sample Size 213
All cell sizes ranged from 23 to 32 and were adequate
for the statistical methods used. The cell sizes are
listed in Table 4 on the following page.

105
Linear Regression Model
The dependent measure developed in this research was
SCORE. The experimental model is also listed on the
following page.
Table 4
Experimental Cell Sizes
Task Complexity System Size Cell#
Math High Keyword 25 5
Math High Semantic 30 7
Math Low Keyword 32 6
Math Low Semantic 24 8
Verbal High Keyword 23 2
Verbal High Semantic 27 1
Verbal Low Keyword 25 4
Verbal Low Semantic 27 3
Experimental Model
Y = B1X1 + B2X2 + B3X3 + B4X4 + B5X5 + B6X6 + B7X7 + B8X8 + B9X9
where: Y = SCORE = performance and XI = KVS = keyword versus semantic driven X2 = LVH = low verses high task complexity X3 = W M = verbal versus mathematical task types X4 = K1 = general knowledge about spreadsheets X5 = K2 = general knowledge about word processors

106
X5 = K2 = general knowledge about word processors X6 = K3 = specific knowledge about Lotus X7 = K4 = specific knowledge about word processor X8 = AGE = age of the subject X9 = GENDER = gender of the subject
The previous model had several categories of
variables. The first category was the dependent variable
Y. The data for this variable ranged from zero to the
maximum of twenty. The next category of variables was the
treatment affects. These are shown as XI, X2 and X3. XI
represents whether or not the subject used the semantic
system. If the subject did use the semantic help system,
the value was one; if the subject used the keyword help
system, the subject received a value of zero. X2
represents whether of not the subject was in the low task
complexity class. If the class assigned to the subject was
low, the subject received a one, otherwise it was a zero.
X3 represents whether or not the subject was in the verbal
class. If the subject was assigned a verbal task type, the
subject received a one, otherwise it was a zero. The next
category of variables were concerned with the prior
knowledge of the subject. This classification scheme was
based on a Likert scale from 1 to 5 as shown in Appendix J.

107
It was a self reporting score. The last two variables
relate to demographic type information of age and gender of
the subj ect.
Table 5
Results From The Linear Analysis
Variable PR>F
KVS .001
LVH .9346
W M .0142
K1 .4383
K2 .7953
K3 .9935
K4 .4453
AGE .1836
GENDER .5188
As indicated in Table 5, the keyword driven versus
semantic help system and verbal versus mathematical task
types were the only two variables that show a significant
impact on the dependent variable.

108
Individual Cell Data
The individual cell data was obtained by analyzing the
experimental data. Each of the statistical results was
derived after the non-beginners were removed from the data
pool by the procedure described earlier. All of the
averages presented in Table 6 were relatively low.
However, there were differences in performance levels.
Table 6
Cell Statistics
Cell Obs N Mean Std Dev Min Max
1 27 27 9.7 6.3 1 20
2 25 25 7.6 3.9 2 15
3 27 27 10.0 5.4 1 17
4 32 32 6.2 3.3 0 12
5 25 25 6.0 3.5 1 11
6 24 24 8.0 4.8 0 16
7 30 30 8.3 5.7 0 16
8 23 23 7.6 4.6 0 15
Interaction Effects
All other regression equations using two-way and
three-way interactions were tried using all combinations

109
of variables to detect for interaction effects. None of
the new combinations of variables was significant.
If there had been significance in the interactions,
this would be a reason for concern. Several reasons could
cause the unwanted interaction affect. The first reason
is that the variables are not measuring accurately the
variables under investigation. The variables could be
measuring another phenomenon that is not understood. This
would require further research to identify the measurement
inaccuracy or mismatch. The second reason is the presence
of a significant variable that is not being investigated
that is affecting several of the variables.
Results by Hypotheses
On the following page is a list of the proposed
hypotheses. There is a statistical test associated with
each one. The results of the test statistic is shown
along with the result.
The conclusions for each of the hypothesis are
discussed in Chapter VII on conclusions. In general most
of the subset hypotheses were not rejected.

110
Table 7
Results For Each Hypothesis
Hypothesis Test Statistic Result Value
HoAl Regression reject .001
HoA2 Regression fail to reject .9346
HoA3 Regression reject .0146
HoBl t-test, 1 way fail to reject .15
HoB2 t-test, 1 way fail to reject .87
HoCl t-test, 1 way fail to reject .14
HoC2 t-test, 1 way reject .002
HoDl t-test, 1 way "fail to reject .13
HoD2 t-test, 1 way fail to reject .12
HoEl t-test, 1 way fail to reject .65
HoE2 t-test, 1 way fail to reject .80

CHAPTER VII
CONCLUSIONS
Conclusions on the outcomes of the research are
presented. Limitations of the research and directions for
future research are also discussed.
HoAl: There will be no difference in task performance between subjects using the keyword and semantic help systems.
HoA2: There will be no difference in task performance between subjects performing high complexity tasks and low complexity tasks.
HoA3: There will be no difference in task performance between subjects performing verbal and mathematical tasks.
HoBl: There will be no difference in task performance between subjects using the semantic online help system and subjects using the keyword driven help system when the subjects are given a low complexity level verbal task.
HoB2: There will be no difference in task performance between subjects using the semantic online help system and subjects using the keyword driven help system when the subjects are given a high complexity level verbal task.

112
HoCl: There will be no difference in task performance between subjects using the semantic online help system and subjects using the keyword driven help system when the subjects are given a low complexity level mathematical task.
HoC2; There will be no difference in task performance between subjects using the semantic online help system and subjects using the keyword driven help system when the subjects are given a high complexity level mathematical task.
HoDl: There will be no difference in task performance between subjects using the semantic online help system given a verbal task type and varying the task complexity.
HoD2: There will be no difference in task performance between subjects using the keyword driven online help system given a verbal task type and varying the task complexity.
HoEl: There will be no difference in task performance between subjects using the semantic online help system given a mathematical task type and varying the task complexity.
HoE2: There will be no difference in task performance between subjects using the keyword driven online help system given a mathematical task type and varying the task complexity.
Conclusions For Each Hypothesis
The preceding is a list of the hypotheses studied in
this research. The result for each is discussed along
with the implication from either the rejection or non-
rejection of the hypothesis.

113
There will be no difference in task performance
between subjects using the keyword and semantic help
systems. This hypothesis was rejected. It became evident
from the start of the data collection process as early in
this study as the first pilot phase that the semantic help
system was much easier and more efficient to use than the
keyword help system. The students were not ready and/or
ill equipped to handle the foreign words and phrases that
were built into the keyword help system. The students
just seemed to stare or look at the researcher at times,
hoping the researcher would take pity on them in their
predicament. Remember, the students in the experimental
data collection phase thought this would negatively affect
their grade. Even with this consequence, the motivation
level to use the help system of either type seemed low.
The teachers of the students in the study later informed
the students that experimental participation would not
negatively affect their grade. But the negative affects
listed above, such as low motivation and frustration
seemed less important if the student just tried the
semantic system. If the student just tried the semantic
system at the beginning when continuation was impossible

114
the student was able to use the system successfully. As a
result, the student was more likely to use the system
again. Increased used usually resulted in a higher score.
There will be no difference in task performance
between subjects performing high complexity tasks and low
complexity tasks. This hypothesis was not rejected. It
appears that almost all tasks are perceptually complex to
a beginner. It could be that the instrument in the low
complexity category was not discriminatory. It could also
be that the subject needs a minimal amount of
understanding concerning the concepts and words being used
for a given task. The significance for this finding is
either people need to learn a minimum number of concepts,
words and phrases for a given task before feedback becomes
meaningful or the system in use must change to present
people with familiar terms, phrases and concepts so people
can then extend their own understanding and accomplish the
task.
There will be no difference in task performance
between subjects performing verbal and mathematical tasks.
This hypothesis was rejected at a less significant level
than the search mechanism hypothesis. Although the

115
relationship is less pronounced, it is still
representative of the fact that most people in our society
talk before they attempt number concepts. People usually
must be able to communicate in our society in order to
function. This fact probably influences the overall
average scores people assign themselves relative to their
prior knowledge about spreadsheets. One of the first
functions automated in the work environment is typing.
The skills used in typing are directly transferable to the
process of using a word processor. The demographics of
the student population attending University of North Texas
have traditionally been younger full-time students, but
this is changing. Many older people are either entering
or re-entering the academic setting. This phenomenon
could significantly impact the research results of another
study, especially if the disparity in the prior knowledge
numbers becomes greater.
There will be no difference in task performance
between subjects using the semantic online help system and
subjects using the keyword driven help system when the
subjects are given a low complexity level verbal task.
This hypothesis was not rejected. This finding is

116
surprising. The failure to discriminate could be the
results of two factors. One, the measurement instrument
was not sensitive enough. Two, the complexity level was
not low enough. This caused confusion in the subjects,
and they could not overcome this confusion in the time
frame given.
There will be no difference in task performance
between subjects using the semantic online help system and
subjects using the keyword driven help system when the
subjects are given a high complexity level verbal task.
This hypothesis was not rejected. After the researcher
observed the students unsuccessfully attempt to accomplish
the tasks assigned to them, it is possible that if the
task complexity level is too high, no currently available
help system technology would have helped them solve the
problem of task accomplishment. Until the subject
develops a critical mass of relevant information that can
be used as a base from which the subject can extend and
make inferences about different problem domains, all tasks
will be perceived as too complex and unaccomplishable.
There will be no difference in task performance
between subjects using the semantic online help system and

117
subjects using the keyword driven help system when the
subjects are given a low complexity level mathematical
task. This hypothesis was not rejected. One possible
condition could have existed. The subjects were not at
all familiar with concepts surrounding mathematical
issues. Therefore, they were unable to understand the
task to be accomplished. Since most students had a lower
level of understanding about mathematical than verbal
concepts, the students would have less understanding in
how the help system could help them accomplish the given
task.
There will be no difference in task performance
between subjects using the semantic online help system and
subjects using the keyword driven help system when the
subjects are given a high complexity level mathematical
task. This hypothesis was rejected. Scores for the
semantic systems were significantly different from the
keyword systems. The significance of the t-test for this
hypothesis is consistent with the regression equation
showing that the independent variables of keyword and
semantic online help systems significantly contribute to
explaining the variation in SCORE. Ordinarily numerous

118
t-tests can result in a spurious rejection, however, since
the regression equation for HoAl was so significant, one
would expect at least one of the t-tests to be
significant.
There will be no difference in task performance
between subjects using the semantic online help system
given a verbal task type and varying the task complexity.
This hypothesis was not rejected. It seems that task
complexity is not a significant variable. It could be
because to beginners all tasks are complex. Even though
the subjects were using the more efficient and easier help
system, the scores between the two complexity levels were
the same.
There will be no difference in task performance
between subjects using the keyword driven online help
system given a verbal task type and varying the task
complexity. This hypothesis was also not rejected. Even
though task complexity to beginners may appear to be
complex for all tasks, for this hypothesis the subjects
were using the keyword help system. From observation it
was evident that the keyword system was more difficult for

119
the students to use. This could have been the over-riding
factor in the failure to reject this hypothesis.
There will be no difference in task performance
between subjects using the semantic online help system
given a mathematical task type and varying the task
complexity. This hypothesis was not rejected. Even the
ease of use and the efficiency of the semantic system were
not significant to overcome the potential lack of
understanding on the part of the subjects related to
mathematical tasks and concepts.
There will be no difference in task performance
between subjects using the keyword driven online help
system given a mathematical task type and varying the task
complexity This hypothesis was not rejected. The
combination of mathematical type task and the use of the
keyword help system was enough to cause much frustration
and low task accomplishment for both groups.
From the additional statistics shown in Table 7 in
Chapter 6 other conclusions can be made. For example, the
comparison between cells 5 and 7 was significant even
though the numbers are relatively low. Beginners were
expected to have low scores.

120
Research Conclusions and Recommendations
As the data were being collected, it was evident that
the subjects had a much easier time using the semantic
help system. The keyword based help system, was more
difficult to use. One of the phenomenon that occurred
during the data collection phase was that subjects tried
to ask questions. Although end user interaction with the
researcher was not one of the variables under
investigation, (it would have invalidated the experiment
if answers were given), it was evident that those who were
assigned the semantic system made fewer attempts to ask
questions.
A major recommendation for this research topic is the
investigation and development of a task difficulty
variable. The task difficulty variable could include
components of the knowledge the subject has concerning the
task domain and other task characteristics that may affect
the task difficulty level. This research used task
complexity in place of task difficulty because of the
literature base.
Based on the experience of the data gathering
process, a following hypothetical model is presented in

121
Figure 7. The model shows the relationship of task
complexity to computer knowledge. As the subject acquires
more knowledge, the task complexity quotient of any given
concept or a set of concepts decreases.
Level of Complexity
Very Complex
I Very Simple
Computer Knowledge
Figure 7. Task Complexity Gradient
This research demonstrates that it is possible to
influence productivity with a well designed help system.
In a domain where information is limited, it is possible

122
to construct a help system that will increase task
performance. In the business world, if the cost of
construction is lower than the added benefits, the company
should at least investigate the proposition.
Limitations of the Research
The conclusions of this study cannot be projected to
any populations other than beginners. All of the subjects
of this study were beginners. The tendency of the
population was to be oriented more toward word processors;
however, this tendency did not influence the outcomes.
The apparent complexities of the two help systems were
similar to a beginner; however, if the semantic help
system had to compete in the business world, it would need
a much bigger knowledge base and many more entry phrases.
A design limitation was the use of a five-point scale
to measure prior knowledge. First, prior knowledge was a
perceived value and was not measured by a subject's actual
knowledge. Second, only a five-point scale was used. If
the test had been to measure actual knowledge, the task
complexity results may have been different.

123
This experiment did not study the actual behaviors of
the subjects as they attempted to complete the tasks. It
measured only the outcomes of their behavior.
Directions for Future Research
Future research could be improved by making several
changes to this study. The first would be to change he
task characteristic to task difficulty. Levels of
complexity may not be directly related to the difficulty
level a subject has in task accomplishment. The second is
changing the time constraints of the activity being
researched. Add the time variable as a dependent
variable. The third is to add a questionnaire to test the
actual level of knowledge of the subject with regard to
the task domain and the program(s) being used.
Future research could include a different method of
classifying tasks. The tasks could be designed to address
different types of brain activity or different tasks
associated with the business environment.
Future research should include non-beginners. The
design required for more advanced computer users may be
different than for beginners. Future research should, at

124
a minimum, include prior testing of knowledge levels about
the task(s) and the programs used in the experiment.
There are several avenues a researcher may take in
conducting future research in help systems. Replication
of this research would be helpful. With the advances in
artificial intelligence, it could be included in the
construction of future help systems. Hyper-text is
another capability that could be investigated.
Investigation into a task difficulty variable may provide
significant insight in the help systems topic.
Summary
This research developed a framework and an
experimental model which may be used by other researchers.
This research is apparently the only one to date that has
included task type and task complexity. The results of
this research partially support its purpose that search
mechanism, with respect to task type and complexity,
affects the performance level of the user.
Future research should focus on whether task type,
task difficulty and how problem solving characteristics
may influence the design of online help systems.

125
Researchers should carefully match the online help system
design with task characteristics and user characteristics.
They should also include measures of both quantity and
quality with regard to productivity.

APPENDIX A
LIST OF DEFINITIONS
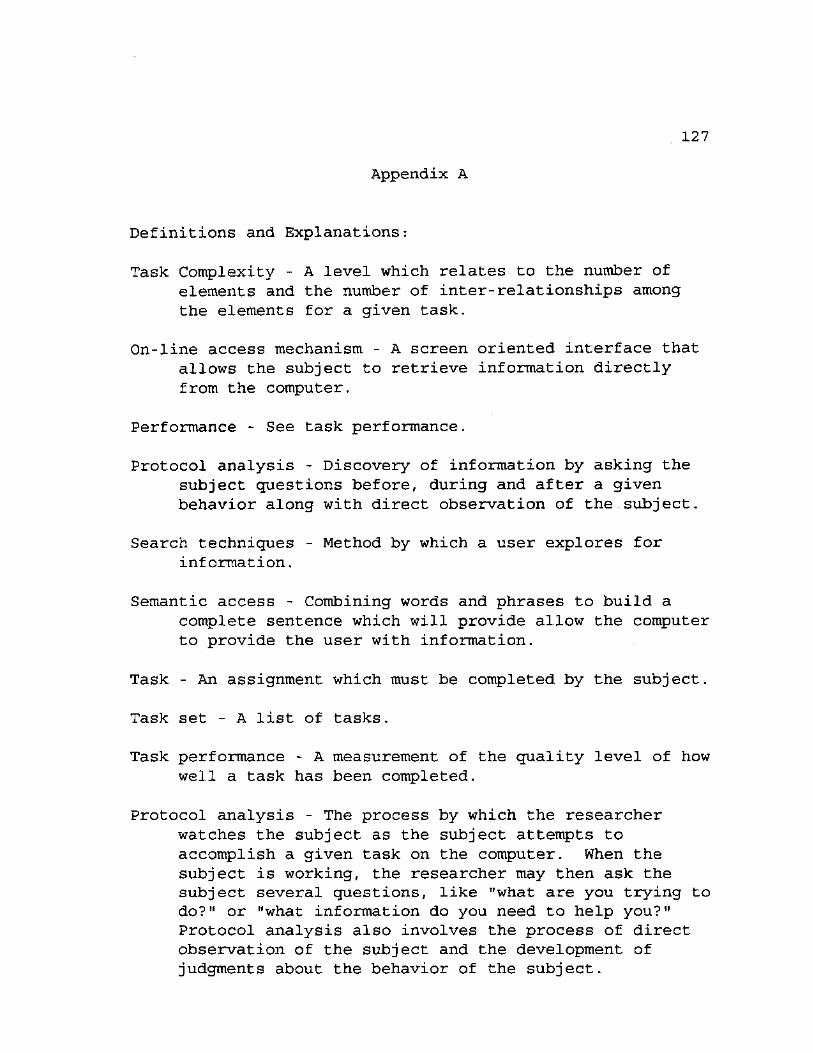
127
Appendix A
Definitions and Explanations:
Task Complexity - A level which relates to the number of elements and the number of inter-relationships among the elements for a given task.
On-line access mechanism - A screen oriented interface that allows the subject to retrieve information directly from the computer.
Performance - See task performance.
Protocol analysis - Discovery of information by asking the subject questions before, during and after a given behavior along with direct observation of the subject.
Search techniques - Method by which a user explores for information.
Semantic access - Combining words and phrases to build a complete sentence which will provide allow the computer to provide the user with information.
Task - An assignment which must be completed by the subject.
Task set - A list of tasks.
Task performance - A measurement of the quality level of how well a task has been completed.
Protocol analysis - The process by which the researcher watches the subject as the subject attempts to accomplish a given task on the computer. When the subject is working, the researcher may then ask the subject several questions, like "what are you trying to do?" or "what information do you need to help you?" Protocol analysis also involves the process of direct observation of the subject and the development of judgments about the behavior of the subject.

128
Semantic help system - This is a type of interface that lets the user construct a question to retrieve help type information. As an example, let us assume the subject wants information on how to format a 720K disk. The sentence the subject would construct would involve four different phrases:
1. How do I 2. format 3. a disk 4. size 720K
To construct a whole sentence, the screen would have four different windows showing. An example of the semantic type of interface (using three windows) is shown in Appendix F. The cursor would move to the phrase or word in the upper left hand corner and the subject would choose "How do I". Then the subject would go to the next window and choose another word -"format". Then the subject would go to the third windows and choose the phrase - "a disk". Finally, the subject would go to the fourth window and choose the size of the disk, in this case - 720K. After the sentence is constructed, the subject tells the computer to begin the search. The phrase construction creates a unique address. This address is used to determine which file will be shown on the screen. Hopefully the file chosen contains the information the subject needs to accomplish the task.
Keyword based online help system - This system is implemented by presenting the subject with a list of words. To get help, the subject chooses the correct word and the system enters another level of words. Going ever deeper into sub-levels of keywords occurs until the subject has specified enough words so the system generates helpful information. The difference between the semantic and the keyword-based system is that the subject must make a choice for each level in the keyword lists. For the semantic system, the subject constructs a sentence by choosing phrases.

129
Task type - Tasks can be classified in different ways. A mathematical task involves the manipulation and understanding of numbers. A verbal task involves the understanding and manipulation of words.

APPENDIX B
AN INFORMED CONSENT DOCUMENT
DURING THE PROTOCOL AND PRE-EXPERIMENTAL PHASES

131
Appendix B An Informed Consent Document
During The Protocol and Pre-experimental Phases
Name of Subject
Name of Investigator
1. I hereby consent to a protocol analysis before, during and after the completion of a class assignment.
2. I have (seen, heard) a clear explanation and understand the nature and procedure or treatment; possible appropriate alternative procedures that would be advantageous to me {him, her): and the attendant discomforts or risks involved and the possibility of complications which might arise. I have (seen, heard) a clear explanation and understand the benefits to be expected. I understand that the procedure or treatment to be performed is investigational and that I may withdraw my consent at any time without prejudice or penalty. With my understanding of this, having received this information and satisfactory answers to the questions I have asked, I voluntarily consent to the procedure or treatment designated in paragraph 1 above. If the subject believes there are any negative feelings and/or outcomes, the subject may contact the dissertation committee chairman, Dr. Michael Vanecek or the department chairman, Dr. Jack Becker.
Date
Signed Subject:
Signed Investigator:

APPENDIX C
PRE-EXPERIMENTAL PROTOCOL
TASK LISTS

133
Appendix C
Pre-experimental Protocol Spreadsheet Tasks
Low Task Complexity
You are to take the spreadsheet found in a file called FILEONE and add one additional column of data. Place the following values in column C.
A1 B C 2 Officers' Salaries 333,000 3 Workers' Salaries 222,000 4 Payroll Tax 8,000 5 Depreciation 7,777 6 Postage 999 7 Dues 224 8 Computers 10,000 9 Maintenance 1,000
10 TOTAL

134
Appendix C
Pre-experimental Protocol Spreadsheet Tasks
High Task Complexity
The worksheet on the next page should be prepared according to these directions.
1. Set the following column widths: Column A = 20. Column B, C, & D = 12 each. Column E = 16.
2. You are to use the prefixes ' A " to enter the words "Left", "Center" and "Right" to justify correctly Or use the /Range Label command to position the labels appropriately.
3. Use the backslash (\) to cause a character repeat/fill for each of these characters: * = -.
4. Use the @NOW function to acquire the current system time/date with Date formats 1, 2 & 3, and Time formats 1 & 2 .
5. Enter the following numeric \values in columns B, C, D & E respectively:
0.987654321 9.87654321 9876.54321 987654321
Use these numbers for all numeric format rows and format as indicated. For example: Percent (P2) means format all values in that row as a percentage display with 2 decimal places.

135
Appendix C
Pre-experimental Protocol Spreadsheet Tasks
High Task Complexity
(Student name) BCIS 2610.??? Lotus Assignment
Label justify Character repeat
Repeat * Repeat =
Repeat -Format
Date Time General (Default) Fixed (Fl)
Fixed (F4) Scientific (S2) Currency (CO) Currency (C2) Comma {, 0) Comma {, 3) Percent (P0) Percent (P2)
Left Center
* * * * * * * * * * * *
07-Jan-91 03:20:57 PM 0.987654321
1.0 0.9877
9.88E-01 $1
$0.99 1
0.988
99% 98.77%
Right
07-Jan 03:20 PM
9.87654321 9.9
9.8765 9.88E+00
$10 $9.88
10 9.877
987.65% 987.65%
Jan-91
9876.54321 9876.5
9876.5432 9.88E+03
$9,877 $9,876.00
9,876 9,876,543
987654% 987654.32%
987654321 987654321.0
987654321.0000 9.88E+08
$987,654,321 $987,654,321.00
987,654,321 987,654,321.000
98765432100% 98765432100.00%

136
Appendix C
Pre-experimental Protocol Word Processing Tasks
Low Task Complexity
Below, you will find a rough draft of the history of the ABC computer found in Computer Fundamentals for an Information Age by Shelly and Cashman on p. 2.1 - 2.2. You are to make the necessary adjustments listed bellow. You will find the uncorrected version in a file called WP-1R.TXT on your disk.
Evaluation:
3pts Get the file.
2pts Place your name and date at the top of the page.
2pts Delete the second paragraph.
3pts Put your address at the bottom of the page.
2pts Put your phone number after paragraph one.
2pts Delete the last sentence in the second paragraph.
2pts Add two blank lines under your name.
lpts Tab every paragraph.
3pts Print the document.

137
How Did It All Begin?
In the late 1930's, Dr. John V. Atanasoff, a mathematics professor at Iowa State College in Ames, Iowa, required a calculating device to perfom mathematical operations for 20 masters and doctoral candidates. After examining various mechanical calculating devices then available, Atanasoff concluded that none of the devies was adequate for his needs. Instead, he felt the solution to his problem was in the developmetn of a digital computing device based upon electronics.
Returning to the laboratory, Atanasoff, together with his assistant Cliffor Berry, finished the design and began building the first electronic digital computer. It is generally agreed that the design of the "ABC" provided the foundatoin for the next advances in the develpment to the electonic digital computer.
Atanasoff, therefore, set about designming his own machine. He faced numerous problems in designing the logic circuitry for the machine. As with many inventors, some ideas were easier to come bw than others. In the winter of 1937-38, frustrated at not being able to complete the design, he drove across the Mississippi River into Illinois and settled in for a drink in a small roadside tavern. For some reason which hi could not later identify, the ideas for computer memory and the associated logic which would not come to him in thelaboratory come to him as he relaxed in the bar.
Thus, some of the basic comcepts for the electoronic digital computer were formulated that night.
by Shelly and Cashman Computer Fundamentals for an Information Age p. 2.1 - 2.2

138
Appendix C
Pre-experimental Protocol Word Processing Tasks
High Task Complexity
Below, you will find a rough draft of the history of the ABC computer found in Computer Fundamentals for an Information Age by Shelly and Cashman on p. 2.1 - 2.2. You are to make the necessary corrections, including indentation of each paragraph and spacing, then store the corrected version in a WP-l.TXT file. You will find the uncorrected version in a file called WP-1R.TXT on your disk. Print once in PICA, lOcpi and once in ELITE, 12 cpi.
Evaluation: 2pts Place your name and date, top 2 lines flush right.
3pts Format the document to have 1.5" right and left margins; a top margin of 2"; right justify off; and page numbering at the center of the bottom.
2pts Spelling corrections.
2pts Insert the sentence, "They named the machine the Atanasoff-Berry-Computer, or simply the 'ABC'." after the first sentence in the last paragraph, using the typeface given.
2pts Boldface the sentence you just added and Dr. John V. Atanasoff in the first sentence.
2pts Center the title. Underline the title of the source book by Shelly and Cashman.
3pts. Move the paragraph starting with "Atanasoff, therefore, ..." to be the second paragraph after the paragraph ending with "... based upon electronics."
2pts Hardcopy in PICA. 2pts Hardcopy in ELITE.

139
How Did It All Begin?
In the late 1930's, Dr. John V. Atanasoff, a mathematics professor at Iowa State College in Ames, Iowa, required a calculating device to perfom mathematical operations for 20 masters and doctoral candidates. After examining various mechanical calculating devices then available, Atanasoff concluded that none of the devies was adequate for his needs. Instead, he felt the solution to his problem was in the developmetn of a digital computing device based upon electronics.
Returning to the laboratory, Atanasoff, together with his assistant Cliffor Berry, finished the design and began building the first electronic digital computer. It is generally agreed that the design of the "ABC" provided the foundatoin for the next advances in the develpment to the electonic digital computer.
Atanasoff, therefore, set about designming his own machine. He faced numerous problems in designing the logic circuitry for the machine. As with many inventors, some ideas were easier to come bw than others. In the winter of 1937-38, frustrated at not being able to complete the design, he drove across the Mississippi River into Illinois and settled in for a drink in a small roadside tavern. For some reason which hi could not later identify, the ideas for computer memory and the associated logic which would not come to him in thelaboratory come to him as he relaxed in the bar. Thus, some of the basic comcepts for the electoronic digital computer were formulated that night.
by Shelly and Cashman Computer Fundamentals for an Information Age p. 2.1 - 2.2

APPENDIX D
EXPERT PANEL RANKINGS
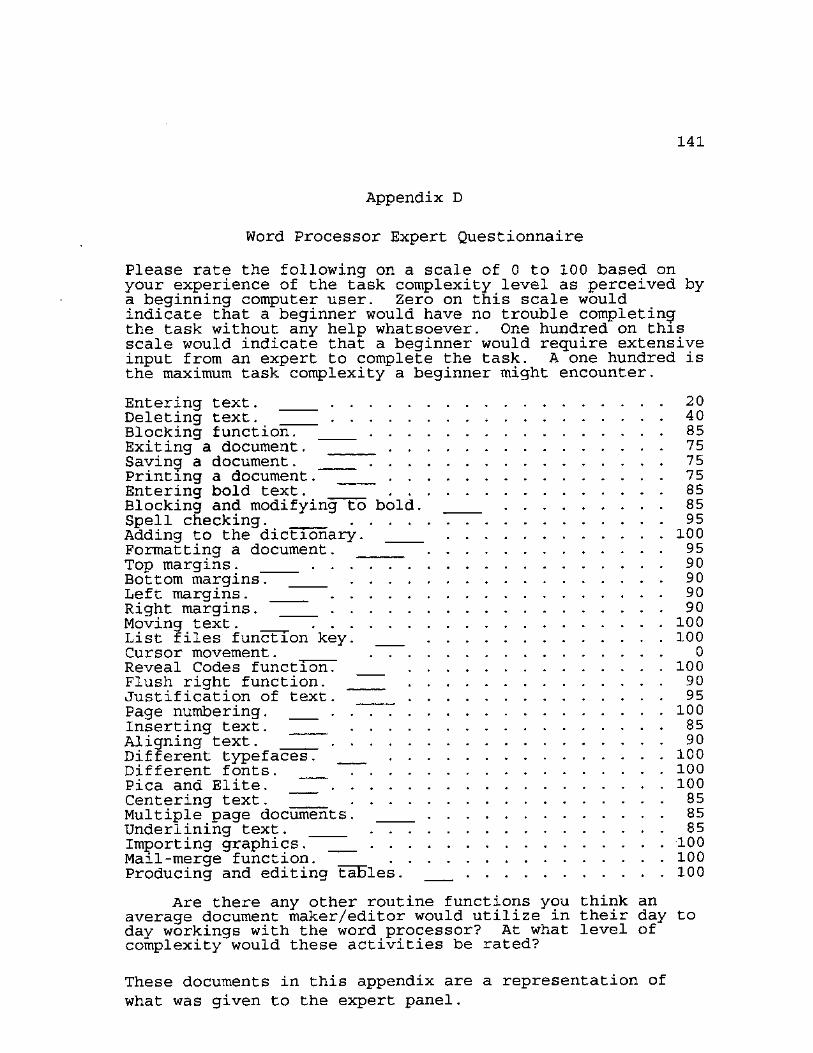
141
Appendix D
Word Processor Expert Questionnaire
Please rate the following on a scale of 0 to 100 based on your experience of the task complexity level as perceived by a beginning computer user. Zero on this scale would indicate that a beginner would have no trouble completing the task without any help whatsoever. One hundred on this scale would indicate that a beginner would require extensive input from an expert to complete the task. A one hundred is the maximum task complexity a beginner might encounter.
Entering text. 20 Deleting text. * 40 Blocking function. 85 Exiting a document. 75 Saving a document. 75 Printing a document. 75 Entering bold text. 85 Blocking and modifying to bold. 85 Spell checking. 95 Adding to the dictionary. 100 Formatting a document. 95 Top margins. 90 Bottom margins. 90 Left margins. 90 Right margins. 90 Moving text. 100 List files function key. 100 Cursor movement. 0 Reveal Codes function. 100 Flush right function. 90 Justification of text. 95 Page numbering. 100 Inserting text. 85 Aligning text. 90 Different typefaces. 100 Different fonts. 100 Pica and Elite. 100 Centering text. 85 Multiple page documents. 85 Underlining text. 85 Importing graphics. 100 Mail-merge function. 100 Producing and editing tables. 100
Are there any other routine functions you think an average document maker/editor would utilize in their day to day workings with the word processor? At what level of complexity would these activities be rated?
These documents in this appendix are a representation of what was given to the expert panel.

142
Word Processor Expert Questionnaire
Please rate the following on a scale of 0 to 100 based on your experience of the task complexity level as perceived by a beginning computer user. Zero on this scale would indicate that a beginner would have no trouble completing the task without any help whatsoever. One hundred on this scale would indicate that a beginner would require extensive input from an expert to complete the task. A one hundred is the maximum task complexity a beginner might encounter.
Entering text. 20 Deleting text. 40 Blocking function. 75 Exiting a document. 55 Saving a document. 45 Printing a document. 35 Entering bold text. 80 Blocking and modifying to bold. 95 Spell checking. 55 Adding to the dictionary. 100 Formatting a document. 75 Top margins. 70 Bottom margins. 70 Left margins. 70 Right margins. 70 Moving text. 95 List files function key. 40 Cursor movement. 40 Reveal Codes function. 100 Flush right function. 80 Justification of text. 80 Page numbering. 75 Inserting text. 75 Aligning text. 80 Different typefaces. 100 Different fonts. 100 Pica and Elite. 100 Centering text. v 75 Multiple page documents. 45 Underlining text. 65 Importing graphics. 100 Mail-merge function. 100 Producing and editing tables. 100
Are there any other routine functions you think an average document maker/editor would utilize in their day to day workings with the word processor? At what level of complexity would these activities be rated?

143
Spreadsheet Expert Questionnaire
Please rate the following on a scale of 0 to 100 based on your experience of the task complexity level as perceived by a beginning computer user. Zero on this scale would indicate that a beginner would have no trouble completing the task without any help whatsoever. One hundred on this scale would indicate that a beginner would require extensive input from an expert to complete the task. A one hundred is the maximum task complexity a beginner might encounter.
Using the Lotus help system. 30 Entering commands. 60 Moving the cursor around the spreadsheet. . . . . 20 Entering a label, left justified 45
centered 55 right justified. 55
Editing a label. 60 Entering a number. 10 Using the range format command. 70 Setting column widths. 40 Entering the @now function. 30 Formatting the @now function fordifferent dates. 65 Formatting the @now function for different times. 75 Cell fill/repeat character. (\ key). 40 Using the copy command, (ranges) 85 Using the move command, (ranges) 85 Saving a spreadsheet. 40 Retrieving a spreadsheet. 40 Understanding the differences among functions,
equations and commands. . . 70
The printing process, window or range 45 top of page 35 cell formula formats . . . . 90 printer commands and codes . 85 margins 50 printing m text format . . . 65 exiting the printing process. 30
The escape key and how it is used. 45 The different modes (editing, error, ready, etc.) 55 The location of the cursor. 20 Creating graphs. 80 Creating macros. 85 Conducting data sorts. 90 Data extraction with input and output windows. . . 95
Are there any other routine functions you think an average spreadsheet user would utilize in their day to day workings of a spreadsheet? At what level of complexity would these activities be rated?

144
Spreadsheet Expert Questionnaire
Please rate the following on a scale of 0 to 100 based on your experience of the task complexity level as perceived by a beginning computer user. Zero on this scale would indicate that a beginner would have no trouble completing the task without any help whatsoever. One hundred on this scale would indicate that a beginner would require extensive input from an expert to complete the task. A one hundred is the maximum task complexity a beginner might encounter.
Using the Lotus help system. 90 Entering commands. 90 Moving the cursor around the spreadsheet. . . . . 10 Entering a label, left justified 30
centered 75 right justified. 75
Editing a label. 30 Entering a number. 15 Using the range format command. 70 Setting column widths. 70 Entering the @now function. 35 Formatting the @now function for different dates. 95 Formatting the @now function for different times. 95 Cell fill/repeat character. (\ key). 70 Using the copy command, (ranges) 80 Using the move command, (ranges) 80 Saving a spreadsheet. 50 Retrieving a spreadsheet. 50 Understanding the differences among functions,
equations and commands. . . 80
The printing process, window or range 65 top of page 25 cell formula formats . . . . 95 printer commands and codes . 95 margins ^ 90 printing in text format . . . 95 exiting the printing process. 10
The escape key and how it is used. 15 The different modes (editing, error, ready, etc.) 90 The location of the cursor. 40 Creating graphs. 100 Creating macros. 100 Conducting data sorts. 100 Data extraction with input and output windows. . . 100
Are there any other routine functions you think an average spreadsheet user would utilize in their day to day workings of a spreadsheet? At what level of complexity would these activities be rated?

145
Spreadsheet Expert Questionnaire
Please rate the following on a scale of 0 to 100 based on your experience of the task complexity level as perceived by a beginning computer user. Zero on this scale would indicate that a beginner would have no trouble completing the task without any help whatsoever. One hundred on this scale would indicate that a beginner would require extensive input from an expert to complete the task. A one hundred is the maximum task complexity a beginner might encounter.
Using the Lotus help system. 60 Entering commands. 20 Moving the cursor around the spreadsheet. . . . . 30 Entering a label, left justified 15
centered 35 right justified. 35
Editing a label. -. . 30 Entering a number. 15 Usincf the range format command. 60 Setting column widths. 60 Entering the @now function. 10 Formatting the @now function for different dates. 90 Formatting the @now function for different times. 90 Cell fill/repeat character. (\ key). 20 Using the copy command, (ranges) 80 Using the move command, (ranges) 80 Saving a spreadsheet. 30 Retrieving a spreadsheet. 30 Understanding the differences among functions,
equations and commands. . . 40
The printing process, window or range 30 top of page 25 cell formula formats . . . . 85 printer commands and codes . 95 margins 80 printing in text format . . . 80 exiting the printing process. 15
The escape key and how it is used. 25 The different modes (editing, error, ready, etc.) 45 The location of the cursor. 25 Creating graphs. 90 Creating macros. 95 Conducting data sorts. : . . . 95 Data extraction with input and output windows. . . 100
Are there any other routine functions you think an average spreadsheet user would utilize in their day to day workings of a spreadsheet? At what level of complexity would these activities be rated?

APPENDIX E
SEMANTIC HELP SYSTEM INTERFACES

147
Appendix E
Semantic Interface For the Word Processor
I need help on:
moving the cursor deleting inserting changing the appearance to formatting text to saving printing retrieving centering imputing characters as moving margin placing changing getting a list of
around in the document. characters and blocks of things. characters, blank lines & page breaks bold, underlined and/or centered, flush right in appearance, the document,. the document. a document. words, phrases and paragraphs. italics. paragraphs to different locations. changes: left, right, top & bottom, page numbers on the page. character pitch and size (cpi). files.
F10 to execute
Just hit the ESCape key to exit back to your document.

148
Appendix E
Semantic Interface For Spreadsheet
r - • ' i
! I need help on: 1
| moving the cursor i i i j| around in the spreadsheet. |
| deleting || characters and cells. I | inserting || characters and numbers. | | changing the appearance to || decimal places and dollar formats. | | widening or shortening || the column widths. | | saving || the spreadsheet. | | printing || the spreadsheet. | | retrieving || a spreadsheet. | | entering || equations and functions. | | reordering the list by || sorting. | | defining a || cell, range and location of cursor. | | replacing a cell with || correct characters. | | executing a || command. | | using the || escape key. | | generating || a graph. j | overall || concepts. |
I 1 i
i || F10 to execute | i i i
Just hit the ESCape key to exit back to your spreadsheet.

APPENDIX F
STANDARD HELP SYSTEM INTERFACES

150
Appendix F
Standard Help Screen For the Word Processor
Word processor Template (Enhanced Layout)
-Fl- -F2- -F3- -F4-| Shell | Thesaurus j SETUP
Cancel
Spell Replace <-SEARCH ->Search
| Screen | |ReVeal Codes | | SWITCH | i Help |
Move Block
->Indent<-->Indent
, F5 | Text In/Out | j Mark Text | |DATE/OUTLINE j
List
-F6- -F7- -F8-Tab Align | Footnote | Flush Right |Columns/Table)
CENTER j PRINT ' j Bold | Exit j
Font Style FORMAT
Underline
-F9- -F10~ -Fll- -F12-Merge/Sort (Macro Define | | Graphics | Macro | |
MERGE CODES j RETRIEVE | j End Field | Save (Reveal Codes | Block
Press 1 to view the PC/XT keyboard template Selection: 0 (Press ENTER to exit Help)

151
Appendix F
Standard Help Screen For the Spreadsheet
Al: HELP
1-2-3 Help Index
About 1-2-3 Help Linking Files 1-2-3 Main Menu Cell Formate Macro Basics /Add-In Cell/Range References Macro Command Index /Copy Column Widths Macro Key Names /Data Control Panel Mode Indicators /File Entering Data Operators /Graph Error Message Index Range Basics /Move Formulas Recalculation /Print ©Function Index Specifying Ranges ' /Quit Function Keys Status Indicators /Range Keyboard Index Task Index /System Learn Feature Undo Feature /Worksheet
To select a topic, press a pointer-movement key to highlight the topic and then press ENTER. To return to a previous Help screen, press BACKSPACE. To leave Help and return to the worksheet, press ESC.
25-Jan-91 08:03 PM NUM

APPENDIX G
PILOT I PRE-EXPERIMENTAL TASK LIST

153
Appendix G
Pilot I Pre-experimental Task List
Word Processor High Complexity
1. Retrieve TEST2.DOC from drive A:.
2. Put your name and section at the bottom of the document.
3. Change left, right, top and bottom margins to 2".
4. Italicize and underline the first occurrence of the word transistor.
5. Save the modified document on drive a: using the first 8 characters of your last name as the filename.
6. Print the document.

154
Appendix G
Pilot I Pre-experimental Task List
Word Processor Low Complexity
1. Retrieve the file called TEST.DOC from the A: drive.
2. At the top of the document, put your name, date and address in left justified format.
3. Insert a blank line after the last paragraph in the document then type the following "This sentence is in bold." Make sure this sentence is in bold as you type it into the document. The bold sentence should be left-justified.
4. Insert another blank line after the boldfaced sentence. Then type in "This is an underlined sentence." This sentence should be the only sentence that is underlined. Don't underline the period at the end of the sentence.
5. Insert another blank line after the underlined sentence. Then type in the following "This sentence is centered." The text should be automatically centering and readjusting as you type.
6. Save the document to drive A: using your last name, up to 8 characters, as the filename.
7. Print the document.

155
Appendix G
Pilot I Pre-experimental Task List
Spreadsheet High Complexity
1. Retrieve a spreadsheet called Atgrades frqm drive A:.
2. Put your name and section number in cell Al.
3. Average each students' grades.
4. Compute the class average.
5. Sort the data by each individual average grade and print the results.
6. Save the spreadsheet on drive A: using the first 8 characters of you last name for the filename.
7. Print the whole spreadsheet.

156
Appendix G
Pilot I Pre-experimental Task List
Spreadsheet Low Complexity
1. In Al, enter your first name. In A2, enter your middle initial. In A3, enter your last name. In A4, enter your section number.
2. In A7, type in "Number formats". In B7, type in "Numbers". In A8, type in "Currency (C2)". In A9, type in "Fixed (F2)". In A10, type in "Comma".
3. In cells B8 through BIO, put the number 10000. In cells C8 through CIO, put the number ,01.
4. Format cells B8 through D8 for currency, 2 decimal places.
Format the cells in C8 through C10 for fixed, 2 decimal places.
5. In A13, type in "Math functions". In A14, type in "Add". In A15, type in "Subtract". In A16, type in "Multiply". In A17, type in "Divide". In B13, put in the number 3. In CI3, put in the number 3. In B14, add the two numbers. In B15, subtract the two numbers. In B16, multiply the two numbers. In B17, divide the two number.
6. Set each of the individual column widths to as wide as needed so all labels have 1 blank space after the last character.

157
7. Save the spreadsheet with the following command, /FS using the first 8 digits from your last name as the filename.
8. Print the spreadsheet.

158
Appendix G
Pilot I Pre-experimental Task List
Word Processor High Complexity
1. Retrieve TEST2.DOC from drive A:.
2. Put your name and section at the bottom of the document.
3. Move the largest paragraph in the document to the beginning.
4. Change left, right, top and bottom margins to 2".
5. Print page numbers on all pages in the upper right hand corner.
6. Print the whole document in 12 characters per inch mode.
7. Center and make bold the title "The Computer Comes of Age" .
8. Print the document.

159
Appendix G
Pilot I Pre-experimental Task List
Word Processor Low Complexity
1. Retrieve the file called TEST.DOC from the A: drive.
2. At the top of the document, put your name, date and address in left justified format.
3. Make sure there is a blank line after your address and the first paragraph.
4. Type in the following (don't type the quotes) "This is the first day of the rest of my life. I will make the most of it." between paragraphs one and two. Make sure there is a blank line above and below this- paragraph.
5. Insert a blank line after the last paragraph in the document then type the following "This sentence is in bold." Make sure this sentence is in bold as you type it into the document. The bold sentence should be left-justified.
6. Insert another blank line after the boldfaced sentence. Then type in "This is an underlined sentence." This sentence should be the only sentence that is underlined. Don't underline the period at the end of the sentence.
7. Insert another blank line after the underlined sentence. Then type in the following "This sentence is centered." The text should be automatically centering and readjusting as you type.
8. Go to the phrase "second paragraph" and change it to say "third paragraph".
9. Save the document to drive A: using your last name, up to 8 characters, as the filename.
10. Print both pages.

160
Appendix G
Pilot I Pre-experimental Task List
Spreadsheet High Complexity
1. Retrieve a spreadsheet called A:grades from drive A:.
2. Put your name and section number in cell A1.
3. Average each students' grades.
4. Compute the class average.
6. Compute the average for the girls for each assignment.
7. Compute the average for the boys for each assignment.
8. Print the whole spreadsheet.
9. Save the spreadsheet on drive A: using the first 8 characters of you last name for the filename.
10. Print the average girls, average boys and class average in a line chart.

161
Appendix G
Pilot I Pre-experimental Task List
Spreadsheet Low Complexity
In Al, enter your first name. In A2, enter your middle initial. In A3, enter your last name. In A4, enter your section number.
In A5, enter the @NOW function and format for date. In A6, enter the @NOW function and format for time.
3. Change the global column width to 14.
4. In A7, type in "Number formats". In B7, type in "Numbers". In A8, type in "Currency (C2)". In A9, type in "Fixed (F2)". In A10, type in "Comma".
5. In cells B8 through BIO, put the number 10000. In cells C8 through CIO, put the number .01.
6. Put 100 in cells D8 through D10. Put .0001 in cells E8 through E10.
7. Format the cells in B8 through E8 for currency, 2 decimal places.
Format the cells in B9 through E9 for fixed, 2 decimal places.
Format the cells in B10 through E10 for comma, 0 decimal places.
8. Fill cell All with the - key. Fill cell Bll with the * key. Fill cell Cll with the = key.
9. In A13, type in "Math functions". In A14, type in "Add".

162
In A15, type in "Subtract". In A16, type in "Multiply". In A17, type in "Divide". In A18, type in "Power". In B13, put in the number 3. In C13, put in the number 3. In B14, add the two numbers. In B15, subtract the two numbers. In B16, multiply the two numbers. In B17, divide the two number. In B18, do the number in B13 to the power of the
number in C13.
10. In A20, type in "What is (3+2*3)?" In A21, type in "What is (3-2*3)?"
In B20, type in the answer to solve the problem from A20.
In B21, type in the answer to solve the problem from A21.
11. Set each of the individual column widths to as wide as needed so all labels have 1 blank space after the last character.
12. Save the spreadsheet with the following command, /FS using the first 8 digits from your last name as the filename.
13. Print the spreadsheet.

APPENDIX H
EXAMPLE HELP SCRIPTS FOR SEMANTIC SYSTEM

1 6 4
Appendix H
Example Help Scripts for Semantic System
Moving the cursor around in the document.
You can move the cursor around the document with the arrow keys. The l e f t arrow moves l e f t . The r ight arrow moves r ight. The up arrow goes up. The down arrow goes down.
To go to the top of the document, h i t the following key sequence: the <home> key twice and then the up arrow key
To go to the end of the document, h i t the following key sequence: the <home> key twice and then the down arrow key
You can move the cursor with the <backspace> key but th is deletes as i t goes.
Deleting characters and blocks of things.
You can delete characters under the cursor with the <delete> key. You can delete characters to the l e f t of the cursor with the <backspac:e> key.
You can delete blocks or chunks of text by "blocking" i t f i r s t . Do the following steps:
1. Move cursor to start of block. 2. Press down the <ALT> key and at the same time h i t the F4 function key. 3. Move cursor to end of where you want deleted. 4. Hit the <delete> key. 5. I t w i l l ask you i f you real ly want to delete, just h i t the Y key.
Inserting characters, blank lines & page breaks
Example: to insert an "a" 1. Move the cursor to the location desired ( i t w i l l go to the l e f t of the
cursor). 2. Make sure you are in INSERT MODE by pushing the <Insert> key on the r ight
side of the keyboard above the arrow keys several times unt i l the lower l e f t hand corner of the screen does NOT say "Typeover".
3. Hit the a key.
To add a blank l ine where your cursor is located, h i t the Enter or Return key just to the r ight of the " key.
To insert a page break so the cursor moves to the next page, hold down the <CTRL> key and h i t the Enter or Return key at the same time. This w i l l add a l ine of = signs in your document that shows were the new page starts.

165
Appendix H
Example Help Scripts for Semantic System
Moving the cursor around in the spreadsheet..
You can move the cursor around with the arrow keys: up, down, l e f t and r ight. You can also use <PGUP> and <PGDWN> keys.
I f you want to go to a specific cell that is far away, h i t the F5 function key and type in the address you want. (Addresses are letters followed by numbers.
Deleting characters and cells.
You can delete a character in a cel l by "editing the cel l " . Move the cursor to the cel l you want to edit. Hit the F2 function key on the upper row of the keyboard. Now, use the l e f t and right arrow keys to move the cursor to the character to be deleted. Once there, h i t the <delete> key and then h i t the <Enter> key to complete the change.
I f you need to erase or blank out a cel l , do the following: 1. Move the cursor on top of the cel l to be erased. 2. Hit the following keys (not the quotes) " / " "R" "E" "<Enter>"
Inserting characters and numbers.
Move to the cel l you want to enter the characters or letters. Type the characters as you want to enter them. When you are finished, h i t the <Enter> key. This places them in the cel l .
To enter a number, move to the cel l , and hi t the numbers you want followed by the <Enter> key.

APPENDIX I
PILOT II AND EXPERIMENTAL DATA COLLECTION TASK LIST

167
Appendix I
Experimental Data Collection Word Processor
High Task Complexity
lp. 1. Retrieve TEST2.DOC from drive A:.
lp. 2. Put your name, section and computer number at the bottom of the document.
2p• 3. Move the largest paragraph in the document to the beginning.
2p. 4. Change left, right, top and bottom margins to 2".
2p. 5. Print page numbers on all pages in the upper right hand corner.
2p. 6. Print the whole document in 12 characters per inch mode.
2p• 7. Center and make bold the title "The Computer Comes of Age " .
2p. 8. Italicize and underline the first occurrence of the word transistor.
2p. 9. Center the whole paragraph that starts with "The modern television set ..."
2p. 10. Save the modified document on drive A: using your section number and you computer number as the filename.
Example: 0355 where 03 is the section number and 55 is the computer number
2p. 11. Print the document.

168
Appendix I
Experimental Data Collection Word Processor
High Task Complexity
The Computer Comes of Age
The computer revolution of the past quarter-century has been so vast and all-pervading as to defy comprehension. This ubiquitous record-keeping calculator is strategically involved with the details of our lives-with the food we eat, the products we use, the entertainments we attend, and the money we have or do not have. There is no escaping its effect.
One of the most obvious precursors of today's computer was a punch-card tabulating machine invented by Herman Hollerith and used in the 1890 U.S. census. Hollerith's machine worked, was continually improved on, and was later applied to other problems of data storage and retrieval. With the development of electricity and electronics and, most particularly, the transistor, the present-day computer has evolved, based on principles established by Hollerith.
The transistor itself is a near-miraculous means of miniaturizing complicated electrical circuits. Its electronic complexities defy simple explanation. Suffice it to say that, without generating any heat, a minute piece of solid semiconducting material can switch, modulate, and amplify electronic impulses just as the vacuum tube does. Sponsored by Bell Telephone Laboratories, the transistor was called a corporate invention but it was created by the genius of individuals. The leaders of the team that developed it were John Bardeen, Walter H. Brattain, and William B. Shockley. The three inventors were awarded the Nobel Prize in physics in 1956 for their accomplishments. The tiny chip of germanium containing two wires, which was the first solid state transistor, fulfilled Bell's specifications beyond its developers' fondest dreams, and

169
today the computer industry is based on this miniature component.
It has since been further miniaturized and now nearly 5,000 computer circuit elements can be integrated on a single silicon chip 1/16-inch square.
Television and the Future
The modern television set is the result of thousands of prior patents and theories, but the big breakthrough that made it possible can be credited to two men, Vladmir K. Zworykin and Phil T. Farnsworth.
Zworykin, born in Murom, Russia, in 1889, worked in the laboratory of Boris Rosing. Rosing was the first to design a television system using the cathode ray table, which has since proved a key component of the electronic industry. When Zworykin immigrated to America in 1919, he was already deeply involved in the theory of television, and during the next 20 years became a leader in the field. His most important development was the iconoscope, basic to the TV camera.
Farnworth, an Idaho farm boy, revealed an amazing grasp of science at an early age. In 1922, when he was 15, he conceived a television system more advanced that of Rosing and Zworykin. By the early 1930's he had greatly increased the clarity of the television image and was ready for commercial production. Commercial telecasting began in 1941 but was interrupted by the war. Farnsworth went on to create other applications for his theories of electronics.

170
Appendix I
Experimental Data Collection Word Processor
Low Task Complexity
lp. 1. Retrieve the file called TEST.DOC from the A: drive.
lp. 2. At the top of the document put your name, section number and computer number.
lp. 3. Make sure there is a blank line after your computer number and the first paragraph.
lp. 4. Between paragraphs one and two, type in the following (don't type the quotes) "This is the first day of the rest of my life. I will make the most of it." . Make sure there is a blank line above and below this paragraph.
lp. 5. Insert a blank line after the last paragraph in the document then type the following "This sentence is in bold." Make sure this sentence is in bold as you type it into the document. The bold sentence should be left-justified.
lp. 6. Insert another blank line after the boldfaced sentence. Then type in "This is an underlined sentence." This sentence should be the only sentence that is underlined. Don't underline the period at the end of the sentence.
lp. 7. Insert another blank line after the underlined sentence. Then type in the following "This sentence is centered." The text should be automatically centering and readjusting as you type.
lp. 8. Go to the phrase "second paragraph" and change it to say "third paragraph".
lp. 9. Go to the phrase "will be much shorter" and change it to "is much shorter".

171
lp. 10. Go to the end of the third paragraph and add the phrase "but not by much" before the period.
lp. 11. Go to the bottom of the 1st page of the document. Add a blank line after the centered sentence. Then type in "University of North Texas" using the flush-right function.
lp. 12. Add a blank line after the University of North Texas line.
2p. 13. When you are positioned at the bottom of the first page, insert a "hard page command" by pressing the <Control> key and hitting the <Enter> key at the same time. This will put you on page 2 of the document.
2p. 14. Create a title page by typing in your centered name, section number, computer number and date.
2p. 15. Save the document to drive A: using your section number and computer number for the filename.
Example: 0355 where 03 is the section number and 55 is the computer number
2p. 16. Print both pages.

172
Appendix I
Experimental Data Collection Word Processor
Low Task Complexity
The following is the test document the subjects were to use during this procedure. It had intentional misspellings and other errors. The subjects were to correct them as they typed in or after the document was typed.
This is the test document that is to be used during theediting procedure. This is the first pciragraph of the document. Some of the paragraphs will be long while others may be short.
This is the second paragraph of the document. It will be much shorter than the first.
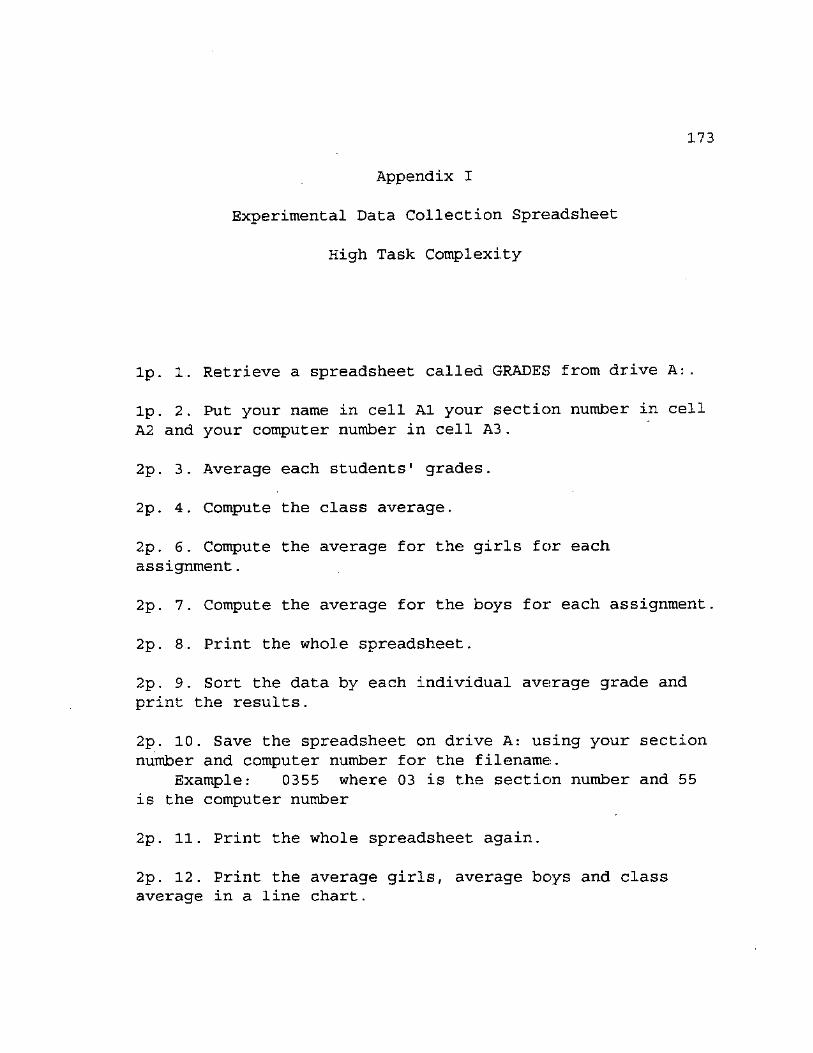
173
Appendix I
Experimental Data Collection Spreadsheet
High Task Complexity
lp. 1. Retrieve a spreadsheet called GRADES from drive A:.
lp. 2. Put your name in cell A1 your section number in cell A2 and your computer number in cell A3.
2p. 3. Average each students' grades.
2p. 4. Compute the class average.
2p. 6. Compute the average for the girls for each assignment.
2p. 7. Compute the average for the boys for each assignment.
2p. 8. Print the whole spreadsheet.
2p. 9. Sort the data by each individual average grade and print the results.
2p. 10. Save the spreadsheet on drive A: using your section number and computer number for the filename.
Example: 0355 where 03 is the section number and 55 is the computer number
2p. 11. Print the whole spreadsheet again.
2p. 12. Print the average girls, average boys and class average in a line chart.

174
Appendix I
Experimental Data Collection Spreadsheet
High Task Complexity
GRADES.worksheet
NAME SECTION NUMBER COMPUTER NUMBER
Aver MAXIMUM 100 100 100 100 100 Fred 99 67 78 77 92 Dave 60 65 78 73 81 Mike 98 99 100 90 94 Anne 78 89 83 92 99 Jane 65 70 72 80 68

175
Appendix I
Experimental Data Collection Spreadsheet
Low Complexity Task
2p. 1. In Al, enter your first name. In A2, enter your last name. In A3, enter your section number. In A4, enter your computer number.
2p. 2. In A7, type in "Number formats". In B7, type in "Numbers". In A8, type in "Currency (C2)". In A9, type in "Fixed (F2)". In A10, type in "Comma".
2p. 3. In cells B8 through BIO, put the number 10000. In cells C8 through CIO, put the number 10. In cells D8 through D10, put the number .01. In cells E8 through E10, put the number .00001.
2p. 4. Format the cells in B8 through E8 for currency, 2 decimal places.
Format the cells in B9 through E9 for fixed, 2 decimal places.
Format the cells in B10 through E10 for comma, 0 decimal places.
2p. 5. Fill cell All with the - key. Fill cell Bll with the * key. Fill cell Cll with the = key.
2p. 6. In A13, type in "Math functions". In A14, type in "Add". In A15, type in "Subtract". In A16, type in "Multiply". In A17, type in "Divide".

176
In B13, put in the number 3. In C13, put in the number 3. In B14, enter an equation that adds B13 to C13. In B15, enter an equation that subtracts C13 from C13. In B16, enter an equation that multiplies B13 and C13. In B17, enter an equation that divides B13 by C13.
2p. 7. In A20, type in "What is (3+2*3)?" In A21, type in "What is (3-2*3)?" In B20, type in the equation to answer A20. In B21, type in the equation to answer A21.
2p. 8. Set each of the individual column widths to as wide as needed so all labels have at least 1 blank space after the last character.
2p. 9. Save the spreadsheet with the following command, /FS using your section number and computer number as the filename on drive A:. Example: 0321 NNnn
2p. 10. Print the spreadsheet.

APPENDIX J
QUESTIONNAIRE FOR EXPERIMENTAL DATA COLLECTION

178
Appendix J
Questionnaire For Experimental Data Collection
Name ID Number Section Number Computer Number
Circle the most appropriate response.
1. What has been your experience with spreadsheets in general?
none very little some average way above average
2. What has been your experience with word processors in general?
none very little some average way above average
3. What has been your experience, if any, with Lotus?
none very little some average way above average
4. What has been your experience, if any, with word processor?
none very little some average way above average
6. What is your age?
7. What is your sex?
8. Have you heard anything about this exercise from anyone else?
yes no
BIBLIOGRAPHY
Borenstein, Nathaniel S. The Design and Evaluation of On-line Help Systems. Ph.D. diss. Carnegie-Mellon University (1985).
Borland, Russel. "Adaptive Interface: The Challenge to Documentation" ACM SIGDOC * 11 3 Sept (1985): 9-13.
Bloom, Benjamin S., Max D. Engelhart, Edward J. Furst, Walker H. Hill, and David R. Krathwohl. Taxonomy of Educational Objectives Handbook I: Cognitive Domain New York: David McKay Company Inc. (1956) .
Brunswik, E. Conceptual Framework of Psychology Chicago: University of Chicago Press (1952).
Campbell, D., and J. Stanley, Experimental and Quasi-Experimental Designs For Research. Houghton Miffin Company (1963).
Carroll, John M. and Caroline Carrithers. "Training Wheels in a User Interface" Communications of the ACM August (1984) : 800-806.
Carter Jr., James A. "A Taxonomy of User-oriented Functions" International Journal of Man-Machinp Studies 24 (1986): 195-292.
Chervany, Norman L., Gary W. Dickson, and K. A. Kozar. "An Experimental Gaming Framework for Investigating the Influence of Management Information Systems on Decision Effectiveness." Management Information Systems Research Center, Working Paper 71-12 University of Minnesota (1971).
Cohill, M. A. and R. C. Willinges "Retrieval of HELP Information for Novice Users of Interactive Computer Systems" Human Factors 27 3 (1985): 335-343.

180
Copeland, Ronald M., Arthur J. Francia and Robert Strawser "Students and Subjects in Behavioral Business Research." The Accounting Review April (1973): 365-372.
Coventry, Lynne "Helping UNIX Users: An Assessment of the Effectiveness of Various Forms of Online Help", Ph.D. diss, University of Stirling (United Kingdom), (1991): 214.
DeSanctis, Gerardine, and R. Brent Gallupe "A Foundation for the Study of Group Decision Support Systems" Management Science 33 3 (1987): 589-607.
Einhorn, H. J. and R. M. Hogarth "Behavioral Decision Theory: Processes of Judgment and Choice" Annual Review of Psychology 32 (1981): 53-88.
Duncan, R. "Integrating Windows Help: A Strategic Review. PC Magazine 12 14 August (1993): 420-426.
Dunham, R. D. "The Measurement and Dimensionality of Job Characteristics" Journal of Applied Psychology 61 (1976) : 404-409.
Ericsson, K. A., and Herbert Simon Protocol Analysis -Verbal Reports as Data Cambridge. Mass.: MIT Press (1984) .
Fenchel, Robert S. and Gerald Estrin "Self-Describing Systems Using Integral Help" IEEE Transactions on Systems. Man, and Cybernetics. 12 2 (1982): 162-176.
Fischer, Gerhard, Andreas Lemke and Thomas Schwab "Knowledge-based Help Systems" ACM CHI Proceedings April (1985): 171-167.
Frankel, Valerie L., and Osman Balci "An On-line Assistance System for the Simulation Model Development Environment" International Journal of Man-Machine Studies 31 (1989): 699-716.

181
Gardner, G. Donald "Activation Theory and Task Design: An Empirical Test of Several New Predictions" Journal of Applied Psychology 71 3 (1986): 411-418.
Gawron, Valerie J. "Performance Effects of Noise Intensity, Psychological Set, and Task Type and Complexity" Human Factors 24 2 (1982): 225-243.
Gordon, Michael E., L. Allen Slade and Neal Schmitt "The
'Science of Sophomores' Revisited: from Conjecture to Empiricism." Academy of Management Review 11 1 June (1986): 191-207.
Gorry, G. Anthony, and Michael S. Scott Morton "A Framework for Management Information Systems." Sloan Management Review Fall (1971): 55-70.
Granda, Richard E., Richard Halstead-Nussloch and Joan M. Winters "The Perceived Usefulness of Computer Information Sources: A Field Study", SIGCHI Bulletin. 21 4 April (1990) : 35-43 .
Greeno, James G. Handbook of Learning and Cognitive Processes. Human Information Processing Volume 5. Hillsdale, N.J.: Lawrence Erlbaum Associates (1978): 239-271.
Hackman, J. R., and G. R. Oldham "Development of Job Diagnostic Survey" Journal of Applied Psychology 60 (1975): 159-170.
Hard, N., and M. Vanecek "The Implications of Tasks and
Format on the Use of Financial Information" Journal of Information Systems Fall (1991): 35-49..
Hearne, Dixon and Jim Lasley "The Relationship Between Achievement Factors and Gender-Specific Computer Aptitude Among Junior High School Students" Education. Fall, 106 1 (1985): 81-87.

182
Houghton Jr., R. C. "On-line Help Systems: A Conspectus" Communications of the ACM February (1984): 126-133.
Ives, Blake, Scott-Hamilton and Gordon B. Davis "A Framework for Research in Computer-Based Management Information Systems. Management Science September (1990): 910-934.
Jarvenpaa, Sirkka L. "The Effect of Task Demands and Graphical Format on Information Processing Strategies." Management Science 35 3 March (1989): 285-303.
Jarvenpaa, Sirkka L, Dickson G., and Gerardine DeSanctis "Methodological Issues in Experimental IS Research: Experiences and Recommendations", MIS Quarterly 9 (June): 141-156.
Johnson, Eric J., and John W. Payne "Effort and Accuracy in Choice" Management Science. 31 4 (1985): 395-414.
Kearsley, Greg Online Help Systems: Design and Implementation. Ablex Publishing Corporation, New Jersey, 1988.
Kennedy, T.C.S. "The Design of Interactive Procedures for Man-Machine Studies" International Journal of Man-Machine Studies 6 (1974): 309-334.
Kirk, K.K. "COSTAR for the Neophyte: An Online Help System" MUG Quarterly. 20 1 June (1990) 157-160.
Kleinmuntz, Don N. "Cognitive Heuristic and Feedback in a Dynamic Decision Environment" Management Science 31 5 (1985): 680-702.
Kolb, David A. Learning Stvle Inventory Technical Manual. Boston: McVer and Company, 1976.
Kozlowski, Steve W. J., and Brian M. Hultz "Joint Moderation of the Relation Between Task Complexity and Job Performance for Engineers" Journal of Applied Psychology 71 2 (1986): 196-202.

183
Kuo, Feng-Yang, Karirai and Jahangir "User Interface Design From a Realtime Perspective" Communications of the ACM 31 12 (1988): 145.
Lucas, Henry C., Jr. "A Descriptive Model of Information Systems in the Context of the Organization" Database 5 2 (1973): 27-36.
Magers, Celeste S. "An Experimental Evaluation of On-line HELP for Non-Programmers" CHI '83 Proceedings December (1983): 277-281.
Mack, R. L., C. H. Lewis, and J. M. Carroll "Learning to Use Word Processors, Problems and Prospects" ACM Transactions of Office Information Systems International July (1983): 254-271.
Maguire, M. "An Evaluation of Published Recommendations on the Design of Computer Dialogues" International Journal of Man-Machine Studies April (1982): 237-261.
Mason, Richard 0. and Ian I. Mitroff "A Program for Research on Management Information Systems." Management Science 19 5 January (1973): 475-487.
Mock, Theodore J. "A Longitudinal Study of Some Information Structure Alternatives" Database 5 2 3 4 (1973): 40-45.
Newell, A., and H. A. Simon Human Problem Solving Prentice Hall, Englewood Cliffs, New Jersey (1972).
Newell, A., and H. A. Simon "Human Problem-Solving - State of Theory in 1970" Journal of Structured Learning 5 Nl-2 (1976): 131-151.
Newell, A., and H. A. Simon. Human Problem Solving New York: Prentice Hall (1972).
Palmer, J., Duffy, T., Gomoll, K., and Goboll, T., "The Design and Evaluation of Online Help For Unix EMACS: Capturing the User In Menu Design", IEEE Transactions on Professional Communications. 31 1 March (1988): 44-51.

184
Pilkington, R. "Question-answering for Intelligent On-line Help: The Process of Intelligent Responding" Cognitive Science. 16 4 Oct-Dec. (1992) 455-489.
Postman, L., and E. C. Tolman Brunswick's Probabilistic
Functionalism. In S. Koch (Ed.), Psychology: A Study of a Science New York: McGraw-Hill (1959).
Roberts, Roger HELP A Question Answering System Office of the Secretary of Defense Advanced Research Projects Agency: Dec 31 (1969) Document No. P-13, Contract No. SD-185.
Roberts, K. H., and W. Glick "The Job Characteristics
Approach to Task Design: A Critical Review" Journal of Applied Psychology 66 (1983): 193-217.
Rockart, John F.f and Lauren S. Flannery "The Management of End-User Computing" Communications of the ACM 26 10 (1983): 776-784.
Sage, A. P. "Behavioral and Organizational Considerations in the Design of Information Systems and Processes for Planning Decision Support", IEEE Transactions on Systems, Man, and Cybernetics SMC-11 9 (Sept 1981) : 640-678.
Shneiderman, Ben "Human Factors Experiments in Designing Interactive Systems" Computer 12 12 (1979): 9-24.
Shneiderman, Ben Human Factors Issues of Manuals. On-line Help, and Tutorials. Department of Computer Science, University of Maryland (1984).
Shneiderman, Ben Designing the User Interface Strategies for Effective Human-Computer Interaction Addison-Wesley Publishing Company (1992).
Seybold, J. "Training and Support: Shifting the Responsibility" Sevbold Report on Word Processing 4 1 January (1981).

185
Simon, H. A. The Sciences of the Artificial 2nd ed. Cambridge, Mass: MIT Press (1981)
Sims Jr., H. P., A. D. Szilagyi, and R. T. Keller "The Measurement of Job Characteristics" Academy of Management Journal 19 (1976): 195-212.
Slack, Frances, "OPACS: Using Enhanced Transaction Logs To Achieve More Effective Online Help For Subject Searching" Ph.D. diss, Council for National Academic Awards, (1991): 293.
Smith, Timothy William "Assessing the Usability of User
Interfaces: Guidance and Online Help Features" Ph.D. diss., University of Arizona, (1988).
Soley, Lawrence, and Leonard Reid "On the Validity of Students as Subjects in Advertising Experiments." Journal of Advertising Research 23 August (1983): 57-59.
Sondheimer, Norman K., and Nathan Relies "Human Factors and User Assistance in Interactive Computing Systems: An Introduction" IEEE Transaction on Systems. Man, and Cybernetics SMC 12 (2) April (1982): 102-107.
Surynt, T. and Augustine, F. Jr. "Ensuring End-User Productivity: An Academic Minor In Information Technology" Journal of Computer Information Systems 33 4 Summer (1993) 82-84.
Tagg, S. K. "The User Interface of the Data Analysis
Package: Some Lines of Development" International Journal of Man-Machine Studies 14 (1981): 297-316.
Trumbly, James E. "The Need For an Adaptive User Interface in System and Software Design" Information Executive 3 4 (1990): 19.
Vasilash, G. S. "CAD/CAM In Italy" Production 104 2 Feb (1992) : 32 .

186
Watson, J. B. "Is Thinking Merely the Action of Language
Mechanisms?" British Journal of Psychology 11 (1920):
87-104.
Wichman, Harvey, and Aimee Oyasato "Effects of Locus of
Control and Task Complexity on Prospective Remembering"
Human Factors 25 3 (1983): 583-591.
Zmud, Robert W. "An Examination of 'Push-Pull' Theory Applied to Process Innovation in Knowledge Work" Management Science 30 6 (1984): 727-738.