productivity and multi-screen computer · pdf file · 2009-04-09productivity and...
TRANSCRIPT

31
Janet Colvin and Nancy Tobler are doctoral candidatesand James A. Anderson is Professor and Director of Gradu-ate Studies in the Department of Communication at theUniversity of Utah, Salt Lake City, UT 84112..
Productivity and Multi-ScreenComputer Displays
Rocky Mountain Communication ReviewVolume 2:1, Summer, 2004
Pages 31-53Janet ColvinNancy ToblerJames A. Anderson
As processor speed and memorycapacity have increased and become lessexpensive, the office has found that it can
support more open applications and that multi-tasking could be a reality, not just a term. Oneproblem remaining has been the management of thecomputer desktop. Even with increased monitor size,the single screen presents fundamental problems withwindow placement, stacking and tracking windows,multiple applications on the task bar, and the like(Delefino, 1993; Grudin, 2003). These problemshave limited the increases in productivity theoreticallymade possible with increased processor speed andmemory capacity.
Multi-Screen Solution
Solutions to this problem have been available sincethe advent of the Windows 98 operating system thatallows the PC platform to support multi-monitordisplays. Initially, multi-screen configurations founduse in computer gaming but has found little interest
or recognition in the business or academic community.Part of the reason for that lack of interest has beenthe absence of evidence of value (Binder, 2001;Lindsley, 1996; St. John, Harris, & Osga, 1997).This study addresses that absence by comparingmulti- and single-screen configurations acrossperformance and usability measures.
Multi-Screen Configurations
The multi-screen display configuration can range froma fully integrated set of liquid crystal displays to asimple, physical arrangement of two or more CRTmonitors (Bohannon, 2003; Dyson, 2002; Vellotti,2001). Each screen or monitor in a multi-screendisplay is connected to the same computer throughits own display port and is treated by the operatingsystem both as a unified, boundaried space and as aconnected or extended desktop. For example, anapplication will maximize to the boundaries of its“home” single screen but can also be “windowed”across all screens (a number theoretically unlimitedbut usually 2-5). Multi-screens configurations allowthe user to place different windows on differentscreens or to spread a single application across allavailable screens (Brown & Ruf, 1989).
Multi-Screen Management Software
Multi-screen management software adds another
One hundred eight university and non university personnel participated in a comparison of singlemonitor, multi-monitor and multi-monitor with Hydravision display configurations. Respondentsedited slide shows, spreadsheets and text documents in a simulation of office work, using each ofthe display arrays. Performance measures, including task time, editing time, number of editscompleted, and number of errors made and usability measures evaluating effectiveness, comfort,learning ease, time to productivity, quickness of recovery from mistakes, ease of task tracking,ability to maintain task focus and ease of movement among sources were combined into an overallevaluation of productivity. Multi-screens scored significantly higher on every measure.

32
Rocky Mountain Communication ReviewVolume 2:1 Summer, 2004
potential set of efficiencies (Randall, 1999). Multi-screen management software allows the user toinstantly transport application windows to differentscreens, maximize applications across all displays,open child windows (e.g., multiple spreadsheets ortool and property sub-menus) on different displays,and to switch between virtual desktops (e.g., from atext editing set up to a graphics design set up).
Productivity and Multi-screen Displays
Productivity testing involves the reproduction of anordinary work site, plausible and recognizable worktasks, and reasonable conditions of work (Sherry &Wilson, 1996; Stolovich & Keeps, 1992).Productivity testing then is a combination ofperformance testing and usability testing (Baurua,Kriebel, & Mukhopadhyay, 1991; Jorgenson &Stiroh, 1999). In performance testing, automatedtools collect facts about what the users actually didand how long it took them to do it. In usabilitytesting, a sample group is asked to perform a set oftasks and subjectively rate the ease of use of apiece of hardware or software. Because usabilitywithout increased performance or increasedperformance without adequate usability will not sustainoverall increases in productivity, authentic measuresof productivity must involve both (Brynjolfsson &Yang, 1996).
Comparing Single and Multi-Screens overPerformance and Usability
Overview
In order to test the productivity of multi-screenconfigurations, an experimental comparison wasdevised using three blocks of simulated office tasks.Each block contained a text editing task (TXT), aspreadsheet editing task (SST) and a slidepresentation editing task (PPT). Each task withinthe block was designed to use six windows ofinformation: Two windows concerned theadministrative, data collection, and simulationmanagement of the experiment per se and four
windows were components of the task. A seventhwindow provided navigational information thatgoverned the entire session and contained thehyperlinks for the various files required.
Each of the 108 respondents completed one differentblock in each of three configurations: single screen(SS), multi-screen (MS), and multi-screen assistedby multi-screen management software (HV)1. Theorder of tasks was the same in each block: text,spreadsheet and slide. An equal number ofrespondents (36 per block x configurationcombinations) completed each block to control forpossible task by configuration differences. Screenconfigurations and tasks were used as “withinsubjects” factors in the analysis.
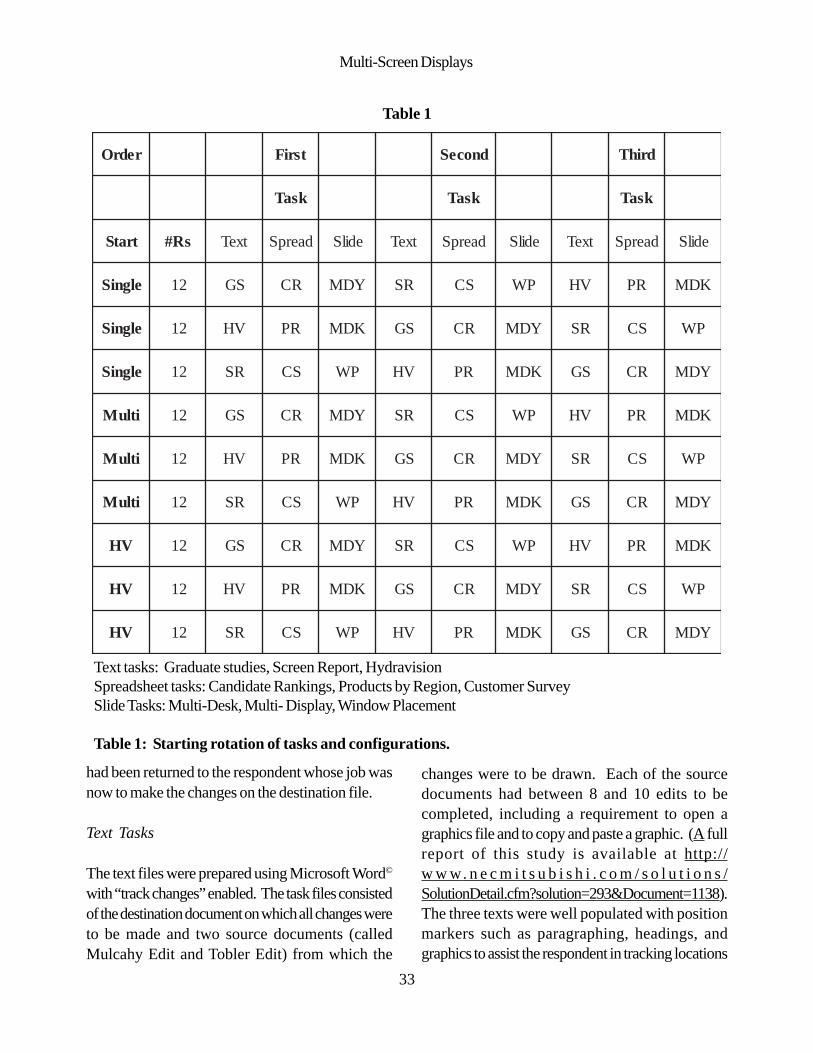
Strong order effects were to be expected asrespondents learned how the task was to beperformed. To control for these effects, an equalnumber of respondents (12 per each of the 9 blockx configuration x order combinations) started the taskset with a different configuration in the first position.Table 1 presents the rotation of tasks andconfigurations. This procedure was repeated for eachof the task sets. Order effects were, therefore,balanced across all configurations. In this manner,each respondent completed all 9 tasks in blocks ofthree and experienced all three screen configurationsaddressing them in one of three orders.
Finally, to get some sense of an “optimal” number ofmonitors, the multi-screen configuration was furtherdivided into one with two monitors and one with threemonitors. Half of the respondent pool (54) workedthe tasks in a 2-monitor setup and half in a 3-monitorsetup. This “monitor condition” was used as a“between-subject” factor in the analysis.
Tasks
All three tasks were based on the same scenario: Adestination text, spreadsheet, or slide presentationhad been previously prepared and sent out for reviewor error correction. The copy edits and corrections
Multi-Screen Displays
33
had been returned to the respondent whose job wasnow to make the changes on the destination file.
Text Tasks
The text files were prepared using Microsoft Word©
with “track changes” enabled. The task files consistedof the destination document on which all changes wereto be made and two source documents (calledMulcahy Edit and Tobler Edit) from which the
changes were to be drawn. Each of the sourcedocuments had between 8 and 10 edits to becompleted, including a requirement to open agraphics file and to copy and paste a graphic. (A fullreport of this study is available at http://w w w. n e c m i t s u b i s h i . c o m / s o l u t i o n s /SolutionDetail.cfm?solution=293&Document=1138).The three texts were well populated with positionmarkers such as paragraphing, headings, andgraphics to assist the respondent in tracking locations
redrO tsriF dnoceS drihT
ksaT ksaT ksaT
tratS sR# txeT daerpS edilS txeT daerpS edilS txeT daerpS edilS
elgniS 21 SG RC YDM RS SC PW VH RP KDM
elgniS 21 VH RP KDM SG RC YDM RS SC PW
elgniS 21 RS SC PW VH RP KDM SG RC YDM
itluM 21 SG RC YDM RS SC PW VH RP KDM
itluM 21 VH RP KDM SG RC YDM RS SC PW
itluM 21 RS SC PW VH RP KDM SG RC YDM
VH 21 SG RC YDM RS SC PW VH RP KDM
VH 21 VH RP KDM SG RC YDM RS SC PW
VH 21 RS SC PW VH RP KDM SG RC YDM
Table 1
Text tasks: Graduate studies, Screen Report, HydravisionSpreadsheet tasks: Candidate Rankings, Products by Region, Customer SurveySlide Tasks: Multi-Desk, Multi- Display, Window Placement
Table 1: Starting rotation of tasks and configurations.

34
Rocky Mountain Communication ReviewVolume 2:1 Summer, 2004
from one document to another.
Spreadsheet Tasks
The spreadsheet files were prepared using MicrosoftExcel© and Microsoft Word©. Each spreadsheetwas designed to cover approximately one and a halfscreens (an average of 33 rows by 25 columns).Each of the data sets had summary information thatwas dynamically linked to a bar chart. Correctionswere provided to the respondents in the form of a“Corrections Memo” simulating an e-mail addressedto them. Sixteen corrections were listed for therespondent to enter. After the corrections were made,the respondent was to copy the bar chart and pasteit into a designated location in a “Final Report.” TheFinal Report was accessed by a hyperlink on theinstructions page.
Slide Tasks
The slide files were prepared using MicrosoftPowerPoint©. PowerPoint has a rather limited editinghandling protocol (as compared with most wordprocessing). Edits were identified in comments andplaced in the source documents in color-coded type.Each slide task had between 11 and 17 edits,including navigating to a graphics page, selecting alogo, and pasting the graphic into a new slide.
Data Collection
Data were collected in six ways: a paper and pencilintake questionnaire, automated time reports andautomated usability questionnaire, stop watchmeasurements, task observations, and open-ended,end-of-testing questions. A description of eachfollows:
Intake Questionnaire
A single page intake questionnaire asked respondentsto record their experience levels with computers, withthe various applications used in the study, and withmultiple screens. It also queried job experience and
hours of work.
Time Report and Usability Questionnaire
An Excel spreadsheet was devised to collect therespondent’s ID number, the time spent readinginstructions, the total time spent on the task, and theresponses to each of 8 usability questions. Theusability questionnaire recorded the respondents selfreports on their effectiveness, comfort, ease oflearning, productivity, mistake recovery, task tracking,task focus, and ease of movement across sources(adapted from Lewis, 1995; Davis, 1989).
Stop Watch Measurements
Stop watch timing was initiated at the start of theactual editing task. Each task had its own markerevents for the start and completion of editing. Anobserver/facilitator (O/F), seated next to therespondent, started the watch on the initiation eventand stopped it on the completion event. The timevalues were recorded on the task observation sheetin minutes and seconds.
Task Observations
As an observer (facilitation practices are describedunder “Protocol”), the O/F was responsible for stopwatch data, recording the correct completion of eachedit, recording any missed edits and errors in editingor changes otherwise introduced into the sourcedocuments, recording any comments about the taskor the screen configuration, and any unusual practicesin the editing task that appeared worthy of notice.
Post-Session Questions
At the completion of all the tasks, the O/F askedfour questions: “Focusing on single screen versusmultiple screens, what did you think about thatdifference?” “Focusing on multiple screens withHydravision and multiple screens withoutHydravision, what did you think about thatdifference?” “Focusing on the tasks and the different

Multi-Screen Displays
35
screen configurations, did any task seem easier orharder in a given screen configuration?” “Focusingon the experiment itself, was there anything thatbothered you or that we should do differently?” Asummary of the respondent’s answers was recordedon the task observation sheet.
Protocol
Sampling
Using a combination of advertisements and snowballsampling, 108 respondents were drawn fromstudents, staff, and faculty from the university andindividuals from the larger community as well. Thesample was equally divided between the 2-monitorand 3-monitor conditions.
Testing Procedures
Upon arrival, the respondent was given a shortdescription of the study and the intake questionnaireto complete. The respondent was then shown oneof three 5-minute training videos, SS, MS, or HVdepending on the initial configuration of the task. Thetraining video demonstrated a set of editingprocedures appropriate to each task in the block andto the specific screen configuration.
At the conclusion of the video, the O/F describedthe screen configuration that was in use, the tasks tobe done, and the role the O/F would play in theprocess. When all questions were answered, therespondent was asked to navigate to the first timestamp screen to begin the block session. When therespondent initiated the editing task, the stopwatchwas started. Respondents were given 5 minutes tocomplete the task, although time was added to allowthe completion of an edit in progress. The O/Frecorded each edit as it was made. Errors and missededits were also recorded. At the conclusion of thetask, the stopwatch was stopped, the time recorded,and the respondent immediately directed back to thetime stamp. The respondent then checked the task“Done Box,” completed the usability questionnaire,
and posted the file. This procedure was repeatedfor each configuration. At the conclusion of all threetask blocks, post-session questions were asked andanswers recorded. Each session took approximately90 minutes. Respondents were paid $20 for theirtime.
Project activities were under the supervision of aproject ethicist whose responsibility was to ensurethat all procedures were followed by the O/F andother project staff. The project ethicist made randomvisitations and observed entire sessions. Her finalreport noted no violations.
Facilities
Testing was done in the University of Utah,Department of Communication interaction laboratory.This testing facility has the look and feel of a livingroom (albeit one with a large one-way mirror andvideo cameras in the corners) with couches, easychairs and a large television set. Two work tableswere added for each of the testing stations.
Each testing station was configured with a new PCcomputer with a clean install of Windows XP andMicrosoft Office Suite. The computers were basedon the Intel Pentium 4 chip running at 1.8 GHz, with512MB DDR SDRAM, a 40 GB, 7200rpm UltraATA hard drive, standard keyboard, and two buttonwheel mouse. Monitors were NEC MitsubishiMultisync LCD 1855NX, an 18 inch liquid crystaldisplay. Display boards were ATI Radeon 9000 AGPwith two monitor ports and ATI Radeon 7000 PCIwith a single port. One station had two monitorsarranged in a slight V with the right hand monitorhaving the taskbar; the other had three monitors in atriptych arrangement with the task bar on the centermonitor.
Performance Measures
Basic Variables and Their Definitions
Five variables used to test performance were

36
Rocky Mountain Communication ReviewVolume 2:1 Summer, 2004
collected automatically or through direct observation.The variables, their definitions and method ofcollection are reported below:
Task Time: One of two basic time units. TaskTime is the lapsed time from the respondent’schecking of the task “Start” Box on the Time Stampto the Respondent’s checking of the “Done” box onthe Time Stamp. Task Time includes set up time andedit time plus any time spent in meeting projectrequirements (navigating to and from the Time Stamp,for example). Task Time was an automated datacollection.
Edit Time: The other basic time unit. Edit Time isthe stopwatch recorded time from the first editingmarker event to the last editing marker event. Itrepresents the amount of time actually on task andhas no other time component. The time was recordedby the O/F assigned to the respondent.
Number of Correct Edits: The number of correctlyexecuted edits as observed and recorded by the O/F. Each of these edits were listed for each task onthe task observation sheets. The O/F checked offeach edit as it was completed or recorded an erroror a miss as described below.
Number of Errors: The O/F recorded an error whenthe edit called for was completed incorrectly. Anerror was defined as any event that would have tobe “found” and “corrected” by another editingprocess.
Number of Missed Edits: The O/F recorded amissed edit when the respondent skipped a completeedit (partial edits were considered errors).
Derived Variables and Their Definitions
Five performance variables were derived throughcalculations using the basic variables as factors.Those variables and their definitions are:
Proportion of Edits Completed: The number of
correct edits divided by the total number of editsrequired by the task.
Accuracy: The number of correct edits minus thenumber of errors and missed edits. Accuracy is aperformance cost measure. Inaccurate editingincreases costs as the task has to be redone. Thegreater the inaccuracy, the less confidence can begiven to the original work and the more care requiredin the re-editing.
Proportion of Accurate Edits: The accuracycoefficient (number of correct edits minus the numberof errors and missed edits) divided by the number ofedits required.
Time per Edit: Edit time divided by the number ofcorrect edits. This measure can be used to projectthe time required for larger tasks.
Time per Accurate Edit: Edit time divided by theaccuracy coefficient (number of correct edits minusthe number of errors and missed edits).
Questionnaires
Two questionnaire instruments were used in thisstudy: an intake questionnaire that queriedrespondents on their computer, application, and multi-screen experience and a usability questionnaireadministered after every task performance. An open-ended interview based on four questions followedthe testing session.
Intake Questionnaire
The intake questionnaire was a paper and pencildevice composed of 6 sections: ComputerExpertise: A four point scale ranging from zero(None) to 3 (Advanced). Application Expertise:A four point scale ranging from zero (None) to 3(Advanced). Block Expertise: The average of thethree Application Expertise measures divided intothree roughly equal groups. Cut points were (1) lessthan 1.67, (2) equal to 1.67, and (3) 2.00 or greater.
Multi-Screen Displays
37
Corrections were made for anomalous cases(described in the Performance by Expertise section).Time Spent on Text, Spreadsheet, and SlideApplications: In hours per week from zero to ten.Level of Application Use: A three point scale fromone (Personal) to three (Professional). Multi-screenExperience: A “yes” “no” item followed by thenumber of monitors used (1-6). Current JobSituation: Number of hours per week on the joband job title. Data were hand entered with doubleentry verification.
Usability Questionnaire
Each task performance was immediately followedby a usability questionnaire that was part of the timestamp file. The questionnaire used a 10-point sliderto register the self-reported position between thepoles of Strongly Disagree and Strongly Agree. Asreported above, the items recorded the respondents’self reports on their effectiveness, comfort, ease oflearning, productivity, mistake recovery, task tracking,task focus, and ease of movement across sources.Data were recorded by the same procedures usedin collecting the time data and directly entered intothe data base.
Interviews
Respondents were asked to compare single andmulti-screens, multi-screens with software and
without, task difficulty in different configurations, andto comment on the protocol itself. A summary ofeach response was recorded by the O/F and enteredverbatim into the data file.
Analysis and Results: Performance Data
Statistical Design: Task Variables
In each of the 12 basic and derived variables, datawere reorganized from their original task-specificentry into a task-type centered entry that distributedboth order of performance and specific task inbalanced numbers throughout the data. Each task-type data set had an equal number of the three tasksand three orders.
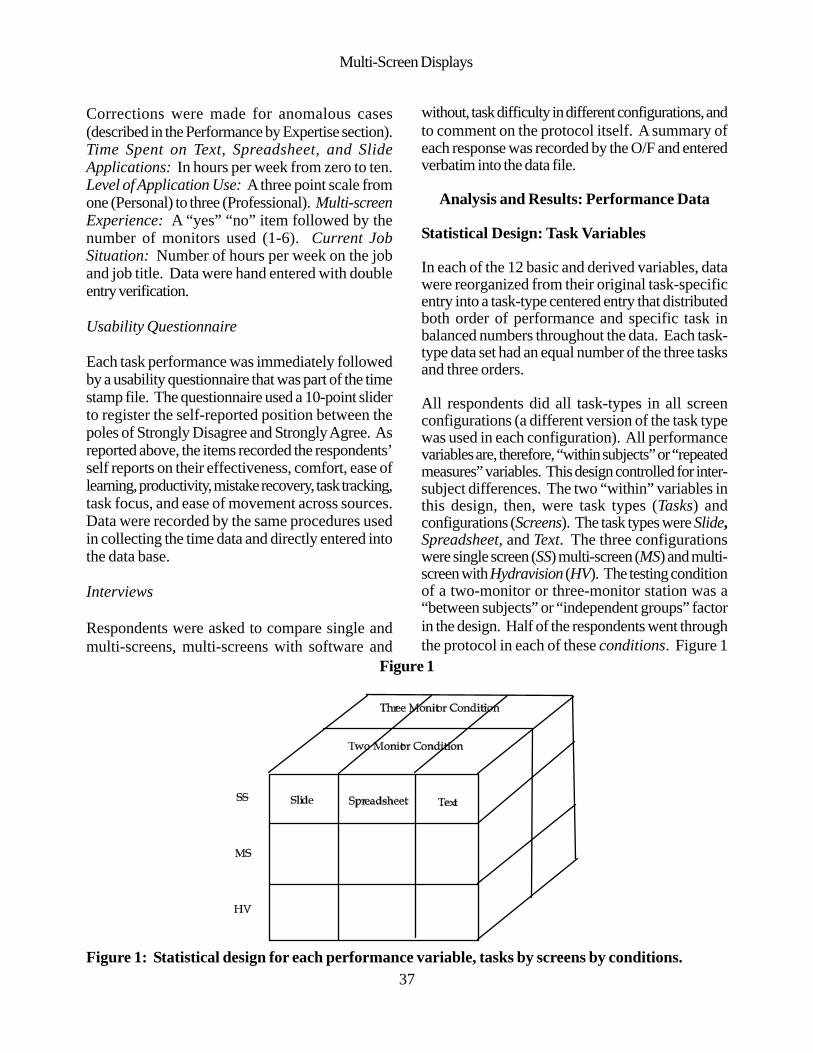
All respondents did all task-types in all screenconfigurations (a different version of the task typewas used in each configuration). All performancevariables are, therefore, “within subjects” or “repeatedmeasures” variables. This design controlled for inter-subject differences. The two “within” variables inthis design, then, were task types (Tasks) andconfigurations (Screens). The task types were Slide,Spreadsheet, and Text. The three configurationswere single screen (SS) multi-screen (MS) and multi-screen with Hydravision (HV). The testing conditionof a two-monitor or three-monitor station was a“between subjects” or “independent groups” factorin the design. Half of the respondents went throughthe protocol in each of these conditions. Figure 1
Figure 1
Figure 1: Statistical design for each performance variable, tasks by screens by conditions.

38
Rocky Mountain Communication ReviewVolume 2:1 Summer, 2004
diagrams the design.
Each task variable was analyzed using this classic“Type III” design using the General Linear Model asformulated in SPSS. An Alpha of .05 was set as thedecision criterion for significance.
Performance Results
The restricted space of this venue allows us to presentthe results for only four of the 12 variables—EditTime, Number of Correct Edits, Accuracy, and Timeper Edit. There is a great deal of redundancy in the
12 variable set; these four variables were selectedbecause they show the greatest amount of uniqueinformation. Each report starts with tests ofsignificance in the three-factor (tasks by screens byconditions), each of the two-factor (screens by tasks,screens by conditions, tasks by conditions) and maineffects (screens, tasks, and conditions). A table ofthe means, standard deviations, and confidenceintervals by cell is then presented followed by tablesof means and standard deviations for each significantcondition. The reader is reminded that significantinteractions at one level confound the analysis of thenext lower level (three-factor confounds two-factor
Table 2
Table 2: Analysis of variance results for Edit Time.
confounds main effects). The results will be discussedonly to the lowest non-confounded level.
Edit Time
The Edit Time variable measured the time lapsedbetween the first task marker event and the last taskmarker event. It can be considered as on-task time.Table 2 presents the analysis of variance results. TheANOVA indicates a three-way interaction betweenscreens, tasks, and conditions. Two-way interactioneffects were checked. The screens by task F-test
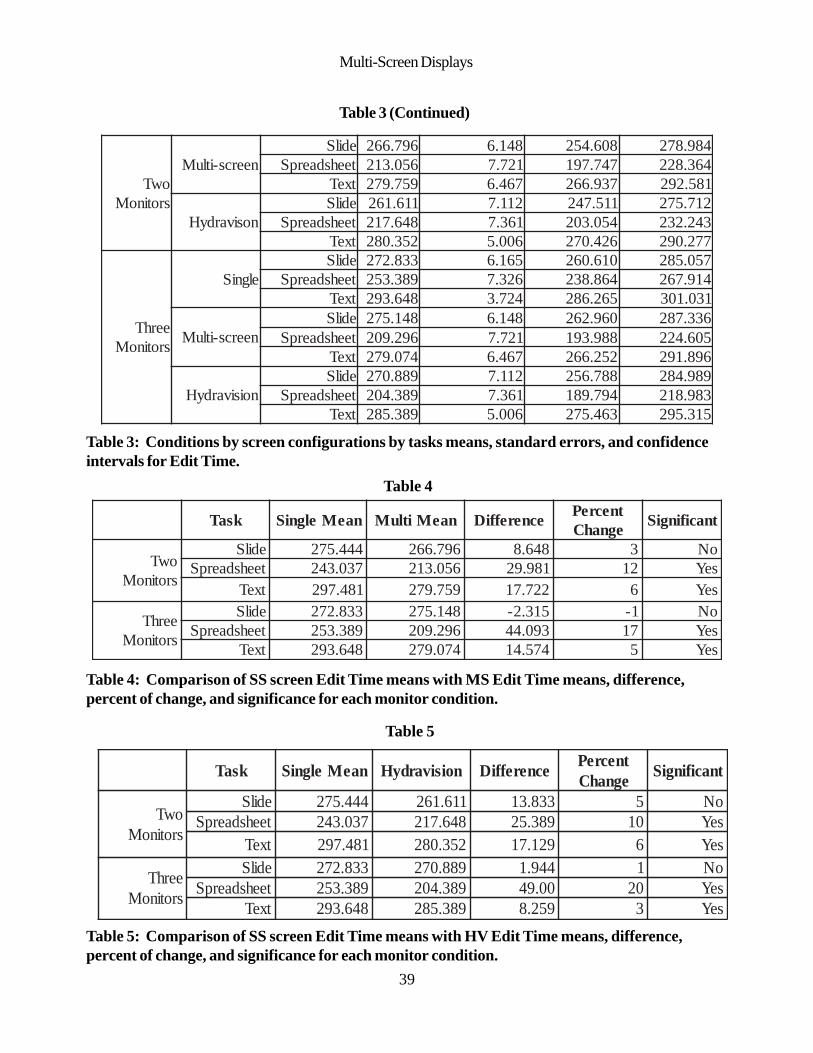
indicates an interaction effect. These findingsdemonstrate that tasks (slides, spreadsheet, and text)are not consistent over time. Table 3 presents themeans, standard deviations, and confidence intervalsfor tasks and screens by condition for the edit timevariable. Table 4 presents a comparison of the SSmeans with the MS means for the two-monitorconditions. Table 5 presents a comparison of theSS means with HV means for the two- and three-monitor conditions. Significant differences are notedin these latter tables.
Table 3
srotinoM sneercS sksaT naeM rorrEdradnatS lavretnIecnedifnoC%59
dnuoBrewoL dnuoBreppU
owTsrotinoM elgniS
edilS 444.572 561.6 122.362 866.782teehsdaerpS 730.342 623.7 215.822 265.752txeT 184.792 427.3 990.092 468.403
srotcaF tseT-F foseergeDmodeerF ecnacifingiS
noitidnoCybsksaTybsneercS 237.2 424,4 920.noitidnoCybsneercS 310. 212,2 789.
noitidnoCybsksaT 346. 212,2 725.ksaTybsneercS 519.9 424,4 000.
sneercS 452.12 212,2 000.sksaT 186.002 212,2 000.
snoitidnoC 620. 601,1 278.
Multi-Screen Displays
39
Table 3 (Continued)
Table 3: Conditions by screen configurations by tasks means, standard errors, and confidenceintervals for Edit Time.
owTsrotinoM
neercs-itluMedilS 697.662 841.6 806.452 489.872teehsdaerpS 650.312 127.7 747.791 463.822txeT 957.972 764.6 739.662 185.292
nosivardyHedilS 116.162 211.7 115.742 217.572teehsdaerpS 846.712 163.7 450.302 342.232txeT 253.082 600.5 624.072 772.092
eerhTsrotinoM
elgniSedilS 338.272 561.6 016.062 750.582teehsdaerpS 983.352 623.7 468.832 419.762txeT 846.392 427.3 562.682 130.103
neercs-itluMedilS 841.572 841.6 069.262 633.782teehsdaerpS 692.902 127.7 889.391 506.422txeT 470.972 764.6 252.662 698.192
noisivardyHedilS 988.072 211.7 887.652 989.482teehsdaerpS 983.402 163.7 497.981 389.812txeT 983.582 600.5 364.572 513.592
Table 4
Table 4: Comparison of SS screen Edit Time means with MS Edit Time means, difference,percent of change, and significance for each monitor condition.
Table 5
Table 5: Comparison of SS screen Edit Time means with HV Edit Time means, difference,percent of change, and significance for each monitor condition.
ksaT naeMelgniS naeMitluM ecnereffiD tnecrePegnahC tnacifingiS
owTsrotinoM
edilS 444.572 697.662 846.8 3 oNteehsdaerpS 730.342 650.312 189.92 21 seYtxeT 184.792 957.972 227.71 6 seY
eerhTsrotinoM
edilS 338.272 841.572 513.2- 1- oNteehsdaerpS 983.352 692.902 390.44 71 seYtxeT 846.392 470.972 475.41 5 seY
ksaT naeMelgniS noisivardyH ecnereffiD tnecrePegnahC tnacifingiS
owTsrotinoM
edilS 444.572 116.162 338.31 5 oNteehsdaerpS 730.342 846.712 983.52 01 seYtxeT 184.792 253.082 921.71 6 seY
eerhTsrotinoM
edilS 338.272 988.072 449.1 1 oNteehsdaerpS 983.352 983.402 00.94 02 seYtxeT 846.392 983.582 952.8 3 seY

40
Rocky Mountain Communication ReviewVolume 2:1 Summer, 2004
The significant three-factor interaction requiresanalysis at the cell level. Eleven of the 12 comparisonsbetween single screen and multi-screen configurationsshowed reductions in editing time. These differenceswere significant in eight of these comparisons. Onlythe slide task failed to show significant or consistentreductions with the three-monitor MS conditionshowing a reversal. The spreadsheet tasks showedthe largest reductions of time across both monitorconditions. Slide and text editing was done morequickly in the two-monitor condition; spreadsheetediting was faster in the three-monitor condition.None of the differences were significant, althoughnearly so in the spreadsheet task.
Number of Edits
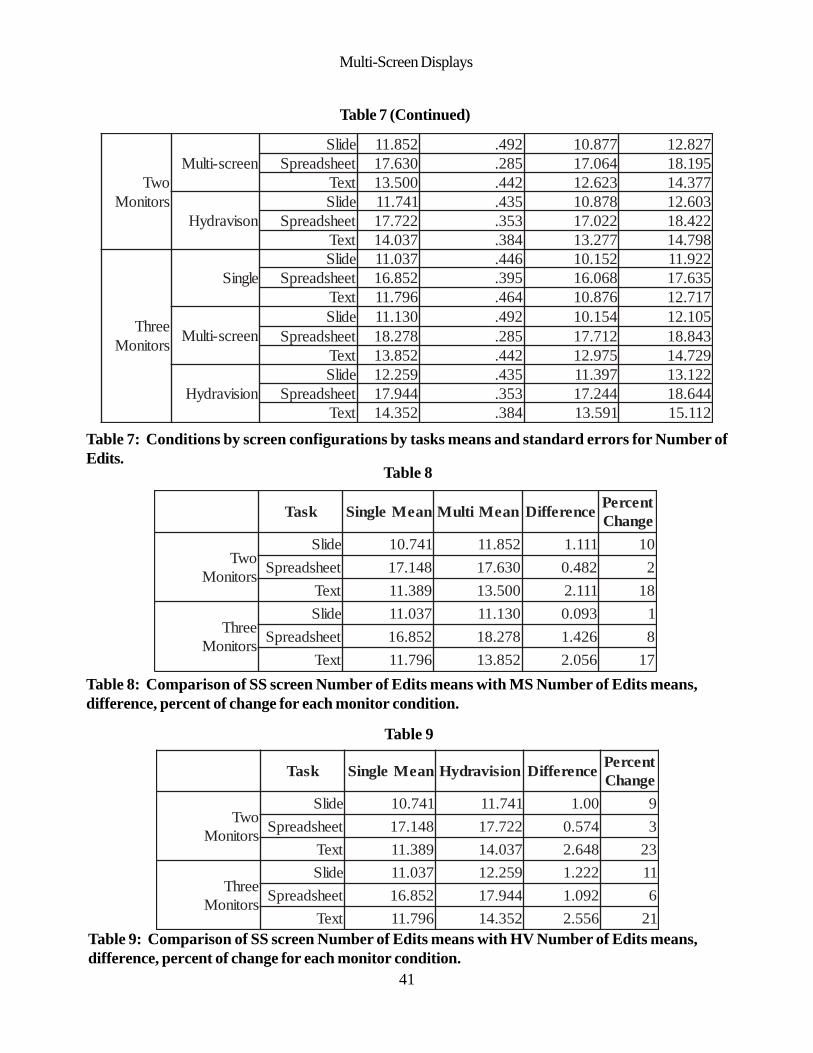
The “Number of Edits” variable gave a count of thenumber of edits correctly entered by the respondent.This measure is a typical measure of productivity(number of units produced). Table 6 presents theanalysis of variance results.
The results in Table 6 indicate that the differences
among screen configurations changed over tasks.The lack of a significant three-factor interaction orany of the two-factor interactions involving thecondition of two or three monitors signals that theconfiguration means and the task means remainedconsistent over the monitor conditions. Although nointeraction involving condition was significant, Table7 presents the cell means and the single screen multi-screen comparisons and Tables 8 and 9 present thecomparisons of single screen to multi-screen andsingle screen to Hydravision to keep the data recordconsistent for the reader. Tables 10 through 12present the break down of the significant screens bytask interaction.
In Tables 10 through 12, multi-screen configurationsshow a consistent increase in the number of editscompleted over single screen. This advantage issignificant in five of the six comparisons. In the lonenon-significant condition, the MS mean is .02 belowthe upper bound limit of the SS confidence intervaland is matched with a significant difference in the HVmulti-screen condition. It is likely that the multi-
Table 6
Table 6: Analysis of variance results for Number of Edits.
Table 7
srotcaF tseT-F foseergeDmodeerF ecnacifingiS
noitidnoCybsksaTybsneercS 033.1 424,4 852.noitidnoCybsneercS 291. 212,2 628.
noitidnoCybsksaT 093. 212,2 876.ksaTybsneercS 697.4 424,4 100.
sneercS 145.52 212,2 000.sksaT 603.585 212,2 000.
snoitidnoC 782. 601,1 495.
srotinoM sneercS sksaT naeM rorrEdradnatS lavretnIecnedifnoC%59
dnuoBrewoL dnuoBreppUowTsrotinoM elgniS
edilS 147.01 644. 658.9 626.11teehsdaerpS 841.71 593. 563.61 239.71txeT 983.11 464. 964.01 903.21
Multi-Screen Displays
41
Table 7 (Continued)
owTsrotinoM
neercs-itluMedilS 258.11 294. 778.01 728.21teehsdaerpS 036.71 582. 460.71 591.81txeT 005.31 244. 326.21 773.41
nosivardyHedilS 147.11 534. 878.01 306.21teehsdaerpS 227.71 353. 220.71 224.81txeT 730.41 483. 772.31 897.41
eerhTsrotinoM
elgniSedilS 730.11 644. 251.01 229.11teehsdaerpS 258.61 593. 860.61 536.71txeT 697.11 464. 678.01 717.21
neercs-itluMedilS 031.11 294. 451.01 501.21teehsdaerpS 872.81 582. 217.71 348.81txeT 258.31 244. 579.21 927.41
noisivardyHedilS 952.21 534. 793.11 221.31teehsdaerpS 449.71 353. 442.71 446.81txeT 253.41 483. 195.31 211.51
Table 7: Conditions by screen configurations by tasks means and standard errors for Number ofEdits.
Table 9: Comparison of SS screen Number of Edits means with HV Number of Edits means,difference, percent of change for each monitor condition.
Table 9
Table 8
Table 8: Comparison of SS screen Number of Edits means with MS Number of Edits means,difference, percent of change for each monitor condition.
ksaT naeMelgniS naeMitluM ecnereffiD tnecrePegnahC
owTsrotinoM
edilS 147.01 258.11 111.1 01teehsdaerpS 841.71 036.71 284.0 2txeT 983.11 005.31 111.2 81
eerhTsrotinoM
edilS 730.11 031.11 390.0 1teehsdaerpS 258.61 872.81 624.1 8txeT 697.11 258.31 650.2 71
ksaT naeMelgniS noisivardyH ecnereffiD tnecrePegnahC
owTsrotinoM
edilS 147.01 147.11 00.1 9teehsdaerpS 841.71 227.71 475.0 3txeT 983.11 730.41 846.2 32
eerhTsrotinoM
edilS 730.11 952.21 222.1 11teehsdaerpS 258.61 449.71 290.1 6txeT 697.11 253.41 655.2 12

42
Rocky Mountain Communication ReviewVolume 2:1 Summer, 2004
screen advantage in this case is being masked bysample conditions. In looking at screen by taskeffects, the limited experience of slide editingminimizes the overall effect.
Accuracy
Accuracy is a constructed variable based on the
number of completed edits minus the number of errorand the number of misses. The rationale for thismeasure is that missed work and incorrect workrequires more time and money to correct than simpleunfinished work. While an analysis of edits and errorsindicated an advantage for multi-screenconfigurations, it is possible that the location of these
Table 10
Table 10: Screen configurations by tasks means, standard errors, and confidence intervals forNumber of Edits.
Table 11
Table 11: Comparison of SS screen Number of Edits means with MS Number of Edits means,difference, percent of change, and significance.
Table 12
Table 12: Comparison of SS screen Number of Edits means with HV Number of Edits means,difference, percent of change, and significance.
noitarugifnoC sksaT naeM dradnatSrorrE
lavretnIecnedifnoC%59dnuoBrewoL dnuoBreppU
elgniSedilS 988.01 613. 362.01 515.11teehsdaerpS 000.71 972. 644.61 455.71txeT 395.11 823. 249.01 342.21
neercs-itluMedilS 194.11 843. 108.01 081.21teehsdaerpS 459.71 202. 455.71 353.81txeT 676.31 313. 650.31 692.41
nosivardyHedilS 000.21 803. 093.11 016.21teehsdaerpS 338.71 052. 833.71 823.81txeT 491.41 172. 756.31 237.41
ksaT naeMelgniS noisivardyH ecnereffiD tnecrePegnahC
ecnacifingiS
edilS 988.01 21 111.1 01 seYteehsdaerpS 00.71 338.71 338.0 5 seY
txeT 395.11 491.41 106.2 22 seY
ksaT naeMelgniS neercs-itluM ecnereffiD tnecrePegnahC
ecnacifingiS
edilS 988.01 194.11 206.0 6 (oN a )51.=teehsdaerpS 00.71 459.71 459.0 6 seY
txeT 395.11 676.31 380.2 81 seY

Multi-Screen Displays
43
measures may result in a different outcome. Thatpossibility suggests that should the same advantageappear in Accuracy, it is a confirmation rather than areplication. Table 13 presents the analysis of varianceresults.
The three-factor interaction and the two-factorinteractions involving the number of monitors werenot significant, but the two-factor screens by taskinteraction was. Table 14 presents the means,standard errors, and confidence intervals for the cellvalues; Table 15 presents a comparison of SS andMS means; Table 16 presents a comparison of SSand HV means, all for the data record.
Because the three-factor interaction was notsignificant and the two-factor screens by taskinteraction was, the data are best analyzed bycollapsing monitor conditions and looking at thescreens means by task. Table 17 presents that
information. Inspection of Table 17 shows that multi-screen configurations resulted in higher accuracyscores that were significantly higher in all but the SSto MS slide task compaison (a = .125). In addition,the HV text scores were significantly higher than theMS text score, although the other two comparisonswere not significant and their direction mixed.
Time per Completed Edit
Time per Completed Edit is the editing time dividedby the number of completed edits. It represents theflow of work over time and can be used to craftestimates of work completion over jobs of varyinglength. Table 18 presents the analysis of varianceresults for Time per Completed Edit. None of themulti-factor interactions involving Condition weresignificant. The two-factor Screens by Tasksinteraction was significant, pointing to a differentialeffect of screen configurations across tasks. Tables
Table 13
Table 13: Analysis of variance results for Accuracy.
Table 14
srotcaF tseT-F foseergeDmodeerF ecnacifingiS
noitidnoCybsksaTybsneercS 560.2 424,4 580.noitidnoCybsneercS 620. 212,2 479.
noitidnoCybsksaT 820.3 212,2 796.ksaTybsneercS 058.3 424,4 400.
sneercS 016.22 212,2 000.sksaT 169.753 212,2 000.
snoitidnoC 014. 601,1 325.
srotinoM srotinoM srotinoM srotinoM srotinoM sneercS sneercS sneercS sneercS sneercS sksaT sksaT sksaT sksaT sksaT naeM naeM naeM naeM naeM rorrEdradnatS rorrEdradnatS rorrEdradnatS rorrEdradnatS rorrEdradnatS lavretnIecnedifnoC%59 lavretnIecnedifnoC%59 lavretnIecnedifnoC%59 lavretnIecnedifnoC%59 lavretnIecnedifnoC%59
dnuoBrewoL dnuoBrewoL dnuoBrewoL dnuoBrewoL dnuoBrewoL dnuoBreppU dnuoBreppU dnuoBreppU dnuoBreppU dnuoBreppU
owTsrotinoM
elgniSedilS 031.01 384. 371.9 780.11teehsdaerpS 513.61 825. 962.51 163.71txeT 005.01 205. 605.9 494.11
neercs-itluMedilS 513.11 415. 692.01 333.21teehsdaerpS 036.61 894. 346.51 716.71txeT 697.21 794. 018.11 287.31

44
Rocky Mountain Communication ReviewVolume 2:1 Summer, 2004
Table 14 (Continued)
owTsrotinoM nosivardyH
edilS 222.11 974. 991.01 790.21teehsdaerpS 629.61 115. 319.51 939.71txeT 877.31 034. 529.21 136.41
eerhTsrotinoM
elgniSedilS 184.01 384. 525.9 834.11teehsdaerpS 518.51 825. 967.41 168.61txeT 952.11 205. 562.01 452.21
neercs-itluMedilS 475.01 415. 555.9 395.11teehsdaerpS 518.71 894. 828.61 208.81txeT 222.31 794. 632.21 802.41
noisivardyHedilS 407.11 974. 457.01 356.21teehsdaerpS 333.71 115. 123.61 643.81txeT 697.31 034. 349.21 056.41
Table 14: Conditions by screens by tasks means, standard errors, and confidence intervals forAccuracy.
Table 15
Table 15: Comparison of SS screen Accuracy means with MS Accuracy means, difference, andpercent of change.
Table 16: Comparison of SS screen Accuracy means with HV Accuracy means, difference, andpercent of change.
Table 16
ksaT naeMelgniS naeMitluM ecnereffiD tnecrePegnahC
owTsrotinoM
edilS 031.01 513.11 581.1 21teehsdaerpS 513.61 036.61 513.0 2txeT 005.01 697.21 692.2 22
eerhTsrotinoM
edilS 184.01 475.01 390.0 1teehsdaerpS 518.51 518.71 000.2 31txeT 952.11 222.31 369.1 71
ksaT naeMelgniS noisivardyH ecnereffiD tnecrePegnahC
owTsrotinoM
edilS 031.01 222.11 290.1 11teehsdaerpS 513.61 629.61 116.0 4txeT 005.01 877.31 872.3 13
eerhTsrotinoM
edilS 184.01 407.11 322.1 21teehsdaerpS 518.51 333.71 815.1 01txeT 952.11 697.31 735.2 22

Multi-Screen Displays
45
19 through 21provide the cell means comparisonsthat contribute to the data record. Table 22 presentsthe screen configuration means for each task in orderto investigate the significant Screens by Taskinteraction.
The data in Table 22 shows a consistent advantagefor multi-screen configurations across all tasks in termsof shorter average time per edit. These differencesare significant for all but the SS to MS comparisonfor the slide task (a = .37). There are no significantdifferences between MS and HV means, although
the pattern of HV being more effective in slide andtext tasks is repeated. In terms of absolute values,multi-screen configurations (MS and HV combined)result in a savings of 2.2 seconds per slide edit, 3.2seconds per spreadsheet edit and 6.7 seconds pertext edit.
Analysis and Results: Usability Data
Analysis
Data from the usability questionnaires that werecollected at the end of every task performance
Table 17
Table 17: Means, standard errors, and confidence intervals for SS, MS, and HV configurationsby tasks over Accuracy.
Table 18
Table 18: Means, standard errors, and confidence intervals for SS, MS, and HV configurationsby tasks over Time per Completed Edit.
noitarugifnoC sksaT naeM dradnatSrorrE
lavretnIecnedifnoC%59dnuoBrewoL dnuoBreppU
elgniSedilS 603.01 143. 926.9 289.01teehsdaerpS 560.61 373. 523.51 508.61txeT 088.01 553. 771.01 385.11
neercs-itluMedilS 449.01 363. 422.01 566.11teehsdaerpS 222.71 253. 425.61 029.71txeT 900.31 253. 213.21 707.31
nosivardyHedilS 194.11 823. 148.01 141.21teehsdaerpS 031.71 163. 314.61 648.71txeT 787.31 403. 481.31 093.41
srotcaF tseT-F foseergeDmodeerF ecnacifingiS
noitidnoCybsksaTybsneercS 223.1 424,4 162.noitidnoCybsneercS 107. 212,2 794.
noitidnoCybsksaT 884. 212,2 516.ksaTybsneercS 247.5 424,4 000.
sneercS 254.32 212,2 000.sksaT 294.282 212,2 000.
snoitidnoC 600. 601,1 049.

46
Rocky Mountain Communication ReviewVolume 2:1 Summer, 2004
Table 19
Table 19: Conditions by screen configurations by tasks means, standard errors, and confidenceintervals for Time per Completed Edit.
Table 20
Table 20: Comparison of SS screen Time per Completed Edit means with MS Time perCompleted Edit means, difference, and percent of change.
Table 21
srotinoM sneercS sksaT naeM rorrEdradnatS lavretnIecnedifnoC%59
dnuoBrewoL dnuoBreppU
owTsrotinoM
elgniSedilS 761.82 446.1 809.42 624.13teehsdaerpS 021.51 688. 363.31 878.61txeT 937.82 325.1 917.52 957.13
neercs-itluMedilS 992.52 247.1 648.12 257.82teehsdaerpS 525.21 086. 771.11 378.31txeT 974.22 253.1 997.91 851.52
nosivardyHedilS 322.52 335.1 381.22 262.82teehsdaerpS 119.21 777. 073.11 354.41txeT 173.12 629. 535.91 702.32
eerhTsrotinoM
elgniSedilS 180.82 446.1 328.42 043.13teehsdaerpS 320.61 688. 562.41 087.71txeT 063.82 325.1 043.52 083.13
neercs-itluMedilS 766.82 247.1 412.52 911.23teehsdaerpS 319.11 086. 465.01 162.31txeT 524.22 253.1 547.91 501.52
noisivardyHedilS 322.42 335.1 381.12 262.72teehsdaerpS 440.21 777. 205.01 585.31txeT 529.02 629. 980.91 167.22
ksaT naeMelgniS naeMitluM ecnereffiD tnecrePegnahC
owTsrotinoM
edilS 761.82 992.52 868.2 01teehsdaerpS 021.51 525.21 595.2 71txeT 937.82 974.22 62.6 22
eerhTsrotinoM
edilS 180.82 766.82 685.0- 2-teehsdaerpS 320.61 319.11 11.4 62txeT 063.82 524.22 539.5 12
ksaT naeMelgniS noisivardyH ecnereffiD tnecrePegnahC
owTsrotinoM
edilS 761.82 322.52 449.2 01teehsdaerpS 021.51 119.21 902.2 51txeT 937.82 173.12 863.7 62

Multi-Screen Displays
47
(9 questionnaires per respondent) were analyzed ina tasks by screens repeated measures design thatexamined differences across tasks and screens foreach of effectiveness, comfort, ease of learning,productivity, mistake recovery, task tracking, taskfocus, and ease of movement across sources.
In order to determine if respondent perceptions ofusability differed across screens and task types, acomparison of the three screen configurations andthree task types was conducted separately for eachof the eight items. Figure 2 presents the design asreplicated across each item. This design allows theanalysis of the relationship between screenconfiguration and task on each of the respondents’judgments of usability. Based on our initialsuppositions, it was hypothesized that multi-screenconfigurations would score higher on each item thanthe single screen. Two monitor and three monitor
multi-screen configurations were used to furtherstrengthen the potential understanding of multi-screeneffects. The comparison of multi-screens with andwithout screen management software was consideredexploratory and no hypotheses were developed.
Results
As hypothesized, multi-screen configurations scoredsignificantly higher in usability than the single screenon every measure in every task. HV means weregenerally not significantly different from MS meanson all measures but varied in direction of differenceacross tasks. Table 23 presents the means for eachitem across each screen configuration.
Differences in items showed the effect of screenconfigurations. In single screen, task tracking wassignificantly lower than any other item and ease oflearning was significantly higher than any other. In
Table 21 (Continued)
Table 21: Comparison of SS screen Time per Completed Edit means with HV Time perCompleted Edit means, difference, and percent of change.
Table 22
Table 22: Time per Completed Edit means, standard errors, and confidence intervals for eachscreen configuration by task.
eerhTsrotinoM
edilS 180.82 322.42 858.3 41teehsdaerpS 320.61 440.21 979.3 52txeT 063.82 529.02 534.7 62
noitarugifnoC sksaT naeM dradnatSrorrE
lavretnIecnedifnoC%59dnuoBrewoL dnuoBreppU
elgniSedilS 421.82 261.1 028.52 824.03teehsdaerpS 275.51 726. 923.41 418.61txeT 945.82 770.1 414.62 586.03
neercs-itluMedilS 389.62 232.1 145.42 524.92teehsdaerpS 912.21 184. 662.11 271.31txeT 254.22 659. 755.02 743.42
nosivardyHedilS 327.42 480.1 375.22 278.62teehsdaerpS 874.21 055. 883.11 765.31txeT 841.12 556. 058.91 644.22
48
Rocky Mountain Communication ReviewVolume 2:1 Summer, 2004
multi-screen, task tracking was also significantlylower than any other item, while accessibility wasthe highest, significantly higher than all but ease oflearning. Hydravision means showed task trackingas significantly lower than all other items andaccessibility as highest. Accessibility was significantlyhigher than mistake recovery, productivity, andcomfort as well as task tracking.
Table 23 can also be used to calculate the changes inrespondent judgments concerning screenconfiguration usability by using the single screen scoreand the average of the two multi-screen scores. Inthis analysis, multi-screens are seen as 29 percentmore effective, 24 percent more comfortable, 17percent easier to learn, 32 percent quicker toproductivity, 19 percent easier for mistake recovery,45 percent easier to track tasks, 28 percent betterfor task focus, and 38 percent easier for movingamong sources.
Discussion: Performance
This section first considers the central question ofthe effectiveness of multiple screens, briefly looks atthe differences among tasks, the differences betweenconditions, then considers the interaction betweenscreens and tasks, and finally examines the
circumstances under which particular screenconfigurations should be adopted.
Screens
The effect of screen configurations is quite clear.Respondents were able to get on task quicker, dothe work faster, and get more of the work done withfewer errors in multi-screen configurations than witha single screen. The gains are solid: 6 percent quickerto task, 7 percent faster on task, 10 percent moreproduction, 16 percent faster in production, 33percent fewer errors, and 18 percent faster inerrorless production. Equally impressive is that thesegains were achieved by turning on an extra monitoror two and providing five minutes of training.
The value added by the screen management tool,Hydravision is subtle. It did not reach significance,but it was consistent and showed its greatest strengthin controlling errors. Very little of the features of thissoftware were used in this study, because of the natureof the tasks and measurements involved.
Tasks
Without question, the most difficult task for most
Figure 2
Figure 2: Analysis of Variance design for screens by task type for each item.
Multi-Screen Displays
49
respondents was the slide editing task. Respondentsreported the least experience with the application(mean of 1.25 on a scale of 0-3). These self-reportswere confirmed in actual observations. A commonfailing was the inability to recognize substantial contentdifferences among slides that had commonbackgrounds. Further, interview responses indicatedthat respondents were frustrated by the awkwardness
of the application’s editing protocols. When the slidetask was removed from analysis, the efficiencies oftime to task and time through task rose from 6 and 7percent to 9 and 10 percent respectively.
The spreadsheet task for its part showed the shortesttimes to completion. Respondents reported slightlymore experience with the spreadsheet application
Table 23
Table 23: Means, standard errors, and confidence intervals for Usability items by screens.
metI sneercS snaeM dradnatSrorrE
lavretnIecnedifnoC%59
dnuoBrewoL dnuoBreppU
evitceffEelgniS 914.6 471. 470.6 367.6neercs-itluM 903.8 741. 810.8 006.8noisivardyH 302.8 651. 498.7 315.8
elbatrofmoCelgniS 945.6 771. 891.6 009.6neercs-itluM 612.8 941. 129.7 115.8noisivardyH 800.8 861. 676.7 043.8
esaEgninraeLelgniS 281.7 661. 258.6 115.7neercs-itluM 583.8 031. 621.8 346.8noisivardyH 883.8 931. 211.8 366.8
ytivitcudorPelgniS 032.6 281. 968.5 195.6neercs-itluM 742.8 341. 469.7 035.8noisivardyH 751.8 171. 818.7 594.8
ekatsiMyrevoceR
elgniS 318.6 361. 094.6 631.7neercs-itluM 690.8 431. 138.7 163.8noisivardyH 180.8 251. 977.7 283.8
gnikcarTksaTelgniS 113.5 812. 878.4 347.5neercs-itluM 427.7 202. 323.7 421.8noisivardyH 717.7 122. 972.7 651.8
sucoFksaTelgniS 234.6 591. 640.6 818.6neercs-itluM 112.8 741. 029.7 205.8noisivardyH 992.8 541. 210.8 785.8
ytilibisseccAsecruoSfo
elgniS 391.6 302. 197.5 495.6neercs-itluM 216.8 921. 753.8 868.8noisivardyH 184.8 351. 871.8 387.8

50
Rocky Mountain Communication ReviewVolume 2:1 Summer, 2004
(M = 1.40) than with the slide application.Observational notes show that respondents benefitedfrom the spreadsheet application’s ease of editing.When errors were made, they were generally entriesin the wrong cell. Most commonly an entire row ofentries were shifted up or down, accounting for therelatively large number of total errors in the individualedits.
The text task showed the fewest errors but also thelowest proportion of completed edits. Respondentsindicated substantial experience with the application(M = 2.22), but few had experience with editingacross screens (most work from paper correctionsto a screen). Observations indicate that the visualtask of locating place from one screen to anotherwas the key difficulty.
Conditions
Conditions represent whether a respondentcompleted the study using two monitors or threemonitors. Interestingly, the study was designed to“naturally” fit a three-monitor display, but the three-monitor condition consistently showed no advantageover the two-monitor condition. Anecdotally, multi-screen users consider the three-monitor display tobe optimum, but it did not show here. Observationsand comments from interviews suggest that the sizeof the monitor interacts with the optimal number ofscreens. Drawing on the comments of onerespondent, a highly experienced graphics editor, the18-inch monitors were too large for a three screendisplay as one could not keep the entire display withinthe field of vision. It may be very useful to advancethis study with one that uses a three 15-inch monitorconfiguration.
Screens by Task
The lesson learned in the screen by task interactionis that there appears to be an optimum level ofexperience with a task that maximizes the immediate
effect of the adoption of multi-screens. Too little asin the slide task, and the inexperience is anoverburden on the multi-screen effect. Too much,as in the text task, and the productive methods ofsingle screen editing prove a worthier competitor toreduce the size of the effect. Both of these conditionsare functions of the testing protocol. Respondentsgiven the regular experience of editing slidepresentations would eliminate many of their difficulties,and respondents given the regular experience in multi-screen editing would return the competition to a levelfield.
The greatest proportion of our respondents (95 %)work only in single screen whether at home, at school,or in the office. As multi-screens were more effectivethan single screen across all tasks on measures ofboth time and production, it is clear that there is littlelearning curve in the adoption of multi-screenconfigurations. The short run benefits of convertingto a multi-screen set up should be immediate and thelong term gains substantial.
Performance Considerations for Adoption ofMulti-screens
This study was designed to simulate office tasks thatinvolve the application of multiple sources ofinformation to a final product. It was, therefore,specifically designed to be responsive to thecharacteristics of multi-screen displays. The evidenceit generated and the recommendations provided herepresume similar circumstances—work that involvesthe integration of multiple sources. In thosecircumstances, the evidence speaks clearly andconvincingly that multi-screen configurations arepreferable and make good economic sense.
But not all work involves multiple sources ofinformation. The question can be raised as to whatproportion needs to be multi-sourced to justify theexpense of adding that additional display port andmonitor. The simplest way to answer that questionis to extrapolate from the time per edit measure. The

Multi-Screen Displays
51
evidence suggests a 16 percent savings in time forthe same level of production. Over a year’s time,one would save $3,840 in labor costs at a $12 perhour clerical wage. Costs for upgrading computersvary by platform, region, and industry. Done at theauthors’ location with PCs, the upgrade would costapproximately $800 (adding a $75 PCI display card,a $600 LCD monitor, and the installation labor).
The break even point is approximately 21 percent ofthe work. If more than 21 percent of the workinvolves the use of multiple sources of information,upgrading to multiple screens is cost effective. Thereader is also reminded that the break even pointwill be lower (less than 20%) with a less experienced(rather than diversely experienced) work force andeven lower (less than 17 %) with a highly experiencedwork force.
Discussion: Usability
Usability results showed the consistency of a mantra:Multi-screens either with or without managementsoftware are reported as significantly more usablethan single screens on measures of effectiveness,comfort, learning ease, time to productivity, mistakerecovery, task tracking, task focus, and ease of sourcemovement. Slide tasks were considered the mostdifficult; spreadsheet tasks the easiest. Further, theleast proficient respondents moved immediately tothe level of the most proficient in their evaluations.They were not intimidated by the introduction of multi-screen displays. The open-ended interview dataconfirmed the positive response to multi-monitordisplays. Those data showed overwhelmingly morepositive comments for multi-screen and forHydravision than for single screen and indicated thatboth multi-screen and Hydravision would be moreuseable and more likely associated with positiveaffect. Unlike many technological improvements, theadoption of multi-screen configurations should be apositive experience for the workforce and highlypreferred over single screen arrangements. It notonly increases productivity; the work is also judgedas easier to do.
Summary and Conclusions
This study compared single screen computer displayconfigurations with multi-screen displays withoutscreen management software and with multi-screendisplays with screen management software—ATI’sHydravision. The comparisons were made usingthree types of ordinary office editing tasks in slide,spreadsheet, and text applications.
Multi-screens fared significantly better than singlescreen on time and number performance measures.Respondents got on task quicker, did the work faster,and got more of the work done with fewer errors inmulti-screen configurations than with a single screen.They were 6 percent quicker to task, 7 percent fasteron task, generated 10 percent more production, were16 percent faster in production, had 33 percent fewererrors, and were 18 percent faster in errorlessproduction. These gains are achieved by turning ona monitor and five minutes of training. Nonetheless,some care must be taken in extrapolating these gainsover three 5-minute tasks to time saved andproduction increases achieved over a 40 hour workweek. Such gains depend on the nature of the workand the amount of time spent on task and on multi-screen tasks. There is a utility in replicating this studyusing the tasks integrated into a continuous workperiod rather than as separate episodes as done here.
Respondents considered multi-screen configurationssignificantly more useful than single screen on everyusability measure. Multi-screens were seen as 29percent more effective for tasks, 24 percent morecomfortable to use in tasks, 17 percent easier to learn,32 percent faster to productive work, 19 percenteasier for recovery from mistakes, 45 percent easierfor task tracking, 28 percent easier in task focus,and 38 percent easier to move around sources ofinformation. These increases were immediate post-test gains. As always, long-term gains may bedifferent.
There were no significant differences between two-

52
Rocky Mountain Communication ReviewVolume 2:1 Summer, 2004
with Christopher Connery, Director of Marketing.James Anderson was the Principal Investigator.
1. Hydravision, ATI’s screen managementsoftware, was used, hence the HV acronym.
References
Barua, A., Kriebel, C. & Mukhopadhyay, T. (1991).Information Technology and Business Value: AnAnalytic and Empirical Investigation, Austin, TX:University of Texas Working Paper, (May).
Binder, C. (2001). Measurement: A few importantideas. International Society for PerformanceImprovement. Performance ImprovementJournal. 40(3), 20-28.
Bohannon, W.K. (2003). Double vision. EmediaMagazine, 16(5), 22-28.
Brown, R.M., & Ruf, B. (1989). Applying softwaredesign principles to accounting software: A directmanipulation approach. Journal of InformationSystems, 4(1), 41-55.
Brynjolfsson, E., & Yang, S. (1996). Informationtechnology and productivity: A review of the literature.Advances in Computers, 43, 179-214.
Davis, F.D. (1989). Perceived usefulness, perceivedease of use, and user acceptance of informationtechnology. MIS Quarterly, 13(3), 319-340.
Delfino, E. (1993). Windows and multitasking.Database Magazine, 16(6), 87-91.
Dyson, P. (2002). New technology sparks innovationin displays. Seybold Report Analyzing PublishingTechnologies, 2(12), 11-14.
Gerlach, J.H., & Kuo, F. (1991). Understandinghuman-computer interaction for information systems
monitor and three-monitor multi-screenconfigurations. There was some evidence, however,of a relationship between optimum monitor size andthe optimum number of monitors. The gains providedby an additional monitor in a three-monitor array canapparently be offset if the monitors are too large,forcing the user to physically track across the screenswith head movement. It is recommended that a three-monitor array with 15 to 17-inch monitors be tested.Testing should also investigate portrait and landscapeorientations within the array.
Given the overwhelming consistency of both theperformance and usability measures, multiple monitorconfigurations are recommended for use in anysituation where multiple screens of information arean ordinary part of the work. There will bemeasurable gains in productivity, and the work willbe judged as easier to do. In addition, because thegains are strong, multiple monitors are alsorecommended as cost effective where multi-screentasks represent as little as 15 percent of the work forthe highly competent, 17 percent for entry levelcompetence, and 21 percent for the general workforce.
The contemporary status of computer displays ispoised on a moment of convergence as operatingsystems can now handle multiple monitors with someroutine; display boards with multiple ports are readilyavailable and inexpensive; and LCD monitors withreduced foot print, space, and energy requirements,as well as cost are now becoming the standard. Thisstudy demonstrates that multiple monitor arraysshould also be a standard of the workplace.
Notes
This research was initiated by Don Lindsay, ChiefInvestigator, Lindsay Research & Consulting, Inc .andsponsored by ATI Technologies Inc. in collaborationwith Neil Rennert, Marketing Research Manager, andRichard Mulcahy, Senior Product MarketingManager, and by NEC/Mitsubishi in collaboration
Multi-Screen Displays
53
design. MIS Quarterly, 15(4), 527-549.
Grudin, J. (2003). Primary tasks and peripheralawareness: A field study of multiple monitor use.Redman, WA: Microsoft Research.
Jorgenson, D.W., & Stiroh, K.J. (1999). Informationtechnology and growth. American EconomicReview, 89(2), 109-116.
Lewis, J.R. (1995). IBM computer usabilitysatisfaction questionnaires: Psychometric evaluationand instructions for use. International Journal ofHuman-Computer Interaction, 7(1), 57-58.
Lindsley, O.R. (1997). Performance is easy tomonitor and hard to measure. In Kaufman, R.,Thiagarajan, S., & MacGillis, P. (Eds.), TheGuidebook for Performance Improvement:Working with Individuals and Organizations (pp.519-559). San Francisco: Jossey-Bass/Pfeiffer.
Randall, N. (1999). Multiple monitors. PCMagazine, 18(16), 189.
St. John, M., Harris, W. C., & Osga, G. (1997).Designing for multi-tasking environments: Multiplemonitors vs. multiple windows. Proceedings of theHuman Factors and Ergonomics Society (pp.1313-1317). Santa Monica, CA: The Society.
Sherry, L., & Wilson, B. (1996). Supporting humanperformance across disciplines: A converging of rolesand tools. Performance Improvement Quarterly,9(4), 19-36.
Stolovich H.D., & Keeps, E.J. (1992). What ishuman performance technology? In H.D. Stolovichand E.J. Keeps (Eds.) Handbook of HumanPerformance Technology (pp. 3-13). SanFrancisco: Jossey-Bass.
Vellotti, J.P. (2001). XP. PC Magazine, 20(9), 120.