productivity and efficiency of agricultural extension ... · productivity and efficiency of...
TRANSCRIPT

Productivity and Efficiency of Agricultural Extension Package in Ethiopia
By
Gezahegn Ayele, Mekonnen Bekele and Samia Zekeria
The Ethiopian The Ethiopian The Ethiopian The Ethiopian Development Research InstituteDevelopment Research InstituteDevelopment Research InstituteDevelopment Research Institute (EDRI)(EDRI)(EDRI)(EDRI)
Research Report 5
Addis Ababa, Ethiopia
June, 2006
2
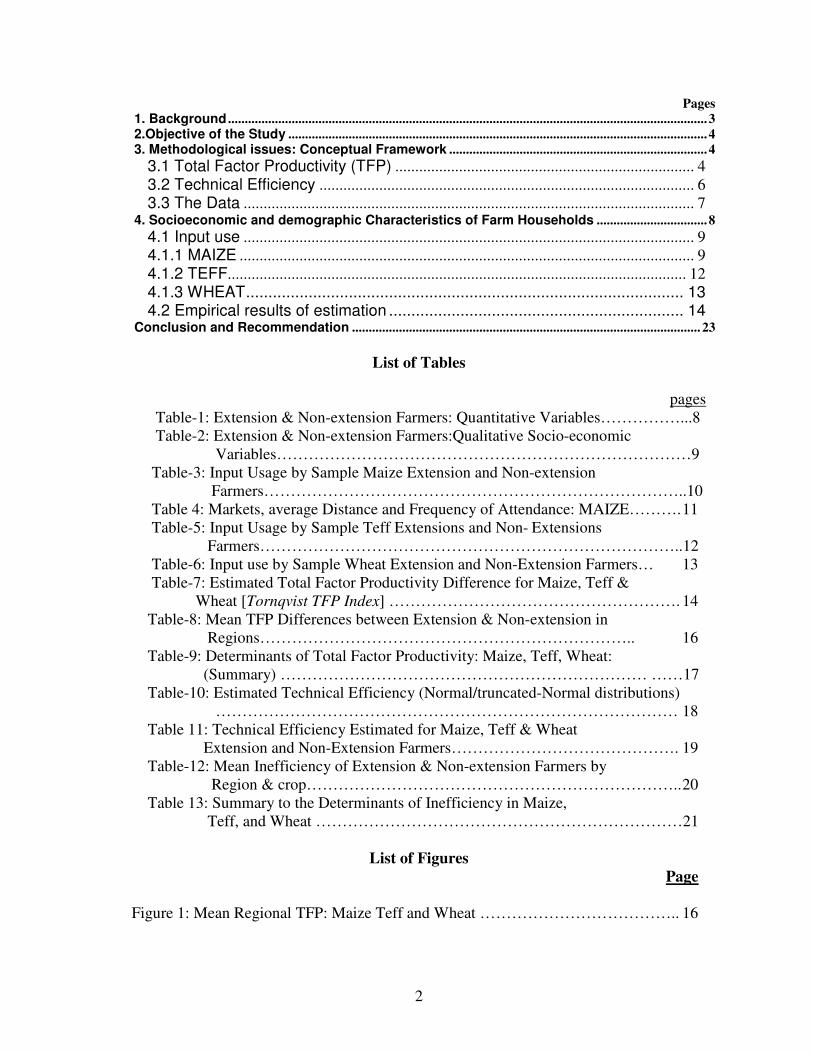
Pages
1. Background ............................................................................................................................................... 3
2.Objective of the Study ............................................................................................................................. 4 3. Methodological issues: Conceptual Framework ............................................................................. 4
3.1 Total Factor Productivity (TFP) ........................................................................... 4
3.2 Technical Efficiency .............................................................................................. 6
3.3 The Data ................................................................................................................. 7 4. Socioeconomic and demographic Characteristics of Farm Households ................................. 8
4.1 Input use ................................................................................................................. 9
4.1.1 MAIZE .................................................................................................................. 9
4.1.2 TEFF................................................................................................................... 12
4.1.3 WHEAT .................................................................................................. 13
4.2 Empirical results of estimation .................................................................. 14
Conclusion and Recommendation ........................................................................................................ 23
List of Tables
pages
Table-1: Extension & Non-extension Farmers: Quantitative Variables……………...8
Table-2: Extension & Non-extension Farmers:Qualitative Socio-economic
Variables……………………………………………………………………9
Table-3: Input Usage by Sample Maize Extension and Non-extension
Farmers……………………………………………………………………..10
Table 4: Markets, average Distance and Frequency of Attendance: MAIZE………. 11
Table-5: Input Usage by Sample Teff Extensions and Non- Extensions
Farmers……………………………………………………………………..12
Table-6: Input use by Sample Wheat Extension and Non-Extension Farmers… 13
Table-7: Estimated Total Factor Productivity Difference for Maize, Teff &
Wheat [Tornqvist TFP Index] ………………………………………………. 14
Table-8: Mean TFP Differences between Extension & Non-extension in
Regions…………………………………………………………….. 16
Table-9: Determinants of Total Factor Productivity: Maize, Teff, Wheat:
(Summary) …………………………………………………………… ……17
Table-10: Estimated Technical Efficiency (Normal/truncated-Normal distributions)
…………………………………………………………………………… 18
Table 11: Technical Efficiency Estimated for Maize, Teff & Wheat
Extension and Non-Extension Farmers……………………………………. 19
Table-12: Mean Inefficiency of Extension & Non-extension Farmers by
Region & crop…………………………………………………………….. 20
Table 13: Summary to the Determinants of Inefficiency in Maize,
Teff, and Wheat ……………………………………………………………21
List of Figures
Page
Figure 1: Mean Regional TFP: Maize Teff and Wheat ……………………………….. 16

3
1. Background
It is always claimed that Agriculture remained to be the mainstay of Ethiopian economy
despite the dismal performance of the sector. Various factors were held responsible for
poor performance, despite the attempts were made to modernize it. In an effort to change
the living standard of the population and to transform agriculture, the government
declared the Agricultural Development Led Industrialization (ADLI) in 1993.In the
broader context of ADLI, agriculture is expected to fuel the industrial growth
simultaneously. Following ADLI, Rural development policy and strategy has been
defined particularly focusing on agricultural development.
One of the major programs in the rural development in general and the Ethiopian
agriculture in particular is the extension package that supported the promotion of modern
agricultural technologies and intensifies agricultural growth. The major outcome of the
the 1991 market liberalization is that Ethiopian peasants can produce and sell their
produce at the free market prices. The pre-1991 command economy largely created
disincentive to the farmers to market their output and this has remained to have
constrained output and further growth in productivity despite the introduction of new
technologies in the mid 1970s up until end of 1980s. According to Todaro (2003) the
prevalence of technology in agriculture may not attain its target goal unless the social,
institutional, cultural and commercial, constraints are improving. Given an irreversible
trend of declining size of cultivated land, with the population growth, mismatch with
production, one of feasible way to raise production would be to increase land productivity
through agricultural extension. Many evidences have indicated that due to land shortage,
cropping systems in Africa is in transition from farm abundant to land constrained system
(Reardon et al 1996). It is therefore, suggested that for rapid growth in agriculture to be
sustainable there is a need for generating and adoption of various alternative
technologies.
Since 1995/96-cropping season when Participatory Agricultural Demonstration Extension
of Technology (PADETS) became operational, fertilizer and improved seeds have
witnessed widespread with increasing rates of adoption, despite the removal of all input
subsidy since 1997/98. Between 1995 and 1999, the consumption of fertilizer increased
from 35,272 to 2,168,756 quintals. In the same period, improved seed application rose
from 11,043 to 177,783 quintals. The number of participating farmers leaped from 31,256
to 3,731,217 covering nearly 40% of the farming population The value of credit, which
began at 8.1 million, has reached 150.2 million. Demonstration plots in the fields of
farmers covered by the package rose to at 3,807,658. In terms of its spread in hitherto
unknown areas, adoption rates of new varieties & fertilizer, diffusion and increased yield
rates resemble green revolution in cereals (Tenkir, et al., 2004).
Given the state of agricultural productivity in Ethiopia, the scene of the technology
diffusion and adoption has to change the production frontier of farmers. To this end while
some indicators of adoption levels have been treated to some extent, however, its effect
on the level of productivity has not been sufficiently addressed by researchers. This study

4
therefore aimed at contributing towards this end thereby looking into the impact of the
technology packages on the productivity & technical efficiency of farmers in Ethiopia.
2.Objective of the Study
The study has the following general and specific objectives.
1) To assess the total factor productivity the performance of extension
participating farmers in comparison to non-extension farmers.
2) To estimate the technical efficiency for both extension and non-extension
farmers1 and identify determinants.
3. Methodological issues: Conceptual Framework
3.1 Total Factor Productivity (TFP)
The economic theory of production has provided the analytical framework for most
empirical research on productivity measurement. The cornerstone of the theory is the
production function, which postulates a well-defined relationship between output and
factor inputs. Productivity can be achieved from two sources; first, through technological
change of using improved practices of production such as ploughs, fertilizers, pesticides,
improved seeds, etc which pushes the production frontier upward; and second, if the
farmer has got further skills in using the existing techniques of production, productivity
will increase.
Measuring productivity is conceptually better understood when total factor productivity
(TFP) is measured empirically. Total factor productivity is the ratio of aggregate outputs
to aggregate inputs. Some studies use interspatial measures of total factor productivity
based on Divisia Index as defined by Denny and Fuss (1980), where efficiency is
estimated for different kinds of land contracts. The TFP approach is found to be suitable
for cases where the complexity and diversity of smallholder farming, like in Ethiopia, is
large; it also makes comparison possible among different farming systems. The
superiority of the method of TFP over the conventional method of measuring land and
labour productivity emerges from the fact that the later is misleading if there is high
substitutability between inputs (Gavian and Ehui, 1996). Within the TFP methods, there
are different kinds of measurement techniques that need to be seen from various
methodological perspectives.
Most of the empirical literature dealt so far focused on productivity of individual factor
productivities in Africa such as labour and land productivities and some of those studies
got strong evidence that fertilizer and improved seeds are associated with higher yields;
and considerable yield variability across fields within a given technology type (Howard
et, 1999). Reardon et al 1996, also, indicated that returns per labour day and output per
hectare of wheat maize and soybeans are generally low for some African countries and
the yields differ by crop, zone, technology and farm size; determinants of productivity
1Technical efficiency is the ability of a firm to obtain maximal output from a given set of inputs while
alocative efficiency is the ability of a firm to use inputs in optimal proportions, given their respective prices
(Coelli, 1995).

5
according to this evidence are many.2 Moreover, they indicated that policy reform
(exchange rate, interest rate and market liberalization) is necessary but not a sufficient
condition to spur productivity.
Another study in Ethiopia revealed that tenure difference in terms of “rented-in” and
“owned” has significant effect on sorghum and wheat productivity while there is no
significant impact on teff and maize (Abebe and Negussie, 2005). The same study
revealed that at regional level land fragmentation (number of parcels) and land
conservation has positive relationship with the sample crops yields, remarking a possible
difference at zonal level in the case of land fragmentation. An empirical study using
discriminant analysis of participants and non-participants in extension package program
in Oromia region indicates that the yields of maize and wheat from plots of National
Extension Package participants as compared to non-participants in the study area is found
to be as high as 50% for maize and 39% for wheat compared to yields of the same crops
from the non- participant farmers, with insignificant difference for teff and sorghum
(Samia and Habe, 2005). However, most of those studies conducted earlier in Ethiopia,
have focused on the technical efficiency, and not so much on factor productivity. In this
regard, one of the most commonly adopted indexes of measurement of TFP is the
Tornqvist quantity index, shown below.
The Tornqvist Index
ℓnTFP*
st
= ( )( ) ( )( ) −
= =−+−−+∑ ∑
N
1
N
1
iisiis2
1iitiit
2
1
i i
ylnylnωylnylnω ωω
( )( ) ( )( )
= =−+−−+∑ ∑
N
1j
N
1j
ijsjjs2
1ijtjjt
2
1ylnlnυυylnlnυυ XX
Where: TFPst* is a transitive TFP index and
iω = arithmetic mean of output shares; jυ = arithmetic mean of input shares; Pit and Qit are price and quantity of
commodity i at time t respectively.
iyln = ,lnYM
1 M
1k
ik∑=
and
iyln = ∑=
M
1k
iklnXM
1; all averages are taken over the M enterprises or time periods
or a combination of both.
The estimated value of the index tells us the direction of change of TFP (Collie, 1998). In
this study, first the TFP has been estimated followed by linear regression model to
2 Fertilizer, seed, animal traction, organic inputs & conservation investments, farm size and land tenure,
non-cropping income (including credit), land preparation efforts and wel-functioning input & output
markets.

6
identify factors influencing TFP; as was applied in some studies on Ethiopian agriculture
(Abate and Gezahegn, 2002).
3.2 Technical Efficiency
In estimating the frontier, we use the model derived by Battese & Coelli (1993,1995):
Yi = F (Xi; ββββ) + εεεεi ; εεεεi = Vi - Ui; where Ui ≥≥≥≥0 Where, Yi: output of the farm i=1,2,…N
F (…): is the production technology
X is vector of N inputs
ββββ is vector of unknown parameter to be estimated
εi is the error term with two components of:
Vi : is non-negative error term(due to the decision or action of the farmer);
Ui: the technical inefficiency component (factors out of control of the farmer /
decision maker.
Ui = ∑δZi + ωi, Ui ≥0; where Zi factors affecting the technical efficiency of the
farm and δ is parameter.
The symmetric random error Vi accounts for random variations in output because of
factors, such as, measurement error, exogenous shocks; etc, which is not under the
control of the farmer and it is assumed to be independently and identically distributed as
N (0,σ2vi). Moreover, the asymmetric non-negative random error, Ui measures technical
inefficiency relative to the SF and is assumed to be to be independently and identically
distributed non-negative truncations (at zero from below) of the N (µ, σ2ui) distribution.
The variance parameter of the model is parameterized as:
σε
2
= σ2
u+σ
2
v and γ =σ
2u σ
2
u; 0<γ<1:
y~ = yi -ui =f(xi; β)-vi , after finding the estimates of ui and vi;
Where,
y~ : is the observed output of the ith
farm household adjusted for the stochastic random
noise captured by ui; this equation is used to derive the technically efficient input
vector and to derive algebraically.
The model we use matters in measuring the efficiency of firms (Liu, 2005). There are two
common functional specifications the Cobb-Douglas stochastic frontier & the translog.
Cobb-Douglas is production function is criticized for its rigidity flexible despite the
multi-colinearity problem. The functional form of the stochastic frontier is determined by
testing. Thus, the frontier models estimated are defined as:
yit = βo + ∑=
n
1j
Xiiβ + Vit- Uit (Cobb-Douglas) ; and
yit = βo + ∑=
p
1i
iiXβ + ∑=
p
1j
hjijh XX∑=
p
1i
β + Vit- Uit (Translog).
We select the appropriate model specification through tests. Wald tests are commonly
used parametric test for testing the null hypothesis of no inefficiency, i.e., that the
variance of the one-sided process assumes zero. However, additional Monte Carlo
experiments show that the size properties of this test are very weak (STATA, 2003). The

7
estimation of truncated-normal distribution stochastic frontier model and the log
likelihood test makes continuous iteration and attaches the maximized iteration, which is
used to calculate the log likelihood statistics. The likelihood-ratio test statistic λ = -2{log
[Likelihood (Ho)]– log [Likelihood (H1)]} has approximately a 2
qχ distribution with q
equal to the number of parameters assumed to be zero in the null hypothesis; it is
compared with the critical values of the 2
qχ _distribution and decided between the two
models. The power of the LR test is increased by testing jointly the null hypothesis that γ
= δi =0, for all i, meaning that neither the constant term nor the inefficiency effects are
present in the model; since γ takes values between 0 and 1, any LR test involving a null
hypothesis which includes the restriction that γ = 0 has been shown to have a mixed χ2
distribution, with appropriate critical values (Kodde and Palm, 1986) as quoted in Piesse,
et al (2002).
The technical inefficiency effect term is distributed N (µi,σ 2
v) where µi can be specified
and defined as:
µi= βo + ∑=
n
1j
oδ Zij ; where Zj are socioeconomic & infrastructure variables
which are identified in the literature or taken from the observation of the researcher.
The estimation of the inefficiency model has two approaches. The first is simultaneous
equation modeling (Battese & Coelli, 1995) and the two-stage modeling (discussed
above). The advantage of the simultaneous equation technique over the two stages is that
it incorporates farm specific factors in the estimation of the production frontier because
those factors may have a direct impact on efficiency (Wadud, 2002). The estimates for ui
& vi are found from the SF model & the technical efficiency predictors by replacing
parameter by their maximum likelihood estimates. We use the maximum likelihood
estimation to identify the determinants, though the choice of model is often
controversial (Batsse et, 1995).
3.3 The Data
For this study, the May 2001/02 survey data generated by EDRI was combined with the
survey data collected during the same period by the Central Statistical Authority’s (CSA)
on Ethiopian Agricultural Sample Enumeration extension package data, mainly for the
yield data1.
The sampling method used is systematic sampling, which includes random selection of
farm households in the order of zones from the four major regions of the country, which
represents over 85% of the population. Two woredas were selected from each zones
depending on the level of adoption of modern input technology. Within the woredas, PAs
are randomly selected through stratified sampling, and then farm households are selected
randomly through systematic sampling. As the objective of this study is to estimate Total
Factor Productivity (TFP) and Technical Efficiency (TE), we took the sample for each
crop out of the national sample of 1921 farm households (Agricultural Extension Survey
1 The yield data from CSA is based on a more accurate measure of yield index using crop-cut samples

8
of EDRI of the 2001/02); until we get complete data set on the variables required to
estimate TFP differential between extension & non-extension farmers (Tornquvist index),
we continuously reduced the sample size and finally we arrive at the matching sample
size for each crop i.e. 115 for maize, 55 for wheat and 112 for teff. For technical
efficiency estimation, however, the sample size is relatively larger i.e. 186 for maize &
244 for teff.
4. Socioeconomic and demographic Characteristics of Farm Households
Table-1 depicts the socioeconomic and demographic characteristics of sampled
households. Household size has no significant effect between extension and non-
extension farmers, although higher mean values for extension farmers in case of wheat
and teff production were observed. Teff and wheat are relatively more labour and
technology intensive. The number of livestock the households own has mixed features;
first, for maize and wheat farmers, the average number of livestock is higher for adopters,
which may show the relatively higher income that may lead to purchase the input
packages. On the second level,, the number of livestock in case of teff is higher for non-
extension farmers, (standard deviation is for extension farmers 12.10 compared to
35.44 that of non-extension farmers).
Table-1: Extension & Non-extension Farmers: Quantitative Variables
Corp/variable Extension Non-extension
farmers Maize (Maximum N=115) Mean SD Median Mean SD Median
Age of Head 41.94 14.33 40.00 44.00 14.00 40.00
Household size 6.28 2.17 6.00 6.0 2.00 6.00
No of Male 3.50 1.93 3.00 3.00 1.00 3.00
No of Female 2.97 1.66 3.00 3.00 1.00 3.00
No of livestock 5.44 4.68 4.00 4.48 3.48 3.00
Wheat (Maximum N= 55)
Age of Head 43.21 13.89 44.00 45.64 16.72 43.00
Household size 5.75 2.09 6.00 5.32 1.65 5.50
No of Male 3.14 1.53 3.00 3.00 1.29 3.00
No of Female 2.63 1.45 2.00 2.32 1.11 2.00
No of livestock 5.40 4.17 5.00 4.33 3.00 3.07
Teff (Maximum N=112)
Age of Head 47.0 13.00 45.00 45.00 14.00 46.00
Household size 6.00 2.00 6.00 5.00 2.00 5.00
No of Male 3.00 2.00 3.00 3.00 2.00 3.00
No of Female 3.00 1.00 3.00 3.00 1.00 2.00
No. of livestock 8.51 15.19 6.00 12.50 5.09 5.00
Source: Own Summary from Extension Data
From the table 1, one may infer the following important features; first, the proportion of
female household head for the crops producers with larger sample size (maize and teff) is
higher in the non-extensions (15% for maize and 13% for teff) against 9% and 12% for
9
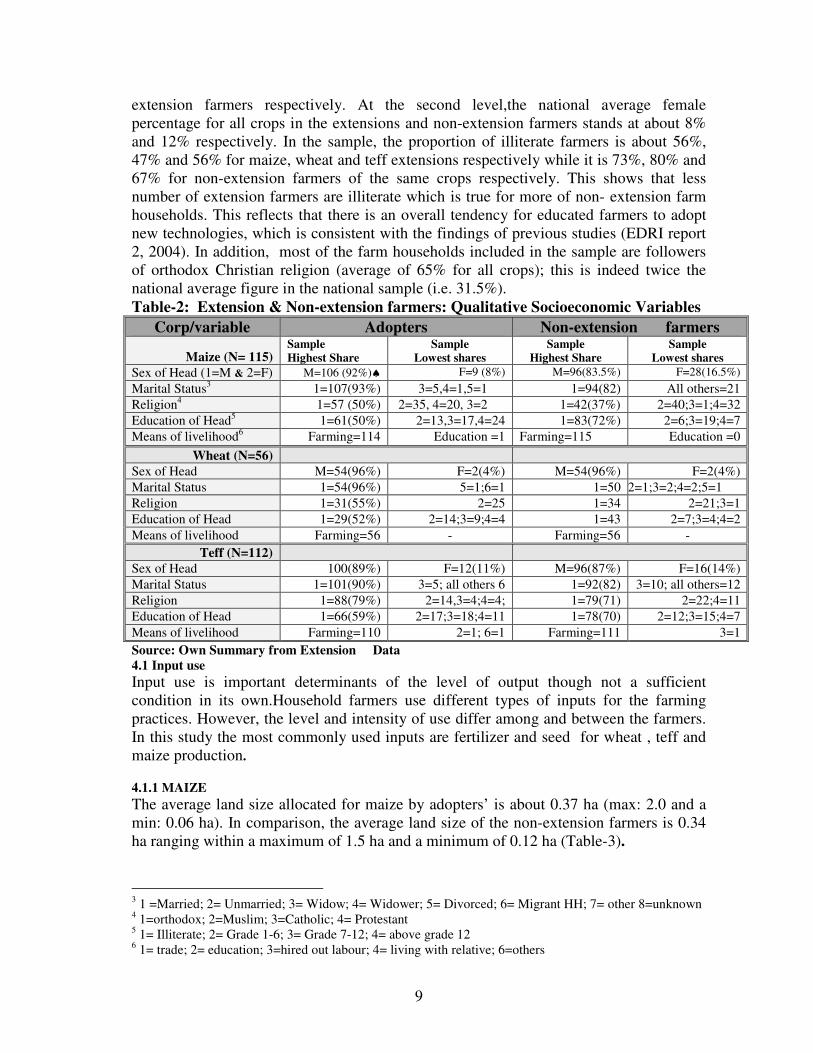
extension farmers respectively. At the second level,the national average female
percentage for all crops in the extensions and non-extension farmers stands at about 8%
and 12% respectively. In the sample, the proportion of illiterate farmers is about 56%,
47% and 56% for maize, wheat and teff extensions respectively while it is 73%, 80% and
67% for non-extension farmers of the same crops respectively. This shows that less
number of extension farmers are illiterate which is true for more of non- extension farm
households. This reflects that there is an overall tendency for educated farmers to adopt
new technologies, which is consistent with the findings of previous studies (EDRI report
2, 2004). In addition, most of the farm households included in the sample are followers
of orthodox Christian religion (average of 65% for all crops); this is indeed twice the
national average figure in the national sample (i.e. 31.5%).
Table-2: Extension & Non-extension farmers: Qualitative Socioeconomic Variables
Corp/variable Adopters Non-extension farmers
Maize (N= 115) Sample
Highest Share
Sample
Lowest shares
Sample
Highest Share
Sample
Lowest shares
Sex of Head (1=M & 2=F) M=106 (92%)♠ F=9 (8%) M=96(83.5%) F=28(16.5%)
Marital Status3 1=107(93%) 3=5,4=1,5=1 1=94(82) All others=21
Religion4 1=57 (50%) 2=35, 4=20, 3=2 1=42(37%) 2=40;3=1;4=32
Education of Head5 1=61(50%) 2=13,3=17,4=24 1=83(72%) 2=6;3=19;4=7
Means of livelihood6 Farming=114 Education =1 Farming=115 Education =0
Wheat (N=56)
Sex of Head M=54(96%) F=2(4%) M=54(96%) F=2(4%)
Marital Status 1=54(96%) 5=1;6=1 1=50 2=1;3=2;4=2;5=1
Religion 1=31(55%) 2=25 1=34 2=21;3=1
Education of Head 1=29(52%) 2=14;3=9;4=4 1=43 2=7;3=4;4=2
Means of livelihood Farming=56 - Farming=56 -
Teff (N=112)
Sex of Head 100(89%) F=12(11%) M=96(87%) F=16(14%)
Marital Status 1=101(90%) 3=5; all others 6 1=92(82) 3=10; all others=12
Religion 1=88(79%) 2=14,3=4;4=4; 1=79(71) 2=22;4=11
Education of Head 1=66(59%) 2=17;3=18;4=11 1=78(70) 2=12;3=15;4=7
Means of livelihood Farming=110 2=1; 6=1 Farming=111 3=1
Source: Own Summary from Extension Data
4.1 Input use
Input use is important determinants of the level of output though not a sufficient
condition in its own.Household farmers use different types of inputs for the farming
practices. However, the level and intensity of use differ among and between the farmers.
In this study the most commonly used inputs are fertilizer and seed for wheat , teff and
maize production.
4.1.1 MAIZE
The average land size allocated for maize by adopters’ is about 0.37 ha (max: 2.0 and a
min: 0.06 ha). In comparison, the average land size of the non-extension farmers is 0.34
ha ranging within a maximum of 1.5 ha and a minimum of 0.12 ha (Table-3).
3 1 =Married; 2= Unmarried; 3= Widow; 4= Widower; 5= Divorced; 6= Migrant HH; 7= other 8=unknown
4 1=orthodox; 2=Muslim; 3=Catholic; 4= Protestant
5 1= Illiterate; 2= Grade 1-6; 3= Grade 7-12; 4= above grade 12
6 1= trade; 2= education; 3=hired out labour; 4= living with relative; 6=others

10
Table-3: Input Usage by Sample Maize Extension and Non-extension Farmers Item Extension Non-extension
N Min Max Mean Std N Min Max Mean Std
Land Size 115 0.06 4.0 0.46 0.5 115 0.12 1.50 0.34 0.2
Total Urea & DAP (Kg) 115 4.00 400 71.82 65.5 115 0 0 0 0
Improved
Plus Local
Seed
Total 887
0.25 50.0 9.0 7.4 115 0.25 90.00 8.9 6.8
Only Selected seed 71(62%) 0.25 50 8.4 8.3 115 0 0 0 0
Only Local seed 28 .5 19 6.9 4.2 115 0.25 90.00 8.9 6.8
Both (sum) users 11 5 27.5 15.9 7.1 115 0 0 0 0
Natural Fertilizer (Kg) 18 0.50 200 93.7 67.6 1 2.00 2.00 2 0
Chemical Expenditures 46 10.00 78 13.7 19.9 115 0 0 0 0
Receive Advice Offered? Y=65, n=14 - - - - Y=14 - - - -
Total No of OXEN 115 0.00 5 1.51 1.16 115 1.00 5.00 1.11 0.7
Total OTDs 115 0.74 64 11.6 11.0 115 0.75 38.00 8.9 6.8
Labor in man-days 115 2.00 228 48.8 42.0 115 3.50 113.75 34.06 22.4
Source: Own computation from Extension Data
There is high variation in the fertilizer use among extension farmers. It varies from a
maximum of 400 kg to a minimum of 4 kg, with an average of 71.8 kg. Among the
adopters, there are 18 (only 15.6%) who utilize natural fertilizers in addition to the
artificial ones. When we see the seed input-use by the sample extension maize producers
71(61%) responded to have used improved seed, 65(24%) of them use only local seeds
9.5% of them use a mixture of both types of seeds. Obviously, the non-extension maize
producers use local maize seeds. It is believed that farmers use chemicals for pesticides,
weeds, etc; however, in the sample there are 46(40%) extensions and no non-extension
farmers using chemicals in maize production. The other component is advises and
follow-up offered by the local extension agents on inputs, cultural practices, chemicals
and others. To the question asked on whether the adopter is getting advice offered with
respect to all crops, 65 extension farmers (56.5%) responded to have used input/advice
and advice on cultural and other practices while 50(43%) of them didn’t receive any
types of extension advice. This is similar for all of the three crops extension adopters, but
varies for the non-extension farmers (10%, 21% and 16 % for maize, teff and wheat non-
extensions).
The traditional crop production involves use of draught power input of oxen. In this
regard, the number of oxen the farmers own affects their production. In the maize sample
respondent extension and non-extension, 49 among N=78 (63%) and N=37 among N=84
of them (44%) have two or more oxen respectively. The larger percentage of more than
7 The remaining are reported as missing data
11
two oxen extension farmers owners as compared to non-extension consistent with the
sample size of 186. This shows that more extension participating farmers have the
required number of oxen for tilling and adopting technologies compared to the non-
extension farmers. The number of farmers with no oxen ownership is also greater for the
non-extension 46(40%) than that of Extension 37(32%) farm households. In terms of the
total OTD used, for extension and the non-extensions the mean is 11.6 (min: 0.74 & max:
64) and 8.9 (min: 0.75 & max: 38) respectively, which depicts that more intensive in
cultivation for extensions. The characteristics of labor input indicates similar trend. The
average labour input for extension farmers is 48.8 AE within a range of 2.0 to 289 man-
days while for the non-extension the mean is 30.9 in the range of 3.5 to 113.8 man-days,
which remarks the need for higher labour input in adopting modern technologies.
Two more variables included in this descriptive analysis are the credit and market access.
Theoretically it is believed that better access to market derives farmers to be more
productive and efficient thereby opening market opportunities. Among the 115 non-
extension maize farmers, 5 (4%) use all, 19 (17%) use primary and secondary while
91(79%) use only primary maize markets, which is remarkably lower market visit than
the case of non-extension. The non-extensions farmers on average attend less number of
markets (primary, secondary and tertiary), but more frequently than the extension. Most
of the non-adopter maize farmers use the primary market with the average attendance
frequency of 1.4. On average, extensions attend primary, secondary and tertiary markets
at a rate of 1.44, 1.36 and 1.39 times per week; while the non-extensions do 1.44, 2.10
and 1.46 per week respectively (Table-4). Secondary markets are more often visited than
any other markets by the non-extension farmers.
With a larger sample size of 186 maize extensions (non-matching sample), only 23(12%)
of them use all primary, secondary and tertiary markets; 75(40%) use primary and
secondary markets while 84(45%) use only primary markets8. The data shows non-
extensions on average go to visit less number of markets (primary, secondary and
tertiary) but more frequently than the extension. Among the 117 non-adopter maize
farmers who responded to the question of their maize markets, 4 (3%) use all, 31% use
primary and secondary while 66% use only primary maize markets, which is lower
market usage than the case of adopters. Most of the non- extension maize farmers use the
primary market & the average maize market attendance frequency is 1.4.
Table 4. Maize Markets, average Distance and Frequency of Attendance Market Extension Non-extension
1 Usage9 (P, S, T) P=85(74%); S=22(19%); T=5(4%) P=91(79%); S=19(17%); T=5(4%)
2 Mean Distance 4.6, 9.9 & 11.3 respectively for P, S, T 6.7, 11.7 & 9.9 respectively for P, S, T
3 Mean attending
Freq. per week
1.44, 1.36 & 1.39 respectively for
P, S, T
1.44, 2.10 & 1.46 respectively for P,
S, T
8 The average distance for the primary secondary and tertiary markets is about 5.7, 9.5 and 11.2 kms
respectively (according to extension farmers), with a respective average attendance frequency of 1.8, 1.9
and 1.4. 9 P= primary, S= secondary, and T=tertiary

12
In extension package program the role of credit is very important to integrate the input
market and technology adoption. The 115 maize extension response shows that the
farmers are more credit users than the non-extensions farmers nearly in all the crops.
Among 98 extensions that responded to the question of finance on input financing,
39(40%) farmers get access to credit to finance their maize inputs (fertilizers and/or
seed), 48(49%) use their own income to purchase inputs. Here, most of the farmers tend
to borrow for financing fertilizer input (on average 66%) as compared to financing seed
(52%), due to the possibility of using local seed instead of improved seed. A related
assessment is made on access to credit. The response of the farmers shows that of all the
farmers receiving credit, the performances of the agents in relation to importance of
delivery of credit was rated (on average 74% of the extensions), the Peasant Association
assess 14%, the input committee 2%, woreda 4% and others assess 7%.
4.1.2 TEFF
Teff is the most widely adapted crop compared to any other cereal or pulse crop in the
country and can be grown under wider agro-ecologies (temperature and soil condition).
The average land size allocated is 0.67 ha (max: 3.0 & min: 0.06ha), which is relatively
higher variation compared to that of maize. Similar to the case of maize, the average land
size is larger for extension compared to that of non-extension, which is 0.51 (max: 2.5 &
min: 0.06 ha). The use of fertilizer input in teff varies considerably among farm
households. with a mean of 62.3 kg per ha. The mean is lower than the case of maize, but
there is higher standard deviation in maize (Table-5); which shows that the average
productivity variation among the farmers. Maize is general responds better to fertilizer
input than any other crops leading to productivity changes for the extension farmers using
more fertilizer inputs. The higher fertilizer input the higher is the return i.e. increasing
returns to scale, whereas teff has some limit to fertilizer application; this is in consistent
with previous studies in Ethiopia (Hailemariam et al, 2006).
Table-5: Input Usage by Sample Teff Extensions and Non- Extensions
Farmers(N=112)
Item
Maize
Extensions Non-extensions
N Min Max Mean Std N Min Max Mean Std
Land Size 112 .06 2.75 0.64 0.4 112 0.06 2.50 0.6 0.42
Total Urea and DAP (Kg) 112 2.68 200.00 55.6 34.0 0 - - - -
Selected
&
Local Seed
Total 112 2.00 150 31.1 27.2 112 0.16 160.0 29.0 25.7
Only Selected seed 7 6 25 14.4 5.8 0 - - - -
Only Local seed 105 2 150 32.2 27.7 112 0.16 160.0 29.0 25.7
Both SS+LS users 0 - - - - 0- - - -
Natural Fertilizer (Kg) 4 10 100 46 39 0 - - - -
Chemical Expenditure (birr) 30() 3.00 120.00 37.4 25.7 0 - - - -
Receive Advice Offered? Y=59,no=11 - - - 47 - - - -
Total No. of OXEN 112 .00 5.00 1.9 0.71 112 0.00 5.00 1.60 0.67Total OTDs (oxen days) 112 1.75 161.6 24.6 22.5 112 2.0 60.00 19.5 15.0
Labour in man-days 112 6.55 192.0 62.3 42.7 112 5.1 193.0 56.1 43.2
Source: Extension Data CSA 2001
The numbers of extension that are using improved seed are only 7(6%); this seems very
low compared to that of maize (62%) and wheat (18%). The low level of adoption of
13
selected seed in teff is due to the lack of good quality selected seed; particularly teff
varieties run out quickly due to mechanical contamination (Mulat, 1999). Teff is usually
less susceptible to diseases as compared to other cereals and as a result less chemicals are
used; except the need for herbicide chemicals application to protect against weed.
Extensions farmers use chemicals (27% ) unlike all of the non-extensions (Table-5). The
total number of oxen owned by teff extension varies from 0 to 5, with average of 1.9
oxen. About 68% of them have 2 or more oxen; this figure is larger compared to the total
number of extension farmers included in the national sample i.e. (22%) but close to some
village level survey results (Holden, 2004). Extensions with no ox are only 6.3%, which
is very low compared to the case of maize (32.2%) and 16% to wheat extensions. The
range of no oxen is not significantly different for non-extension, 27% for maize, 20.5%
for teff and 28.6% for wheat. When we compare the oxen Timad Days (OTD) and labour
(in man-days)- the mean value found in all crops is greater for extension than that of non-
extensions (Tables-3, 5 and 6) in estimating in total factor productivity and efficiency
parameters.
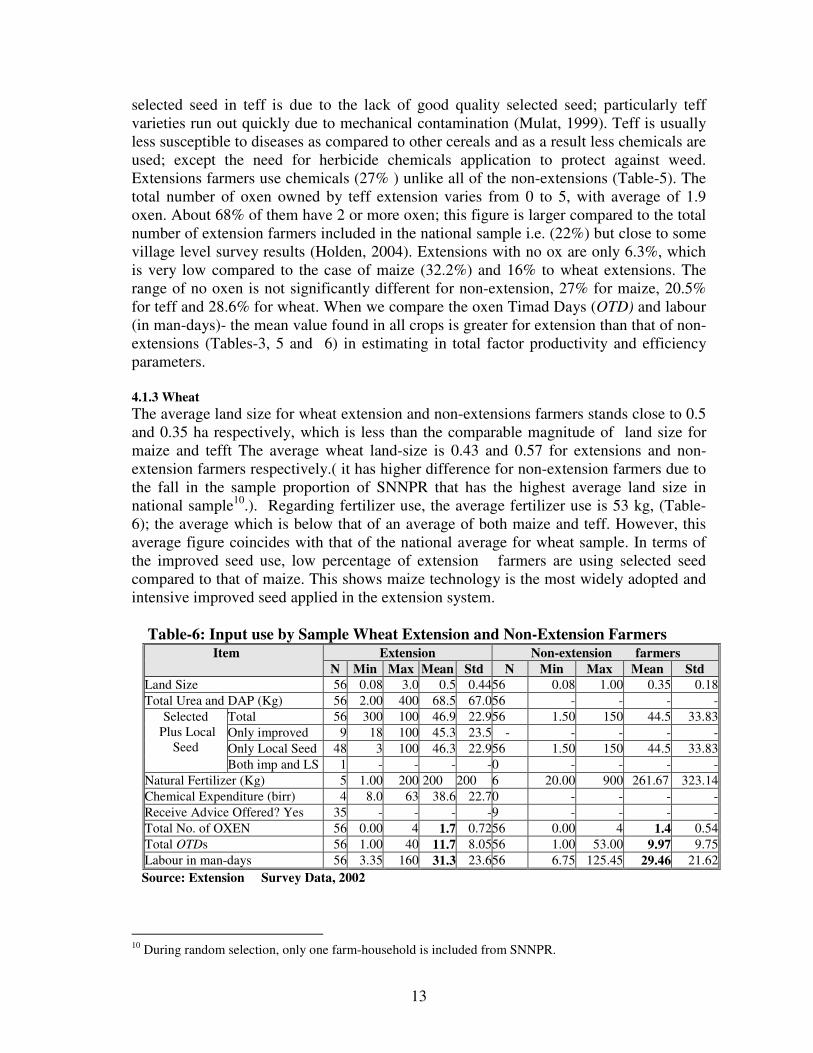
4.1.3 Wheat
The average land size for wheat extension and non-extensions farmers stands close to 0.5
and 0.35 ha respectively, which is less than the comparable magnitude of land size for
maize and tefft The average wheat land-size is 0.43 and 0.57 for extensions and non-
extension farmers respectively.( it has higher difference for non-extension farmers due to
the fall in the sample proportion of SNNPR that has the highest average land size in
national sample10
.). Regarding fertilizer use, the average fertilizer use is 53 kg, (Table-
6); the average which is below that of an average of both maize and teff. However, this
average figure coincides with that of the national average for wheat sample. In terms of
the improved seed use, low percentage of extension farmers are using selected seed
compared to that of maize. This shows maize technology is the most widely adopted and
intensive improved seed applied in the extension system.
Table-6: Input use by Sample Wheat Extension and Non-Extension Farmers
Item Extension Non-extension farmers
N Min Max Mean Std N Min Max Mean Std
Land Size 56 0.08 3.0 0.5 0.4456 0.08 1.00 0.35 0.18
Total Urea and DAP (Kg) 56 2.00 400 68.5 67.056 - - - -
Selected
Plus Local
Seed
Total 56 300 100 46.9 22.956 1.50 150 44.5 33.83
Only improved 9 18 100 45.3 23.5 - - - - -
Only Local Seed 48 3 100 46.3 22.956 1.50 150 44.5 33.83
Both imp and LS 1 - - - -0 - - - -
Natural Fertilizer (Kg) 5 1.00 200 200 200 6 20.00 900 261.67 323.14
Chemical Expenditure (birr) 4 8.0 63 38.6 22.70 - - - -
Receive Advice Offered? Yes 35 - - - -9 - - - -
Total No. of OXEN 56 0.00 4 1.7 0.7256 0.00 4 1.4 0.54
Total OTDs 56 1.00 40 11.7 8.0556 1.00 53.00 9.97 9.75
Labour in man-days 56 3.35 160 31.3 23.656 6.75 125.45 29.46 21.62
Source: Extension Survey Data, 2002
10
During random selection, only one farm-household is included from SNNPR.

14
The table 6 shows, about 87% of the wheat extensions farmers are using local seed as
compared to 100% in wheat non-extension. This figure is almost comparable to the case
of maize non-extension but high localization of improved seed in wheat. Most of the
extension (62%) use advice from development agents. The mean oxen ownership in
maize extension is higher compared to that of non-extensions (1.7 for extensions vs 1.4
non-extension). This tendency is similar for average OTDs spent on wheat production i.e.
11.7 for extensions (min 3.35 and max 40) and 9 OTDs for non-extensions farmers [min
one OTD (0.13 ha land size and max of 53 OTD]. The fact that the value for extension
farmers is higher than that of non-extensions is clearly an indication of more oxen input
use for maize and wheat. The table also depicts the labour allocation in adult equivalent;
the mean labor spent in man-days is 31.3 for extensions and 29.5 man-days for non-
extensions, which is also consistent in labour allocation for maize and teff production.
4.2 EMPIRICAL RESULTS OF ESTIMATION
4.2.1 TOTAL FACTOR PRODUCTIVITY
Our estimate for TFP is based on a single output, as the individual extension and non-
extension farm households are different for the three crops. This makes the share of
output in total output equal to one (or 100%), while the share of quantity of inputs in total
value of inputs is calculated for all the three crops.The value of inputs considered in this
case are value of fertilizer, Oxen days (OTD) and labour calculated as a share of the
value of each input in the total value of inputs. The Tornqvist TFP Index, by its nature is
defined as the output index divided by the input index; the natural logarithm the TFP is
therefore the difference between the natural logarithm of output index and the natural
logarithm of the input index. Both the output and input indices consider quantity of
output and quantity of input, except that input for both extension and non-extensions is
weighted by the share of the value of each input in the sum of value of all inputs (Collie,
1998). As the estimated index indicates, in the analysis the difference between extension
and non-extension output and input usage has been considered as we are basing our
estimate on cross-sectional data. When the index value for two households (where one is
extension and the other is non-extension) is below 1.0, it implies the TFP falls from
extension to non- extension farmer by a percentage equal to the difference multiplied by
100. Similarly, if the estimated TFP is below or greater than 1.0, the TFP increases from
adopter to non-extension farmers by some percent (Collie et al 1998). The estimate of
the TFP for maize, teff & wheat is summarized in Table-7.
Table 7. Estimated Total Factor Productivity Difference for Maize, Teff & Wheat
[Tornqvist TFP Index]
Category Maize Teff Wheat
Number of ∆TFP < 1.000 74 65% 73 65% 53 96%
Number of ∆TFP > 1.000 34 30% 30 27% 2 4%
Number of ∆TFP = 1.000 (0.95-1.05)
7 6% 9 8% 0 0%
Minimum 0.101 - 0.152 - 0.122 -
Maximum 1.954 - 1.914 - 1.602 -
MEAN ∆TFP 0.801 - 0.853 - 0.364 -
Standard Deviation 0.414 - 0.435 - 0.290 -

15
Sample size 115 99% 112 100% 55 100%
Source: Summarized Estimation
Table-7 depicted that on average in 65% of the cases TFP increases when we move from
non-extension to extension maize producers; while there is no significant difference in
TFP between extensions and non-extensions for 6% of the cases. For maize producers,
compared to the other two crops, there is a sizeable difference in TFP level between
matching cases (farmers from different PAs), perhaps implying there is high
technological diffusion in case of maize; and second, agro-ecological difference largely
influences TFP differences in maize, and this is less important in the case of teff.
However, for wheat, as we can see from the table there is a significant difference in TFP
for the same case (matching and non-matching). This shows either there is less diffusion
for wheat technology or more importantly, fertilizer makes difference in TFP. The later
sounds as there is high diffusion for-improved seed wheat with high possible variation in
fertilizer application and soil texture.
Further more, the estimated result reveals that on average TFP falls from extension to
non-extension by 20%, 15% and 60% in matching cases for maize, teff and wheat
respectively. The trend is that in majority of the cases there is a rise in productivity from
non-extensions to extensions. Basically, the level and type of input usage and the level of
diffusion of technologies between extensions and non-extensions determines the level of
TFP. Moreover, the output and productivity of maize & wheat, is affected by the
difference in an on-farm application of improved seed, while for teff this may not be as
important as improved seed, which may have less impact due to high physical
contamination of seeds. Fertilizer input, agro-ecology, soil fertility, and other
socioeconomic factors may contribute to the difference in TFP. In case of wheat,
fertilizer application which is major input in wheat production brings about a
remarkable difference between extensions and non-extensions rather than improved seed
itself. The multiple regressions model is employed to identify the TFP determinants and
TFP difference as follows.
TFPi = α0 + α 1LABOURi + α2 OXTIMDAYSi + α 3 QFERTi + + α 4QSEEDi +
α 5LANDSIZEi + α6HHSIZEi + α 7NOFEMALEi + α 8NOMALEi +
α 9DISTPRMKTi+ α 10 PRICE i + α 11 EXTADVSi + α 12NLSi + α 13SEXi +
α 14AGEi + α 15EDUDMYi + α16 RELIGDUMYi + α 17REGIONDMYi +
α 18WOREDDUMYi + εi Where, LANDSIZE:Land size; HHSIZE: Household Size; LABOR: Labour in adult equivalent;
NULIVSTOK: livestock size; SEX: Sex; DISPRIMKT: Distance from primary market; NUMALE:
Number of male; NUFEMALE: Number of female; QSEED: Quantity of seed; QFERT: Quantity of
fertilizer; PRICE: output Price; AGE: Age; EXTADVIC: Access to Extension advise; EDUCDUMY:
Education Dumy; RELIGDUMY: Religion Dummy; REGDUMY: Region dummy; WORDUMY:
Woreda dummy; εi: error term, εi~ N (0,δ2).
As shown in Table 8, the variation is indicated through TFP differences among regions.
Relatively higher difference is observed between extension and non-extension farmers in
mean TFP in wheat production, with an average TFP differences of about 58%. The least

16
variation is seen in maize production (18% excluding Amhara region) followed by teff
(23%). In all crops, most of the TFP of extension farmers exceeds that of the non-
extension farmers (by 67%, 79% and 96% of the cases in maize, teff and wheat
respectively)- Figure -1.
Table 8: Mean TFP Differences between Extension & Non-extension among Regions CROP Region: Mean %>(Mean=1.0) N Std. Dev MAIZEMAIZEMAIZEMAIZE TigrayTigrayTigrayTigray 0.815 18 0.07 AmharaAmharaAmharaAmhara 0.300 1 - OromiaOromiaOromiaOromia 0.792 68 0.373 SNNPRSNNPRSNNPRSNNPR 0.853 28 0.379 Av. TotalAv. TotalAv. TotalAv. Total 0.8010.8010.8010.801 67%67%67%67% 115115115115 0.4050.4050.4050.405 TEFFTEFFTEFFTEFF TigrayTigrayTigrayTigray 0.686 37 0.397 AmharaAmharaAmharaAmhara 0.787 16 0.468 OromiaOromiaOromiaOromia 1.035 51 0.397 SNNPRSNNPRSNNPRSNNPR 0.597 8 0.390 Av. TotalAv. TotalAv. TotalAv. Total 0.7770.7770.7770.777 79%79%79%79% 112112112112 0.1850.1850.1850.185 WHEATWHEATWHEATWHEAT TigrayTigrayTigrayTigray 0.538 6 0.321 AmharaAmharaAmharaAmhara 0.320 35 0.236 OromiaOromiaOromiaOromia 0.401 14 0.376 SNNPRSNNPRSNNPRSNNPR ---- ---- Av. TotalAv. TotalAv. TotalAv. Total 0.4200.4200.4200.420 96%96%96%96% 55555555 0.1100.1100.1100.110
17
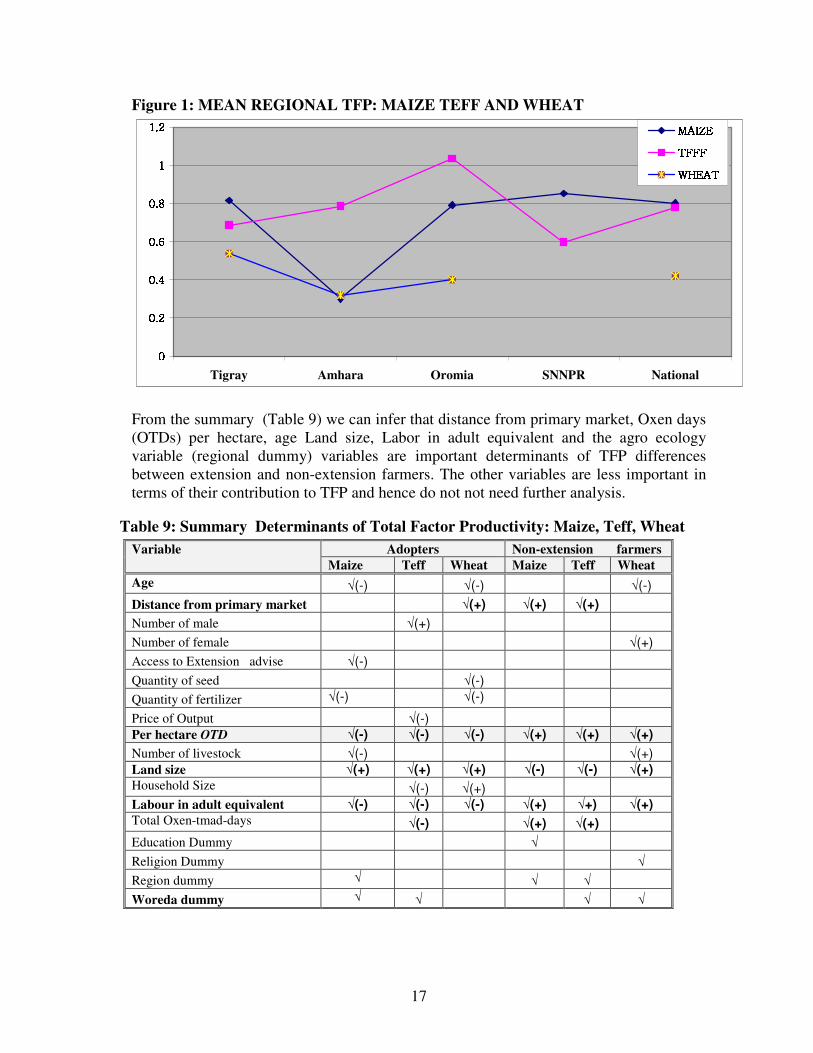
Figure 1: MEAN REGIONAL TFP: MAIZE TEFF AND WHEAT
00000.20.20.20.20.40.40.40.40.60.60.60.60.80.80.80.811111.21.21.21.2
Tigray Amhara Oromia SNNPR National
MAIZEMAIZEMAIZEMAIZETFFFTFFFTFFFTFFFWHEATWHEATWHEATWHEAT
From the summary (Table 9) we can infer that distance from primary market, Oxen days
(OTDs) per hectare, age Land size, Labor in adult equivalent and the agro ecology
variable (regional dummy) variables are important determinants of TFP differences
between extension and non-extension farmers. The other variables are less important in
terms of their contribution to TFP and hence do not not need further analysis.
Table 9: Summary Determinants of Total Factor Productivity: Maize, Teff, Wheat
Variable Adopters Non-extension farmers
Maize Teff Wheat Maize Teff Wheat
Age √(-) √(-) √(-)
Distance from primary market √(+) √(+) √(+)
Number of male √(+)
Number of female √(+)
Access to Extension advise √(-)
Quantity of seed √(-)
Quantity of fertilizer √(-) √(-)
Price of Output √(-) Per hectare OTD √(-) √(-) √(-) √(+) √(+) √(+)
Number of livestock √(-) √(+) Land size √(+) √(+) √(+) √(-) √(-) √(+) Household Size √(-) √(+) Labour in adult equivalent √(-) √(-) √(-) √(+) √+) √(+) Total Oxen-tmad-days √(-) √(+) √(+)
Education Dummy √
Religion Dummy √
Region dummy √ √ √
Woreda dummy √ √ √ √
18
A study revealed that technology (fertilizer and improved seed), environmental factors
(soil) & farm management practices (planting time, spacing, frequency of plowing)
determine maize yield; and fertilizer application, farmer assessment of soil fertility and
soil colour, frequency of plowing (negative relationship with teff yield contrary to
maize), and farmer’s decision on technology choice are determining teff yield. In general
the results from the study are consistent with other studies conducted elsewhere (e.g
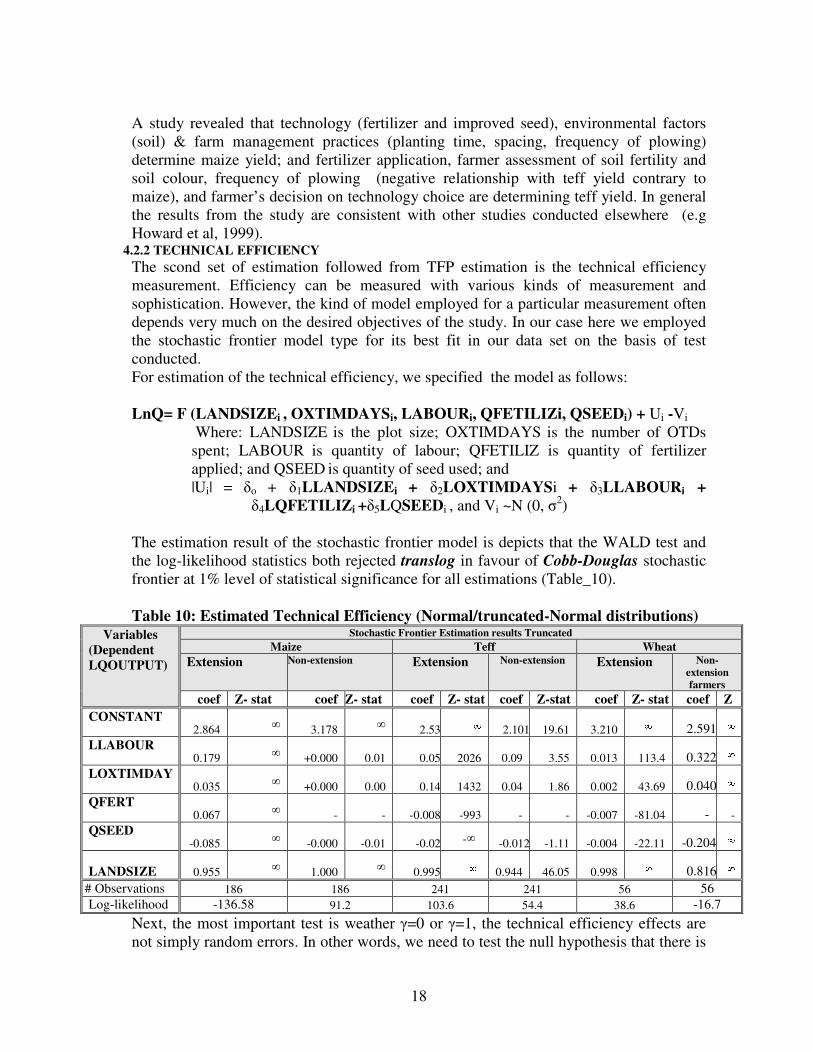
Howard et al, 1999). 4.2.2 TECHNICAL EFFICIENCY
The scond set of estimation followed from TFP estimation is the technical efficiency
measurement. Efficiency can be measured with various kinds of measurement and
sophistication. However, the kind of model employed for a particular measurement often
depends very much on the desired objectives of the study. In our case here we employed
the stochastic frontier model type for its best fit in our data set on the basis of test
conducted.
For estimation of the technical efficiency, we specified the model as follows:
LnQ= F (LANDSIZEi , OXTIMDAYSi, LABOURi, QFETILIZi, QSEEDi) + Ui -Vi
Where: LANDSIZE is the plot size; OXTIMDAYS is the number of OTDs
spent; LABOUR is quantity of labour; QFETILIZ is quantity of fertilizer
applied; and QSEED is quantity of seed used; and
|Ui| = δo + δ1LLANDSIZEi + δ2LOXTIMDAYSi + δ3LLABOURi +
δ4LQFETILIZi +δ5LQSEEDi , and Vi ~N (0, σ2)
The estimation result of the stochastic frontier model is depicts that the WALD test and
the log-likelihood statistics both rejected translog in favour of Cobb-Douglas stochastic
frontier at 1% level of statistical significance for all estimations (Table_10).
Table 10: Estimated Technical Efficiency (Normal/truncated-Normal distributions) Variables
(Dependent
LQOUTPUT)
Stochastic Frontier Estimation results Truncated
Maize Teff Wheat
Extension Non-extension Extension Non-extension Extension Non-
extension
farmers
coef Z- stat coef Z- stat coef Z- stat coef Z-stat coef Z- stat coef Z
CONSTANT 2.864 ∞ 3.178 ∞ 2.53 ∞ 2.101 19.61 3.210 ∞ 2.591 ∞
LLABOUR 0.179 ∞ +0.000 0.01 0.05 2026 0.09 3.55 0.013 113.4 0.322 ∞
LOXTIMDAY 0.035 ∞ +0.000 0.00 0.14 1432 0.04 1.86 0.002 43.69 0.040 ∞
QFERT 0.067 ∞ - - -0.008 -993 - - -0.007 -81.04 - -
QSEED -0.085 ∞ -0.000 -0.01 -0.02 -∞ -0.012 -1.11 -0.004 -22.11 -0.204 ∞
LANDSIZE 0.955 ∞ 1.000 ∞ 0.995 ∞ 0.944 46.05 0.998 ∞ 0.816 ∞
# Observations 186 186 241 241 56 56
Log-likelihood -136.58 91.2 103.6 54.4 38.6 -16.7
Next, the most important test is weather γ=0 or γ=1, the technical efficiency effects are
not simply random errors. In other words, we need to test the null hypothesis that there is

19
no inefficiency component. The test result of this estimation, which is based on the z-
statistics, shows that except for maize and wheat extension farmers for the rest of the
truncated-normal estimations the null is rejected at 1% level of statistical significance
while it fails to reject the null in the case of maize and wheat extension farmers
(Table_11). For maize and wheat extension farmers therefore we resort to estimating the
half-normal distribution and in this case the z-test again rejects the null that there is no
inefficiency component at 1% level of statistical significance. Based on these two sets of
tests outcomes on the distribution of the inefficiency components, we predicted the
technical efficiency for extension and non-extension farmers of the three crops as
summarized in Table-11.
Table 11: Technical Efficiency Estimated for Maize, Teff & Wheat Extension and
Non-Extension Farmers
In this estimation we use a sample size of 186 participating extensions and 186-maize
non-extension for maize, 241 each for teff and 56- extension and non-extension each for
wheat.. We infer from Table-11 that in case of maize and wheat the mean technical
efficiency of extension farmers is greater than that of non-extension, while this is not true
for the technical efficiency in teff. When we compare the technical efficiency in crops,
we see that maize has the highest mean (0.80), with 66% of the sample extension farmers
producing above the average. The mean technical efficiency of the non-extension farmers
for maize is 0.83 and about 148 (61%) non-extension farmers are operating above the
mean. Despite the smaller sample size, the mean technical efficiency of extension farmers
is higher than that of non-extension farmers. About 62% of the extension farmers have
technical efficiency higher than the mean technical efficiency of non-extensions for
wheat with only 43% for non-extensions. Therefore, most of the extension farmers are
technically more efficient than the non-extension farmers.
The level of inefficiency by region is reported (Table-12). The table depicts that in most
of the six cases inefficiency declines from Southern to Northern Ethiopia. This shows the
natural environment influences efficiency in agriculture.
TECHNICAL
EFFICIENCY
MAIZE TEFF WHEAT
Extension Nonextension Extension Non-extension Extension Non-extension
Maximum
Minimum
Mean TE
Standard Deviation
1.00
0.15
0.52
0.28
1.00
0.35
0.84
0.21
1.00
0.47
0.80
0.16
0.96
0.48
0.83
0.12
1.00
0.44
0.76
0.22
1.00
0.18
0.63
0.22
Number of FHH >mean
Number of FHH <mean
Sample size
92
94
186
142
44
186
158
83
241
148
91
239
25
30
55
24
31
55

20
Table-12: Mean Inefficiency of Extension & Non-extension Farmers by Region & crops
In order to determines the technical efficiency of extension and non-extension farmers for
the three crops cases as in the proceedings, it is hypothesized that the behavior of the
farm household is influenced by environmental and socio-economic variables.
The multiple regression model based on the technical inefficiency effect term is
distributed N (µi,σ2
v ) where µi can be specified and defined as µi= δo + ∑=
m
1j
oδ βij; where βj
are socioeconomic and infrastructure variables which are theoretically or possibly
empirically identified variables.
The model:
INEFi = β0 + β1AGEi + β2SEXi + β3 EDUDMYi + β4 RELIGNi + β5HHSIZEi +
β6REGIONDMYi + β7TFPi + β8DISTPRMKTi+ β9CREDITAV +
β10GROCEXPi+ β11NOFEMALEi + β12 EXTADVSi + β13NLSi +
β14LANDSIZE+εi
The maximum likelihood estimation [MLE] for extension and non-extension of the three
crops was estimated and summarized in Table 13. The dependent variable in all cases is
reported by technical inefficiency. For this study we employed the two-stage estimation
by using the MLE (Arega et al, 2003). The estimation of inefficiency determinants using
two stages is indeed controversial; a problem with the two-stage procedure is a lack of
consistency in assumptions about the distribution of the inefficiencies. In the first stage,
inefficiencies are assumed to be independently and identically distributed (iid) in order to
estimate their values. However, in the second stage, estimated inefficiencies are assumed
to be a function of a number of firm-specific factors, and hence are not identically
distributed (Coelli, Rao & Battese, 1998). Kumbhakar et al (1991), Reifschneider et al
(1991) estimated all of the parameters in one step to overcome this inconsistency. The
inefficiency effects were defined as a function of the firm-specific factors (as in the two-
stage approach), but were incorporated directly into the MLE
Region Maize Teff Wheat
Mea
n
Extension Non-Ext Extension Non-Ext Extension Non-Ext
Mean
Ineffi
N Mean
Ineffi
N Mean
Ineffi
N Mean
Ineffi
N Mean
Ineffi
N Mean
Ineffi
N
Tigray 0.41 11 0.26 47 0.35 47 0.22 63 0.37 11 0.48 5 0.35
Amhara 0.78 80 0.38 5 0.24 67 0.25 70 0.45 19 0.43 34 0.29
Oromia 0.20 68 0.012 94 0.09 57 0.10 94 0.02 19 0.22 14 0.10
SNNPR 0.35 27 0.37 40 0.13 70 0.08 12 - 0.043 2 0.19
21
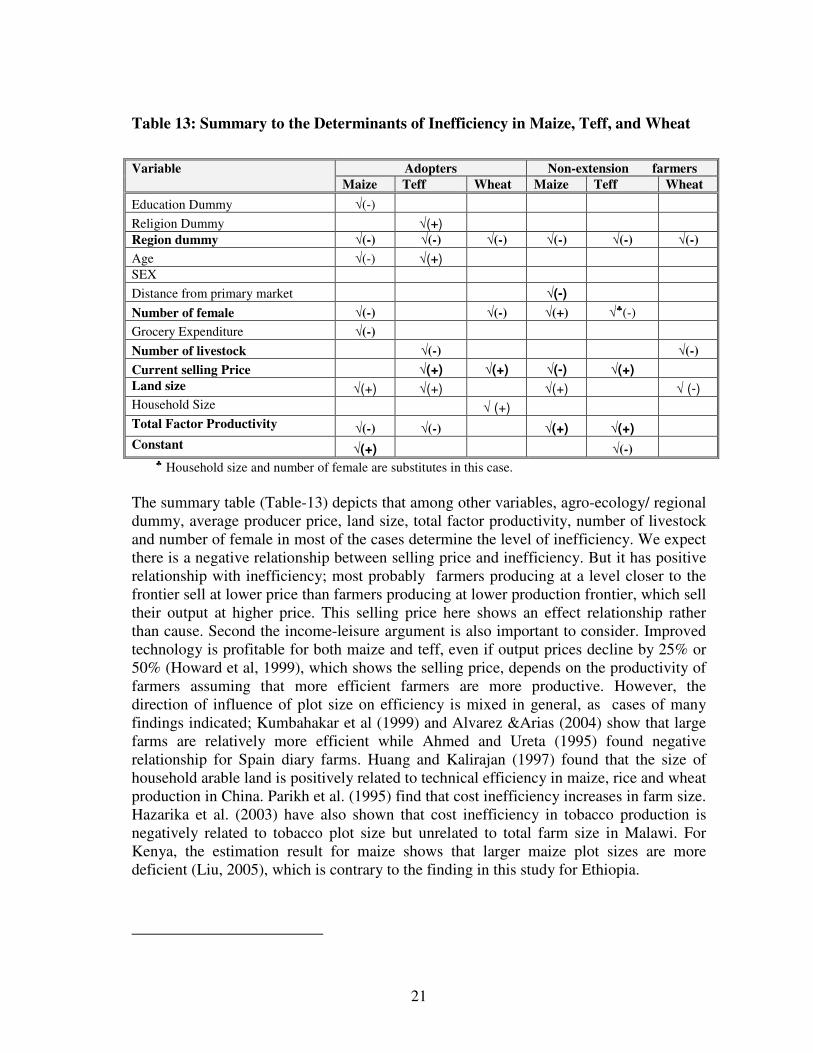
Table 13: Summary to the Determinants of Inefficiency in Maize, Teff, and Wheat
♣ Household size and number of female are substitutes in this case.
The summary table (Table-13) depicts that among other variables, agro-ecology/ regional
dummy, average producer price, land size, total factor productivity, number of livestock
and number of female in most of the cases determine the level of inefficiency. We expect
there is a negative relationship between selling price and inefficiency. But it has positive
relationship with inefficiency; most probably farmers producing at a level closer to the
frontier sell at lower price than farmers producing at lower production frontier, which sell
their output at higher price. This selling price here shows an effect relationship rather
than cause. Second the income-leisure argument is also important to consider. Improved
technology is profitable for both maize and teff, even if output prices decline by 25% or
50% (Howard et al, 1999), which shows the selling price, depends on the productivity of
farmers assuming that more efficient farmers are more productive. However, the
direction of influence of plot size on efficiency is mixed in general, as cases of many
findings indicated; Kumbahakar et al (1999) and Alvarez &Arias (2004) show that large
farms are relatively more efficient while Ahmed and Ureta (1995) found negative
relationship for Spain diary farms. Huang and Kalirajan (1997) found that the size of
household arable land is positively related to technical efficiency in maize, rice and wheat
production in China. Parikh et al. (1995) find that cost inefficiency increases in farm size.
Hazarika et al. (2003) have also shown that cost inefficiency in tobacco production is
negatively related to tobacco plot size but unrelated to total farm size in Malawi. For
Kenya, the estimation result for maize shows that larger maize plot sizes are more
deficient (Liu, 2005), which is contrary to the finding in this study for Ethiopia.
Variable Adopters Non-extension farmers
Maize Teff Wheat Maize Teff Wheat
Education Dummy √(-)
Religion Dummy √(+) Region dummy √(-) √(-) √(-) √(-) √(-) √(-)
Age √(-) √(+) SEX
Distance from primary market √(-)
Number of female √(-) √(-) √(+) √♣(-)
Grocery Expenditure √(-)
Number of livestock √(-) √(-)
Current selling Price √(+) √(+) √(-) √(+) Land size √(+) √(+) √(+) √ (-) Household Size √ (+) Total Factor Productivity √(-) √(-) √(+) √(+) Constant √(+) √(-)
22
In the case of the regional dummy, the coefficient is statistically significant at 1% level in
all cases; indicating that as we move from north to south Ethiopia, inefficiency
decreases. The education dummy in most of the cases has the expected negative sign
even though is insignificant. This is very much consistent to the earlier findings in
Ethiopia (Mulat et al 2003; Arega et al 2003; Beyene, 2004). Primary education indeed is
not only the source of efficiency or a source of economic growth (Paulos & Mekonnen,
2004) but also the source of productivity. The finding in this study shows that in both
extension and non-extension farmers as the number of female is increasing there is a sign
of improvement in efficiency. This reveals that female labour have greater role to play
in increasing farm efficiency
Rationally people expect that too much expenditure on recreation is a sign of inefficiency
in livelihood. The finding in this study shows that grocery expenditure, as a measure of
recreation does not as such influence farmer’s inefficiency in Ethiopia. The variable is
significant only in the case of extension maize farmers out of six cases. The case of maize
is contrary to our expectation in that the rise in grocery expenditure is decreasing
inefficiency. This is possibly due to the positive role of the expenditure on recreation in
facilitating information and experience exchange among farmers, particularly when the
expenditure lies within the economic and social norm of the society.
The total factor productivity indicating as one of the positive factors determining the
level of efficiency of extension and non-extension farmers, as the finding depicts for all
the two cereals (except wheat). This is consistent with the theory that factor productivity
influences the level of efficiency of producers (Colelli & Batisse, 1998). In this
connection it is worth important to note that agro-ecological factors related to soil and
climate influences TFP and in turn the level of TFP influences the efficient utilization of
factors of production.
There is a huge potential in Ethiopia to increase output by increasing total factor
productivity through application of modern technology (as in extension farmers) and use
of farm resources. This is clearly observed by the mean level of efficiency attained in
maize, teff and wheat with 52%, 80% and 76% extension farmers respectively. There
seems to be an efficiency gap ranging from 48% in maize to 24% in wheat, implying that
farmers still can increase output by increasing efficient utilization of their inputs. On the
same level, the non-extension farmers, attained mean efficiency of 84%, 83% and 63%
for maize, teff, implying that they can increase output by increasing their efficiency on
average by 16%, 17% and 37% respectively.

23
Conclusion and Recommendation
After the commencement of the extension program in 1995, the number of farmers using
modern technology inputs increased considerably. This study, with and objective to
assess the TFP and technical efficiency and the differences between farmers engaged in
the extension package program and the non-extension farmers, presents the results based
on sample farmers producing maize, teff and wheat from four regions. For the TFP
comparison, we employed the Tornquvist index, which is found to be appropriate
measurement for this kind of study. Under this index, the TFP estimation is based on the
utilization of labour, fertilizer and draught power (oxen-timad-days) inputs. The
estimated result shows that 65%, 65% and 96% of the sample extension farmers in maize,
teff and wheat respectively have TFP greater than that of the non extension farmers,
implying that on average TFP declines from extensions to non-extensions for the majority
of sample households for all the three crops; and this is true for both matching and non-
matching cases. It has an overall implication that the technologies in extension package
have brought about substantial difference between extensions and non- extensions
participating farmers. Based on the finding we detect that high TFP difference is
observed in wheat, followed by maize and teff. The estimation from multiple regression
analysis clearly indicated that, TFP differences other than the inputs show that age,
distance from market, frequency of cultivation per hectare of land, plot size, labour and
agroecological differences are significantly influencing the level of TFP. Fertilizer use is
important determinant in case of extensions farmers. Number of male or female in the
farm household, access to extension advises, price of output, quantity of seed, education
and religion dummies do not seem to have consistent influences on the level of TFP. This
kind of study is hardly conducted in Ethiopia and makes it difficult to compare with other
finding. However, Based on this finding, we can safely conclude that technology
packages of extension service on average have made some remarkable difference in
productivity between extension and non-extension farmers.
Similarly, based on the data set, Technical efficiency was estimated for maize, teff and
wheat extension and non-extension farmers. Econometric tests significantly rejected the
trans-log production function in favor of Cobb-Douglas; and second, regarding the tests
for using selecting half-normal against truncated-normal, the later is rejected.The
estimated result shows that in terms of technical efficiency for the given samples, the
maximum mean technical efficiency is observed in maize non-adopters while the
minimum is observed in maize adopters households. The implication for maize producing
households is that compared to the most technically efficient farmers, there are many
technically inefficient farmers in the extension rather than in the case of non-extension
maize farmers. Moreover, on average maize extension farmers can increase technically
efficient utilization of inputs by about 48% as compared to only 16% in non-extensions.
The technical efficiency in teff is higher for extensions i.e. 80% and almost equal to the
case of non-adopters in maize that is 83%. On average, teff extension farmers can
increase efficiency by about 20% while the non-extensions can increase by about 17%.
At the other end the technical efficiency of wheat extension and non-extension farmers is
about 76% and 63% respectively, implying that they can increase efficiency on average
by about 24% and 37%. We see that teff and wheat extension farmers are more efficient
than the non-extension farmers while this is contrary to the case of maize, where most of
24
the extensions are less efficient. Behind these findings is that in stochastic frontier, all
farmers are compared against the most efficient farmer. The estimated technical
efficiency shows there is vast potential in Ethiopia to increase output by increasing total
factor productivity through application of modern technology and by allocating scarce
resources- labor, draught power, and fertilizer
Mirroring the farm efficiency from performance perspectives, estimates of inefficiency
model estimated result shows that the agro-ecology variable represented with regional
dummy, price, land size, TFP, number of livestock and number of female in the
household are found to be significantly influencing the technical inefficiency in most of
the cases. Time and again, the coefficient of education dummy is negatively influencing
technical inefficacy despite its insignificance. In one of the findings it came out clear that
the importance of considering agro-ecological differences and there is an indication
pattern that as we move from north to south Ethiopia, technical inefficiency declines
consistently for all cases. It may be safely concluded from here on ward, the agro-
ecologies play a significant role in influencing TFP and Technical efficiency due
consideration should be given in agricultural technology targeting for agro-ecology.
Smallholding as compared to large plot sizes can be efficient in countries of high rural
population. There is ample potential yet to be tapped for both extension & non-extension
farmers not only by improve efficiency in resource utilization but also by increasing total
factor productivity through application of modern technologies. Finally, conducting
similar studies further dealing with TFP and efficiency with wider sample size coverage
might be formidable to bring about more dependable result informing on the coefficients
of the determinants.
25
REFERENCE
Abate Bekele, Machel F. Viljoen and Gezahegn Ayele (2006): Effect of Farm Size on
Technical Efficency of Teff Production: A case Study of the Moretina Jiru
District, Central Ethiopia
Abebe Kirkos and Negussie Dejene (2005): The Ethiopian Agricultural Enumeration
Sample In-depth Analysis Proceeding of a Workshop 6 June 2005: The Effect
of Land Tenure, Fragmentation, Farm Size and Soil Conservation on Farm
Productivity in Oromia, Central Statistical Authority, Addis Ababa
Arega Demelash, Rashid M. Hassen & Mulat Demeke (2003) The Technical, Allocative
and Economic Efficiency of Maize Production under Improved Technology In
the Bako Area of Western Oromia: A Stochastic Efficiency Decomposition
Approach, Proceeding of the National Workshop on Technological Progress
in Ethiopian Agriculture, Nov.29-30, 2001, Addis Ababa, Ethiopia
Assefa Admassie and Gezahegn Ayele (2004) Adoption of Improved Technology in
Ethiopia
Beyene Tadesse (2004) The Impact of Policy Reform and Institutional Transformation on
Agricultural Performance: An Economic Study of Ethiopian Agriculture,
Development Economics & Policy, Hohenhiem University, Lang Publisher
Germany
Colelli, T.J.(1995) “Recent Developments in Frontier Modeling and Efficiency
Measurement Modeling,” Australian Journal of Agricultural Economics, 39
(3): 219-245
Colelli, T.J, and Batisse, G. (1996) “Identification of Factors Which Influence the
Technical Inefficiency of Indian Farmers” Australian Journal of Agricultural
Economics, N0. V0l 40 (2): 103-128
Colelli, T.J, and Rao, Parasada D.S., Batisse, G. (1998). An Introduction to Efficincy and
Productivity Analysis, Klewer Avcademic Publishers,
Boston/Dordretch/London
Federal Democratic Republic of Ethiopia, Central Agricultural Census Commission
(2004) Ethiopian Statistical Authority, Addis Ababa, Ethiopia
Gavian, S. and Ehui, S.(1996) The Relative Efficiency of Alternative land Tenure
Contracts in a Mixed Crop Livestock System in Ethiopia, ILRI, Addis Ababa,
Ethiopia
Gezahegn Ayele(2002). Conservation Tilling in Teff Production: Case of farmers around
Debrezeit, EARO, Addis Ababa, Ethiopia
Gutema, Paulos and Bekele, Mekonnen (2004) “Does Schooling Contribute to the
Economic Growth of Sub-Sahara African Countries”, African Development
Review, N0.4 Vol 16
Hailemariom T/wold.; Gezahegn Ayele., Tekalign Mamo, Teklu Erkossa and Selamyhun
(2006). Economic optimum of Fertilizer use for wheat production in Vertisol
areas of central Ethiopia. Ethiopian Journal of Agricultural Economics
Vol. 6 No. 1. 2006
Holden S., T., Benin, S., Shiferaw, B. and Pender, J. (2003) Non-farm Income, Household
Welfare, and Sustainable Land Management in a Less favored Area in the
26
Ethiopian Highlands; Department of Economics and Resource Management,
Agricultural University of Norway, Discussion Paper #D-06/2004 Howard, A. J, Kelly, V., Stepanek, j., Crawford, W. E., Mulat D., and Maredia, M.
(1999) The Promise and Challenge of the Ministry of Agriculture/SG2000
Experiment With Improved Cereals Technology in Ethiopia, MSU
International Development Working Papers No.76 Department of Economics,
Michigan State University, USA
Khatri, Y., Leruth, L., Piesse1, J. (2002), Corporate Performance and Governance: A
Stochastic Frontier Approach to Measuring and Explaining Inefficiency in the
Malaysian Corporate Sector, Blackwell Publishers, Oxford
Kudaligama, V.P and Yanagida J.F (2000) A comparison of Inter-country Agricultural
Production Functions: A Frontier Function Approach, Journal of Economic
Development, 25:1
L_eopold Simar Paul W. Wilson (2005) Estimation and Inference in Cross-Sectional,
Stochastic Frontier Models (web)
Liu, Yanyan (2005) Model Selection and Implications in Stochastic Frontier Analysis:
Maize Production in Kenya, Department of Agricultural Economics and
Department of Economics-Michigan State University, East Lansing,
December 15, 2005
Mulat Demeke (1999) Agricultural Technology, Economic Viability and Poverty
Alienation in Ethiopia, Department of Economics Addis Ababa University,
Presented at Agricultural Transformation Policy Workshop, Nairobi, Kenya
Mulat Demeke and Bekele Hundie (2003) The Determinants of Yield of Major Cereals:
The Contribution of New Technologies in Selected Villages of Ethiopia,
Proceeding of the National Workshop on Technological Progress in Ethiopian
Agriculture, Nov.29-30, 2001, Addis Ababa, Ethiopia
Mulat Demeke and Nigussie Tefera (2003) The Productivity & Profitability of Wheat and
Teff Technologies Comparison Between Extension and Non-extension
Plots in Three Selected Villages, Proceeding of the National Workshop on
Technological Progress in Ethiopian Agriculture, Nov.29-30, 2001, Addis
Ababa, Ethiopia
Stata reference guide ver. 8.2 2003: http://www.stata.com
Samia Zekaria and Habekristos Beyene (2005) The Ethiopian Agricultural Enumeration
Sample In-depth Analysis, Proceeding of a Workshop 6 June 2005:
Multivariate Discriminant Analysis: Participation in New Extension Package
Program & Its Effect on Crop Productivity in Oromia Region, Central
Statistical Authority, Addis Ababa
Tenkir B, Gezahegn A. and Tadesse K. (2004), Agricultural Extension, Adoption,
Diffusion and Socio Economic Impact in the Four Regions [Tigray, Amhara,
Oromia and SNNPR], Research report N0.1Addis Ababa, Ethiopia
Wadud, M.A. (2002) A Comparison of Method of Efficiency Measurement for Farms in
Bangladesh, Department of Economics, University of Rajishash
Y. Khatri, L. Leruth and Piesse1, J (2002). Corporate Performance and Governance: A
Stochastic Frontier Approach to Measuring and Explaining Inefficiency in the
Malaysian Corporate Sector; IMF Working Paper No. 02/152