production of organic pigment nanoparticles by...
TRANSCRIPT
PRODUCTION OF ORGANIC PIGMENT NANOPARTICLES BY STIRRED MEDIA
MILLING
By
RHYE GARRETT HAMEY
A MASTER THESIS PRESENTED TO THE GRADUATE SCHOOL OF THE UNIVERSITY OF FLORIDA IN PARTIAL FULFILLMENT
OF THE REQUIREMENTS FOR THE DEGREE OF MASTER OF SCIENCE
UNIVERSITY OF FLORIDA
2005
Copyright 2005
by
Rhye Garrett Hamey
iii
ACKNOWLEDGMENTS
The author would like to acknowledge the friendship and the wisdom of the late
Professor Brian Scarlett, whose instruction and support were the reasons for the pursuit of
this study. Dr. Brian Scarlett taught the author how to be a better engineer and a better
person.
The author is grateful for the help of Dr. Brij Moudgil for his countless hours of
guidance through out this study. The author would also like to thanks Dr. Hassan El-Shall
and Dr. Abbas Zaman for their insightful discussions on milling and serving as
committee members.
The author would like to acknowledge the efforts of Dr. Ecevit Bilgili, Dr. Dimitri
Eskin, and Dr. Olysea Zupanska for their collaborative efforts in understanding the
particle and system physics in this study.
The author would also like to acknowledge the financial support of the Particle
Engineering Research Center (PERC) at the University of Florida, The National Science
Foundation (NSF) (Grant EEC-94-02989), and the Industrial Partners of the PERC for
support of this research. Thanks are extended to Eastman Kodak for providing the
polymeric media.
iv
TABLE OF CONTENTS page
ACKNOWLEDGMENTS ................................................................................................. iii
LIST OF TABLES............................................................................................................. vi
LIST OF FIGURES .......................................................................................................... vii
ABSTRACT..................................................................................................................... viii
CHAPTER
1 INTRODUCTION ........................................................................................................1
1.1 Particle Production..................................................................................................1 1.2 Particle Breakage ....................................................................................................3
1.2.1 Introduction to Particle Breakage.................................................................3 1.2.2 State of Stress ...............................................................................................3 1.2.3 Cracks and Defects .......................................................................................4 1.2.4 Breakage Mechanisms..................................................................................5 1.2.5 Materials .......................................................................................................6 1.2.6 Theoretical Models of Breakage ..................................................................7
1.2.6.1 Griffith’s theory of brittle fracture .....................................................7 1.2.6.2 Irwin’s and Orowan’s theories of ductile fracture..............................7 1.2.6.3 Rittinger’s and Kick’s laws on particle breakage...............................8 1.2.6.4 Distribution based models ..................................................................9
1.2.7 Measuring Breakage of Particles..................................................................9 1.2.8 Environment ...............................................................................................10
1.3 Stirred Media Milling ...........................................................................................11 1.3.1 Media Mills ................................................................................................11 1.3.2 Grinding Aids .............................................................................................12 1.3.3 Media Loading............................................................................................13 1.3.4 Media Size ..................................................................................................13 1.3.5 Other Milling Parameters ...........................................................................14
1.4 Milling Kinetics ....................................................................................................15
2 EXPERIMENTAL PROCEDURE.............................................................................17
2.1 Equipment.............................................................................................................17 2.2 Materials ...............................................................................................................18
v
2.3 Procedure ..............................................................................................................21 2.4 Sampling and Characterization.............................................................................22
3 EXPERIMENTAL RESULTS AND DISCUSION ...................................................25
3.1 Base Experiments .................................................................................................25 3.2 Effects of Grinding Aid Concentration.................................................................27 3.3 Effects of Media Concentraion.............................................................................28 3.4 Effects of Media Size............................................................................................30 3.5 Breakage Mechanisms ..........................................................................................32 3.6 Grinding Mechanism ............................................................................................32 3.7 Grinding Kinetics..................................................................................................33
4 POPULATION BALANCE MODEL ........................................................................36
4.1 Method..................................................................................................................36 4.2 Experimental Findings by Population Balance Modeling ....................................39
5 SUMMARY, CONCLUSIONS AND FUTURE WORK ..........................................44
5.1 Summary...............................................................................................................44 5.2 Conclusions...........................................................................................................45 5.3 Future Work..........................................................................................................46
APPENDIX
A REPEATABILITY RUNS OF M103.........................................................................48
B CALCULATIONS OF CMC......................................................................................49
LIST OF REFERENCES...................................................................................................50
BIOGRAPHICAL SKETCH .............................................................................................57
vi
LIST OF TABLES
Table page 2.1 Operating variables of the stirred media milling process.........................................18
4.1 Parameters of the Kapur’s G–H model for Run M103 ............................................41
4.2 The breakage distribution matrix for size class 1 through 9 form top to bottom and left to right (b6,3= 0.958)....................................................................................42
4.3 Selection function for experiment M103 population balance model .......................43
vii
LIST OF FIGURES
Figure page 1.1 Attrition, cleavage, and fracture, and particle size distribution for attrition,
cleavage, and fracture, respectively. ..........................................................................5
2.1 Optical microscope image of the polystyrene beads (mean size, 40.3 µm). Marker size is 50 µm................................................................................................19
2.2 Images of the pigment particles: (a) SEM image under ×50,000 magnifications; and (b) TEM image. Marker size is 100 nm for (a) and 500 nm for (b). .................20
3.1 SEM images of pigment particles in Run M103 samples collected at various milling times: (a) after 10 min; (b) after 16 h; (c) after 24 h....................................26
3.2 A, B, C, and D show the effects of surfactant concentration (0.0, 0.02, 0.037, and 0.0937M) on particle size at grinding times of 10 min., 8 hrs, 16 hrs, and 24 hrs respectively.........................................................................................................27
3.3 A, B, C, and D show the effects of media concentration (0, 60, 120, and 200 g) on particle size at grinding times of 10 min., 8 hrs, 16 hrs, and 24 hrs respectively...............................................................................................................29
3.4 A, B, C, and D show the effects of media size (9, 21, 40, and 402 µm) on particle size at grinding times of 10 min., 8 hrs, 16 hrs, and 24 hrs respectively ....31
3.5 Plot of change in particle size with time for varying media concentrations that describes the grinding rate........................................................................................33
3.6 Plot of change in particle size with time for varying media sizes that describes the grinding rate. ......................................................................................................34
4.1 Fit of the Kapur’s G–H model (4.7) to the cumulative volume fraction oversize–time data. Legends indicate the lower edge of each size class i...............................40
A.1 Plot of the volume fraction versus particles size of M103 including the standard deviations at varying run times. ...............................................................................48
B.1 Measure of surface tension versus surfactant concentration for OMT surfactant....49
viii
Abstract of Thesis Presented to the Graduate School
of the University of Florida in Partial Fulfillment of the Requirements for the Degree of Master of Science
PRODUCTION OF ORGANIC PIGMENT NANOPARTICLES BY STIRRED MEDIA MILLING
By
Rhye Garrett Hamey
August 2005
Chair: Brij Moudgil Cochair: Hassan El-Shall Major Department: Materials Science and Engineering
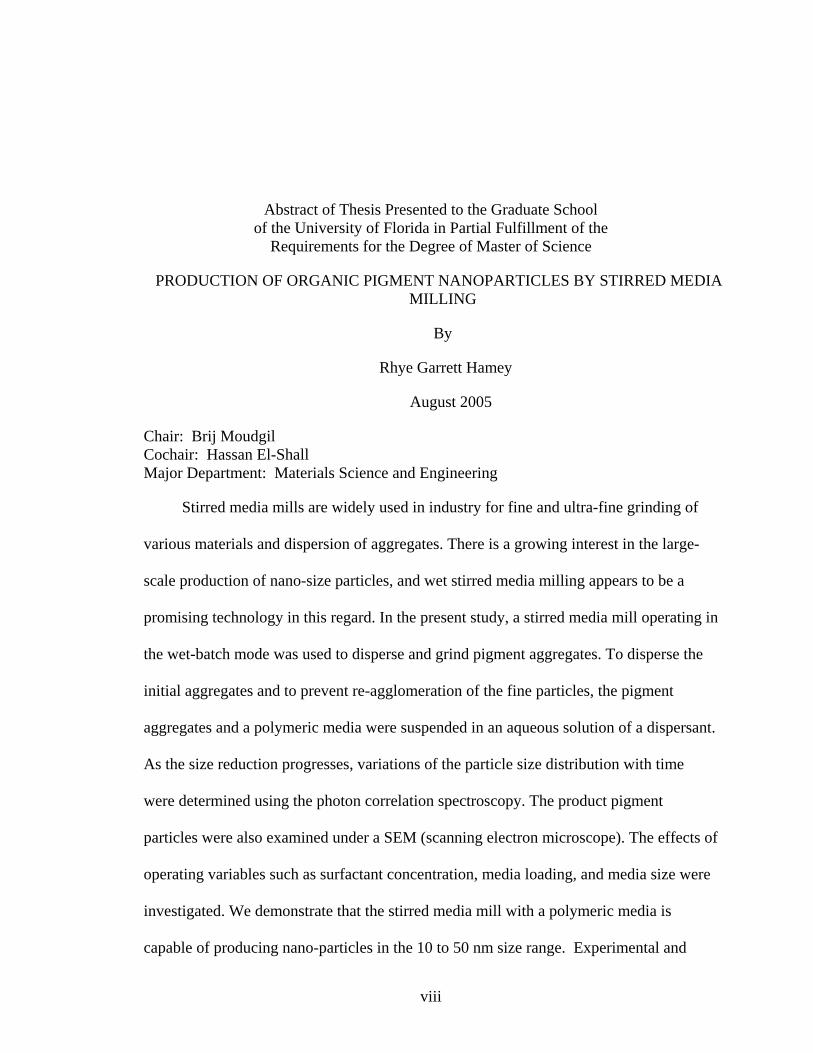
Stirred media mills are widely used in industry for fine and ultra-fine grinding of
various materials and dispersion of aggregates. There is a growing interest in the large-
scale production of nano-size particles, and wet stirred media milling appears to be a
promising technology in this regard. In the present study, a stirred media mill operating in
the wet-batch mode was used to disperse and grind pigment aggregates. To disperse the
initial aggregates and to prevent re-agglomeration of the fine particles, the pigment
aggregates and a polymeric media were suspended in an aqueous solution of a dispersant.
As the size reduction progresses, variations of the particle size distribution with time
were determined using the photon correlation spectroscopy. The product pigment
particles were also examined under a SEM (scanning electron microscope). The effects of
operating variables such as surfactant concentration, media loading, and media size were
investigated. We demonstrate that the stirred media mill with a polymeric media is
capable of producing nano-particles in the 10 to 50 nm size range. Experimental and
ix
population balance model data suggests a fast initial dispersion of the strong
agglomerates followed by cleavage of primary particles. Further evidence for nano-size
grinding is supplied by the SEM images.
1
CHAPTER 1 INTRODUCTION
1.1 Particle Production
This study was begun in effort to understand and enhance a method for producing
nanosized pigment particles described in a series of Kodak patents. The Kodak patents
describe milling process in which pigment particles of a primary particle size of 150 nm
are reduced to less than 50 nm.1, 2 However, the Kodak patents do not describe the
mechanisms by which particles breakage and milling occurs. The patents also neglected
to describe how milling parameters affect these mechanisms. This study will evaluate
how changing milling parameters will affect the breakage kinetics and particle size. It
will also determine the particle breakage mechanism through inspection of particle size
distribution (PSD) data and a breakage distribution function calculated from the
population balance model (PBM).
Many industries are realizing the benefits of nanosized materials. Some of the
benefits are derived form the high specific surface area of nanoparticles. In the
pharmaceutical industry poorly water soluble drugs have shown an increase in solubility
as particle size decreases.3-5 This decrease in size will further increase the bioavailability
of the drug due to large amount of available surface area for reactions to take place at.
This increase in bioavailability could lead to new types of non water-soluble drug
formulations.3 The ceramic industry has found that nanoparticles could increase the
strength of composite materials. Nanosize organic pigments have shown an improvement
in color quality, lightfastness and durability.6, 7 So far production of many of these

2
materials has been limited to small-scale process making the cost of these materials very
high.
Most nanosize particles are produce in a growth process, from either a liquid phase
such as crystallization or from a gas phase like flame synthesis.8-12 Both of these methods
have drawbacks in that they can only be applied to a limited number of materials. In
crystallization processes materials are limit by their solubility in a solvent. In plasma
synthesis process materials are limited by their ability to with stand high temperatures
thus making this process mainly restricted to producing metal oxides and carbon
nanotubes. The scalability of both processes is limited due to control issues that arise
when working with large volumes (i.e. temperature homogeneity inside the vessel or
inside the flame 12). To reduce the cost of nanosized materials a process capable of
produce large amounts of many different types of materials is need. Milling is a process
that is capable of produce large amounts of materials. Many researchers have studied the
milling of particles of the size of a few inches to the submicron size range. However,
little work has been performed in understanding nanoparticle production through a
grinding process.13-15 This study will further the understanding of nanoparticle production
in a milling process by identifying methods of particle breakage and relating them to
milling mechanisms. Much of the research conduct in a milling process has showed that
media size and media concentration can affect the rate of milling and the fineness of the
particle size for macroscopic milling processes.16-19 For submicron and nanomilling
processes reagglomeration during the milling process can reduce the effectiveness of
particle size reduction.14 This study will evaluate the effects of surfactant concentration,
3
media size, and media concentration on the fineness of the product and rate of particle
size reduction in a nanomilling process.
1.2 Particle Breakage
1.2.1 Introduction to Particle Breakage
Understanding particle breakage is important in many industries such as the
pharmaceutical and mineral processing. Breakage can lead to problems in processing and
conveying equipment. In a milling process understanding particle breakage is necessary
for obtaining a desired product. In both situations, better knowledge of breakage
behavior will lead to significant savings in time and money as well as an overall
improvement of product quality. Single particle impact, and multiple particle impacts on
breakage have been studied by many researchers.20-24 Many parameters determine how or
if particles will breakage (such as material properties, impact velocity, environmental
effects, and history or fatigue).25 This section will discuss some of these conditions and
will try to explain how they lead to breakage.
1.2.2 State of Stress
There are many ways to apply a force that will result in particle breakage. Rumpf suggested four modes by which a particle can be stressed that could lead to breakage.26
(1) Compression-shear stressing
(2) Impact stressing
(3) Stressing in shear flow
(4) Stressing by other methods of energy transmission (electrical, chemical, or heat)
The first two are caused by contact forces and are the only modes important for milling.
Mode 3 is important in dispersion of materials under shear, and only exerts enough force
to destroy weak agglomerates, which will be neglected in this study will fail. There are
4
three modes by which a material can fail, which are a function of the material as well as
the stress applied to the material.
(1) Opening mode that corresponding to an applied tensile load (2) Sliding mode where the force is applied in the plane of the defect or crack (3) Tearing mode where a force is applied in a direction perpendicular to the plane of the crack or defect
For most particles, breakage is considered to take place in the first mode of failure.
Which may be due to artifacts in the techniques developed to measure particle breakage.
If a normal load is applied to a particle a load equal in magnitude is acting internally in
the direction perpendicular to the load and can then be considered to be a tensile load.
Tensile failure is more likely then compressive failure for many materials.
1.2.3 Cracks and Defects
Understanding crack formation and propagation is of fundamental importance to
the study of particle breakage. Particle breakage is preceded by crack growth, which is
preceded by crack formation. Crack formation begins around local defects in the
material. Defects are separated in to four classes, which correspond to their dimensions.
(1) Point defects (vacancies, interstitials, or substitutionals) (2) Line dislocations (screw or edge) (3) Interfacial (4) Volume
The strength of a material is related to the number, size and types of defects present. Most
materials are only a fraction as strong as the theoretically strength would predict due to
the presence of defects. Cracks are initiated when the applied stress exceeds the strength
of the material and form at a defect location. Following crack initiation is crack growth;
crack growth will lead to the breakage of the particle. Cracks can grow along the surface
of the particle as in the case of lateral cracks. Lateral cracks will lead to wearing away of
the particle surface as in the case of attrition. Cracks can also propagate through a particle
5
by radial and median type cracks which lead to fragmentation of the particle. The rate
and type of crack growth are highly dependent on the applied stress and the type of
material. Shönert extensively studied crack growth and found that crack velocity can vary
widely depending on the material, environment and state of stress.27 An empirical factor
called the fracture toughness can be used to predict when a material will fail. The
fracture toughness is dependent upon the size and geometry of the crack.
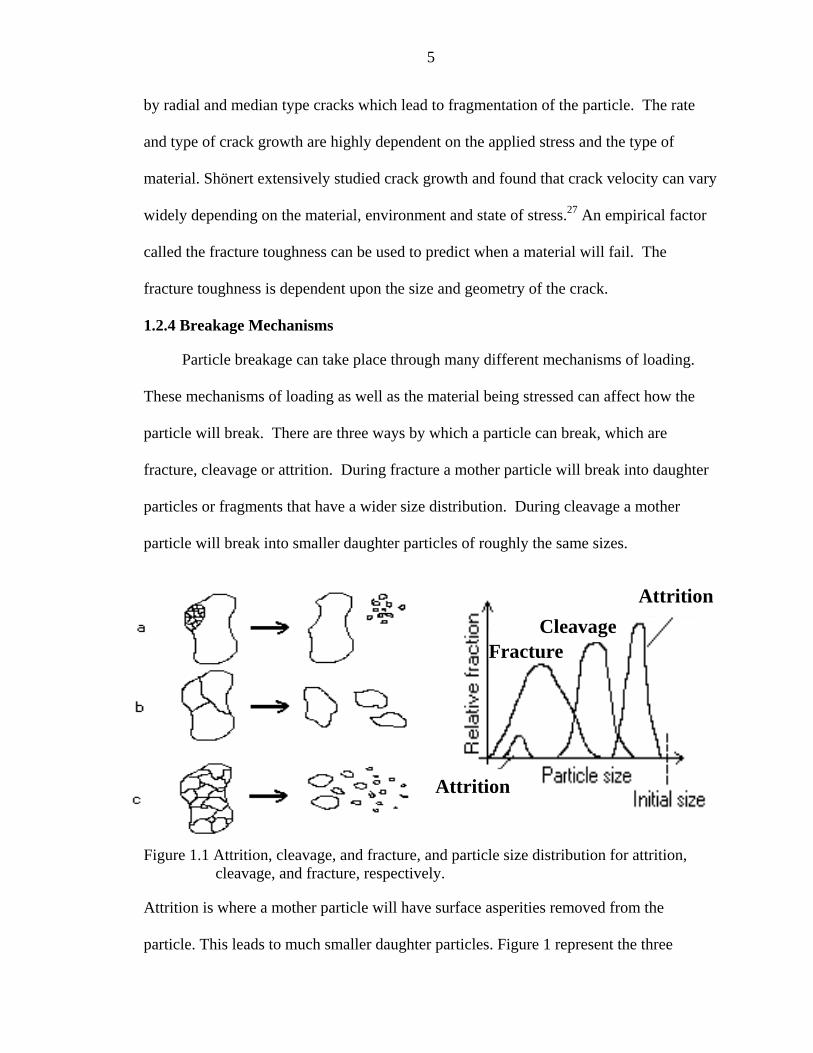
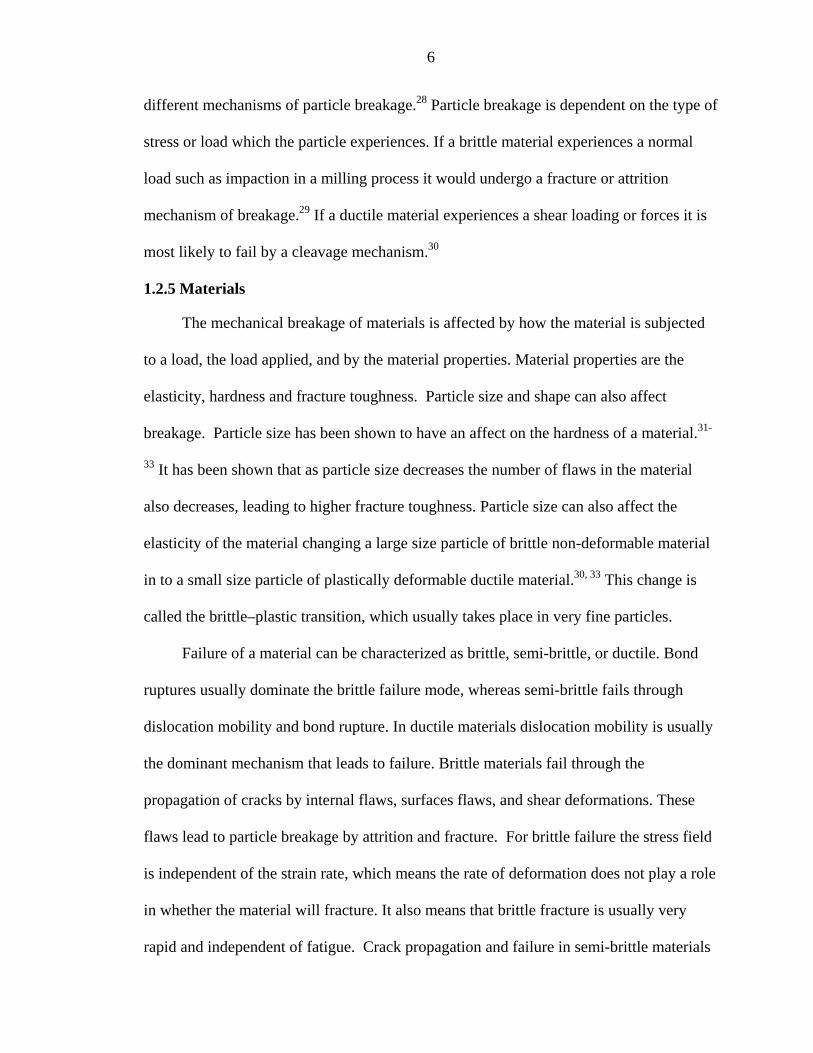
1.2.4 Breakage Mechanisms
Particle breakage can take place through many different mechanisms of loading.
These mechanisms of loading as well as the material being stressed can affect how the
particle will break. There are three ways by which a particle can break, which are
fracture, cleavage or attrition. During fracture a mother particle will break into daughter
particles or fragments that have a wider size distribution. During cleavage a mother
particle will break into smaller daughter particles of roughly the same sizes.
Figure 1.1 Attrition, cleavage, and fracture, and particle size distribution for attrition, cleavage, and fracture, respectively.
Attrition is where a mother particle will have surface asperities removed from the
particle. This leads to much smaller daughter particles. Figure 1 represent the three
Attrition
Attrition
FractureCleavage
6
different mechanisms of particle breakage.28 Particle breakage is dependent on the type of
stress or load which the particle experiences. If a brittle material experiences a normal
load such as impaction in a milling process it would undergo a fracture or attrition
mechanism of breakage.29 If a ductile material experiences a shear loading or forces it is
most likely to fail by a cleavage mechanism.30
1.2.5 Materials
The mechanical breakage of materials is affected by how the material is subjected
to a load, the load applied, and by the material properties. Material properties are the
elasticity, hardness and fracture toughness. Particle size and shape can also affect
breakage. Particle size has been shown to have an affect on the hardness of a material.31-
33 It has been shown that as particle size decreases the number of flaws in the material
also decreases, leading to higher fracture toughness. Particle size can also affect the
elasticity of the material changing a large size particle of brittle non-deformable material
in to a small size particle of plastically deformable ductile material.30, 33 This change is
called the brittle–plastic transition, which usually takes place in very fine particles.
Failure of a material can be characterized as brittle, semi-brittle, or ductile. Bond
ruptures usually dominate the brittle failure mode, whereas semi-brittle fails through
dislocation mobility and bond rupture. In ductile materials dislocation mobility is usually
the dominant mechanism that leads to failure. Brittle materials fail through the
propagation of cracks by internal flaws, surfaces flaws, and shear deformations. These
flaws lead to particle breakage by attrition and fracture. For brittle failure the stress field
is independent of the strain rate, which means the rate of deformation does not play a role
in whether the material will fracture. It also means that brittle fracture is usually very
rapid and independent of fatigue. Crack propagation and failure in semi-brittle materials
7
is preceded by plastic flow. Semi-brittle materials can have propagation of cracks in the
radial, median, and lateral directions. These systems of crack propagations lead to a
breakage by fracture and attrition. Semi-brittle materials also show a strain rate
dependency on failure. Ductile materials fail through tensile and shear loading. Ductile
failure is highly dependent on fatigue, and strain rate and usually fails through a crack
opening or tearing modes. This type of failure usually leads to a cleavage mechanism of
breakage in particles.
1.2.6 Theoretical Models of Breakage
1.2.6.1 Griffith’s theory of brittle fracture
If a material is brittle it will fracture by crack formation and crack propagation.
Griffith proposed a theory that thermodynamically predicts the energy required for brittle
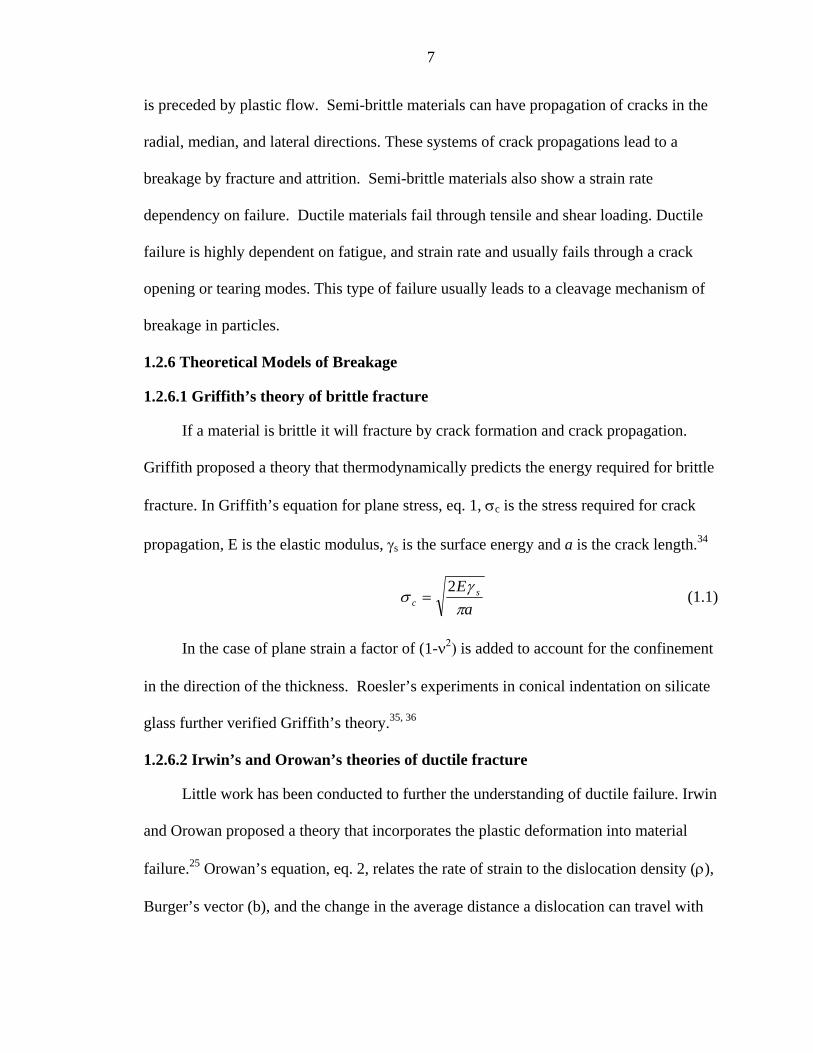
fracture. In Griffith’s equation for plane stress, eq. 1, σc is the stress required for crack
propagation, E is the elastic modulus, γs is the surface energy and a is the crack length.34
a
E sc π
γσ
2= (1.1)
In the case of plane strain a factor of (1-ν2) is added to account for the confinement
in the direction of the thickness. Roesler’s experiments in conical indentation on silicate
glass further verified Griffith’s theory.35, 36
1.2.6.2 Irwin’s and Orowan’s theories of ductile fracture
Little work has been conducted to further the understanding of ductile failure. Irwin
and Orowan proposed a theory that incorporates the plastic deformation into material
failure.25 Orowan’s equation, eq. 2, relates the rate of strain to the dislocation density (ρ),
Burger’s vector (b), and the change in the average distance a dislocation can travel with
8
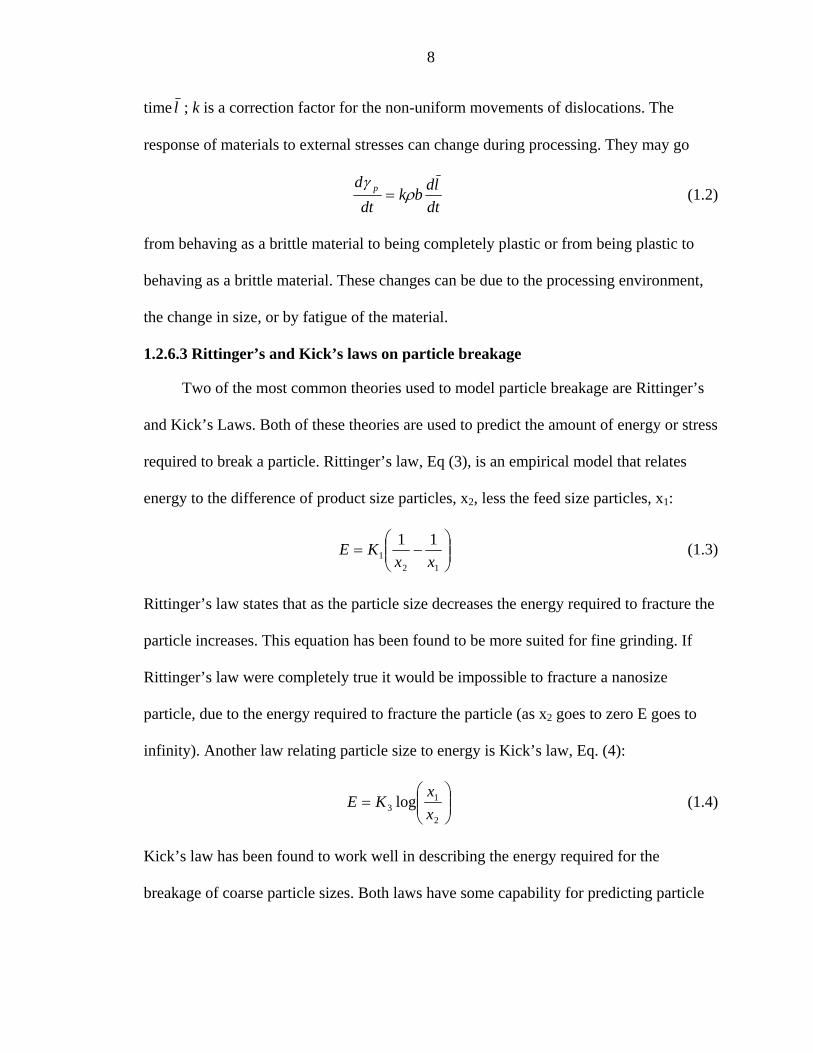
time l ; k is a correction factor for the non-uniform movements of dislocations. The
response of materials to external stresses can change during processing. They may go
dtldbk
dtd p ρ
γ= (1.2)
from behaving as a brittle material to being completely plastic or from being plastic to
behaving as a brittle material. These changes can be due to the processing environment,
the change in size, or by fatigue of the material.
1.2.6.3 Rittinger’s and Kick’s laws on particle breakage
Two of the most common theories used to model particle breakage are Rittinger’s
and Kick’s Laws. Both of these theories are used to predict the amount of energy or stress
required to break a particle. Rittinger’s law, Eq (3), is an empirical model that relates
energy to the difference of product size particles, x2, less the feed size particles, x1:
⎟⎟⎠
⎞⎜⎜⎝
⎛−=
121
11xx
KE (1.3)
Rittinger’s law states that as the particle size decreases the energy required to fracture the
particle increases. This equation has been found to be more suited for fine grinding. If
Rittinger’s law were completely true it would be impossible to fracture a nanosize
particle, due to the energy required to fracture the particle (as x2 goes to zero E goes to
infinity). Another law relating particle size to energy is Kick’s law, Eq. (4):
⎟⎟⎠
⎞⎜⎜⎝
⎛=
2
13 log
xx
KE (1.4)
Kick’s law has been found to work well in describing the energy required for the
breakage of coarse particle sizes. Both laws have some capability for predicting particle

9
⎥⎥⎦
⎤
⎢⎢⎣
⎡⎟⎟⎠
⎞⎜⎜⎝
⎛−−=
m
cxxQ exp1
size. But as particle size decreases the energy required to fracture the particles goes to
infinity that is obviously erroneous.
1.2.6.4 Distribution based models
Reid proposed an empirical model that defines a specific breakage rate to describe
a grinding process.37 The model describes the breakage as a first-order rate process.
Broadbent expanded this model and now it is referred to as a population balance model.38
The model uses parameters such as the selection and breakage function to describe the
mechanisms of failure. The selection function represents the fractional number of
particles of some size that are broken. The breakage function represents the rate at which
particles in a size class are broken. From this model it is possible to interpret a particle
size distribution mathematically. A correlation between these parameters and the
mechanisms of particle breakage such as fracture, cleavage, and attrition can be
determined. The Weibull distribution equation is another model that uses the particle size
distribution data to obtain an empirical representation of particle breakage. Here Q is the
cumulative fraction of fragment size x, while m and xc are fitting parameter. The Weibull
equation has been used to describe the fracture of brittle materials such as soda-lime glass
(1.5)
spheres.39
1.2.7 Measuring Breakage of Particles
The most common technique to measure particle breakage is by a single impact
test. Where a particle of some size is either shot at a target with some velocity or a load
is applied to a stationary particle at some velocity. The breakage distribution of the
particle can then be determined by measuring the size of the broken particles.25 A
10
drawback of this method is that the only way to apply a stress is by a normal load. Other
methods use indentation techniques to determine the effects of strain on the breakage of
particles. However, similar to the impact technique, the indentation method also subjects
particles to a normal load. Both these methods have proved invaluable for understanding
single particle breakage under a normal load. Schönert studied crack propagation and
crack behavior in many types of materials.25 He showed that material properties, stain
rate, impact velocity, particle shape, and particle size effect how particles break in single
impact and compression tests. It is known that for real systems particles of some size
distribution will show significantly different breakage behavior.23 Particles of small sizes
will not break as easily as particles of larger sizes. Also particles of the same material and
of the same size still can differ in strength. To account for these discrepancies in particle
breakage many researchers have devised techniques to measure multiply particle
breakage. These techniques are similar to the impact test. They are usually performed by
either dropping some load onto a bed of particles or by propelling a mass of particles at
some target. From the particle size distribution data obtained after the test it is possible to
calculate a fractional number of breakages by fitting this data with some sort of empirical
model (i.e. population balance model).
1.2.8 Environment
Environmental effects have been shown to be negligible on the fracture toughness
of a material. Most research suggests that environmental effects for a milling process are
limited to changes in the slurry viscosity that reduces the energy dissipated as heat
through viscous flow.40 However, Griffith’s theory includes a surface energy term that
relates to energy required for crack propagation. It is known that additives and
temperature can change the surface tension of a material. Reducing the surface tension in

11
Griffith's equation reduces the stress required to propagate a crack. This only holds for
particles with an existing crack. It has been suggested that all materials have defects in
the form of small cracks or micro cracks. Rebinder showed that lowering the surface
tension of a material can greatly reduce the fracture toughness of the material and in turn
leads to easier breakage.41 Rebinder’s experiments were performed in dry systems where
the only additive was water. Rehbinder’s theory has been challenged by a number of
researchers who found that the reduction of surface tension does not play a dominant role
in breakage.
1.3 Stirred Media Milling
1.3.1 Media Mills
Stirred media mills have been in use for over 70 years, Szegvari invented the first
mill in 1928. However, media mills did not become popular until the 1950’s when they
were used as disperser in the pigment and paint industry.42 Stirred media mills come in
two designs, which are, either a vertical or horizontal mounted vessel. Stirred media
mills can be run in either the wet or dry milling conditions. In many respects stirred
media mills are similar to ball mills. The major difference between them lies in the way
the energy is supplied to mill and the material. Ball mills operate by rotating the complete
mill volume; the contents are then broken by the impaction of the media colliding in a
cascade mechanism. In a stirred media mill media and materials are placed in the vessel
and then agitated. This reduces the amount of energy needing supplied to the mill since
only the agitator has to be rotated and not the whole volume of the mill. Another
difference is the velocity of the contacting balls or grinding media. In a ball mill the
media velocity is limited by the diameter of the mill and the rotational rate of mill
12
resulting in low media velocities. In a stirred media mill the velocities are only limited by
the rate of rotation of the stirrer.
Stirred media mills are also known as attritors or high-energy mills. An attritor is
stirred media mill run at high solids loading where the milling takes place through a shear
mechanism. A high-energy mill is where the mill is run at very high rpms or tip speeds in
excess of 10 meters per second. It has been estimated that there are over 44 parameters
that can affect a stirred media mills performance.17
1.3.2 Grinding Aids
The previous section mentioned how environmental affects the strength of a
material. This effect is also present in a grinding system. Many researches have
investigated the effects of grinding aids on the efficiency of a milling process.40, 43-46 The
majority of work has been focused on dry ball milling processes. It has been proposed
that in these processes that addition of grinding aids acts as a lubricant, which reduces the
viscosity of the system thus increasing breakage of the particles. In other work grinding
aids were proposed to act as dispersants that prevent particles from agglomerating which
can lead to more effective contact between media and materials. Some researchers
suggest that at high concentrations the grinding aids can add a protective coating to the
particle and decrease the milling efficiency.45, 47 Other effects include the Rehbinder
effect discussed previously where the reduction in surface energy can decrease the stress
required to fracture a material. This effect would be more pronounced in a nano-milling
system where the number of defects per particle is very low. In this study we milled at
low solids loading allowing us to ignore the effect of surfactant on slurry viscosity.
13
1.3.3 Media Loading
Arguably the most important parameter in a stirred media milling process is media
loading. Media loading can affect a milling process in a number of ways. The higher the
media loading the larger the number of contacts which lead to a higher milling rate.18, 19
Also the higher the media loading the higher the viscosity and the larger the energy
needed to operate the mill.48 It is apparent that an optimum must be found to determine
the extent to which a mill should be loaded. However, media loading is not limited to just
these two effects. Media loading also effects the contamination or wear of grinding media
and mill. It affects breakage mechanism taking place, and the flow field inside the mill.
Hashi and other extensively studied the flow field as well as wear of grinding media with
respect to media loading and found optimum media loadings for specific milling
conditions.13, 49 The effects of media loading become even more complicated when
coupled with rotational rate, media size and media density. Media density and rotational
rate can easily change any optimum established for efficiency with respect to energy. We
varied media loading at a constant media density; media size and rotational rate in order
to study just the effect of media loading in the context of number of vary the number of
contacts and not the momentum of the media.
1.3.4 Media Size
The final parameter studied was media size and its effect on particle size reduction
and rate of particle size reduction. It has often been stated to mill to fine sizes small
media is needed.17, 18, 50, 51 It is easy to imagine that as media size decreases the number of
contacts increase. However, as the size of the media decreases the maximum stress that
can be imparted on the particle also decreases. An optimum must be present for media
size similar to the optimum for media loading. The optimum for media loading should
14
change with particle size. This change is due to change of the strength of the material
with particle size and the necessary stress to fracture the material. It is important to note
that the momentum of the media is related to the size and mass of the media times the
velocity of the media. Therefore, media of larger size has a larger momentum and is
capable of imparting more energy on a particle.
1.3.5 Other Milling Parameters
It is important to note that in addition to the parameters discussed above there are
other parameters that can influence a grinding process. Stirrer speed directly affects the
amount of energy consumed in the process as well as the maximum velocity that the
grinding media can achieve, and thus increasing the momentum of grinding media. Media
density also directly affects the momentum of the media and the force that can be
imparted on a particle. Kwade formulated a simple equation to mathematically relates
media size, media density, and rotational rate to the stress intensity.48, 52 Stress intensity
(SI) is directly proportional to circumferential velocity v, media size dp, and media
density ρm less the fluid density ρf:
( ) 22 υρρ fppdSI −= (1.6)
This expression is limited in that it only describes the influence of media size, media
density and rotational rate on the milling process and it is not necessary true to all case. In
our study media density and fluid density are almost the same, which would mean SI
would equal zero. Inhomogeneous regions in the mill may also be present for large dense
medias at low rotational rates.13, 49, 53 For the most part over years media hardness have
only been looked at as how it affects media wear. Most conventional grinding media has
a very high hardness (high density zirconia around 9 on Mohr’s scale). It has been found
15
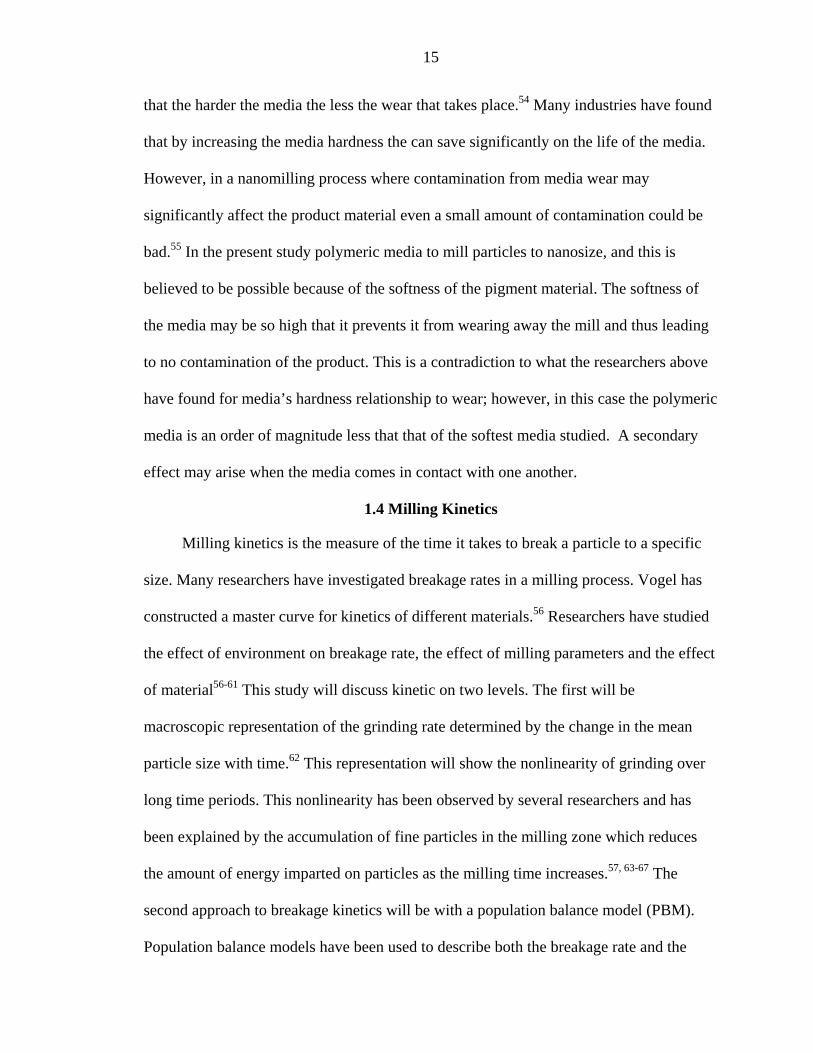
that the harder the media the less the wear that takes place.54 Many industries have found
that by increasing the media hardness the can save significantly on the life of the media.
However, in a nanomilling process where contamination from media wear may
significantly affect the product material even a small amount of contamination could be
bad.55 In the present study polymeric media to mill particles to nanosize, and this is
believed to be possible because of the softness of the pigment material. The softness of
the media may be so high that it prevents it from wearing away the mill and thus leading
to no contamination of the product. This is a contradiction to what the researchers above
have found for media’s hardness relationship to wear; however, in this case the polymeric
media is an order of magnitude less that that of the softest media studied. A secondary
effect may arise when the media comes in contact with one another.
1.4 Milling Kinetics
Milling kinetics is the measure of the time it takes to break a particle to a specific
size. Many researchers have investigated breakage rates in a milling process. Vogel has
constructed a master curve for kinetics of different materials.56 Researchers have studied
the effect of environment on breakage rate, the effect of milling parameters and the effect
of material56-61 This study will discuss kinetic on two levels. The first will be
macroscopic representation of the grinding rate determined by the change in the mean
particle size with time.62 This representation will show the nonlinearity of grinding over
long time periods. This nonlinearity has been observed by several researchers and has
been explained by the accumulation of fine particles in the milling zone which reduces
the amount of energy imparted on particles as the milling time increases.57, 63-67 The
second approach to breakage kinetics will be with a population balance model (PBM).
Population balance models have been used to describe both the breakage rate and the

16
breakage distribution in a milling process.57, 63, 64, 68, 69 The breakage distribution obtained
from the PBM will be then used to evaluate possible particle breakage mechanisms
taking place in the mill at specific times. These mechanisms will then be used to
determine the dominant milling mechanism in the process. From this information it is
then possible to optimize the mill through the complete understanding of particle
breakage, milling parameters, and grinding rate, which can give significant predictability
of product quality and the energy need to produce that product.
17
CHAPTER 2 EXPERIMENTAL PROCEDURE
2.1 Equipment
This study employed the use of the Micros Superfine Grinder manufactured by
NARA Machinery Corp. of Japan. The Micros mill is an attrition mill designed for
ultrafine grinding of particles to the micron and submicron size range. The mill was
originally designed with zirconia rings mounted on six equally distant vertical columns to
grind the material against the inner zirconia wall of the mill vessel. The volume of the
vessel is 500 mL and a cooling jacket surrounds it to maintain a desired temperature. In
this study, the zirconia rings were removed, and the vertical columns were used to agitate
the milling media. Thus, the mill was modified to operate as a vertical, batch stirred
media mill. The rotation rate was set to the maximum possible, which is 2000 rpm in
order to facilitate the most rapid and energetic grinding conditions possible. This
corresponds to an equivalent tangential speed of 11 m.s-1. The effects of the stirrer speed
were not investigated in this study.
Eastman Kodak provided the patented polymeric grinding media used in this study.
The Kodak media patent discusses a method for manufacturing large quantities of vary
narrow size distribution polymeric media.70, 71 Kodak provided several media sizes to be
used in this study. The grinding media sizes were measured by a laser scattering
instrument (Coulter LS230). The volume-mean diameter and standard deviation of each
fraction used in the experiments are presented in Table 2.1 along with other operating
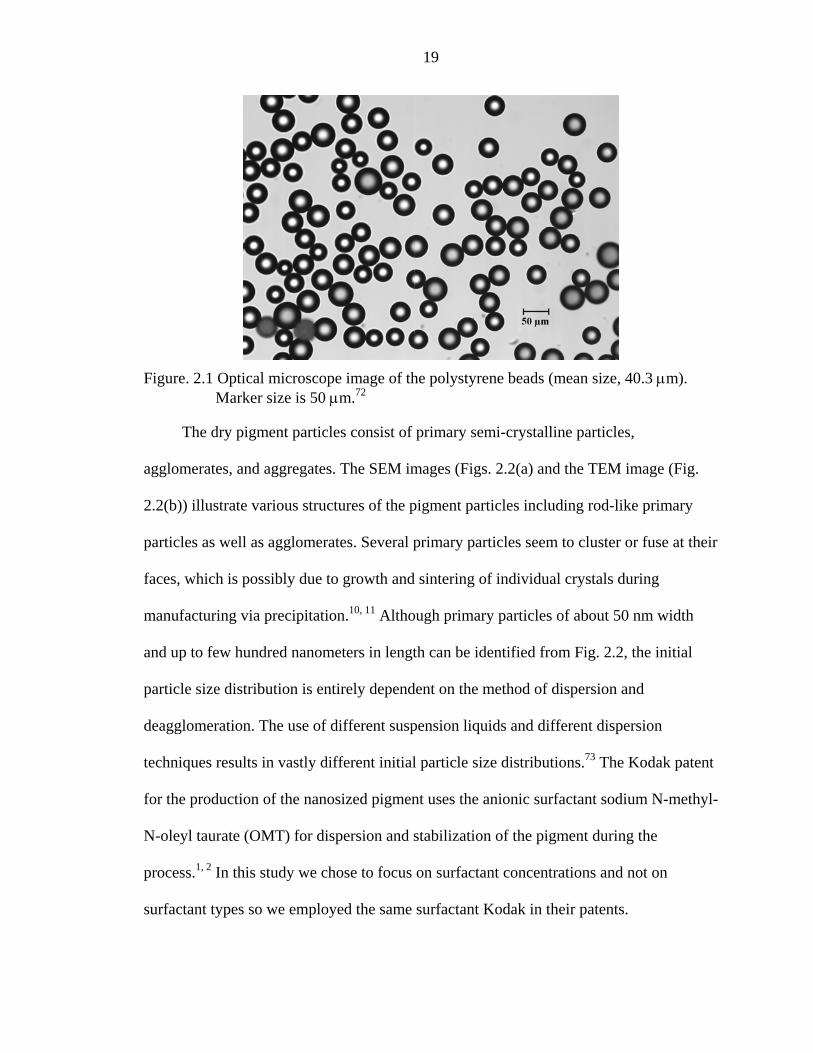
conditions of the milling process. The optical microscope image of the beads (Fig. 2.1)
18
illustrates the sphericity of the beads. The grinding media had a density of approximately
1 g/cm3.
2.2 Materials
The material used in this study is Magenta 122 which is a quinacridone organic
pigment used in inkjet ink formulations. Magenta 122 is a water-insoluble, semi-
crystalline pigment; with a molecular formula of C22H16N2O2 it has a structure that
resembles two naphthalene molecules joined by a cyclohexane molecule. The pigment
used was manufactured by Sun Chemical Company and has a density of 1.24 g.cm-3.
Magenta 122 is hydrophobic and has a contact angle of approximately 1540 as measured
by a goniometer.
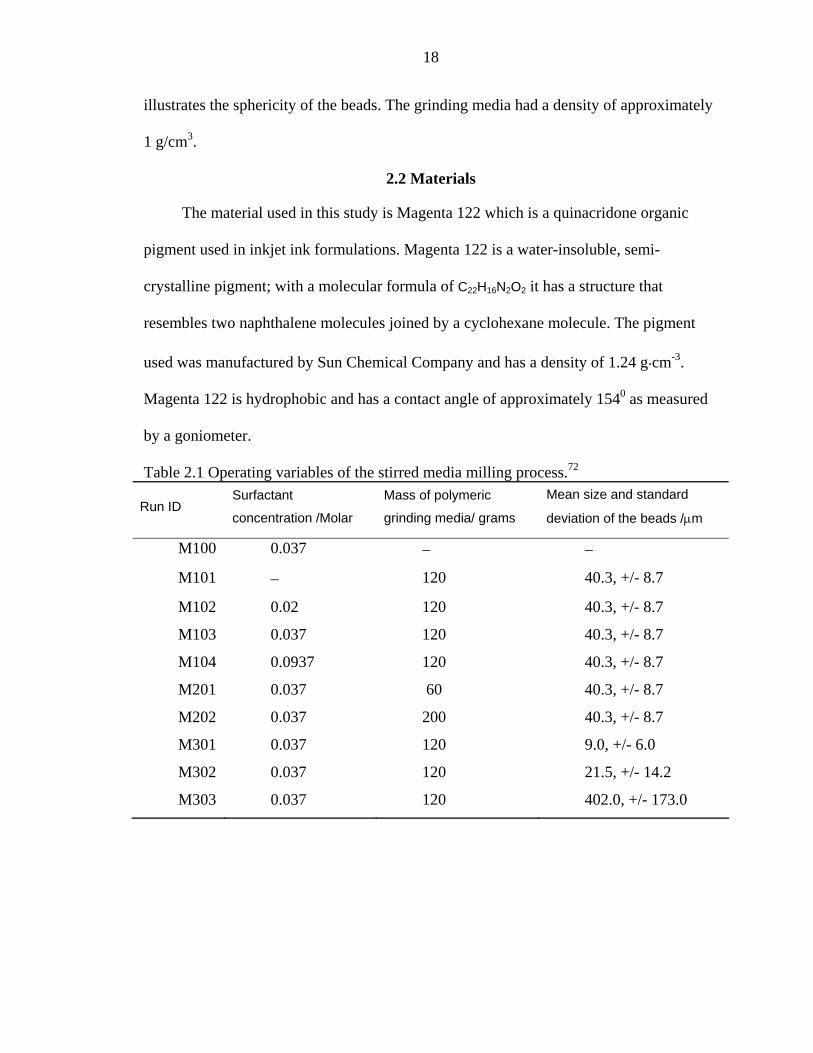
Table 2.1 Operating variables of the stirred media milling process.72
Run ID Surfactant
concentration /Molar
Mass of polymeric
grinding media/ grams
Mean size and standard
deviation of the beads /µm
M100 0.037 − −
M101 − 120 40.3, +/- 8.7
M102 0.02 120 40.3, +/- 8.7
M103 0.037 120 40.3, +/- 8.7
M104 0.0937 120 40.3, +/- 8.7
M201 0.037 60 40.3, +/- 8.7
M202 0.037 200 40.3, +/- 8.7
M301 0.037 120 9.0, +/- 6.0
M302 0.037 120 21.5, +/- 14.2
M303 0.037 120 402.0, +/- 173.0
19
Figure. 2.1 Optical microscope image of the polystyrene beads (mean size, 40.3 µm). Marker size is 50 µm.72
The dry pigment particles consist of primary semi-crystalline particles,
agglomerates, and aggregates. The SEM images (Figs. 2.2(a) and the TEM image (Fig.
2.2(b)) illustrate various structures of the pigment particles including rod-like primary
particles as well as agglomerates. Several primary particles seem to cluster or fuse at their
faces, which is possibly due to growth and sintering of individual crystals during
manufacturing via precipitation.10, 11 Although primary particles of about 50 nm width
and up to few hundred nanometers in length can be identified from Fig. 2.2, the initial
particle size distribution is entirely dependent on the method of dispersion and
deagglomeration. The use of different suspension liquids and different dispersion
techniques results in vastly different initial particle size distributions.73 The Kodak patent
for the production of the nanosized pigment uses the anionic surfactant sodium N-methyl-
N-oleyl taurate (OMT) for dispersion and stabilization of the pigment during the
process.1, 2 In this study we chose to focus on surfactant concentrations and not on
surfactant types so we employed the same surfactant Kodak in their patents.

20
Figure 2.2 Images of the pigment particles: (a) SEM image undmagnifications; and (b) TEM image. Marker size is 1nm for (b).72
The surfactant is a long carbon chain surfactant with a mo
g/mol and a critical micelle concentration (CMC) of 0.037 M as
Wilhelmy Plate method at 250 C.
(a)
(b)
er ×50,000 00 nm for (a) and 500
lecular weight of 454
measured by the
500 nm
21
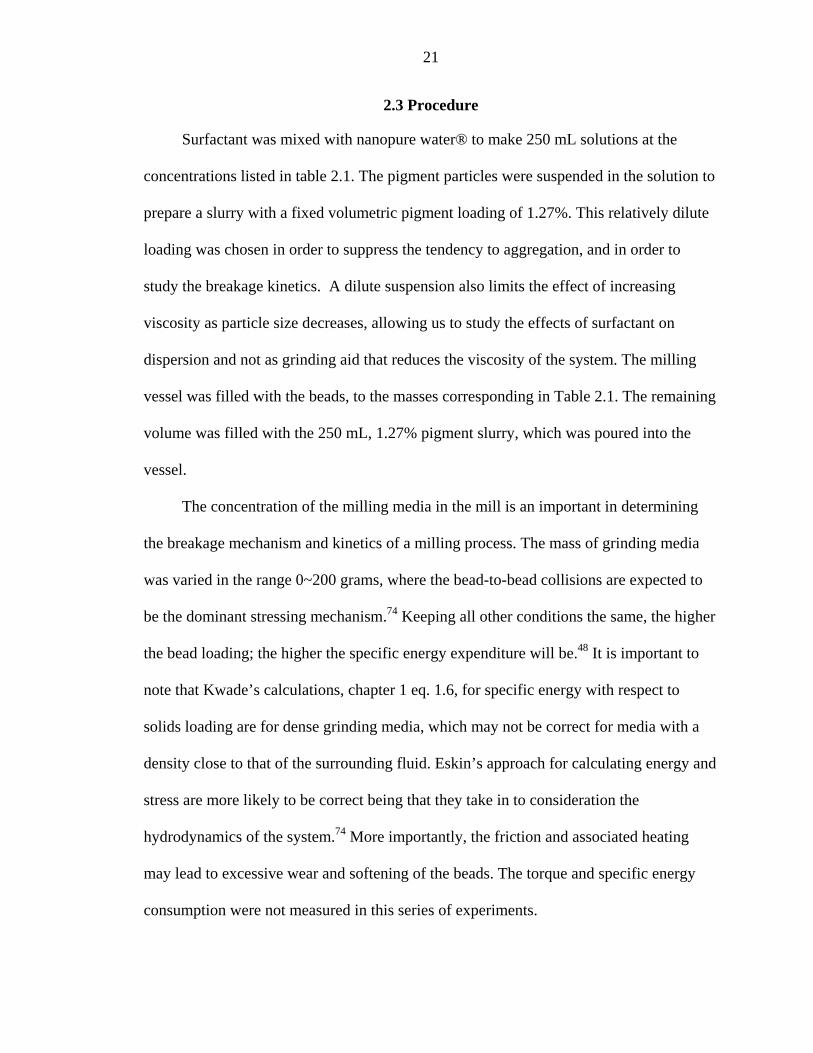
2.3 Procedure
Surfactant was mixed with nanopure water® to make 250 mL solutions at the
concentrations listed in table 2.1. The pigment particles were suspended in the solution to
prepare a slurry with a fixed volumetric pigment loading of 1.27%. This relatively dilute
loading was chosen in order to suppress the tendency to aggregation, and in order to
study the breakage kinetics. A dilute suspension also limits the effect of increasing
viscosity as particle size decreases, allowing us to study the effects of surfactant on
dispersion and not as grinding aid that reduces the viscosity of the system. The milling
vessel was filled with the beads, to the masses corresponding in Table 2.1. The remaining
volume was filled with the 250 mL, 1.27% pigment slurry, which was poured into the
vessel.
The concentration of the milling media in the mill is an important in determining
the breakage mechanism and kinetics of a milling process. The mass of grinding media
was varied in the range 0~200 grams, where the bead-to-bead collisions are expected to
be the dominant stressing mechanism.74 Keeping all other conditions the same, the higher
the bead loading; the higher the specific energy expenditure will be.48 It is important to
note that Kwade’s calculations, chapter 1 eq. 1.6, for specific energy with respect to
solids loading are for dense grinding media, which may not be correct for media with a
density close to that of the surrounding fluid. Eskin’s approach for calculating energy and
stress are more likely to be correct being that they take in to consideration the
hydrodynamics of the system.74 More importantly, the friction and associated heating
may lead to excessive wear and softening of the beads. The torque and specific energy
consumption were not measured in this series of experiments.
22
2.4 Sampling and Characterization
Particle size measurements have many connotations that can be described by size,
shape, volume, surface area, length, number, and any other definition which is usually
process specific.75 We chose to represent the particle size distribution by the volume of a
particle so we could use the mass balance equation incorporated in the PBM model for
measuring particle breakage. The particle size distribution of the pigment was monitored
with time; measurements were performed using the Microtrac ultrafine particle analyzer
(UPA) 150 instrument, which is capable of measuring particle sizes in the range of 3.2
nm to 6.5 µm. The UPA measures particle through the technique of photon correlation
spectroscopy (PCS) or dynamic light scattering. Particles in the nanosize range undergo a
large amount of movement due to Brownian motion. The Brownian motion causes
interference in the scattered light, which results in a fluctuation in the recorded intensity
with time. The fluctuations are then fit to a correlation function that equates the
fluctuations to particle size. Filella reviewed the PCS techniques used by different
instruments and discussed some of the problems associated with them.76 One of the
largest problems associated with a PCS measurement technique is colloidal suspension
concentration, which can result in agglomeration of particles and multiple scattering of
the signal. By representing a particle size on a volume basis there is a weighting of the
distribution towards the large heavy particle sizes. Even one large particle can lead to a
significant amount of error in the particle size measurement. Our data shows that after 10
min of milling all the pigment particles are reduced to a size of less then 1 µm. To assure
that the samples are free from particles of above 2 µm, which would lead to significant
error in the measurements, the samples are removed and filtered using a 2 µm syringe
23
filter. Freud measured particle size distributions of nanosize particles at varying
concentrations on the UPA and found that the error in particle size is linear for
concentrations above 0.1%.77 The pigment concentration in the mill is approximately
1.27%, therefore, after filtration the samples are diluted to approximately 0.1% using the
appropriate concentration of surfactant solution to eliminate any instability by diluting in
water that could lead to agglomeration during the measurement. To be assured that no
agglomeration was taking place during the measurement, an experiment was run where
samples were measured at sampling times 30 sec., 1 min, 3 min, 5 min, 9 min, 15 min, 30
min, and 1 hr. This experiment showed there was no variation in the samples with time.
Approximately 1 ml of sample was removed from the mill after 10 minutes and then
every 4 hours after that to reduce the reduction in mill volume with time due to sampling.
For the PBM study, samples were taken every 2hours to increase the number of data
points and reduce the error in the fit.
In addition to monitoring the time variation of the particle size distribution, the size
and shape change of the pigments before and after milling was also monitored using
scanning electron microscopy (SEM), which was also used to check whether or not the
beads had been damaged during the milling process. The diluted and dried samples were
ion beam coated prior to examination with the SEM (JEOL JSM6330F). The elemental
composition of the samples imaged via transmission electron microscopy (TEM) was
determined using energy dissipative X-ray spectroscopy (EDS). Elemental analysis of the
product slurry was performed using inductively coupled plasma spectroscopy (ICP).
SEM, TEM, EDS, and ICP measurements were used to check if the pigment slurry had
become contaminated with zirconia or stainless steel from the mill. Gas chromatography

24
(GC) was used to measure the contamination from the polymeric media; this method
lacked the mass spectroscopy capability so we were only able to determine that the
samples were qualitatively free from polymeric media, which agreed with the SEM
results.

25
CHAPTER 3 EXPERIMENTAL RESULTS AND DISCUSION
3.1 Base Experiments
An experiment was run to determine the effect of dispersion on the final pigment
particle size without the presence of milling media. As mentioned previously different
dispersion methods revealed largely varying particle size distributions. Experiment M100
was carried out by dispersing the pigment under the milling conditions listed in table 2.1.
The results of the particle size obtained from this run can be seen in fig. 3.3. The particle
size distribution is bi-modal and consists of a minor coarse fraction in the size range
1.6~4.6 µm and a major fraction in the size range 80~800 nm. The particle size evolved
to a stable state that indicates dispersion to primary particles and small fraction of hard
agglomerates and coarse particles was achieved. It has been shown in literature that
breakage of the soft agglomerates is a prerequisite for wetting and subsequent adsorption
of dispersants and stabilization of the particle suspension.78 The intent of this experiment
was to provide and estimate of the initial particle size distribution, which is important in
formulating the population balance model (provides a basis for the mass balance
equation).
Another base case experiment, M103, was carried to determine the effectiveness of
the polymeric media on the rate of particle size reduction and on the final particle size
obtained. A fit of the population balance model to the base case experiment is presented
in chapter 4. SEM images were taken of samples collected from M103 after 10 minutes,
16 hours and 24 hours of mill can be seen in Fig. 3.1, which shows that a fast dispersion
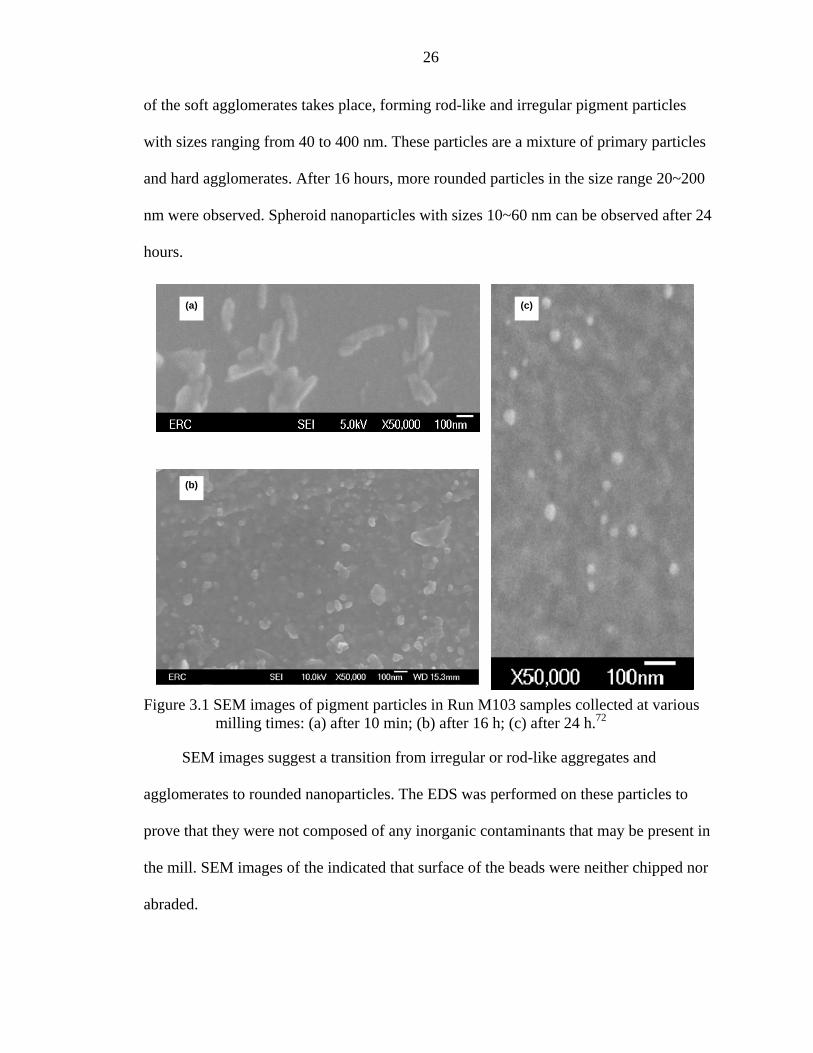
26
of the soft agglomerates takes place, forming rod-like and irregular pigment particles
with sizes ranging from 40 to 400 nm. These particles are a mixture of primary particles
and hard agglomerates. After 16 hours, more rounded particles in the size range 20~200
nm were observed. Spheroid nanoparticles with sizes 10~60 nm can be observed after 24
hours.
Figure 3.1 SEM images of pigment particles in Run M103 samples collected at various
milling times: (a) after 10 min; (b) after 16 h; (c) after 24 h.72
SEM images suggest a transition from irregular or rod-like aggregates and
agglomerates to rounded nanoparticles. The EDS was performed on these particles to
prove that they were not composed of any inorganic contaminants that may be present in
the mill. SEM images of the indicated that surface of the beads were neither chipped nor
abraded.
(a)
(b)
(c)
27
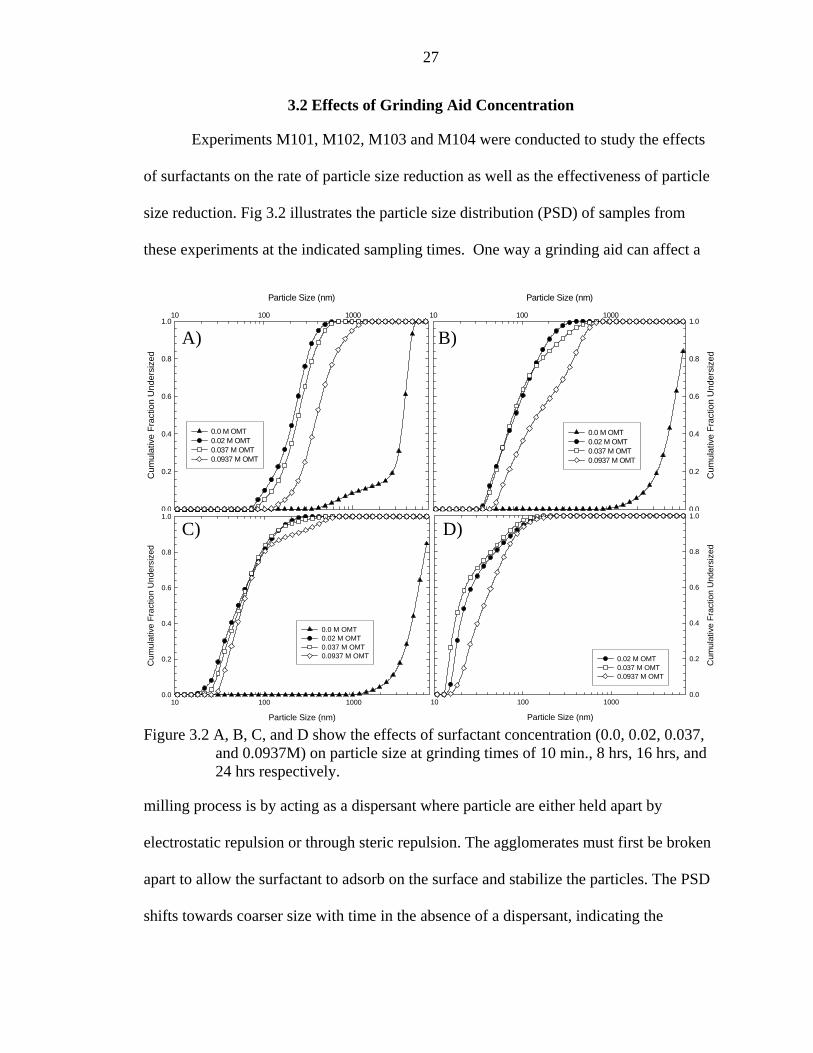
3.2 Effects of Grinding Aid Concentration
Experiments M101, M102, M103 and M104 were conducted to study the effects
of surfactants on the rate of particle size reduction as well as the effectiveness of particle
size reduction. Fig 3.2 illustrates the particle size distribution (PSD) of samples from
these experiments at the indicated sampling times. One way a grinding aid can affect a
Figure 3.2 A, B, C, and D show the effects of surfactant concentration (0.0, 0.02, 0.037, and 0.0937M) on particle size at grinding times of 10 min., 8 hrs, 16 hrs, and 24 hrs respectively.
milling process is by acting as a dispersant where particle are either held apart by
electrostatic repulsion or through steric repulsion. The agglomerates must first be broken
apart to allow the surfactant to adsorb on the surface and stabilize the particles. The PSD
shifts towards coarser size with time in the absence of a dispersant, indicating the
Particle Size (nm)
10 100 1000
Cum
ulat
ive
Frac
tion
Und
ersi
zed
0.0
0.2
0.4
0.6
0.8
1.0
0.0 M OMT0.02 M OMT0.037 M OMT0.0937 M OMT
Particle Size (nm)
10 100 1000
Cum
ulat
ive
Frac
tion
Und
ersi
zed
0.0
0.2
0.4
0.6
0.8
1.0
0.0 M OMT0.02 M OMT0.037 M OMT0.0937 M OMT
Particle Size (nm)
10 100 1000
Cum
ulat
ive
Frac
tion
Und
ersi
zed
0.0
0.2
0.4
0.6
0.8
1.0
0.0 M OMT0.02 M OMT0.037 M OMT0.0937 M OMT
Particle Size (nm)
10 100 1000C
umul
ativ
e Fr
actio
n U
nder
size
d
0.0
0.2
0.4
0.6
0.8
1.0
0.02 M OMT0.037 M OMT0.0937 M OMT
A) B)
D)C)
Particle Size (nm)
10 100 1000
Cum
ulat
ive
Frac
tion
Und
ersi
zed
0.0
0.2
0.4
0.6
0.8
1.0
0.0 M OMT0.02 M OMT0.037 M OMT0.0937 M OMT
Particle Size (nm)
10 100 1000
Cum
ulat
ive
Frac
tion
Und
ersi
zed
0.0
0.2
0.4
0.6
0.8
1.0
0.0 M OMT0.02 M OMT0.037 M OMT0.0937 M OMT
Particle Size (nm)
10 100 1000
Cum
ulat
ive
Frac
tion
Und
ersi
zed
0.0
0.2
0.4
0.6
0.8
1.0
0.0 M OMT0.02 M OMT0.037 M OMT0.0937 M OMT
Particle Size (nm)
10 100 1000C
umul
ativ
e Fr
actio
n U
nder
size
d
0.0
0.2
0.4
0.6
0.8
1.0
0.02 M OMT0.037 M OMT0.0937 M OMT
Particle Size (nm)
10 100 1000
Cum
ulat
ive
Frac
tion
Und
ersi
zed
0.0
0.2
0.4
0.6
0.8
1.0
0.0 M OMT0.02 M OMT0.037 M OMT0.0937 M OMT
Particle Size (nm)
10 100 1000
Cum
ulat
ive
Frac
tion
Und
ersi
zed
0.0
0.2
0.4
0.6
0.8
1.0
0.0 M OMT0.02 M OMT0.037 M OMT0.0937 M OMT
Particle Size (nm)
10 100 1000
Cum
ulat
ive
Frac
tion
Und
ersi
zed
0.0
0.2
0.4
0.6
0.8
1.0
0.0 M OMT0.02 M OMT0.037 M OMT0.0937 M OMT
Particle Size (nm)
10 100 1000C
umul
ativ
e Fr
actio
n U
nder
size
d
0.0
0.2
0.4
0.6
0.8
1.0
0.02 M OMT0.037 M OMT0.0937 M OMT
A) B)
D)C)
28
aggregation of particles. Even for the low pigment concentration under consideration
(1.27 vol.%), collisions of the pigment particles due to turbulent agitation and Brownian
motion led to aggregation when no surfactant is present. Another effect of the grinding
aid is to reduce the pulp viscosity, thus allowing higher solids loading in wet milling.43
However, depending on the size and material properties of the solid to be ground,
dispersants may have little effect on the milling efficiency and dynamics when the initial
feed is very dilute.44, 45 In the current work, at low pigment concentration, the stabilizing
action of the surfactant is the most important as nanoparticles have a high tendency to
aggregate. When sufficient surfactant is added (0.02, 0.037 and 0.0937 M), the PSD is
observed to move monotonically toward finer sizes. The PSDs for surfactant
concentrations of 0.02 and 0.037 M cases are similar within the experimental accuracy
(Appendix A); almost all of the particles are in the nano-size range 9~100 nm after 24
hours of milling. However, excessive use of the surfactant (0.0937 M) reduced the
breakage rate. These experiments indicate an optimum surfactant concentration for this
pigment loading in order to achieve finer particles within a shorter milling period.
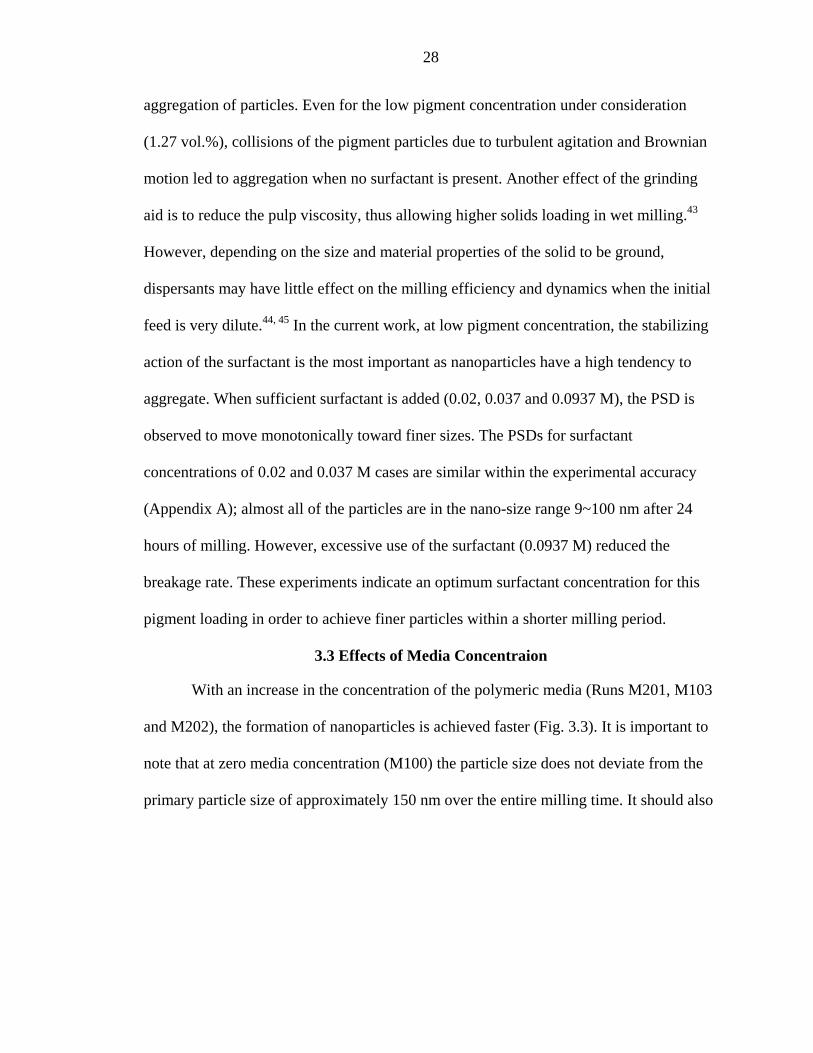
3.3 Effects of Media Concentraion
With an increase in the concentration of the polymeric media (Runs M201, M103
and M202), the formation of nanoparticles is achieved faster (Fig. 3.3). It is important to
note that at zero media concentration (M100) the particle size does not deviate from the
primary particle size of approximately 150 nm over the entire milling time. It should also
29
Figure 3.3 A, B, C, and D show the effects of media concentration (0, 60, 120, and 200 g) on particle size at grinding times of 10 min., 8 hrs, 16 hrs, and 24 hrs respectively.
be observed that after 10 minutes of milling all the concentrations have almost the same
particle size distribution, which supports our initial finding that we rapidly disperse the
agglomerated pigment particles to there primary particle size. With an increase in the
concentration of the media the production of nanoparticles is achieved faster. This is
intuitively expected because the number of bead–bead collisions and consequently the
rate of stressing of the pigment increase as the bead concentration increase. It is difficult
to predict from these results whether it is the number of increasing bead-bead collisions
that result in the increased rate of grinding or if a change from an impaction mechanism
of grinding to a shear mechanism of grinding is what led to the higher grinding rate.
Experiments at higher media loadings where shear would obviously have been the
Particle Size (nm)
10 100 1000
Cum
ulat
ive
Frac
tion
Und
ersi
zed
0.0
0.2
0.4
0.6
0.8
1.0
No media60 g 120 g200 g
Particle Size (nm)
10 100 1000
Cum
ulat
ive
Frac
tion
Und
ersi
zed
0.0
0.2
0.4
0.6
0.8
1.0
no media60 g120 g200 g
Particle Size (nm)
10 100 1000
Cum
ulat
ive
Frac
tion
Und
ersi
zed
0.0
0.2
0.4
0.6
0.8
1.0
No media60 g120 g200 g
Particle Size (nm)
10 100 1000
Cum
ulat
ive
Frac
tion
Und
ersi
zed
0.0
0.2
0.4
0.6
0.8
1.0
No media60 g120 g200 g
A)
C) D)
B)
Particle Size (nm)
10 100 1000
Cum
ulat
ive
Frac
tion
Und
ersi
zed
0.0
0.2
0.4
0.6
0.8
1.0
No media60 g 120 g200 g
Particle Size (nm)
10 100 1000
Cum
ulat
ive
Frac
tion
Und
ersi
zed
0.0
0.2
0.4
0.6
0.8
1.0
no media60 g120 g200 g
Particle Size (nm)
10 100 1000
Cum
ulat
ive
Frac
tion
Und
ersi
zed
0.0
0.2
0.4
0.6
0.8
1.0
No media60 g120 g200 g
Particle Size (nm)
10 100 1000
Cum
ulat
ive
Frac
tion
Und
ersi
zed
0.0
0.2
0.4
0.6
0.8
1.0
No media60 g120 g200 g
Particle Size (nm)
10 100 1000
Cum
ulat
ive
Frac
tion
Und
ersi
zed
0.0
0.2
0.4
0.6
0.8
1.0
No media60 g 120 g200 g
Particle Size (nm)
10 100 1000
Cum
ulat
ive
Frac
tion
Und
ersi
zed
0.0
0.2
0.4
0.6
0.8
1.0
no media60 g120 g200 g
Particle Size (nm)
10 100 1000
Cum
ulat
ive
Frac
tion
Und
ersi
zed
0.0
0.2
0.4
0.6
0.8
1.0
No media60 g120 g200 g
Particle Size (nm)
10 100 1000
Cum
ulat
ive
Frac
tion
Und
ersi
zed
0.0
0.2
0.4
0.6
0.8
1.0
No media60 g120 g200 g
A)
C) D)
B)
30
grinding mechanism taking place failed due to the large pressure build up in the mill at
high rotational rates.
From a fracture mechanics perspective a particle undergoing a shear mechanism
of stress is more likely to result in a cleavage or fracture mechanism of breakage as
opposed to an attrition mechanism. An attrition mechanism of breakage is most likely to
result from an impaction mechanism of stress.27 The distributions above suggest that a
cleavage or fracture mechanism of breakage is taking place, which would mean shear is
the dominant mechanism of breakage. As stated in the first chapter cleavage mechanism
is mostly to take place for ductile materials and a fracture mechanism for brittle
materials. Considering that pigment is a soft organic material it would be safe to assume
that a cleavage is the most likely mechanism of breakage. It is important to note that
these conditions of failure and loading are valid for macroscopic brittle material and may
not always be true for nanosized materials, which have proven to show significantly
different material properties, which may change during processing.30, 32, 33
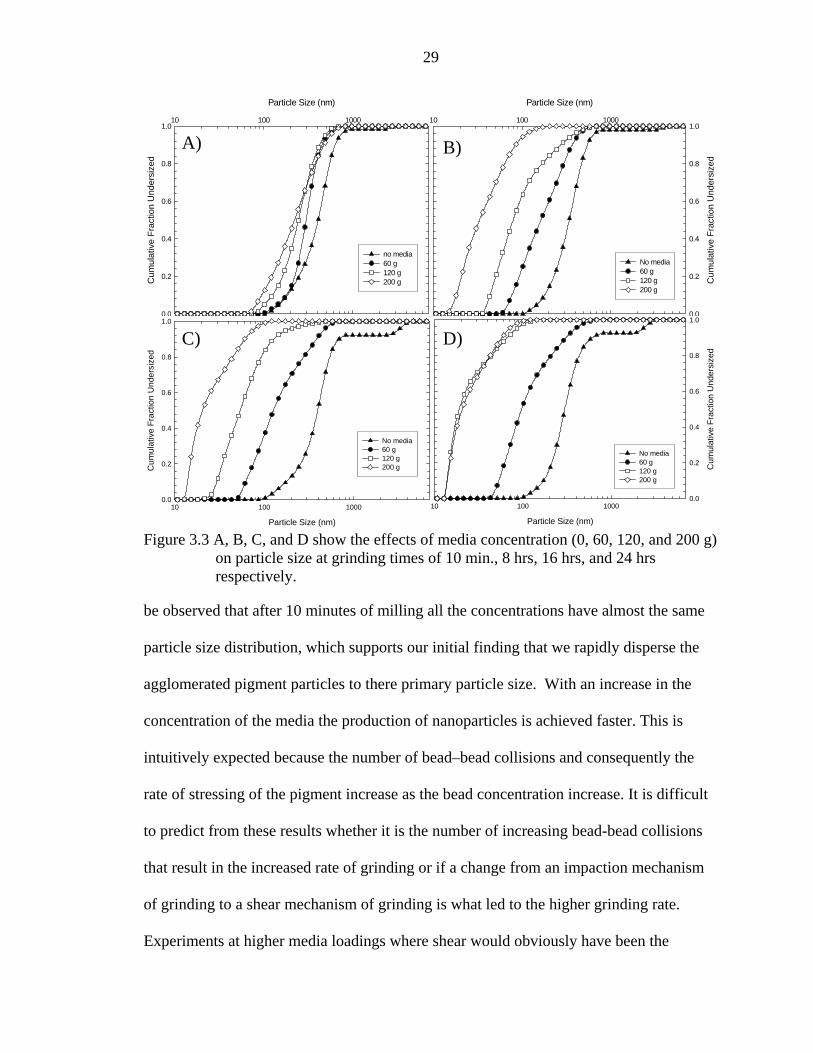
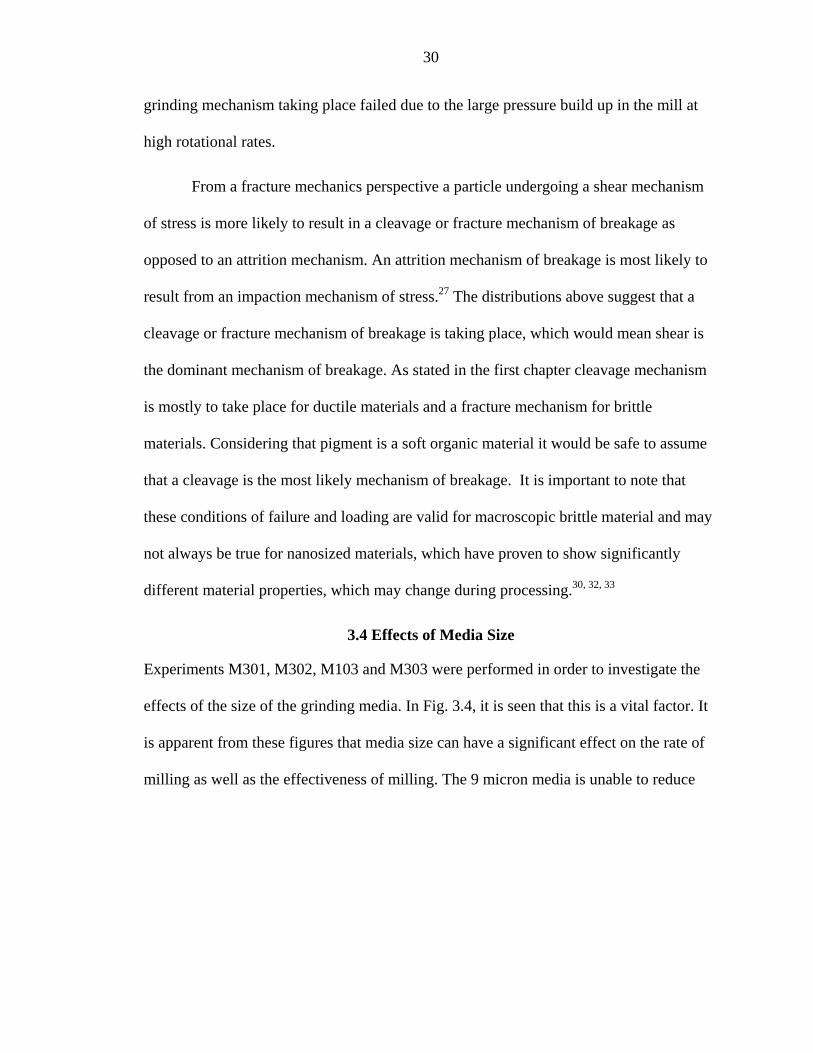
3.4 Effects of Media Size
Experiments M301, M302, M103 and M303 were performed in order to investigate the
effects of the size of the grinding media. In Fig. 3.4, it is seen that this is a vital factor. It
is apparent from these figures that media size can have a significant effect on the rate of
milling as well as the effectiveness of milling. The 9 micron media is unable to reduce
31
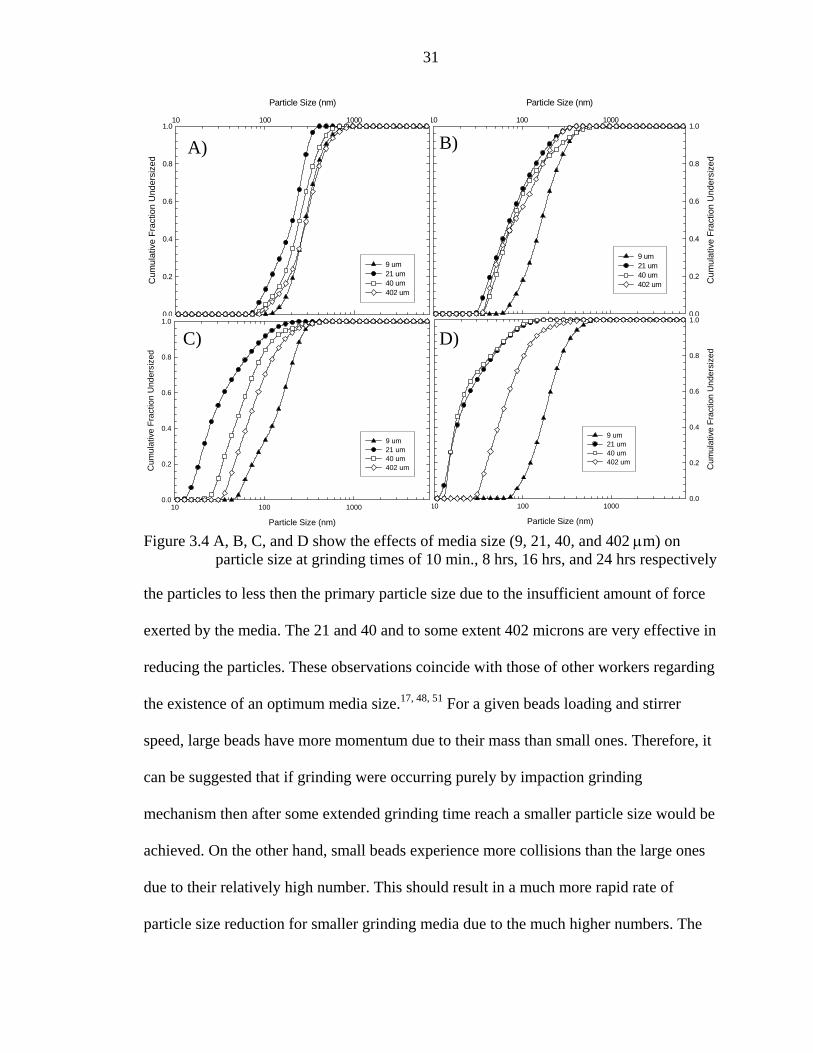
Figure 3.4 A, B, C, and D show the effects of media size (9, 21, 40, and 402 µm) on particle size at grinding times of 10 min., 8 hrs, 16 hrs, and 24 hrs respectively
the particles to less then the primary particle size due to the insufficient amount of force
exerted by the media. The 21 and 40 and to some extent 402 microns are very effective in
reducing the particles. These observations coincide with those of other workers regarding
the existence of an optimum media size.17, 48, 51 For a given beads loading and stirrer
speed, large beads have more momentum due to their mass than small ones. Therefore, it
can be suggested that if grinding were occurring purely by impaction grinding
mechanism then after some extended grinding time reach a smaller particle size would be
achieved. On the other hand, small beads experience more collisions than the large ones
due to their relatively high number. This should result in a much more rapid rate of
particle size reduction for smaller grinding media due to the much higher numbers. The
Particle Size (nm)
10 100 1000
Cum
ulat
ive
Frac
tion
Und
ersi
zed
0.0
0.2
0.4
0.6
0.8
1.0
9 um21 um40 um402 um
Particle Size (nm)
10 100 1000
Cum
ulat
ive
Frac
tion
Und
ersi
zed
0.0
0.2
0.4
0.6
0.8
1.0
9 um21 um40 um402 um
Particle Size (nm)
10 100 1000
Cum
ulat
ive
Frac
tion
Und
ersi
zed
0.0
0.2
0.4
0.6
0.8
1.0
9 um21 um40 um402 um
Particle Size (nm)
10 100 1000
Cum
ulat
ive
Frac
tion
Und
ersi
zed
0.0
0.2
0.4
0.6
0.8
1.0
9 um21 um40 um402 um
A)
D)
B)
C)
Particle Size (nm)
10 100 1000
Cum
ulat
ive
Frac
tion
Und
ersi
zed
0.0
0.2
0.4
0.6
0.8
1.0
9 um21 um40 um402 um
Particle Size (nm)
10 100 1000
Cum
ulat
ive
Frac
tion
Und
ersi
zed
0.0
0.2
0.4
0.6
0.8
1.0
9 um21 um40 um402 um
Particle Size (nm)
10 100 1000
Cum
ulat
ive
Frac
tion
Und
ersi
zed
0.0
0.2
0.4
0.6
0.8
1.0
9 um21 um40 um402 um
Particle Size (nm)
10 100 1000
Cum
ulat
ive
Frac
tion
Und
ersi
zed
0.0
0.2
0.4
0.6
0.8
1.0
9 um21 um40 um402 um
A)
D)
B)
C)
32
effects of momentum and number of contacts can both be seen in the figure above. For
example, the 21 micron media decreases the particle size much more rapidly then the 40
or 402 um grinding media. However as grinding time increase the 40 micron media
yields a slightly smaller particles then 21 micron media due to the large amount of force
exerted by the 40 micron media. The existence of the larger particle size distribution for
the 402 micron media at a grinding time of 24 hrs is due to the fact that the 402 micron
media did not have sufficient time to mill the particles to or below the size obtained by
the 21 or 40 micron media.
3.5 Breakage Mechanisms
In the first chapter possible breakage mechanism were discussed these mechanism
are fracture, cleavage, and attrition. Many authors have discussed the resultant PSD from
different breakage mechanism, as illustrated in chapter 1, fig 1.1. 26, 79 From the
distributions above it is obvious that an attrition mechanism is not taking place. If this
were the case a small fraction of 10’s nanometer size particles would be present at the
short grinding times. It is not possible to distinguish between a cleavage and a fracture
mechanism from the present data. However in the next chapter the data from the
experiments is fitted to a population balance model (PBM) and it is possible to
quantitatively prove that a cleavage mechanism is clearly the mechanism of breakage for
the base case experiment.
3.6 Grinding Mechanism
Grinding mechanisms are difficult to predict in a stirred media milling process. It
has been shown in this chapter that media loading has a significant effect on the grinding
mechanism. It was also shown that certain mechanisms are more likely depending on the
response of the particle size distribution to the size of the media or change in momentum
33
(stress intensity 48). Considering that a stirred media milling process is an extremely
complex process it is most likely that more then one grinding mechanism is responsible
for the size reduction in media milling.
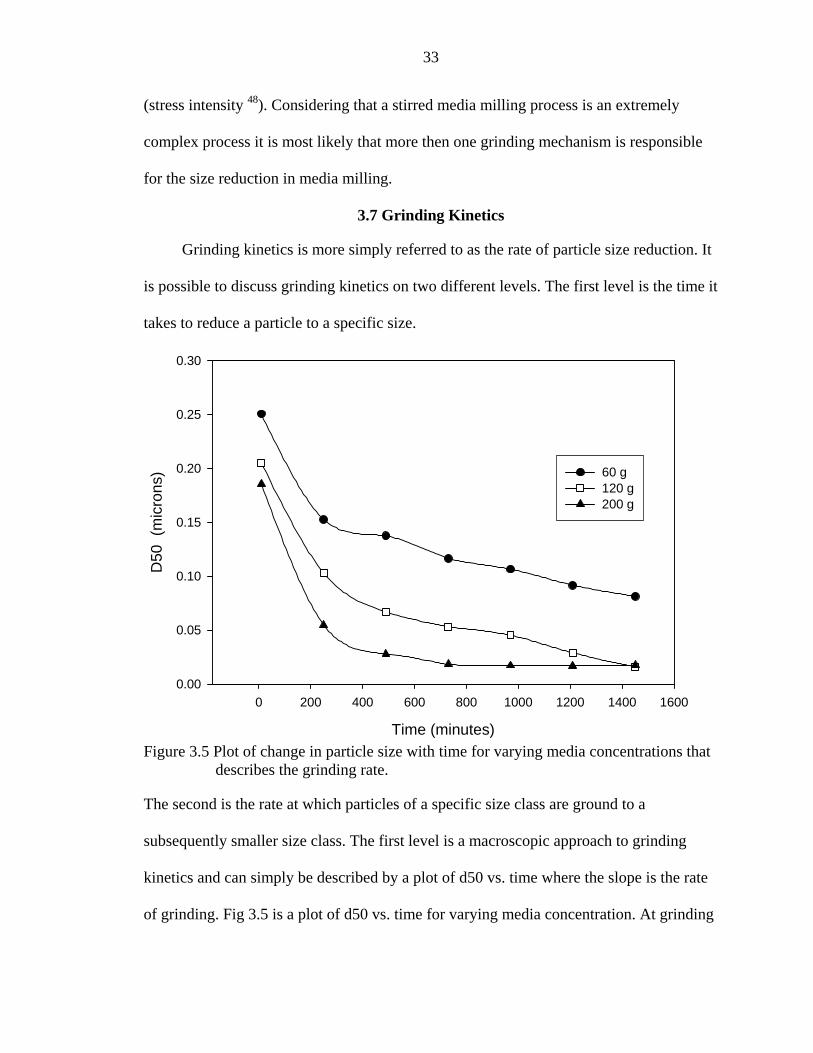
3.7 Grinding Kinetics
Grinding kinetics is more simply referred to as the rate of particle size reduction. It
is possible to discuss grinding kinetics on two different levels. The first level is the time it
takes to reduce a particle to a specific size.
Figure 3.5 Plot of change in particle size with time for varying media concentrations that describes the grinding rate.
The second is the rate at which particles of a specific size class are ground to a
subsequently smaller size class. The first level is a macroscopic approach to grinding
kinetics and can simply be described by a plot of d50 vs. time where the slope is the rate
of grinding. Fig 3.5 is a plot of d50 vs. time for varying media concentration. At grinding
Time (minutes)
0 200 400 600 800 1000 1200 1400 1600
D50
(m
icro
ns)
0.00
0.05
0.10
0.15
0.20
0.25
0.30
60 g120 g200 g
34
times up to 250 minutes the data obeys first order grinding kinetics, which is similar to
result reported in literature for grinding kinetics.68
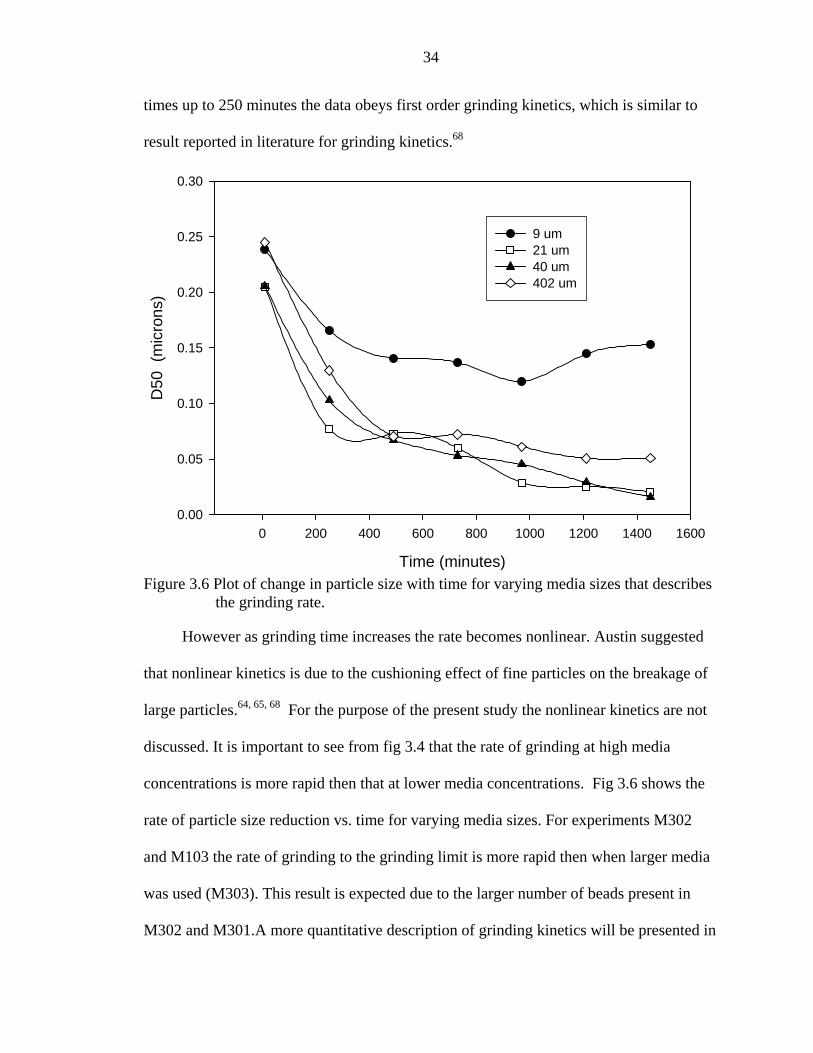
Figure 3.6 Plot of change in particle size with time for varying media sizes that describes the grinding rate.
However as grinding time increases the rate becomes nonlinear. Austin suggested
that nonlinear kinetics is due to the cushioning effect of fine particles on the breakage of
large particles.64, 65, 68 For the purpose of the present study the nonlinear kinetics are not
discussed. It is important to see from fig 3.4 that the rate of grinding at high media
concentrations is more rapid then that at lower media concentrations. Fig 3.6 shows the
rate of particle size reduction vs. time for varying media sizes. For experiments M302
and M103 the rate of grinding to the grinding limit is more rapid then when larger media
was used (M303). This result is expected due to the larger number of beads present in
M302 and M301.A more quantitative description of grinding kinetics will be presented in
Time (minutes)
0 200 400 600 800 1000 1200 1400 1600
D50
(m
icro
ns)
0.00
0.05
0.10
0.15
0.20
0.25
0.30
9 um21 um40 um402 um

35
the following chapter. Population balance modeling will be used to describe the breakage
of particles from one size class to a smaller size class and will also discuss the nonlinear
observation in the data.
36
CHAPTER 4 POPULATION BALANCE MODEL
4.1 Method
For over 50 years researchers have modeled grinding and other particulate process
through the use a population balance model (PBM).63, 64, 68, 80 Bass was the first to derive
an integro-differential mass balance equation for a batch grinding system.81 For a
grinding process it is generally assumed that only breakage occurs, thus allowing
simplifications to be made to the integro-differential mass balance equation. Due to this
assumption the accumulation term (agglomeration) can be left out. The system that we
have chosen to model uses a surfactant to prevent particles from reagglomerating.78
Considering that Bass’s equation does not have a simple analytical solution, Reid
suggested a finite difference approximation to Bass’s equation.37 The fractional weight
function is discrete in size x and continuous in time t in the form where ( )iq t is a set of
n size classes numbered from the coarsest downwards, ijb is a volume fraction of the
broken material finer than size jx (breakage distribution function) that is retained on
class i , where i jx x< and consequently i j> , ( )( )
ii
i
dq tk
q t dt= − is a fractional rate of
breakage (also called a selection function) assumed to be independent of time.
1
1
( )( ) ( ), 1
ii
ij j j i ij
dq tb k q t k q t i n
dt
−
=
= − ≤ ≤∑ , (4.1)
This is the basic set of ordinary differential equations that form the population
balance model (PBM) of grinding. Generally, the solution of the system (4.1) is
37
reproduced after determination in advance (from experimental data on monoclass
samples) breakage and selection functions, which is becoming problematic for the
submicron particles. That is why we use the so-called "inverse formulation" of the
problem. Parameters ijb and ik of breakage and selection function are determined from
experimental data for particle size distributions obtained during the whole experiment.
They have to be selected in such a way that solutions of (4.1) match the experimental
data as closely as possible. The best possible approximation of the experimental data by
curves ( )iq t we understand in the least squares sense is represented in eq. (4.2):
( )2exp th
1
min ( ) ( )k
neor
i k i kt i
q t q t=
−∑∑ , (4.2)
where exp ( )i kq t and th ( )eori kq t are the experimental and theoretical points respectively.
Besides providing the best possible fit of our solution to the experimental data, the
parameters of the system (4.1) have to obey the law of mass conservation. From the
structure of the equations in system (4.1) it follows that parameters ijb must satisfy the
following constraints:
1
1n
iji j
b= +
=∑ , (4.3)
0,ijb i j≥ ∀ > . (4.4)
In addition to (4.3) and (4.4) fractional rate of breakage is nonnegative as long as
we consider comminution (no agglomeration) process and therefore we have extra
constraints
0, 1, 1ik i n≥ ∀ = − , (4.5)
0,ik i n= = . (4.6)
38
Constraint (4.6) reflects the fact that there is no size reduction in the finest class
number n . Thus, the problem of determining the parameters in system (4.1) is reduced to
finding the minimum of function (4.2) subject to the set of constraints (4.3)-(4.6). These
sets of equations make up the backbone of any PBM. This set of equations is known as a
nonlinear model subject to linear constraints. Being nonlinear it means that no exact
solution exist, however, many authors have solved this set of equations for there specific
systems and applied there own fitting parameters.57, 61, 65, 66, 69, 82
In this study we will use the population balance to describe the breakage
mechanism taking place during the milling process.83 By inspection of the bij, the
breakage distribution function it is possible to distinguish between an attrition, fracture,
or cleavage mechanism. Most PBM used today are in the form listed above. The novelty
in a PBM solutions exist in the method used to solve and optimize the equations listed
above (solving equations of the form 4.2). Instead of using the least squares fit
approximation listed above, eq 4.2, for solving eq.4.1, in our study we will obtain an
approximate solution to equation 4.1 through the use of Kapur’s G-H method.84 Kapur
twice applied a Cauchy-Picard iteration to arrive at the eqs 4.7, 4.8:
( ) ( )2exp 20 tHtGqtq iiii += (4.7)
( ) ijjijjij
i
j i
jijiji
i
j i
jijii BkBk
GGHqq
kG −=−=+−= ++
−
=
−
=∑∑ 11
1
1 0
01
1 0
0 ,, λλλ (4.8)
The G-H method has been found to give comparable data to that of the exact
solution listed above with only a fraction of the computational as well as mathematical
complexity necessary to solve for the exact solution.85 The G-H method has also been
shown to give accurate data at long grinding times.86 For most milling experiments it has
39
been found that only one term is needed to describe the process (Hi=0). Due to the
extended grinding times used in this study we will use Kapur’s original two term model.
The particle size range in this study is divided into nine classes that were
arranged in geometric progression of 2 , beginning with 344 nm as the lower edge of
the largest size class (i=1).87 Size class 9 (+9~30 nm) represents the smallest class or sink
where no particles can be broken out of that size class.87 For each size class, qi(t) was
generated using the particle size distribution data at pre-selected sampling times. Then,
the model (Eq.(4.7)) was fitted to the experimental data to find the values of Gi and Hi
and to check the applicability of the first-order breakage kinetics. The model fit was
carried out with Matlab 6.1 subroutine LSQCURVEFIT that utilizes the Marquardt–
Levenberg optimization algorithm.
4.2 Experimental Findings by Population Balance Modeling
Kapur’s G–H model in Eq. (4.7) was used to fit the experimental data sequentially
from size class 1 to class 9. Table 4.1 lists Kapur’s G and H parameters for their
respective size classes. A graphical representation of the fit to the experimental data can
be seen in fig. 4.1. The sum-of-squared residuals and the standard error of the estimate
were found to be 0.1304 and 0.0441. The G–H model explains the temporal variation of
the cumulative volume fraction oversize well for the size range +86–578 nm. However,
the model deviates from the experimental data for the size range +30–86 nm, as can be
inferred from the standard error of the estimates in Table 4.1. The inverse of the first
Kapur coefficient Gi–1 as seen in table 4.1 may be regarded as a characteristic time
constant for a given size class. From the characteristic time constant it can be seen that to
mill to finer sizes (G9) the time constant is larger than the time constant at G1.
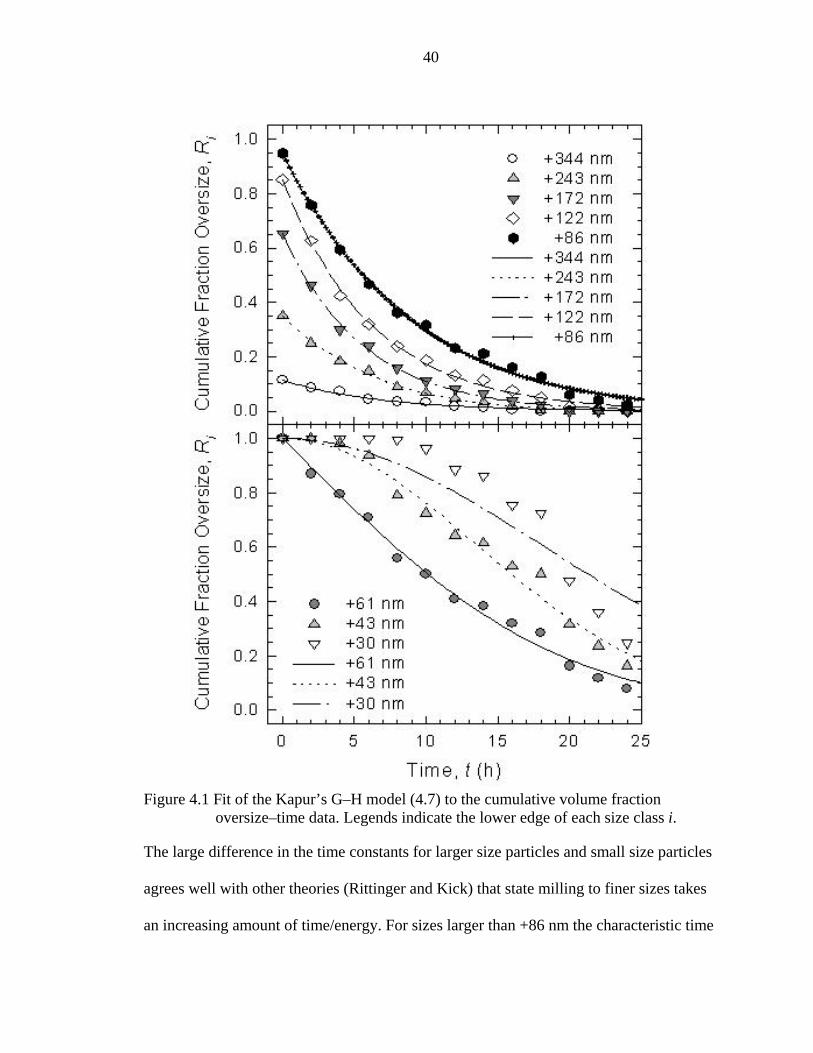
40
Figure 4.1 Fit of the Kapur’s G–H model (4.7) to the cumulative volume fraction
oversize–time data. Legends indicate the lower edge of each size class i.
The large difference in the time constants for larger size particles and small size particles
agrees well with other theories (Rittinger and Kick) that state milling to finer sizes takes
an increasing amount of time/energy. For sizes larger than +86 nm the characteristic time
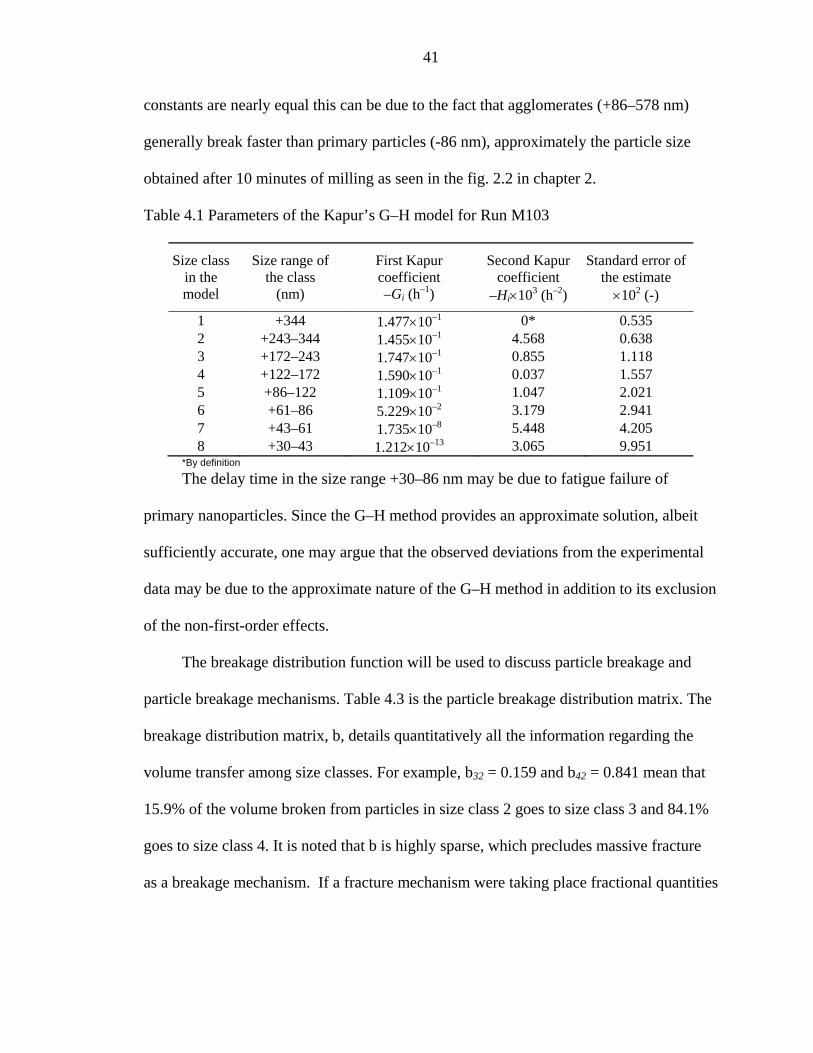
41
constants are nearly equal this can be due to the fact that agglomerates (+86–578 nm)
generally break faster than primary particles (-86 nm), approximately the particle size
obtained after 10 minutes of milling as seen in the fig. 2.2 in chapter 2.
Table 4.1 Parameters of the Kapur’s G–H model for Run M103
Size class in the model
Size range of the class
(nm)
First Kapur coefficient –Gi (h–1)
Second Kapur coefficient
–Hi×103 (h–2)
Standard error of the estimate
×102 (-)
1 +344 1.477×10⁻¹ 0* 0.535 2 +243–344 1.455×10⁻¹ 4.568 0.638 3 +172–243 1.747×10⁻¹ 0.855 1.118 4 +122–172 1.590×10⁻¹ 0.037 1.557 5 +86–122 1.109×10⁻¹ 1.047 2.021 6 +61–86 5.229×10⁻² 3.179 2.941 7 +43–61 1.735×10⁻⁸ 5.448 4.205 8 +30–43 1.212×10⁻¹³ 3.065 9.951
*By definition
The delay time in the size range +30–86 nm may be due to fatigue failure of
primary nanoparticles. Since the G–H method provides an approximate solution, albeit
sufficiently accurate, one may argue that the observed deviations from the experimental
data may be due to the approximate nature of the G–H method in addition to its exclusion
of the non-first-order effects.
The breakage distribution function will be used to discuss particle breakage and
particle breakage mechanisms. Table 4.3 is the particle breakage distribution matrix. The
breakage distribution matrix, b, details quantitatively all the information regarding the
volume transfer among size classes. For example, b32 = 0.159 and b42 = 0.841 mean that
15.9% of the volume broken from particles in size class 2 goes to size class 3 and 84.1%
goes to size class 4. It is noted that b is highly sparse, which precludes massive fracture
as a breakage mechanism. If a fracture mechanism were taking place fractional quantities

42
would be present throughout the table (all values above the 00 diagonal must be 0 due to
the initial assumption that no agglomeration is taking place).
Table 4.2 The breakage distribution matrix for size class 1 through 9 form top to bottom and left to right (b6,3= 0.958)
If an attrition mechanism were the mechanism of breakage, particles would break
from size class 1 to one of the finest size class such as 6-8 (particle sizes of 344 nm
would break to 86-30 nm). Parent particles mainly break into daughter particles in a few
size classes. Thus, cleavage of agglomerates and primary particles appear to be the
dominant breakage mechanism. Primary particles in size classes 6–8 break into daughter
particles in adjacent size classes. The data above proves quantitatively that a cleavage
mechanism is the dominant mechanism of breakage throughout the milling process for
the base case experiments. From fracture mechanics it is known that ductile materials will
tend to fracture through a cleavage mechanism and that a cleavage mechanism most
commonly occur from a tensile loading of material which would evolve from a shear
mechanism of milling.
⎥⎥⎥⎥⎥⎥⎥⎥⎥⎥⎥⎥
⎦
⎤
⎢⎢⎢⎢⎢⎢⎢⎢⎢⎢⎢⎢
⎣
⎡
=
10.10.00.00.00.00.00.00.00000.10.00.00.00.00.00.000000.10.00.0019.00.00.0000000.10.0958.00.00.00000000.1023.00.00.000000000.0841.00.000000000159.00.10000000000.00000000000
b

43
The population balance model also explains how fast particles of a specific size
class break, this is known as the breakage rate or selection function. Table 4.3gives the
selection function for this experiment. It is difficult to consider the value of the selection
function having a physical or real meaning, due to it not being defined. Comparing
selection functions of different experiments may not be possible.
Table 4.3. Selection function for experiment M103 population balance model
However, comparison of selection functions with in a set of data is possible. The
selection functions in Table 4.3 are all of the same order of magnitude and the values do
not vary much. This would indicate that the rate of breakage is linear with time, however,
in chapter 3 it was shown that the rate breakage in non-linear and Rittinger’s law also
states the rate of breakage should decrease exponentially with particle size. It may be
possible to correct the population balance model by introducing a time-variant selection
function, leading to more reliable breakage rates.
[ ] ( )1h0193.0184.0229.0198.0238.0293.0173.0152.0 −=ik
44
CHAPTER 5 SUMMARY, CONCLUSIONS AND FUTURE WORK
5.1 Summary
This study’s objectives were to determine the effects of surfactant concentration,
media loading, and media size on the rate and fineness of the ground product. Additional
objectives of this study were to determine the particle breakage mechanism and the most
probable milling mechanism.
The experiments performed at varying surfactant concentration showed that at no
surfactant concentration the particle size increased as milling time increased. The
experiments also showed that as surfactant concentration increased the rate of particle
size reduction decreased. However, increasing surfactant concentration did not appear to
have an affect on the fineness of the final product. In order to optimize the rate of particle
size reduction with respect to surfactant concentration it may be necessary to add the
surfactant as the milling process progresses in order to match the increase in surface area
as the particle size decreases.
As media concentration increased the rate of particle size reduction increased; this
is due to the increase in bead-bead collisions. When no media was present the mill
dispersed the pigment to the primary particle size of 150 nm. Experiments at high media
concentration where a shear mechanism of mill should have been dominant were unable
to determine difference between a shear and impaction mechanism of milling.
Varying media size was shown to affect the fineness of product material and the
rate of particle size reduction. It was observed that the smallest media was only able to
45
disperse the pigment particles to their primary particle size and was not able to reduce the
particle size. This was due to the media not having sufficient force to cause the particles
to break. Experiment with the largest media size, showed that the rate of particle size
reduction was reduced. This was attributed to the reduction in the number of grinding
media and the number of bead-bead collisions due to the increase in grinding media size.
The final particle size obtained for the largest media was less after 24 hours due to the
slow rate of particle size reduction, however, if milling time was increased this
experiment should give a finer particle size due to the larger amount of force exerted by
the larger grinding media. The rate of particle size reduction was the most rapid for the
for the 21 micron media due to the fact that it had the highest number of bead-bead
collisions with sufficient force to cause the particles to break. The final particle size
obtained for the 21 and 40 micron media were approximately the same showing that the
force that the media exerted on the pigment particles was equivalent.
Particle breakage mechanisms were determined through inspection of the graphical
particle size distribution data and interpretation of the breakage distribution function
obtained from the population balance model. The PSD data from the base case
experiment proved that an attrition mechanism of breakage was not taking place. From
the PBM breakage distribution function we were able to quantitatively determine into
what size class a mother particle broke into. From this we were able to show that
cleavage of particles was the dominant mechanism of breakage. The PBM also showed
that the rate of particle size reduction became nonlinear at extended grinding time.
5.2 Conclusions
This study proved that we were capable of reducing agglomerate pigment particles
of greater that 344 nm in size to particles of less than 10 nm in a stirred media milling
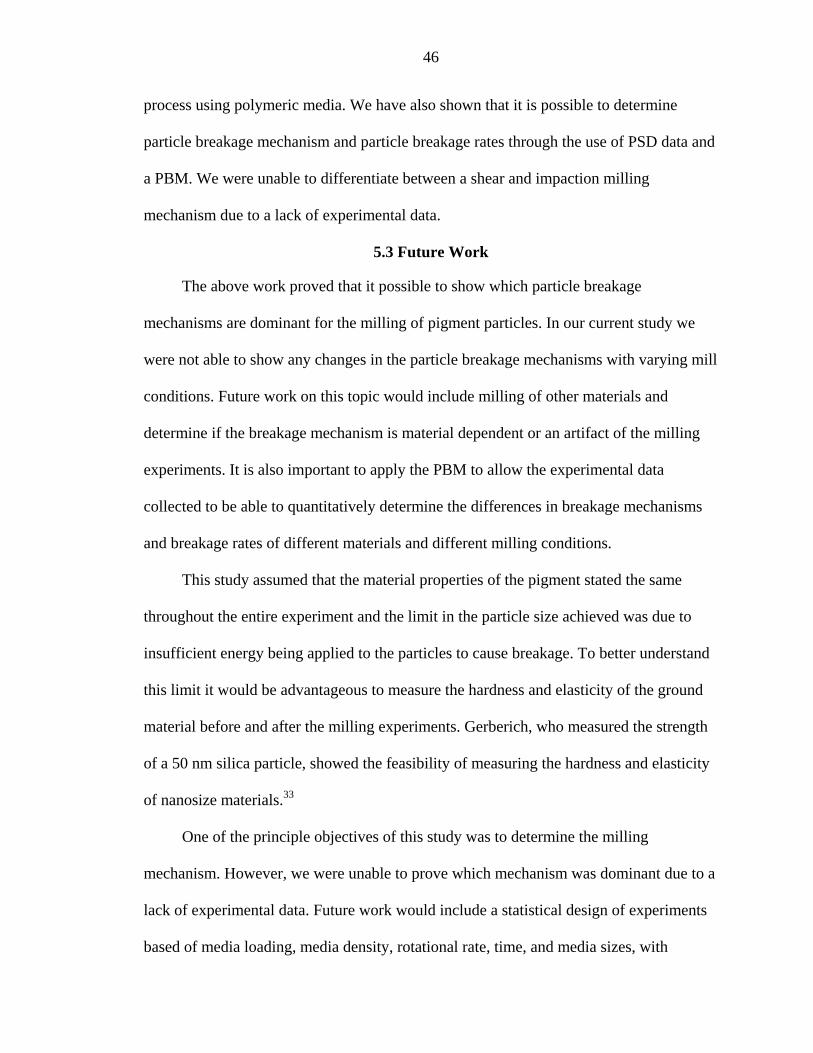
46
process using polymeric media. We have also shown that it is possible to determine
particle breakage mechanism and particle breakage rates through the use of PSD data and
a PBM. We were unable to differentiate between a shear and impaction milling
mechanism due to a lack of experimental data.
5.3 Future Work
The above work proved that it possible to show which particle breakage
mechanisms are dominant for the milling of pigment particles. In our current study we
were not able to show any changes in the particle breakage mechanisms with varying mill
conditions. Future work on this topic would include milling of other materials and
determine if the breakage mechanism is material dependent or an artifact of the milling
experiments. It is also important to apply the PBM to allow the experimental data
collected to be able to quantitatively determine the differences in breakage mechanisms
and breakage rates of different materials and different milling conditions.
This study assumed that the material properties of the pigment stated the same
throughout the entire experiment and the limit in the particle size achieved was due to
insufficient energy being applied to the particles to cause breakage. To better understand
this limit it would be advantageous to measure the hardness and elasticity of the ground
material before and after the milling experiments. Gerberich, who measured the strength
of a 50 nm silica particle, showed the feasibility of measuring the hardness and elasticity
of nanosize materials.33
One of the principle objectives of this study was to determine the milling
mechanism. However, we were unable to prove which mechanism was dominant due to a
lack of experimental data. Future work would include a statistical design of experiments
based of media loading, media density, rotational rate, time, and media sizes, with
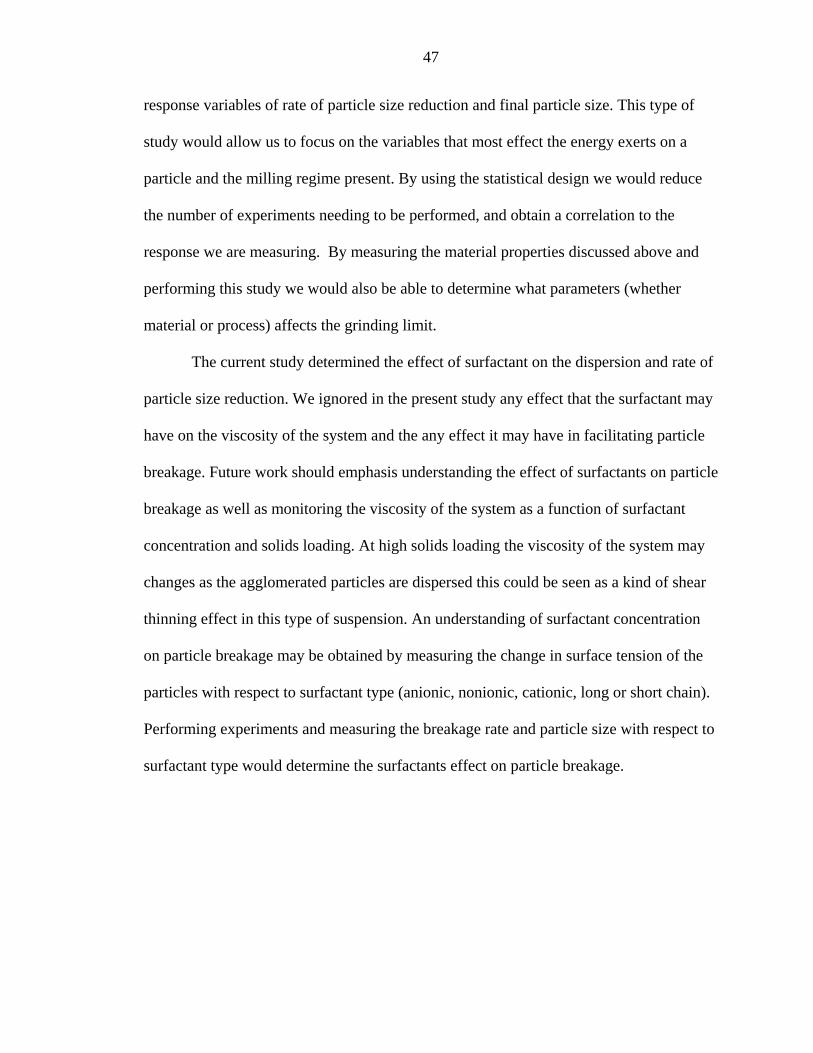
47
response variables of rate of particle size reduction and final particle size. This type of
study would allow us to focus on the variables that most effect the energy exerts on a
particle and the milling regime present. By using the statistical design we would reduce
the number of experiments needing to be performed, and obtain a correlation to the
response we are measuring. By measuring the material properties discussed above and
performing this study we would also be able to determine what parameters (whether
material or process) affects the grinding limit.
The current study determined the effect of surfactant on the dispersion and rate of
particle size reduction. We ignored in the present study any effect that the surfactant may
have on the viscosity of the system and the any effect it may have in facilitating particle
breakage. Future work should emphasis understanding the effect of surfactants on particle
breakage as well as monitoring the viscosity of the system as a function of surfactant
concentration and solids loading. At high solids loading the viscosity of the system may
changes as the agglomerated particles are dispersed this could be seen as a kind of shear
thinning effect in this type of suspension. An understanding of surfactant concentration
on particle breakage may be obtained by measuring the change in surface tension of the
particles with respect to surfactant type (anionic, nonionic, cationic, long or short chain).
Performing experiments and measuring the breakage rate and particle size with respect to
surfactant type would determine the surfactants effect on particle breakage.
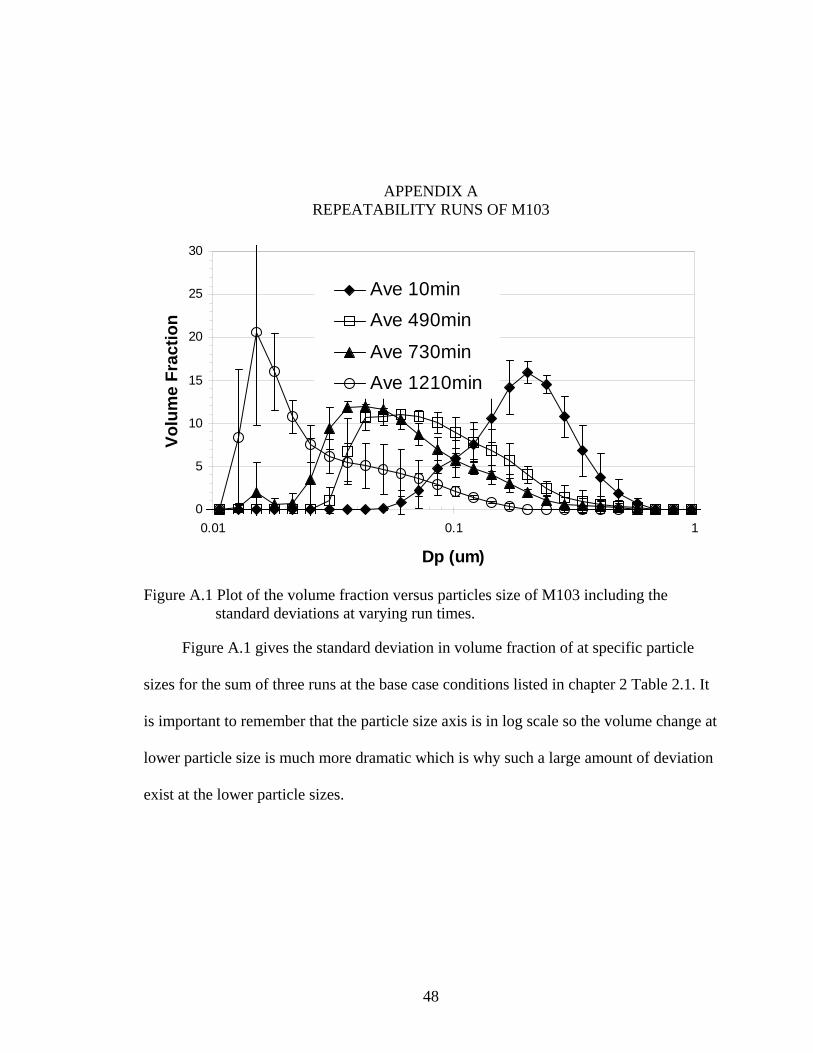
48
APPENDIX A REPEATABILITY RUNS OF M103
Figure A.1 Plot of the volume fraction versus particles size of M103 including the standard deviations at varying run times.
Figure A.1 gives the standard deviation in volume fraction of at specific particle
sizes for the sum of three runs at the base case conditions listed in chapter 2 Table 2.1. It
is important to remember that the particle size axis is in log scale so the volume change at
lower particle size is much more dramatic which is why such a large amount of deviation
exist at the lower particle sizes.
0
5
10
15
20
25
30
0.01 0.1 1
Dp (um)
Volu
me
Frac
tion
Ave 10minAve 490min
Ave 730minAve 1210min
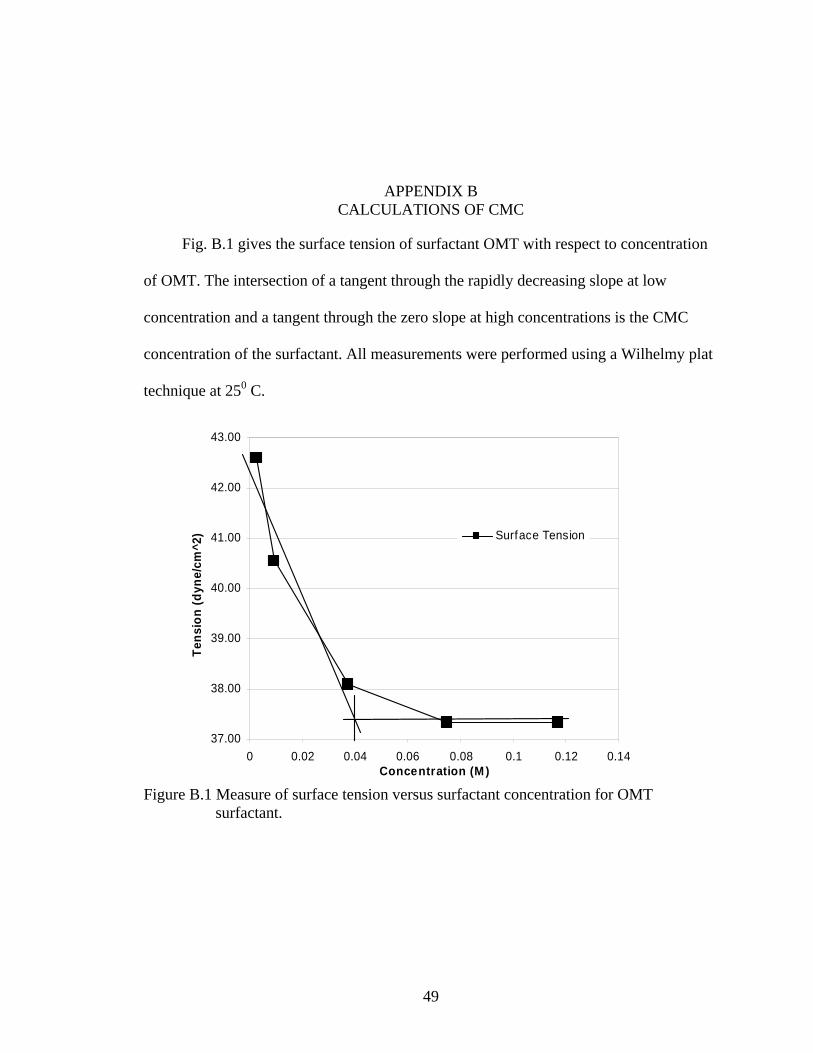
49
APPENDIX B CALCULATIONS OF CMC
Fig. B.1 gives the surface tension of surfactant OMT with respect to concentration
of OMT. The intersection of a tangent through the rapidly decreasing slope at low
concentration and a tangent through the zero slope at high concentrations is the CMC
concentration of the surfactant. All measurements were performed using a Wilhelmy plat
technique at 250 C.
Figure B.1 Measure of surface tension versus surfactant concentration for OMT surfactant.
37.00
38.00
39.00
40.00
41.00
42.00
43.00
0 0.02 0.04 0.06 0.08 0.1 0.12 0.14Concentration (M)
Tens
ion
(dyn
e/cm
^2) Surface Tension
50
LIST OF REFERENCES
1. Czekai A.D., Seaman L.P., inventor Eastman Kodak Co., assignee. Comminution with Small Particle Milling Media. U.S. Pat. 5500331 patent U.S. Pat. 5500331. 1996.
2. Czekai A.D., Seaman L.P., Smith, D.E., inventor Eastman Kodak Co., assignee. Process for Milling and Media. U.S.Pat. 5662279 patent U.S. Pat. 5662279. 1997.
3. Merisko-Liversidge E, Liversidge G.G., Cooper E.R. Nanosizing: A Formulation Approach for Poorly-Water-Soluble Compounds. European Journal of Pharmaceutical Sciences 2003;18(2):113-120.
4. Lee J. Drug Nano- and Microparticles Processed into Solid Dosage Forms: Physical Properties. Journal of Pharmaceutical Sciences 2003;92(10):2057-2068.
5. Liversidge G.G., Cundy K.C., Particle-Size Reduction for Improvement of Oral Bioavailability of Hydrophobic Drugs .1. Absolute Oral Bioavailability of Nanocrystalline Danazol in Beagle Dogs. International Journal of Pharmaceutics 1995;125(1):91-97.
6. Mendel J.B., Particle Generation and Ink Particle Size Effects in Pigmented Inkjet Inks - part 1. J. Nanopart. Res., 1999;1:419.
7. Mendel J.B., Bermel, A.D., Particle Generation and Ink Particle Size Effects in Pigmented Inkjet Inks - part 2. J. Nanopart. Res. 1999;1:421-424.
8. Hyeon T., Chemical Synthesis of Magnetic Nanoparticles. The Royal Society of Chemistry 2002:927-934.
9. Zhu W.P., Pratsinis S.E., Flame Synthesis of Nano-size Powders. In ACS Symposium series 622, Nanotechnology. Washington: American Chemical Society 1996.
10. Mather R.R. The Degree of Crystal Aggregation in Organic Pigments. Dyes and Pigments 1999;42(1):103-106.
11. Mather R.R., Evaluation by Nitrogen Adsorption of Crystal Aggregation in Organic Pigments. Dyes and Pigments 2000;47(1-2):17-21.
12. Kammerler H.M., Pratsinis, S.E., Flame Synthesis of Nanoparticles. Chemical Engineering Technology 2001;24(6):583-596.
51
13. Hashi Y.S., Grinding Efficiency of an Agitation-Beads Mill (1). Micromeretic 1990:732-737. Translated by N. Nagouchi 2005
14. Mende S., Stenger F., Peukert W., Schwedes J., Mechanical Production and Stabilization of Submicron Particles in Stirred Media Mills. Powder Technology 2003;132(1):64-73.
15. Mende S., Stenger F., Peukert W., Schwedes J., Production of Sub-micron Particles by Wet Comminution in Stirred Media Mills. Journal of Materials Science 2004;39(16-17):5223-5226.
16. Tanaka T., Optimum Design for Fine and Ultrafine Grinding Mechanisms Using Grinding Media. KONA 1995;13:19-24.
17. Jankovic A., Variables Affecting the Fine Grinding of Minerals Using Stirred Mills. Minerals Engineering 2003;16(4):337-345.
18. Kwade A.,Schwedes J., Wet Comminution in Strirred Media Mills. KONA 1997;52:91-101.
19. Kwade A., Wet Comminution in Stirred Media Mills - Research and its Practical Application. Powder Technology 1999;105(1-3):14-20.
20. Salman AD, Gorham DA. The Fracture of Glass Spheres. Powder Technology 2000;107(1-2):179-185.
21. Shipway P.H., Hutchings I.M., Attrition of Brittle Spheres by Fracture under Compression and Impact Loading. Powder Technology 1993;76(1):23-30.
22. Ghadiri M, Zhang Z., Impact Attrition of Particulate Solids. Part 1: A Theoretical Model of Chipping. Chemical Engineering Science 2002;57(17):3659-3669.
23. Bemrose C.R., Bridgwater J., A Review of Attrition and Attrition Test Methods. Powder Technology 1987;49(2):97-126.
24. Zhang Z., Ghadiri M., Impact Attrition of Particulate Solids. Part 2: Experimental Work. Chemical Engineering Science 2002;57(17):3671-3686.
25. Prasher C.L., Crushing and Grinding Process Handbook: wiley; 1987.
26. Rumpf H., Particle Technology: Chapman and Hall; 1990. Translated by A. Bull
27. Schönert K.U., H. Kleman, In: Proceedings of the 2nd International Conference of Fracture; 1969; Brighton, England; 1969. p. 474-482.
28. Cho H.C., Austin L.G., An Equation for the Breakage of Particles under Impact. Powder Technology 2003;132(2-3):161-166.

52
29. Schonert K., About the Particle Breakage and the Possibities and Limits for Improving Size-Reduction Processes. In: The International Symposium on Powder Technology; 1981; Kyoto, Japan: Powder Technology; 1981.
30. Kendall K., Impossibility of Comminuting Small Particles by Compression. Nature 1978;272(5655):710-711.
31. Weertman J.R., MRS Bulletin Physic Society B 1955:68.
32. Gerberich W.W., Dauskardt R.H., Fracture Nanomechanics - Preface. International Journal of Fracture 2003;119(4-2)
33. Gerberich W.W., Mook W.M., Perrey C.R., Carter C.B., Baskes M.I., Mukherjee R., Superhard Silicon Nanospheres. Journal of the Mechanics and Physics of Solids 2003;51(6):979-992.
34. Griffith A.A., The Phenomena of Rupture and Flow in Solids. Philosophical Transactions of the Royal Society A 1921;221:163-198.
35. Roesler F.C., Brittle Fractures near Equilibrium. Proceedings of the Physical Society of London Section B 1956;69(10):981
36. Roesler F.C., Indentation Hardness of Glass as an Energy Scaling Law. Proceedings of the Physical Society of London Section B 1956;69(1):55-60.
37. Reid K.J., A Solution to Batch Grinding Equation. Chemical Engineering Science 1965;20(11):953
38. Broadbent R.A., Callcott T.G., Coal Breakage Processes: 2. A Matrix Representation of Breakage. Journal of Institute of Fuel 1956;29:528-539.
39. Cheong Y.S., Salman A.D., Hounslow M.J., Effect of Impact Angle and Velocity on the Fragment Size Distribution of Glass Spheres. Powder Technology 2003;138(2-3):189-200.
40. Klimpel R.R., Austin L.G., Chemical Additives for Wet Grinding of Minerals. Powder Technology 1982;31(2):239-253.
41. Rebinder P.A., Shchunkin E.D., Surface Phenomena in Solids During the Course of their Deformation and Failure. Soviet Physics Uspekhi 1973:533-669.
42. Hochberg S., inventor Process For Dispersing Pigments In Film-Forming Materials. USA patent 2581414. 1948.
43. Klimpel R.R., The Selection of Wet Grinding Cemical Additives Based on Slurry Rheology Control. Powder Technology 1999;105(1-3):430-435.
53
44. Frances C., Laguerie C., Mazzarotta B., Veccia T., On the Analysis of Fine Wet Grinding in a Batch Ball Mill. Chemical Engineering Journal 1996;63(3):141-147.
45. Fuerstenau D.W., Grinding Aids. KONA 1995;13:5-17.
46. Bernhardt C., Reinsch E., Husemann K., The Influence of Suspension Properties on Ultra-fine Grinding in Stirred Ball Mills. Powder Technology 1999;105(1-3):357-361.
47. El-Shall H.E., Chemical Additives in a Grinding Process. New York: Columbia; 1980.
48. Kwade A., Blecher L., Schwedes J., Motion and Stress Intensity of Grinding Beads in a Stirred Media Mill .2. Stress Intensity and its Effect on Comminution. Powder Technology 1996;86(1):69-76.
49. Hashi Y., Senna M., Grinding Efficiency of an Agitation-Beads Mill (2). Micromeretic 1990:726-731. Translated by N. Naguchi 2005
50. Jankovic A., Media Stress Intensity Analysis for Vertical Stirred Mills. Minerals Engineering 2001;14(10):1177-1186.
51. Zheng J., Harris C.C., Somasundaran P., A Study on Grinding and Energy Input in Stirred Media Mills. Powder Technology 1996;86(2):171-178.
52. Blecher L., Kwade A., Schwedes J., Motion and Stress Intensity of Grinding Beads in a Stirred Media Mill .1. Energy Density Distribution and Motion of Single Grinding Beads. Powder Technology 1996;86(1):59-68.
53. Hashi Y., Senna M., Motion of Grinding Media in Axial Direction and its Effect on Comminution in an Agitation Bead Mill. KONA 1996;14:176-181.
54. Herbst J.A., Lo Y.C., Financial Implications of Comminution System Optimization. International Journal of Mineral Processing 1996;44-5:209-221.
55. De Castro C.L., Mitchell B.S., The Use of Polymeric Milling Media in the Reduction of Contamination during Mechanical Attrition. Journal of Materials Research 2002;17(12):2997-2999.
56. Vogel L., Peukert W., Breadage Behaviour of Different Materials - Construction of Mastercurve for the Breakage Probability. Powder Technology 2003;129(1-3):101-110.
57. Fuerstenau D.W., Abouzeid A.Z., Effect of Fine Particles on the Kinetics and Energetics of Grinding Coarse Particles. International Journal of Mineral Processing 1991;31(3-4):151-162.
54
58. Choi W.S., Grinding Rate Improvement Using Composite Grinding Balls in an Ultra-fine Grinding Mill. Kinetic Analysis of Grinding. Powder Technology 1998;100(1):78-78.
59. Choi W.S., Chung H.Y., Yoon B.R., Kim S.S., Applications of Grinding Kinetics Analysis to fine Grinding Characteristics of Some Inorganic Materials Using a Composite Grinding Media by Planetary Ball Mill. Powder Technology 2001;115(3):209-214.
60. Tavares L.M., King R.P., Modeling of Particle Fracture by Repeated Impacts Using Continuum Damage Mechanics. Powder Technology 2002;123(2-3):138-146.
61. Verma R., Rajamani R.K., Environment-Dependent Breakage Rates in Ball-Milling. Powder Technology 1995;84(2):127-137.
62. Strazisar J., Runovc F., Kinetics of Comminution in Micro- and Sub-Micrometer Ranges. International Journal of Mineral Processing 1996;44-5:673-682.
63. Austin L.G., Luckie P.T., Methods for Determination of Breakage Distribution Parameters. Powder Technology 1972;5(4):215.
64. Austin L.G., Bagga P., An Analysis of Fine Dry Grinding in Ball Mills. Powder Technology 1981;28(1):83-90.
65. Austin L.G., Shah J., Wang J., Gallagher E., Luckie P.T., An Analysis of Ball-and-Race Milling .1. The Hardgrove Mill. Powder Technology 1981;29(2):263-275.
66. Fuerstenau D.W., Kapur P.C., De A., Modeling Breakage Kinetics in Various Dry Comminution Systems. KONA 2003;21:121-131.
67. Rajamani R.K., Guo D., Acceleration and Deceleration of Breakage Rates in Wet Ball Mills. International Journal of Mineral Processing 1992;34(1-2):103-118.
68. Austin L.G., Introduction to Mathematical Description of Grinding as a Rate Process. Powder Technology 1971;5(1):1.
69. Gao M.W., Forssberg E., Prediction of Product Size Distributions for a Stirred Ball Mill. Powder Technology 1995;84(2):101-106.
70. Nair M., Peirce Z., DiPrima D., inventor Eastman Kodak Company, assignee. Colloidally Stabilized Suspension Process. USA patent 4965131. 1990.
71. Nair M., Peirce Z., Sreekumar, C., inventor Eastman Kodak Company, assignee. Polymeric Powder Having a Predetermined Controlled Size Distrubution. USA patent 4833060. 1989.
55
72. Bilgili E., Hamey R., Scarlett B., Production of Pigment Nanoparticles using a Wet Stirred Mill with Polymeric Media. China Particuology 2004;2(3):93-100.
73. Schliebitz F., Grinding of Pigment Particles to Nanoscale by Media Milling [Diploma thesis]: Technical University of Munich.; 2002.
74. Eskin D., Zhupanska O., Hamey R., Moudgil B., Scarlett B., Microhydrodynamic Analysis of Nanogrinding in Stirred Media Mills. AIChE Journal 2005;51(5):1346-1358.
75. Plantz P., Correlation Among Particle Size Methods. Application Note Microtrac Inc.
76. Filella M.Z., Newman J.M., Jacques B., Analytical Applications of Photon Correlation Spectroscopy for Size Distrubution Measurements of Natural Colloidal Suspensions: Capabilities and Limitations. Colliods and Surfaces A: Physicochemical and Engineering Aspects 1996;120:27-46.
77. Trainer M., Freud P., High-Concentration Submicron Particle Size Distrubution by Dynamic Light Scattering. Application Note Microtrac Inc 2003.
78. Greenwood R., Rowson N., Kingman S., Brown G., A New Method for Determining the Optimum Dispersant Concentration in Aqueous Grinding. Powder Technology 2002;123(2-3):199-207.
79. Hogg R., Dynys A.J., Cho H., Fine Grinding of Aggregated Powders. Powder Technology 2002;122(2-3):122-128.
80. Randolph A.D., Larson M.A., Theory of Particulate Processes. San Diego: Academic Press 1988:72-73.
81. Bass L., Zur Theorie Der Mahlvorgange. Z. Angew. Math. Phys. 1954;5:283-292.
82. Austin LG., A Treatment of Impact Breakage of Particles. Powder Technology 2002;126(1):85-90.
83. Varinot C., Hiltgun S., Pons M.N., Dodds J., Identification of the Fragmentation Mechanisms in Wet-phase Fine Grinding in a Stirred Bead Mill. Chemical Engineering Science 1997;52(20):3605-3612.
84. Kapur P.C., Agrawal P.K., Approximate Solutions to Discretized Batch Grinding Equation. Chemical Engineering Science 1970;25(6):1111.
85. Kapur P.C., Kinetices of Batch Grinding - part B. Trans. AIME 1970(247):309-313.

56
86. Berthiaux H., Varinot C., Dodds J., Approximate Calculation of Breakage Parameters from Batch Grinding Tests. Chemical Engineering Science 1996;51(19):4509-4516.
87. Austin L.G, Shah I., A Method for Inter-Conversion of Microtrac and Sieve Size Distributions. Powder Technology 1983;35(2):271-278.
57
BIOGRAPHICAL SKETCH
Rhye Garrett Hamey was born in Medina, Ohio. He attended Cloverleaf High
School. Following high school he obtained a degree in chemical engineering at The Ohio
State University. While at Ohio State, Rhye attended a class on particle technology
instructed by visiting Professors Brian Scarlett and Brij Moudgil. Through continued
contact with Professor Scarlett, Rhye became interested in particle technology and chose
to pursue a graduate degree at the Engineering Research Center for Particle Technology
at the University of Florida.