production of laccase enzyme using rice husk as...
TRANSCRIPT

PRODUCTION OF LACCASE ENZYME USING RICE HUSK AS SUBSTRATE IN
FUNGAL SOLID-STATE FERMENTATION
ANG TECK NAM
FACULTY OF ENGINEERING UNIVERSITY OF MALAYA
KUALA LUMPUR
2013
PRODUCTION OF LACCASE ENZYME USING
RICE HUSK AS SUBSTRATE IN
FUNGAL SOLID-STATE FERMENTATION
ANG TECK NAM
THESIS SUBMITTED IN FULFILMENT
OF THE REQUIREMENTS
FOR THE DEGREE OF
DOCTOR OF PHILOSOPHY
FACULTY OF ENGINEERING
UNIVERSITY OF MALAYA
KUALA LUMPUR
2013
ii
UNIVERSITY OF MALAYA
ORIGINAL LITERARY WORK DECLARATION
Name of Candidate: Ang Teck Nam (I.C./Passport No: 840325-14-5569)
Registration/Matric. No.: KHA100044
Name of Degree: Doctor of Philosophy
Title of Project/Paper/Research Report/Dissertation/Thesis (“this Work”):
Production of Laccase Enzyme using Rice Husk as Substrate in Fungal Solid-State
Fermentation
Field of Study: Environmental Biotechnology
I do solemnly and sincerely declare that:
(1) I am the sole author/writer of this Work;
(2) This Work is original;
(3) Any use of any work in which copyright exists was done by way of fair dealing
and for permitted purposes and any excerpt or extract from, or reference to or
reproduction of any copyright work has been disclosed expressly and
sufficiently and the title of the Work and its authorship have been acknowledged
in this Work;
(4) I do not have any actual knowledge nor do I ought reasonably to know that the
making of this Work constitutes an infringement of any copyright work;
(5) I hereby assign all and every tights in the copyright to this Work to the
University of Malaya (“UM”), who henceforth shall be owner of the copyright
in this Work and that any reproduction or use in any form or by any means
whatsoever is prohibited without the written consent of UM having been first
had and obtained;
(6) I am fully aware that if in the course of making this Work I have infringed any
copyright whether I intentionally or otherwise, I may be subject to legal action
or any other action as may be determined by UM.
Candidate‟s signature: Date:
Subscribed and solemnly declared before,
Witness‟s signature: Date:
Name:
Designation:
iii
ABSTRAK
Untuk menghasilkan enzim laccase dalam kuantiti yang besar dengan kos yang
berpatutan, satu proses fermentasi keadaan pepejal kulat yang menggunakan produk
sampingan lignoselulosik dari industri perkilangan beras iaitu sekam padi, dan kulat
cendawan Pleurotus sajor-caju telah diperkenalkan dalam kajian penyelidikan ini.
Penyelidikan ini telah menilai semua aspek utama fermentasi keadaan pepejal kulat
untuk penghasilan enzim laccase, termasuk pemilihan dan pengoptimuman keadaan
prarawatan substrat, pemilihan kulat, dan penilaian serta pengoptimuman keadaan
fermentasi.
Kajian sastera menunjukkan bahawa tiada reagen pernah digunakan dalam prarawatan
sekam padi. Oleh hal yang demikian, penyelidikan ini telah mengkaji keberkesanan
pelbagai reagen seperti asid sulfurik, asid hidroklorik, asid fosforik, asid asetik, asid
nitrik, natrium hidroksida, kalsium hidroksida, 1-butil-3-metilimidazolium klorida, 1-
etil-3-metilimidazolium asetat dan 1-etil-3-metilimidazolium dietil fosfat dalam
prarawatan sekam padi. Prarawatan dengan asid hidroklorik cair didapati paling
berkesan, di mana sekam padi yang telah diprarawat mempunyai komposisi kimia dan
struktur yang sesuai untuk fermentasi keadaan pepejal kulat. Kemudian, prarawatan
dengan asid hidroklorik cair telah dioptimumkan. Keputusan pengoptimuman
menunjukkan bahawa prarawatan hanya perlu dijalankan dalam keadaan sederhana,
iaitu pada suhu 125oC selama 1.5 jam dengan menggunakan 0.5% (jisim/isipadu) asid
sahaja.
Selepas itu, pemilihan kulat yang mempunyai aktiviti enzim ligninolitik yang tinggi
telah dijalankan. Aktiviti enzim ligninolitik yang dihasilkan oleh tiga kulat, iaitu

iv
Pycnoporus sanguineus, Phlebia radiata dan Pleurotus sajor-caju telah dikaji pada
suhu bilik dan 35oC dengan menggunakan piring agar skrining yang mengandungi
kromogen seperti guaiacol dan Remazol brilliant blue-R (RBB-R). Semua kulat telah
menunjukkan aktiviti pengoksidaan guaiacol dan penyahwarna RBB-R. Namun begitu,
hanya P. sajor-caju menunjukkan aktiviti pada kedua-dua suhu bilik dan 35oC. Oleh itu,
P. sajor-caju telah dipilih untuk digunakan dalam fermentasi keadaan pepejal kulat
yang berikutnya.
Penyelidikan ini juga mengkaji kaedah penyediaan inokulum kulat, di mana teknik
kultur selofan telah dicipta. Teknik ini telah disahkan dapat menyediakan inokulum
kulat yang aktif dan sesuai untuk digunakan dalam fermentasi keadaan pepejal.
Kemudian, sekam padi yang telah diprarawat dan inokulum P. sajor-caju yang
disediakan dengan teknik kultur selofan telah digunakan dalam fermentasi keadaan
pepejal untuk penghasilan enzim laccase. Keputusan yang diperolehi dari fermentasi
menunjukkan bahawa 84 jam fermentasi, 0.5 mM kuprum sulfat, 10 g/L glukosa, dan
0.1 g/L Tween 80 merupakan keadaan optimum bagi penghasilan enzim laccase. Di
samping itu, penghasilan enzim laccase dalam keadaan optimum dapat diramalkan
dengan menggunakan model logistik. Model tersebut dapat mensimulasi fasa
peningkatan dalam penghasilan enzim. Pencirian enzim laccase yang dihasilkan dalam
fermentasi telah dijalankan dan didapati bahawa enzim tersebut mempunyai jisim
molekul sebanyak 60 kDa, dan ia berkeupayaan untuk menguraikan 2,2'-azino-bis(3-
etilbenzothiazolin)-6-sulfonik asid (ABTS), 2,6-dimethoxyphenol (DMP) dan guaiacol.
Hasil kajian penyelidikan ini menunjukkan bahawa penghasilan enzim laccase melalui
proses fermentasi keadaan pepejal kulat memberi prestasi yang lebih baik berbanding
dengan proses fermentasi yang lain. Penggunaan sekam padi dalam proses fermentasi

v
dapat mengurangkan sisa pepejal yang dihasilkan dari industri perkilangan beras, di
samping menghasilkan enzim laccase yang mempunyai banyak aplikasi industri.
Keputusan positif yang diperolehi dalam kajian penyelidikan ini menunjukkan bahawa
proses fermentasi keadaan pepejal kulat untuk penghasilan enzim laccase berpotensi
untuk dilaksanakan di skala industri.
vi
ABSTRACT
To produce laccase enzyme in large volume at affordable prices, a fungal solid-state
fermentation (SSF) process that uses lignocellulosic by-product from rice milling
industry – rice husk was introduced. This research aims to provide deeper insights into
major aspects of fungal solid-state fermentation from the selection and pretreatment of
solid substrate, selection of fungi to assessment and optimization of the process
parameters. The research assesses all the mentioned aspects of solid-state fermentation
for the production of laccase enzyme using the oyster mushroom Pleurotus sajor-caju.
No pretreatment reagent has been reported effective for pretreating rice husk, the
research thus reports on various reagents, which include sulphuric acid, hydrochloric
acid, phosphoric acid, acetic acid, nitric acid, sodium hydroxide, calcium hydroxide, 1-
butyl-3-methylimidazolium chloride, 1-ethyl-3-methylimidazolium acetate and 1-ethyl-
3-methylimidazolium diethyl phosphate on the pretreatment of rice husk. Dilute
hydrochloric acid pretreatment was found to be most effective for pretreating rice husk
by showing desirable chemical and structural characteristics that are favourable for
fungal solid-state fermentation. The dilute hydrochloric acid pretreatment was further
optimized, and the result showing a relatively mild pretreatment condition of 0.5%
(w/v) acid loading, 125oC, and 1.5 hours.
The screening and selection of fungi with ligninolytic enzyme activity was conducted
on three pre-selected fungi, namely Pycnoporus sanguineus, Phlebia radiata, and
Pleurotus sajor-caju, and the selection was done using screening plates containing
chromogens like guaiacol and Remazol brilliant blue-R (RBB-R). Despite all the fungi
possessed guaiacol oxidation and RBB-R decolourization activities, P. sajor-caju
vii
outperformed the other fungi with activities shown at both room temperature and 35oC.
Therefore, P. sajor-caju was selected for the subsequent fungal solid-state fermentation.
Prior to solid-state fermentation, an improved fungal inoculum preparation method –
cellophane film culture (CFC) technique was developed in this study to overcome the
limitations of the existing fungal inoculum preparation methods. This method was
verified and validated to be able to produce actively growing fungal inoculum and it is
feasible to be used in solid-state fermentation. With the pretreated rice husk and P.
sajor-caju inoculum prepared using cellophane film culture (CFC) technique, the fungal
solid-state fermentation was optimized, and the optimal fermentation condition was at
84 hours fermentation, 0.5 mM copper sulphate, 10 g/L glucose, and 0.1 g/L Tween 80.
Laccase production at the optimized fermentation condition fits well into the logistic
model. The model is thus used to simulate the increasing phase of laccase enzyme
production. The characterization of laccase enzyme shows that the enzyme has a
molecular mass of 60 kDa, and it possesses the ability to degrade 2,2‟-azino-bis (3-
ethylbenzothiazoline)-6-sulphonic acid (ABTS), 2,6-dimethoxyphenol (DMP) and
guaiacol.
The research findings demonstrated that the described solid-state fermentation process
for laccase production shown comparatively well performance to reported studies.
Besides minimizing the „waste‟ generated from rice crops, rice husk can be transformed
into added-value enzyme that has useful applications in the industries. This signifies the
potential of up-scaling the solid-state fermentation for the production of laccase.

viii
ACKNOWLEDGEMENTS
Thanks to Father God for His blessings and guidance along the way of my postgraduate
studies.
Thanks to my beloved family for their understanding, encouragement and moral support
without fail during the course of my research.
Thanks to my supervisors, Dr Ngoh Gek Cheng and Dr Adeline Chua Seak May, for
their invaluable support and brilliant ideas throughout my candidacy.
Thanks to all my invaluable lab mates and friends for their patience, friendship, opinion
and help directly or indirectly in my research project and dissertation writing.
Thanks to all the lab assistants and technicians in the Department of Chemical
Engineering, University of Malaya, for giving their helping hands in my research.
Thanks to Ng Trading Company in Sekinchan, Selangor, Malaysia for providing the
rice husk sample.
Last but not least, thanks to University of Malaya for providing the scholarship and the
Institute of Research Management and Monitoring (IPPP) for providing research grants
(FS226-2008A, PS059/2009A, RG006/09AET and PS161/2010A).
ix
TABLE OF CONTENTS
Page
ORIGINAL LITERARY WORK DECLARATION ii
ABSTRAK iii
ABSTRACT vi
ACKNOWLEDGEMENTS viii
TABLE OF CONTENTS ix
LIST OF FIGURES xiv
LIST OF TABLES xviii
LIST OF SYMBOLS AND ABBREVIATIONS xx
LIST OF APPENDICES xxiv
1.0 INTRODUCTION 1
1.1 Research Overview 1
1.2 Research Background 1
1.2.1 Lignocellulosic Biomass in Bioconversion 1
1.2.2 Fungal Fermentation in Enzyme Production 2
1.3 Research Objectives 3
1.4 Scopes of Study 5
1.5 Structure of Dissertation 6
2.0 LITERATURE REVIEW 8
2.1 Solid-State Fermentation 8
2.1.1 Laccase Enzyme and its Production 11
2.2 Major Aspects of Solid-State Fermentation 13
2.2.1 Selection of Fungi 14
2.2.1.1 Fungi with Ligninolytic Activity 14

x
2.2.1.2 Screening of Fungi 16
2.2.1.3 Inoculum Preparation 18
2.2.2 Selection of Substrate 19
2.2.2.1 Lignocellulosic Biomass 20
2.2.2.1.1 Rice Husk 22
2.2.2.2 Characterization of Lignocellulosic Biomass 23
2.2.2.3 Pretreatment of Lignocellulosic Biomass 25
2.2.2.3.1 Conventional Pretreatment Methods 26
2.2.2.3.2 Non-Conventional Pretreatment Methods 27
2.2.3 Optimization of Process Parameters 30
2.2.3.1 Process Parameters 31
2.2.4 Isolation and Purification of Products 38
2.3 Modelling of Solid-State Fermentation 38
3.0 MATERIALS AND METHODS 45
3.1 Characterization of Rice Husk 45
3.1.1 Preparation of Rice Husk Sample 45
3.1.2 Determination of Moisture Content 45
3.1.3 Determination of Ash Content 46
3.1.4 Determination of Acid-Detergent Fibre and H2SO4 Lignin Contents 46
3.1.5 Determination of Neutral-Detergent Fibre Content 48
3.2 Pretreatment of Rice Husk 50
3.2.1 Pretreatment Reagents 50
3.2.2 Screening of Pretreatment Reagents 51
3.2.2.1 Chemical Pretreatment 51
3.2.2.2 Ionic Liquid Dissolution Pretreatment 52
3.2.3 Optimization of Pretreatment 53

xi
3.2.4 Analytical Methods 54
3.2.4.1 3, 5-dinitrosalicylic acid (DNS) Test 54
3.2.4.2 Fourier Transform-Infrared (FT-IR) Spectroscopy 55
3.2.4.3 X-Ray Diffraction (XRD) 55
3.2.4.4 Scanning Electron Microscopy (SEM) 56
3.2.4.5 Brunauer, Emmett and Teller (BET) Surface Area Determination 56
3.2.5 Statistical Analysis 57
3.3 Selection of Fungus with Ligninolytic Activity 58
3.3.1 Fungal Strains 58
3.3.2 Preparation of Media 58
3.3.3 Screening of Fungal Ligninolytic Enzyme Activity 59
3.3.3.1 Screening at Room Temperature 60
3.3.3.2 Screening at Higher Temperature (35oC) 61
3.4 Solid-State Fermentation 61
3.4.1 Experimental Set-Up 61
3.4.2 Development of Novel Inoculum Preparation – Cellophane
Film Culture (CFC) Technique 62
3.4.2.1 Technique Verification and Validation 63
3.4.3 Time Profile of Laccase Enzyme Production 64
3.4.4 Effect of Inducers 64
3.4.5 Optimization of Solid-State Fermentation 65
3.4.6 Recovery of Enzyme 66
3.4.7 Analytical Methods 66
3.4.7.1 Laccase Enzyme Assay (ABTS) 66
3.4.7.2 Total Soluble Protein Content 68
3.4.8 Modelling of Laccase Enzyme Production 68
xii
3.4.9 Characterization of Laccase Enzyme 69
3.4.9.1 Partial Purification of Laccase Enzyme 69
3.4.9.2 Sodium Dodecyl Sulphate-Polyacrylamide Gel
Electrophoresis (SDS-PAGE) of Laccase Enzyme 70
3.4.9.3 Substrate Specificity Study 71
4.0 PRETREATMENT OF RICE HUSK 72
4.1 Results and Discussion 72
4.1.1 Characterization of Rice Husk 72
4.1.2 Screening and Selection of Pretreatment Reagent 73
4.1.2.1 Chemical Pretreatment 73
4.1.2.2 Ionic Liquid Dissolution Pretreatment 80
4.1.2.3 Comparison between Chemical and Ionic Liquid
Dissolution Pretreatments 90
4.1.3 Optimization of Rice Husk Pretreatment 92
4.1.4 Concluding Remarks 97
5.0 SCREENING OF FUNGI WITH LIGNINOLYTIC ACTIVITY 98
5.1 Results and Discussion 99
5.1.1 Screening of Fungal Ligninolytic Enzyme Activity 99
5.1.2 Selection of Fungus for Solid-State Fermentation 104
5.1.3 Concluding Remarks 105
6.0 SOLID-STATE FERMENTATION 106
6.1 Results and Discussion 106
6.1.1 Development of Novel Inoculum Preparation – Cellophane
Film Culture (CFC) Technique 106
6.1.1.1 Regression Analysis of Fungal Dry and Wet Weights 107

xiii
6.1.1.2 Cellophane Film Culture (CFC) Technique Verification
and Validation 109
6.1.1.3 Effectiveness of Cellophane Film Culture (CFC) Technique 111
6.1.2 Time Profile Study and Effect of Inducers 114
6.1.3 Optimization of Solid-State Fermentation 118
6.1.4 Modelling of Laccase Enzyme Production 125
6.1.5 Characterization of Laccase Enzyme 128
6.1.6 Concluding Remarks 131
7.0 CONCLUSIONS AND RECOMMENDATIONS 133
7.1 Conclusions 133
7.2 Novelties and Implications of Study 135
7.3 Recommendations 136
REFERENCES 138
APPENDIX A 158
APPENDIX B 162
APPENDIX C 164
APPENDIX D 167
xiv
LIST OF FIGURES
Page
Figure 2.1 Schematic representation of solid (solid line) and liquid
portions (dotted line) in arbitrary units for solid-state (SSF),
submerged (SmF), and liquid-state fermentations (LSF)
(adapted from Smits (1998)).
9
Figure 2.2 Screening plates of guaiacol oxidation and RBB-R
decolourization cultured with P. chrysosporium.
17
Figure 2.3 Logistic growth curve. 40
Figure 2.4 Increasing and decreasing phases of enzyme production. 43
Figure 3.1 Chemical structures of the ionic liquids. 51
Figure 3.2 Aerial view of an inoculated screening plate. Illustration of the
areas spanned by fungal colony and halo resulted from
ligninolytic enzyme activity. Each small square spanned an
area of 0.04 cm2.
60
Figure 3.3 Experimental set-up of the laboratory scale fermenter. 62
Figure 3.4 Overlaying agar plate with cellophane film in cellophane film
culture (CFC) technique.
62
Figure 4.1 Performance of acids and alkalis in rice husk pretreatment. 74
Figure 4.2 Chemical composition of rice husk after acid and alkali
pretreatments (based on the same initial rice husk sample
weight).
75
xv
Page
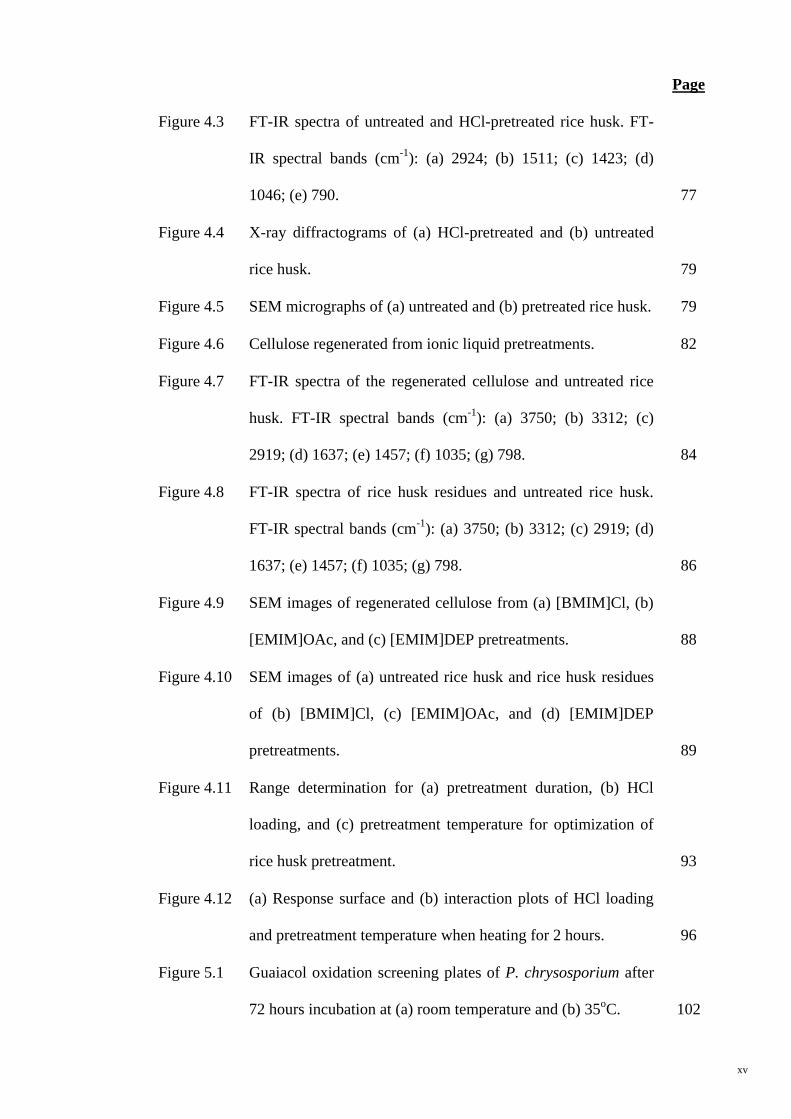
Figure 4.3 FT-IR spectra of untreated and HCl-pretreated rice husk. FT-
IR spectral bands (cm-1
): (a) 2924; (b) 1511; (c) 1423; (d)
1046; (e) 790.
77
Figure 4.4 X-ray diffractograms of (a) HCl-pretreated and (b) untreated
rice husk.
79
Figure 4.5 SEM micrographs of (a) untreated and (b) pretreated rice husk. 79
Figure 4.6 Cellulose regenerated from ionic liquid pretreatments. 82
Figure 4.7 FT-IR spectra of the regenerated cellulose and untreated rice
husk. FT-IR spectral bands (cm-1
): (a) 3750; (b) 3312; (c)
2919; (d) 1637; (e) 1457; (f) 1035; (g) 798.
84
Figure 4.8 FT-IR spectra of rice husk residues and untreated rice husk.
FT-IR spectral bands (cm-1
): (a) 3750; (b) 3312; (c) 2919; (d)
1637; (e) 1457; (f) 1035; (g) 798.
86
Figure 4.9 SEM images of regenerated cellulose from (a) [BMIM]Cl, (b)
[EMIM]OAc, and (c) [EMIM]DEP pretreatments.
88
Figure 4.10 SEM images of (a) untreated rice husk and rice husk residues
of (b) [BMIM]Cl, (c) [EMIM]OAc, and (d) [EMIM]DEP
pretreatments.
89
Figure 4.11 Range determination for (a) pretreatment duration, (b) HCl
loading, and (c) pretreatment temperature for optimization of
rice husk pretreatment.
93
Figure 4.12 (a) Response surface and (b) interaction plots of HCl loading
and pretreatment temperature when heating for 2 hours.
96
Figure 5.1 Guaiacol oxidation screening plates of P. chrysosporium after
72 hours incubation at (a) room temperature and (b) 35oC.
102

xvi
Page
Figure 6.1 Regression plot of dry and wet weights of P. sajor-caju
(cellophane film).
108
Figure 6.2 Regression plot of dry and wet weights of P. sajor-caju (nylon
membrane).
110
Figure 6.3 Regression plot of dry and wet weights of P. sanguineus
(cellophane film).
111
Figure 6.4 Morphology of P. sajor-caju grown on (a) rice husk, (b) agar
plate, and in liquid culture observed from (c) aerial and (d)
bottom views.
112
Figure 6.5 Observed contamination of liquid medium during inoculum
prepration. The liquid culture contains 3% malt extract broth
was inoculated with 3 fungal agar plugs, and incubated on an
orbital shaker at room temperature.
113
Figure 6.6 Time profile plot of laccase activity of the crude enzyme
filtrate in solid-state fermentation of rice husk.
115
Figure 6.7 Effect of copper sulphate, glucose and Tween 80 on laccase
enzyme production after 72 and 192 hours of fermentation.
117
Figure 6.8 One factor plots of (a) copper sulphate and (b) Tween 80
loadings showing the quadratic dependency of specific laccase
enzyme activity (the other parameters are set at centre points).
122
Figure 6.9 Contour plots of the interacting parameters (a) fermentation
duration versus glucose concentration, and (b) copper sulphate
versus Tween 80 concentrations (the other parameters are set
at centre points).
124
xvii
Page
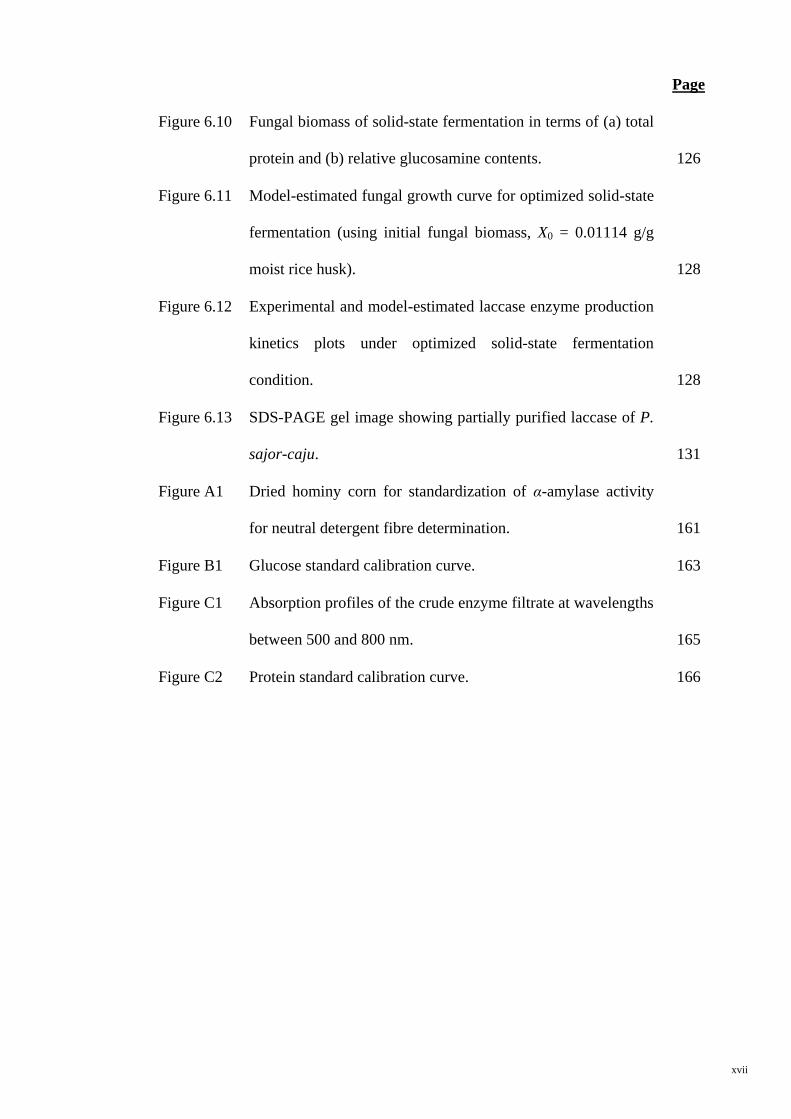
Figure 6.10 Fungal biomass of solid-state fermentation in terms of (a) total
protein and (b) relative glucosamine contents.
126
Figure 6.11 Model-estimated fungal growth curve for optimized solid-state
fermentation (using initial fungal biomass, X0 = 0.01114 g/g
moist rice husk).
128
Figure 6.12 Experimental and model-estimated laccase enzyme production
kinetics plots under optimized solid-state fermentation
condition.
128
Figure 6.13 SDS-PAGE gel image showing partially purified laccase of P.
sajor-caju.
131
Figure A1 Dried hominy corn for standardization of α-amylase activity
for neutral detergent fibre determination.
161
Figure B1 Glucose standard calibration curve. 163
Figure C1 Absorption profiles of the crude enzyme filtrate at wavelengths
between 500 and 800 nm.
165
Figure C2 Protein standard calibration curve. 166
xviii
LIST OF TABLES
Page
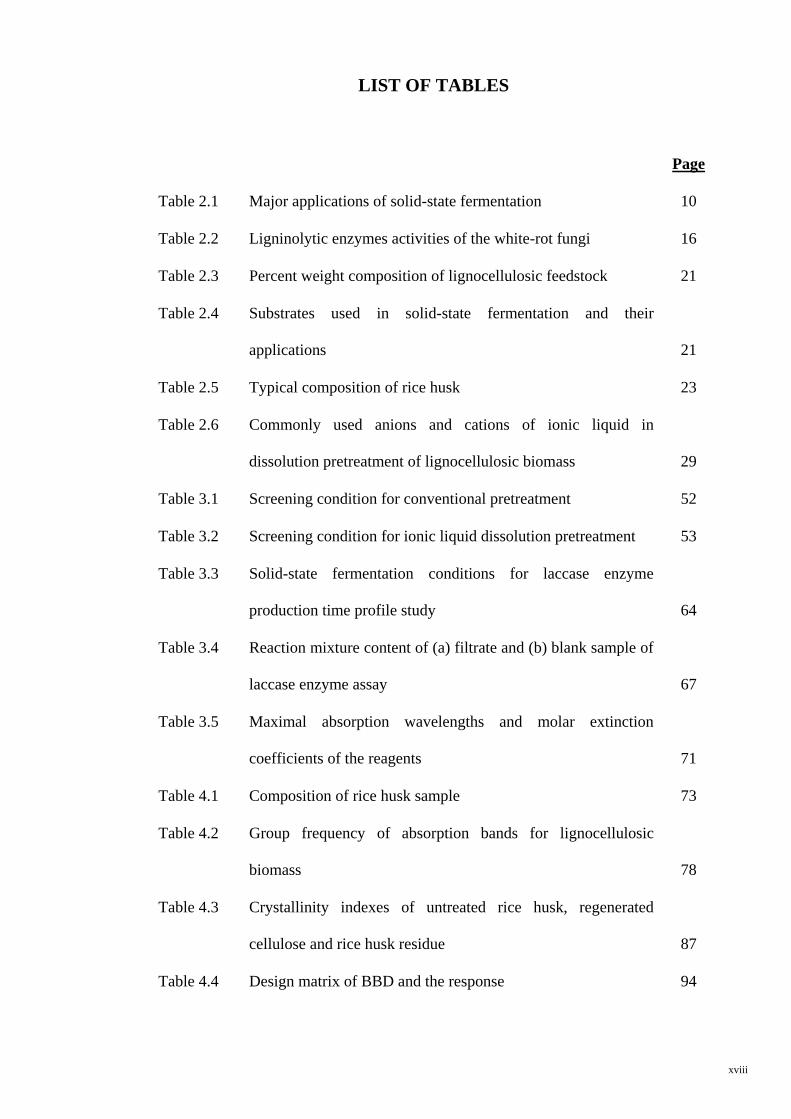
Table 2.1 Major applications of solid-state fermentation 10
Table 2.2 Ligninolytic enzymes activities of the white-rot fungi 16
Table 2.3 Percent weight composition of lignocellulosic feedstock 21
Table 2.4 Substrates used in solid-state fermentation and their
applications
21
Table 2.5 Typical composition of rice husk 23
Table 2.6 Commonly used anions and cations of ionic liquid in
dissolution pretreatment of lignocellulosic biomass
29
Table 3.1 Screening condition for conventional pretreatment 52
Table 3.2 Screening condition for ionic liquid dissolution pretreatment 53
Table 3.3 Solid-state fermentation conditions for laccase enzyme
production time profile study
64
Table 3.4 Reaction mixture content of (a) filtrate and (b) blank sample of
laccase enzyme assay
67
Table 3.5 Maximal absorption wavelengths and molar extinction
coefficients of the reagents
71
Table 4.1 Composition of rice husk sample 73
Table 4.2 Group frequency of absorption bands for lignocellulosic
biomass
78
Table 4.3 Crystallinity indexes of untreated rice husk, regenerated
cellulose and rice husk residue
87
Table 4.4 Design matrix of BBD and the response 94
xix
Page
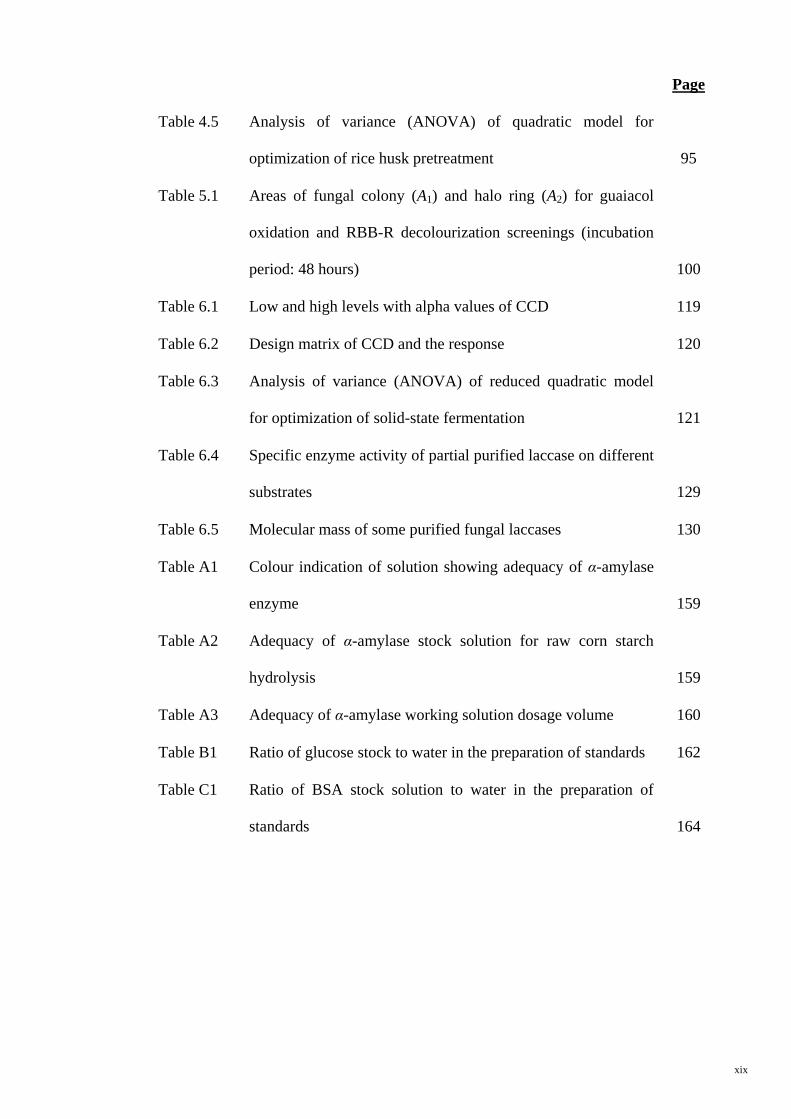
Table 4.5 Analysis of variance (ANOVA) of quadratic model for
optimization of rice husk pretreatment
95
Table 5.1 Areas of fungal colony (A1) and halo ring (A2) for guaiacol
oxidation and RBB-R decolourization screenings (incubation
period: 48 hours)
100
Table 6.1 Low and high levels with alpha values of CCD 119
Table 6.2 Design matrix of CCD and the response 120
Table 6.3 Analysis of variance (ANOVA) of reduced quadratic model
for optimization of solid-state fermentation
121
Table 6.4 Specific enzyme activity of partial purified laccase on different
substrates
129
Table 6.5 Molecular mass of some purified fungal laccases 130
Table A1 Colour indication of solution showing adequacy of α-amylase
enzyme
159
Table A2 Adequacy of α-amylase stock solution for raw corn starch
hydrolysis
159
Table A3 Adequacy of α-amylase working solution dosage volume 160
Table B1 Ratio of glucose stock to water in the preparation of standards 162
Table C1 Ratio of BSA stock solution to water in the preparation of
standards
164
xx
LIST OF SYMBOLS AND ABBREVIATIONS
βn Parameter in a model
ε Molar extinction coefficient
μg Gross specific growth
μm Maximum specific growth rate
μnet Net specific growth
ʋ Enzyme activity
ACS Cross-sectional area of nitrogen molecule (BET)
B1 Weight of oven dried empty crucible before extraction
B3 Weight of oven dried empty crucible after extraction
B4 Weight of oven dried empty crucible after hydrolysis
B5 Weight of empty crucible after ashing (H2SO4 lignin)
Ba Weight of empty crucible after ashing (aNDFom)
Bf Weight of empty crucible after extraction (aNDFom)
c Reagent concentration
C Interaction of nitrogen and sample (BET)
I002 Intensity of diffraction from 002 plane
Iam Intensity of background scatter
kv Enzyme production rate constant
Ks Saturation constant or half-velocity constant
l Thickness of sample (cm)
M Molecular weight
N Avogadro‟s number
R2 Coefficient of determination
xxi
S Substrate concentration
t Time
W Sample weight (BET)
W1 Weight of oven dried empty crucible
W2 Weight of rice husk sample test portion
W3 Weight of oven dried crucible with sample after extraction
W4 Weight of oven dried crucible with sample after hydrolysis
W5 Weight of crucible with sample after ashing (H2SO4 lignin)
Wa Weight of crucible with sample after ashing (aNDFom)
Wf Weight of crucible with sample after extraction (aNDFom)
Wm Weight of constituting nitrogen monolayer on sample
X Biomass concentration
Xn Variable of a factor
Y Response in a model
YX/S Microbial biomass yield
[AMIM] 1-allyl-3-methylimidazolium
[BnMIM] 1-benzyl-3-methylimidazolium
[BMIM] 1-n-butyl-3-methylimidazolium
[EMIM] 1-ethyl-3-methylimidazolium
aNDFom Amylase-treated neutral detergent fibre (organic matter)
ABTS 2,2‟-azino-bis (3-ethylbenzthiazoline-6-sulphonic acid)
ADF Acid-detergent fibre
ANOVA Analysis of variance
AOAC The Association of Official Analytical Chemists
ATF Trifluoroacetate
xxii
BBD Box-Behnken design
BET Brunauer, Emmett and Teller
Cl Chloride
CrI Crystallinity index
CCD Central composite design
CFC technique Cellophane film culture technique
DEP Diethyl phosphate
DMP 2, 6-dimethoxyphenol
DNS 3, 5-dinitrosalicylic acid
DSMZ The German Collection of Microorganisms and Cell
Cultures
EDTA Ethylenediaminetetraacetic acid
FT-IR Fourier-transform infrared
HSO4 Hydrogen sulfate
LiP Lignin peroxidases
LOD Loss on drying
LSF Liquid-state fermentation
MnP Manganese-dependent peroxidases
MEA Malt extract agar
MEPA Malt extract peptone agar
NDF Neutral-detergent fibre
NMMO N-methylmorpholine-N-oxide
NREL National Renewable Energy Laboratory
OAc Acetate
P. chrysosporium Phanerochaete chrysosporium
xxiii
P. radiata Phlebia radiata
P. sajor-caju Pleurotus sajor-caju
P. sanguineus Pycnoporus sanguineus
RBB-R Remazol brilliant blue-R
RSM Response surface methodology
SmF Submerged fermentation
SDS Sodium dodecyl sulphate
SDS-PAGE Sodium dodecyl sulphate-polyacrylamide gel
electrophoresis
SEM Scanning electron microscopy
SSF Solid-state fermentation
TAPPI Technical Association of the Pulp and Paper Industry
UV-VIS Ultra violet-visible
XRD X-ray diffraction

xxiv
LIST OF APPENDICES
Page
Appendix A Standardization of Working α-Amylase for NDF Determination 158
Appendix B Construction of Glucose Standard Calibration Curve 162
Appendix C Protocol for Total Soluble Protein Determination 164
Appendix D Protocol for Staining SDS-PAGE Gel 167
1
CHAPTER 1
INTRODUCTION
1.1 Research Overview
This dissertation reports on the application of rice husk – a lignocellulosic crop residue
to produce laccase enzyme via fungal solid-state fermentation (SSF). The research was
initiated with a chemical pretreatment step that aimed to partially disrupt the recalcitrant
structure of rice husk. Following the pretreatment study is the solid-state fermentation,
which comprised of two major sections. The first section was the screening study to
select a fungus capable of producing ligninolytic enzymes. The second section focuses
on solid-state fermentation of rice husk that includes inoculum preparation,
optimization of solid-state fermentation process and characterization of the laccase
enzyme produced.
1.2 Research Background
1.2.1 Lignocellulosic Biomass in Bioconversion
The rising cost and depletion of natural resources for industrial bioprocesses has
attracted much attention from researchers around the world to search for other
affordable and sustainable alternatives. Agricultural by-products which comprised of
lignocellulose generated along with the processing of agricultural crops are inexpensive
and they are widely available to be converted into added-value products, such as
enzymes (Patel et al., 2009; Rajendran et al., 2011), reducing sugars (Sreenath et al.,
1999), furfural (Vazquez et al., 2007), and ethanol (Saha et al., 1998; Saha et al., 2005).
Nevertheless, direct bioconversion of lignocellulosic biomass gives low yield. This is
due to the recalcitrant nature of the biomass that hinders the accessibility of
microorganism and/or hydrolytic enzymes into the matrix. Besides, it also inhibits the
2
breaking down of the lignocellulose (Khalil, 2002). Therefore, pretreatment is essential
to partially disrupt the lignocellulosic structure for better utilization of biomass.
Pretreatments commonly employed for pretreating lignocellulosic biomass include
physical, chemical, and biological processes. In many cases, a combination of two or
more of the mentioned processes is involved in the pretreatment of lignocellulosic
biomass. Besides, pretreatment that involves lignocellulose dissolution using ionic
liquids is also employed in pretreating lignocellulosic biomass in this study.
1.2.2 Fungal Fermentation in Enzyme Production
The potential conversion of lignocellulosic biomass into valuable products in fungal
fermentation has been investigated by numerous researchers worldwide (Alam et al.,
2005; Kocher et al., 2008; Mishra et al., 2007; Pang et al., 2006a; Pang et al., 2006b;
Reddy et al., 2003; Rezende et al., 2002; Szakacs and Tengerdy, 1997; Vares et al.,
1995; Winquist et al., 2008). The most prominent products could be produced from
fungal fermentation are enzymes such as laccase (Patel et al., 2009; Rajendran et al.,
2011), manganese peroxidases (Rajan et al., 2010), cellulase (Alam et al., 2009; Pang et
al., 2006b), amylase (Kunamneni et al., 2005), xylanase (Pang et al., 2006a; Rezende et
al., 2002), chitinase (Sudhakar and Nagarajan, 2010), protease (Paranthaman et al.,
2009), etc. The ability of fungi in bioconversion is attributed to their capability in
consuming lignocellulosic biomass as energy source. Being the natural degrader of
lignocellulose in the habitat, fungi are also one of the important sources of commercial
and industrial enzymes (Ibrahim, 2008; Singh and Srivastava, 2008).
Currently, most of the commercially available enzymes are produced via
liquid/submerged fermentation (Ellaiah et al., 2002; Holker et al., 2004; Toca-Herrera et
al., 2007). Liquid/submerged fermentation is well established to cater for the production

3
of various enzymes. However, enzymes produced via liquid fermentation are costly
because the process involves the application of high-end technologies and expensive
synthetic raw materials. As a result, its extensive use in industries to improve
conversion processes has been limited. Therefore, a more cost effective way has to be
developed to make the application of enzymes in industrial scale feasible. Fungal solid-
state fermentation, which utilizes inexpensive lignocellulosic biomass as raw materials,
offers an attractive solution for the costly enzyme production process. Solid-state
fermentation can be applied to produce almost all the enzymes that can be produced by
means of liquid/submerged fermentation. Furthermore, solid-state fermentation requires
less stringent operating condition and it involves less complicated downstream
processing. Thus, it appears to be more efficient in both cost and enzyme yield
compared with liquid fermentation.
1.3 Research Objectives
Various crop residues and their applications in fungal fermentation for enzymes
production have been investigated (Maas et al., 2008; Pang et al., 2006a; Reddy et al.,
2003; Saha and Cotta, 2008; Saha et al., 1998; Saha et al., 2005; Vares et al., 1995).
However, the use of rice husk as sole substrate in fungal fermentation for ligninolytic
enzyme production has not been reported. A solid-state fermentation process that
includes pretreatment of rice husk, screen and selection of fungi, and optimization of
solid-state fermentation intended for enzyme production was presented in this
dissertation. The research objectives and associated problem statements were detailed as
follows:-
4
i. To pretreat rice husk in achieving desired structural disruption for solid-
state fermentation
To date, no pretreatment reagent has been reported specifically effective for the
pretreatment of rice husk. Pretreatment reagent has to be carefully selected as it
modifies the structure of the biomass and affects its digestibility in solid-state
fermentation. To have a greater insight into the pretreatment of rice husk,
different pretreatment methods were applied namely chemical and ionic liquid
dissolution pretreatments in this study. The chemical pretreatment reagents
assessed were sodium hydroxide, calcium hydroxide, sulphuric acid,
hydrochloric acid, phosphoric acid, acetic acid, and nitric acid. The ionic liquid
dissolution pretreatment reagents assessed were 1-butyl-3-methylimidazolium
chloride, 1-ethyl-3-methylimidazolium acetate, and 1-ethyl-3-methylimidazolium
diethyl phosphate. The best performing reagent was selected for the subsequent
optimization of rice husk pretreatment.
ii. To screen and select a fungus with desired ligninolytic enzyme activity
Little is known on which fungus can utilize rice husk and produce ligninolytic
enzymes. Therefore, a proper selection of fungus prior to solid-state fermentation
is necessary. In this study, three strains of fungi, namely Pycnoporus sanguineus,
Phlebia radiata and Pleurotus sajor-caju, were screened for their ligninolytic
enzyme activities using guaiacol and Remazol brilliant blue-R. One potential
fungus showing desired ligninolytic activity was selected for the solid-state
fermentation.
5
iii. To optimize solid-state fermentation for ligninolytic enzyme production
The main aims of this study were to assess and improve the solid-state
fermentation process to maximize enzyme yield. To improve the process, a new
and user-friendly fungal inoculum preparation technique was developed. This
technique overcomes limitations frequently associated with existing fungal
inoculum preparations. For yield improvement, the effect of enhancers on
ligninolytic enzyme production was investigated, and the solid-state fermentation
was optimized. The increasing phase of the enzyme production at optimized
solid-state fermentation condition was then modelled.
1.4 Scopes of Study
The scopes of study include:
i. The examination of conventional and non-conventional pretreatment reagents and
select one reagent that is suitable for pretreating rice husk.
ii. The characterization of the chemical structure of rice husk pretreated with
various pretreatment reagents.
iii. The optimization of the pretreatment of rice husk using the selected reagent with
Box-Behnken experimental design.
iv. The screening of fungi and selection of a fungus with ligninolytic enzyme
activity.
v. The development of an inoculum preparation technique for solid-state
fermentation followed by verification and validation of the technique.
vi. The examination of the time profile of laccase production and investigation of the
effect of various inducers on the production of the enzyme.
6
vii. The optimization of the fungal solid-state fermentation using central composite
experimental design.
viii. The modelling of the laccase enzyme production.
ix. The characterization of the laccase enzyme produced.
1.5 Structure of Dissertation
This dissertation is presented in 7 chapters and the contents of each chapter are
described below.
Chapter 1: Introduction
This chapter presents the background, objectives, and problem statements of this
research.
Chapter 2: Literature Review
This chapter presents the literature review for the overall study. The relevant
background information and findings by other researchers are detailed in this chapter.
Chapter 3: Materials and Methods
This chapter details the materials and methods used in this research.
Chapter 4: Pretreatment of rice husk
This chapter comprises the results and discussion on the pretreatment of rice husk.
Chapter 5: Selection of Fungus with Ligninolytic Enzyme Activity
This chapter discusses the results obtained from the screening of fungus with
ligninolytic enzyme activity.

7
Chapter 6: Solid-state fermentation
This chapter reports the results and discussion on solid-state fermentation of rice husk
for ligninolytic enzyme production.
Chapter 7: Conclusions and Recommendations
This chapter presents the overall conclusions of this research, the novelties and
contributions of the study, as well as the recommendations for future studies.

8
CHAPTER 2
LITERATURE REVIEW
This chapter reviews the long existing solid-state fermentation that is a promising
approach in the production of enzymes. Compared to submerged/liquid-state
fermentation, solid-state fermentation has not been extensively applied in industrial
applications due to its unresolved operational limitations. It is undeniable that many
bioprocesses can benefit from the endless potentials of solid-state fermentation. The
literatures compiled give an overview of the process intended for laccase enzyme
production involving pretreatment of rice husk, selection of fungi and optimization of
solid-state fermentation. The first section of this chapter describes the principles of
solid-state fermentation, its application in enzyme production and the associated
benefits compared with submerged/liquid-state fermentation are reviewed. The
following section details the major aspects of solid-state fermentation with emphasis on
laccase enzyme production. It also includes the selection of microbe and substrate,
process optimization, and isolation and purification of product. The subsequent section
reviews the model employed for fungal growth and enzyme production kinetic studies.
2.1 Solid-State Fermentation
Solid-state fermentation involves the growth of microorganism on moist solid substrate
in the absence or near-absence of free water, whereby there is a continuous gas phase
between spaces of the solid material (Mitchell et al., 2006; Pandey et al., 2001). In
general, the term „solid-state fermentation‟ is used interchangeably with „solid-substrate
fermentation‟. The term „solid-substrate fermentation‟ is used only when a solid
material employed serve as carbon or energy source for the microbe in the absence or
near-absence of free water (Pandey et al., 2001). On the other hand, „solid-state
9
fermentation‟ reflects any fermentation processes occurring in the absence or near-
absence of free water, and employing a natural substrate or an inert solid support
(Pandey et al., 2001).
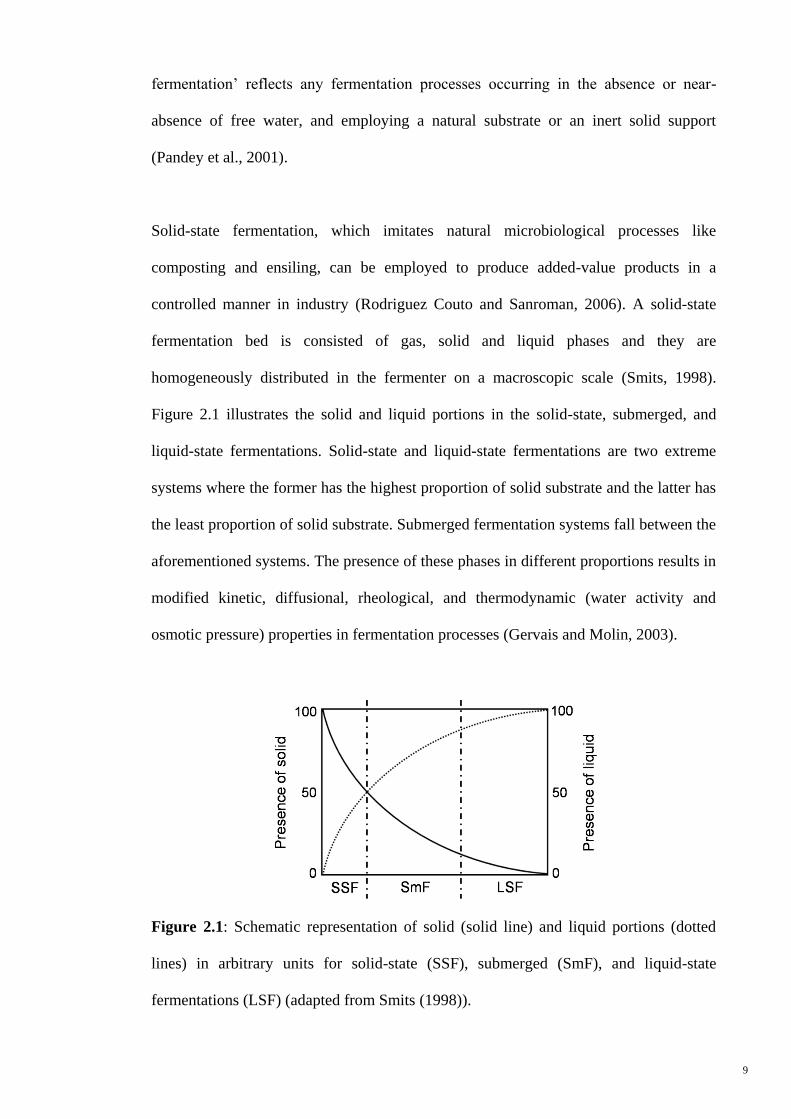
Solid-state fermentation, which imitates natural microbiological processes like
composting and ensiling, can be employed to produce added-value products in a
controlled manner in industry (Rodriguez Couto and Sanroman, 2006). A solid-state
fermentation bed is consisted of gas, solid and liquid phases and they are
homogeneously distributed in the fermenter on a macroscopic scale (Smits, 1998).
Figure 2.1 illustrates the solid and liquid portions in the solid-state, submerged, and
liquid-state fermentations. Solid-state and liquid-state fermentations are two extreme
systems where the former has the highest proportion of solid substrate and the latter has
the least proportion of solid substrate. Submerged fermentation systems fall between the
aforementioned systems. The presence of these phases in different proportions results in
modified kinetic, diffusional, rheological, and thermodynamic (water activity and
osmotic pressure) properties in fermentation processes (Gervais and Molin, 2003).
Figure 2.1: Schematic representation of solid (solid line) and liquid portions (dotted
lines) in arbitrary units for solid-state (SSF), submerged (SmF), and liquid-state
fermentations (LSF) (adapted from Smits (1998)).
10
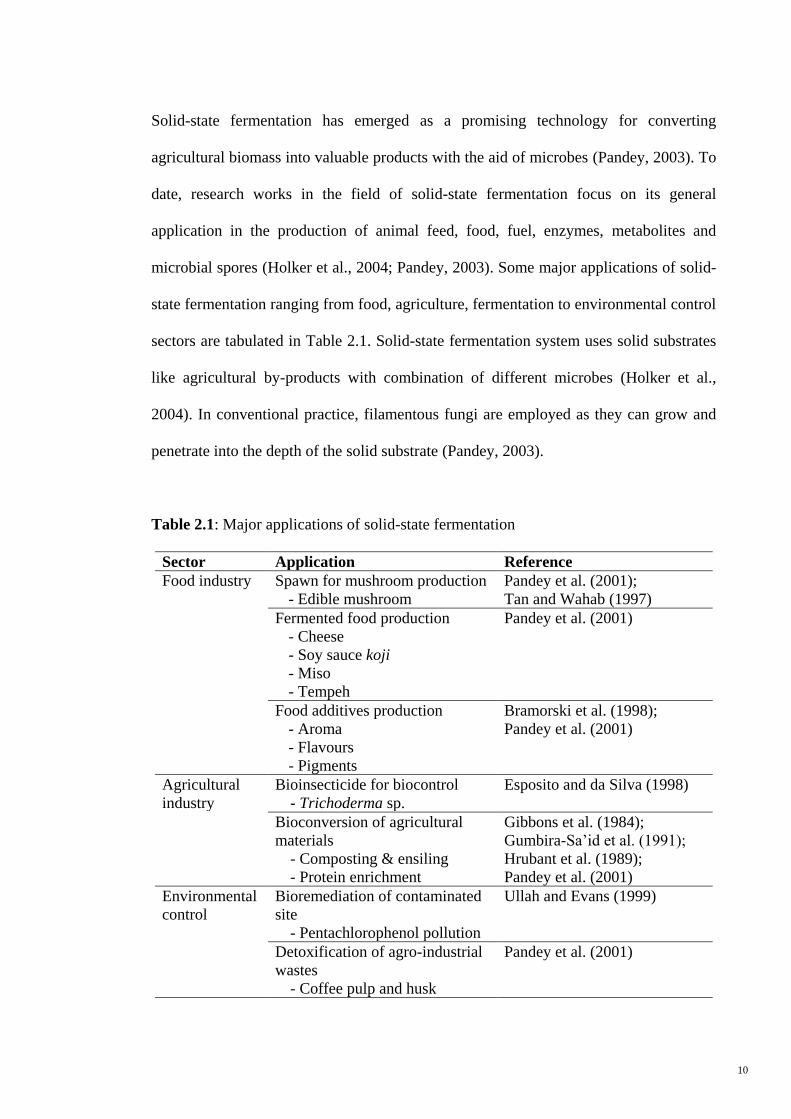
Solid-state fermentation has emerged as a promising technology for converting
agricultural biomass into valuable products with the aid of microbes (Pandey, 2003). To
date, research works in the field of solid-state fermentation focus on its general
application in the production of animal feed, food, fuel, enzymes, metabolites and
microbial spores (Holker et al., 2004; Pandey, 2003). Some major applications of solid-
state fermentation ranging from food, agriculture, fermentation to environmental control
sectors are tabulated in Table 2.1. Solid-state fermentation system uses solid substrates
like agricultural by-products with combination of different microbes (Holker et al.,
2004). In conventional practice, filamentous fungi are employed as they can grow and
penetrate into the depth of the solid substrate (Pandey, 2003).
Table 2.1: Major applications of solid-state fermentation
Sector Application Reference
Food industry Spawn for mushroom production
- Edible mushroom
Pandey et al. (2001);
Tan and Wahab (1997)
Fermented food production
- Cheese
- Soy sauce koji
- Miso
- Tempeh
Pandey et al. (2001)
Food additives production
- Aroma
- Flavours
- Pigments
Bramorski et al. (1998);
Pandey et al. (2001)
Agricultural
industry
Bioinsecticide for biocontrol
- Trichoderma sp.
Esposito and da Silva (1998)
Bioconversion of agricultural
materials
- Composting & ensiling
- Protein enrichment
Gibbons et al. (1984);
Gumbira-Sa‟id et al. (1991);
Hrubant et al. (1989);
Pandey et al. (2001)
Environmental
control
Bioremediation of contaminated
site
- Pentachlorophenol pollution
Ullah and Evans (1999)
Detoxification of agro-industrial
wastes
- Coffee pulp and husk
Pandey et al. (2001)
11
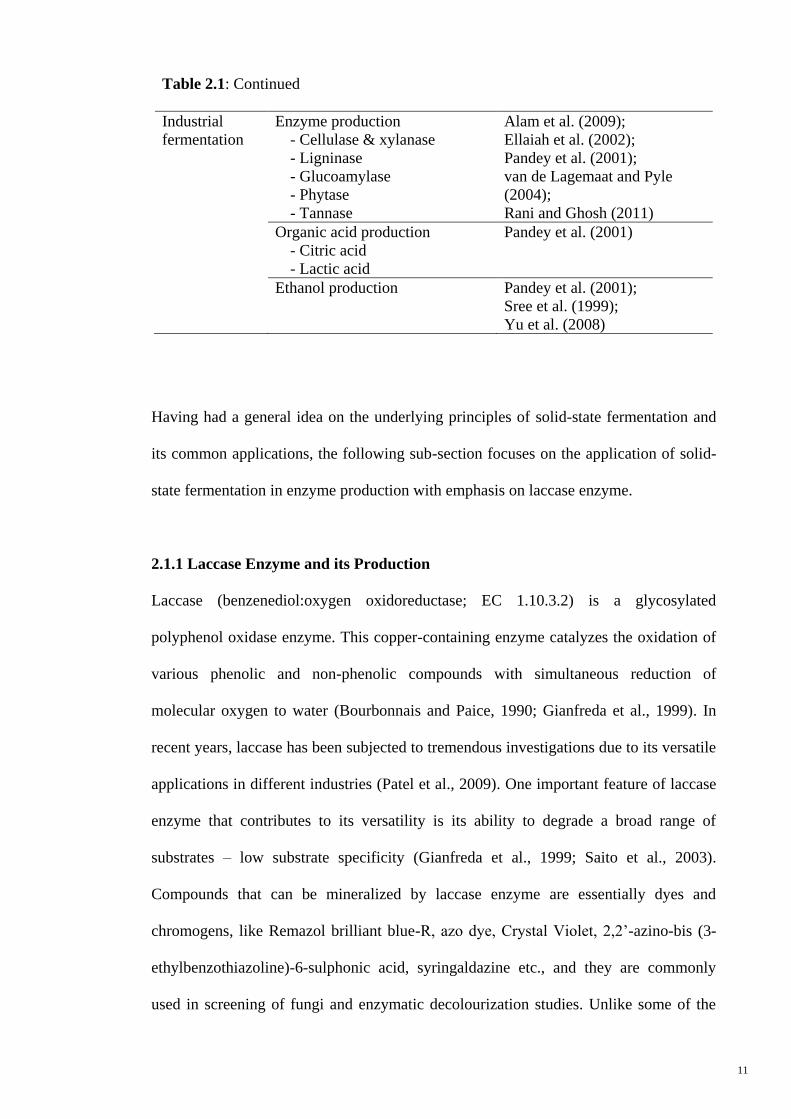
Table 2.1: Continued
Industrial
fermentation
Enzyme production
- Cellulase & xylanase
- Ligninase
- Glucoamylase
- Phytase
- Tannase
Alam et al. (2009);
Ellaiah et al. (2002);
Pandey et al. (2001);
van de Lagemaat and Pyle
(2004);
Rani and Ghosh (2011)
Organic acid production
- Citric acid
- Lactic acid
Pandey et al. (2001)
Ethanol production Pandey et al. (2001);
Sree et al. (1999);
Yu et al. (2008)
Having had a general idea on the underlying principles of solid-state fermentation and
its common applications, the following sub-section focuses on the application of solid-
state fermentation in enzyme production with emphasis on laccase enzyme.
2.1.1 Laccase Enzyme and its Production
Laccase (benzenediol:oxygen oxidoreductase; EC 1.10.3.2) is a glycosylated
polyphenol oxidase enzyme. This copper-containing enzyme catalyzes the oxidation of
various phenolic and non-phenolic compounds with simultaneous reduction of
molecular oxygen to water (Bourbonnais and Paice, 1990; Gianfreda et al., 1999). In
recent years, laccase has been subjected to tremendous investigations due to its versatile
applications in different industries (Patel et al., 2009). One important feature of laccase
enzyme that contributes to its versatility is its ability to degrade a broad range of
substrates – low substrate specificity (Gianfreda et al., 1999; Saito et al., 2003).
Compounds that can be mineralized by laccase enzyme are essentially dyes and
chromogens, like Remazol brilliant blue-R, azo dye, Crystal Violet, 2,2‟-azino-bis (3-
ethylbenzothiazoline)-6-sulphonic acid, syringaldazine etc., and they are commonly
used in screening of fungi and enzymatic decolourization studies. Unlike some of the

12
oxidoreductases, laccase does not require the addition or synthesis of co-factor for
catalysis reaction (Toca-Herrera et al., 2007). The enzyme requires only oxygen that is
present in the environment as its co-substrate.
Laccase enzyme is widely distributed among fungi (Bollag and Leonowicz, 1984),
higher plants (Mayer and Staples, 2002), and bacteria (Alexandre and Zhulin, 2000).
The primary role of fungal laccase is associated with its lignin degradation ability in
humification (Gianfreda et al., 1999; Mayer and Staples, 2002). Besides, it is also
reported to constitute the fungal defence mechanism (Baldrian, 2003), take part in the
conidial pigment production (Hermann et al., 1983; Mayer and Staples, 2002), involve
in spores and fruiting body development (Thurston, 1994), and participate in infestation
during phytopathogenesis (Gianfreda et al., 1999). In spite of its putative role in various
natural processes, low substrate specificity allows the enzyme to oxidize a wide range
of compounds without releasing toxic peroxide intermediates (Claus, 2004; Nyanhongo
et al., 2002). The feature associated with oxidation makes laccase enzyme suitable for
the application in biotechnological and environmental processes, like delignification in
biopulping, textile dye bleaching, bioremediation of soils, decolourization and
detoxification of industrial effluent, and enzymatic conversion of added-value
compounds from lignin (Kiiskinen et al., 2004; Nyanhongo et al., 2002; Rodriguez
Couto and Sanroman, 2005; Toca-Herrera et al., 2007).
However, the use of laccase enzyme in biotechnological and environmental processes is
feasible only when the enzyme is produced in large quantity at low cost. A good
strategy amidst many sought after is to produce laccase enzyme by solid-state
fermentation using agricultural industrial wastes as support substrate (Reddy et al.,
2003). Utilization of these agricultural by-products would help to reduce the disposal

13
problem. In addition, the legislations and environmental issues have also triggered the
need to find alternative applications for these lignocellulosic residues (Reddy et al.,
2003).
In general, the expression of laccase enzyme in fungal fermentations is influenced by
culture conditions, such as carbon source and its concentration, pH of the fermentation
environment, the composition of lignocellulosic materials and the nitrogen source.
Different parameters affect the culture conditions and the interaction between them has
further complicated the optimization of the fermentation. As a consequence, statistical
optimization of fermentation medium components appears to be a rational and cost-
effective way for efficient laccase enzyme production. The statistical approach also
reveals the effect of each component on laccase enzyme production (Rajendran et al.,
2011).
Besides the culture conditions, operational considerations from biological and
processing perspectives too have influences on solid-state fermentation processes. The
major aspects of solid-state fermentation are presented in the next sub-section.
2.2 Major Aspects of Solid-State Fermentation
Although solid-state fermentation uses simpler culture media and requires less stringent
sterility than submerged/liquid-state fermentation, the process development for both
fermentations is equally laborious. For the development of any solid-state fermentation
processes, several important aspects should be considered include: (i) selection of fungi,
(ii) selection of substrate, (iii) optimization of process parameters, and (iv) isolation and
purification of desired product (Pandey, 2003). These aspects form the backbone of
solid-state fermentation processes.
14
2.2.1 Selection of Fungi
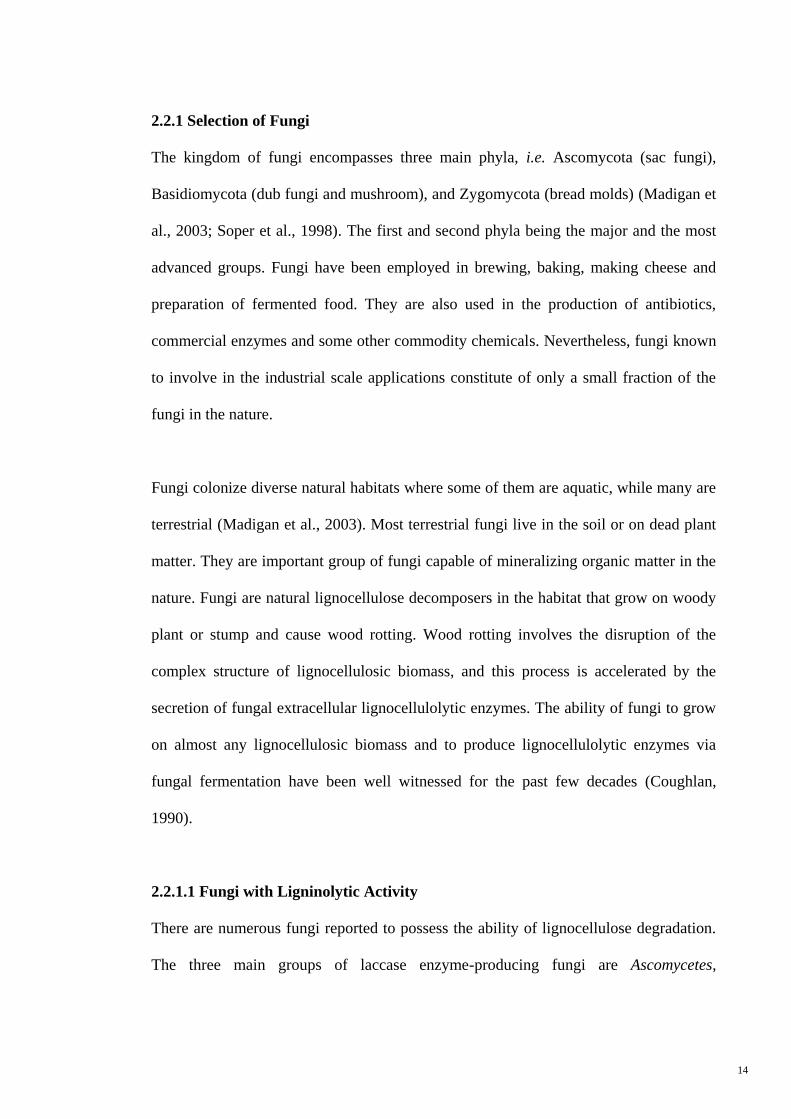
The kingdom of fungi encompasses three main phyla, i.e. Ascomycota (sac fungi),
Basidiomycota (dub fungi and mushroom), and Zygomycota (bread molds) (Madigan et
al., 2003; Soper et al., 1998). The first and second phyla being the major and the most
advanced groups. Fungi have been employed in brewing, baking, making cheese and
preparation of fermented food. They are also used in the production of antibiotics,
commercial enzymes and some other commodity chemicals. Nevertheless, fungi known
to involve in the industrial scale applications constitute of only a small fraction of the
fungi in the nature.
Fungi colonize diverse natural habitats where some of them are aquatic, while many are
terrestrial (Madigan et al., 2003). Most terrestrial fungi live in the soil or on dead plant
matter. They are important group of fungi capable of mineralizing organic matter in the
nature. Fungi are natural lignocellulose decomposers in the habitat that grow on woody
plant or stump and cause wood rotting. Wood rotting involves the disruption of the
complex structure of lignocellulosic biomass, and this process is accelerated by the
secretion of fungal extracellular lignocellulolytic enzymes. The ability of fungi to grow
on almost any lignocellulosic biomass and to produce lignocellulolytic enzymes via
fungal fermentation have been well witnessed for the past few decades (Coughlan,
1990).
2.2.1.1 Fungi with Ligninolytic Activity
There are numerous fungi reported to possess the ability of lignocellulose degradation.
The three main groups of laccase enzyme-producing fungi are Ascomycetes,

15
Basidiomycetes and Deuteromycetes. Majority of the laccase enzyme-producing fungi
are comprised of Basidiomycetes.
Among the fungi with lignocellulosic activity, the wood rotting fungi can produce
extracellular lignin-modifying enzymes consisting of laccase, manganese-dependent
peroxidase and lignin peroxidase. Examples of wood rotting fungi are Phlebia radiata,
Pleurotus sajor-caju, Pycnoporus sanguineus, and Phanerochaete chrysosporium.
These fungi belong to the Class Basidiomycetes and they are also known as the white-
rot fungi. Many members of Class Basidiomycetes are saprotroph involving in litter and
wood decay that are important in nutrient recycling in natural habitat (Singh and
Srivastava, 2008; Webster and Weber, 2007). Phlebia radiata, Pycnoporus sanguineus,
and Phanerochaete chrysosporium belong to the Order Polyporates. They are important
wood rotting bracket fungi, which cause both brown-rot and white-rot on wood (Singh
and Srivastava, 2008; Webster and Weber, 2007). On the other hand, Pleurotus sajor-
caju belongs to the Order Agaricales (the gilled mushrooms), where most of its
members only cause white-rot on wood (Singh and Srivastava, 2008; Webster and
Weber, 2007). Some members of Agaricales, like Pleurotus sajor-caju and Pleurotus
ostreatus, are widely cultivated as source of edible protein. Among the fungal strains,
Phanerochaete chrysosporium has been used as a model organism for lignin
degradation studies (Webster and Weber, 2007). The ligninolytic enzyme activities
present in the fungi mentioned are summarized in Table 2.2.

16
Table 2.2: Ligninolytic enzyme activities of the white-rot fungi
Fungus Enzyme activity
Reference Laccase MnP
a LiP
b Oxidases
P. chrysosporium + + + Okino et al. (2000)
P. sanguineus + + +
Abdul Karim and
Mohamad Annuar (2009),
Okino et al. (2000),
Saparrat et al. (2002)
P. radiata + + +
Niku-Paavola et al.
(1988), Vares et al. (1995)
P. sajor-caju + + Patrick et al. (2011),
Reddy et al. (2003) a MnP: Manganese-dependent peroxidases
b LiP: Lignin peroxidases
2.2.1.2 Screening of Fungi
The wood rotting fungi are known to possess the ability of degrading lignocellulose in
biomass. However, a proper screening procedure is required to evaluate their activities
in the laboratory. Most of the laboratory screening procedures employed synthetic
chromogenic chemicals to screen fungal ligninolytic enzyme activity. Some commonly
used synthetic screening chemicals are guaiacol (Coll et al., 1993; Kiiskinen et al.,
2004; Viswanath et al., 2008), 2,2'-azino-bis (3-ethylbenzthiazoline-6-sulphonic acid)
(ABTS) (Floch et al., 2007; Hao et al., 2007; Saparrat et al., 2000), syringaldazine
(Floch et al., 2007) and polymeric dyes such as Remazol brilliant blue-R (RBB-R)
(D'Souza et al., 1999).
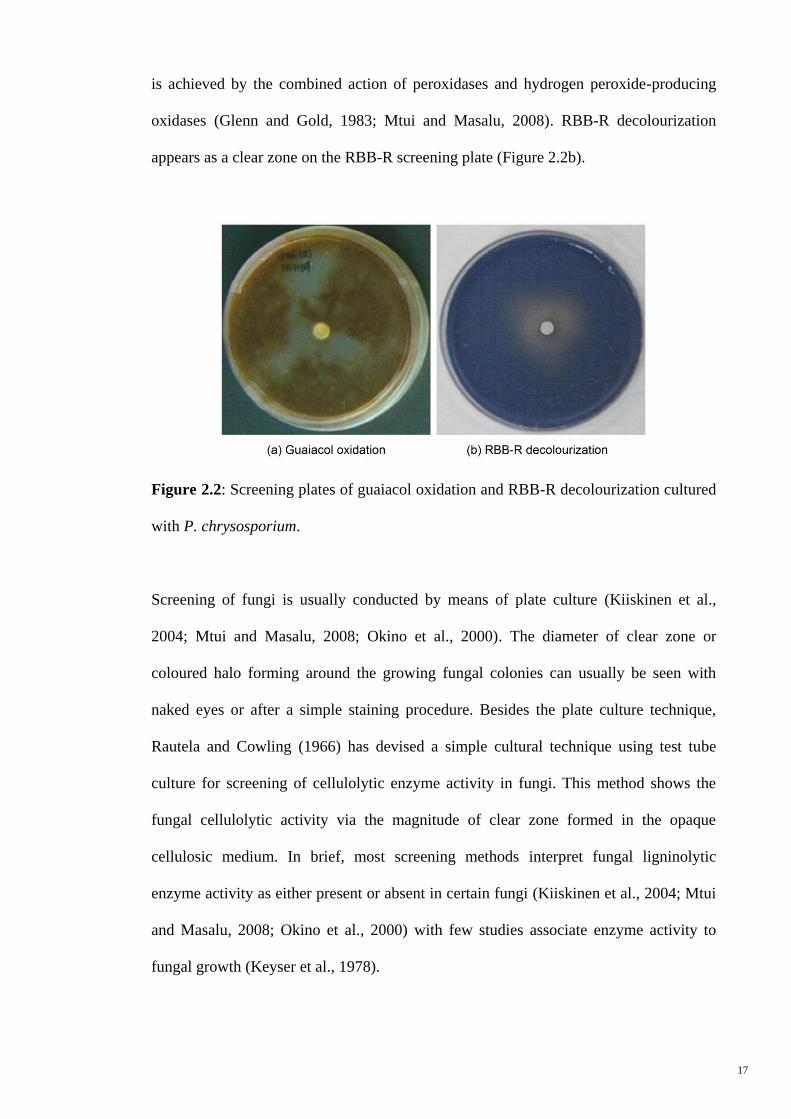
In the presence of phenol oxidases, the colourless guaiacol is oxidized to form reddish
brown-coloured compounds, respectively (Doerge et al., 1997; Okino et al., 2000).
Figure 2.2a shows a screening plate of Phanerochaete chrysosporium with reddish-
brown appearance that is resulted from guaiacol oxidation. Decolourization of RBB-R
17
is achieved by the combined action of peroxidases and hydrogen peroxide-producing
oxidases (Glenn and Gold, 1983; Mtui and Masalu, 2008). RBB-R decolourization
appears as a clear zone on the RBB-R screening plate (Figure 2.2b).
Figure 2.2: Screening plates of guaiacol oxidation and RBB-R decolourization cultured
with P. chrysosporium.
Screening of fungi is usually conducted by means of plate culture (Kiiskinen et al.,
2004; Mtui and Masalu, 2008; Okino et al., 2000). The diameter of clear zone or
coloured halo forming around the growing fungal colonies can usually be seen with
naked eyes or after a simple staining procedure. Besides the plate culture technique,
Rautela and Cowling (1966) has devised a simple cultural technique using test tube
culture for screening of cellulolytic enzyme activity in fungi. This method shows the
fungal cellulolytic activity via the magnitude of clear zone formed in the opaque
cellulosic medium. In brief, most screening methods interpret fungal ligninolytic
enzyme activity as either present or absent in certain fungi (Kiiskinen et al., 2004; Mtui
and Masalu, 2008; Okino et al., 2000) with few studies associate enzyme activity to
fungal growth (Keyser et al., 1978).
18
2.2.1.3 Inoculum Preparation
The step that is closely related to the screening of fungi is the preparation of inoculum.
It involves the preliminary cultivation of selected microbe on a nutrient-rich medium to
produce high yield of biomass (Riviere, 1977) and constitutes as one of the important
steps in solid-state fermentation. The choice of inoculum preparation methods is
dependent on the selected microbe. Several inoculum preparations being used for solid-
state fermentation are spore suspension, mycelial disc, mycelial suspension, and pre-
inoculated solid substrate.
Spores are usually produced by surface culture on agar medium or layers of bran or
cereals soaked with water (Riviere, 1977). The spores are harvested by washing the
surface of agar medium or solid substrate with sterile deionised water, and sometimes
with the addition of a suitable amount of Tween 80 (Cavalcante et al., 2008). For
optimal spore production, suitable conditions like moisture content of substrate and
relative humidity of gas phase are to be determined for specific fungal strain (Riviere,
1977). In addition, spores can also be produced by means of submerged/liquid culture
depending on the fungal strain employed (Riviere, 1977).
In some solid-state fermentation processes, mycelial discs are used as inoculum (Patel
et al., 2009). Mycelial discs are cut from the actively expanding end of a fungus grown
on agar medium. The discs consisted of a layer of fungal biomass and agar medium are
applied directly as inoculum. The mycelial disc can be easily prepared, but the
nutritious agar attached to the disc is a potential source of contamination in solid-state
fermentation.
19
Inoculum could also be prepared in liquid culture with nutrient medium. This method
needs to be conducted in stringent sterile conditions to ensure the quality of the
inoculum prepared. Mycelial fungus forms pellets when it is grown in liquid medium.
Therefore, homogenization with blender or homogenizer is usually needed to break
mycelial clumps before inoculation (Al-Asheh and Duvnjak, 1994; Fukushima and
Kirk, 1995). Occasionally, additional washing step is carried out to remove excess
nutrient medium before inoculation to reduce the risk of contaminations.
Sterilized solid substrate colonized by fungus can also be used as inoculum for
fermentation. The nutrient rich substrate facilitates fungus to increase in its mycelial
biomass with a relatively short duration. This strategy is commonly used in the
agriculture sectors, for instance the preparation of spawn for mushroom cultivation.
2.2.2 Selection of Substrate
Selection of a suitable solid substrate is another key aspect of solid-state fermentation
(Pandey, 2003; Toca-Herrera et al., 2007). Substrates used in solid-state fermentations
are generally lignocellulosic and heterogeneous by-products generated from agricultural
industries (Raimbault, 1998). The solid substrate, which is insoluble, acts as both
physical support and nutrients source for the microbes in solid-state fermentation
(Pandey, 2003) to produce metabolites, enzymes, biomass, carbon dioxide, water, and
heat (Smits, 1998). In most fungi, solid substrates are their natural media where growth
can occur on the surface or within the substrate depending on the porosity (Gervais and
Molin, 2003). Therefore, the selection of a suitable solid substrate is crucial as it
determines the success of a solid-state fermentation process.
20
The selection involves screening of a number of agricultural by-products that are fit for
microbial growth and product formation (Kunamneni et al., 2005; Patel et al., 2009).
The screening evaluation focuses on agricultural by-products mainly due to their
potential advantages for filamentous fungi thriving on the solid substrates
(Ramachandran et al., 2004). Furthermore, the selection of solid substrate is depended
on several factors related primarily to cost and availability (Rodriguez Couto and
Sanroman, 2006). Chemical composition of the solid materials plays important role in
stimulating the production of desired product (Rodriguez Couto and Sanroman, 2005).
For instance, materials with higher lignin content lead to higher expression of fungal
ligninolytic activity (Rodriguez Couto and Sanroman, 2005). The availability and
accessibility of nutrients in solid substrate depends on substrate porosity and structure,
which may be affected by moisture and substrate pretreatment (Cavalcante et al., 2008).
Furthermore, substrate structure also has effect in solid-state fermentation as fungi
penetrate solids in different ways depending on the porosity and tortuosity of the solid
(Cavalcante et al., 2008).
The characteristics of lignocellulosic biomass commonly used as feedstock in solid-
state fermentation are presented in the following section with focus given to the rice
husk – a potential feedstock in bioconversion.
2.2.2.1 Lignocellulosic Biomass
Lignocellulose that present in all agricultural crop residues is the most abundant
biomass on earth. The percent weight composition of some herbaceous and woody
lignocellulosic biomass used in bioconversion is tabulated in Table 2.3. Lignocellulosic
biomass such as sugarcane bagasse, wheat straw and cottonwood contains more than
21
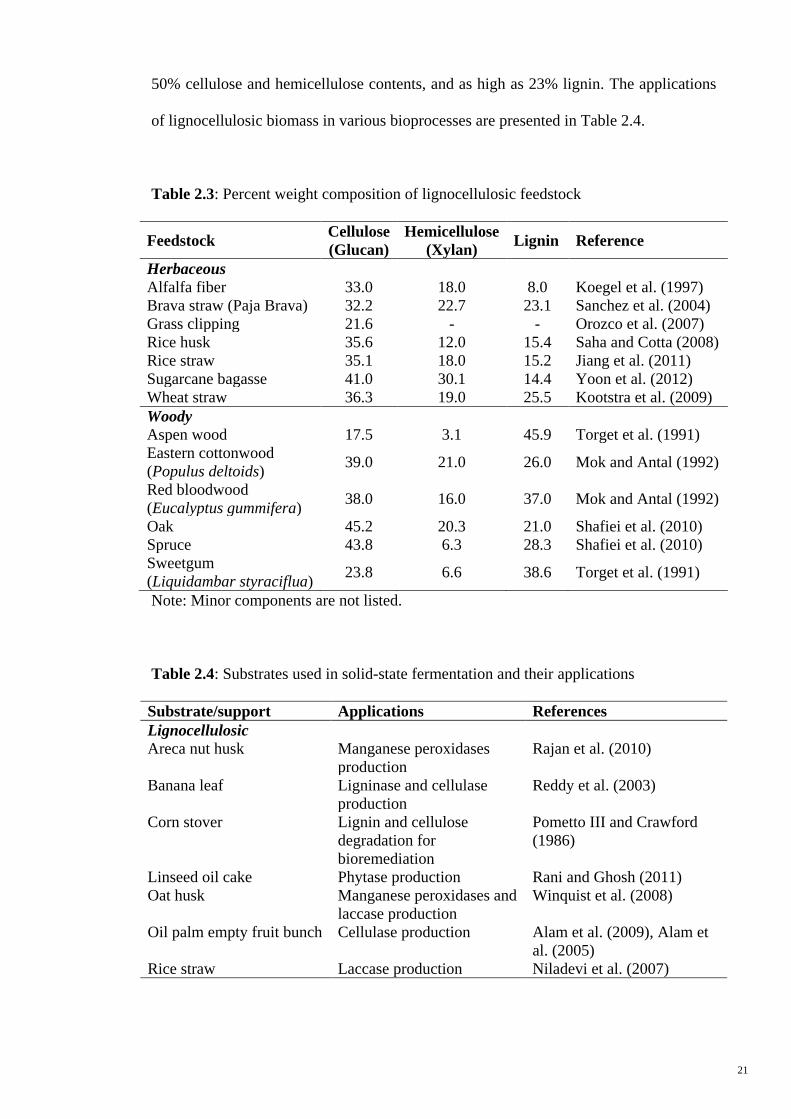
50% cellulose and hemicellulose contents, and as high as 23% lignin. The applications
of lignocellulosic biomass in various bioprocesses are presented in Table 2.4.
Table 2.3: Percent weight composition of lignocellulosic feedstock
Feedstock Cellulose
(Glucan)
Hemicellulose
(Xylan) Lignin Reference
Herbaceous
Alfalfa fiber 33.0 18.0 8.0 Koegel et al. (1997)
Brava straw (Paja Brava) 32.2 22.7 23.1 Sanchez et al. (2004)
Grass clipping 21.6 - - Orozco et al. (2007)
Rice husk 35.6 12.0 15.4 Saha and Cotta (2008)
Rice straw 35.1 18.0 15.2 Jiang et al. (2011)
Sugarcane bagasse 41.0 30.1 14.4 Yoon et al. (2012)
Wheat straw 36.3 19.0 25.5 Kootstra et al. (2009)
Woody
Aspen wood 17.5 3.1 45.9 Torget et al. (1991)
Eastern cottonwood
(Populus deltoids) 39.0 21.0 26.0 Mok and Antal (1992)
Red bloodwood
(Eucalyptus gummifera) 38.0 16.0 37.0 Mok and Antal (1992)
Oak 45.2 20.3 21.0 Shafiei et al. (2010)
Spruce 43.8 6.3 28.3 Shafiei et al. (2010)
Sweetgum
(Liquidambar styraciflua) 23.8 6.6 38.6 Torget et al. (1991)
Note: Minor components are not listed.
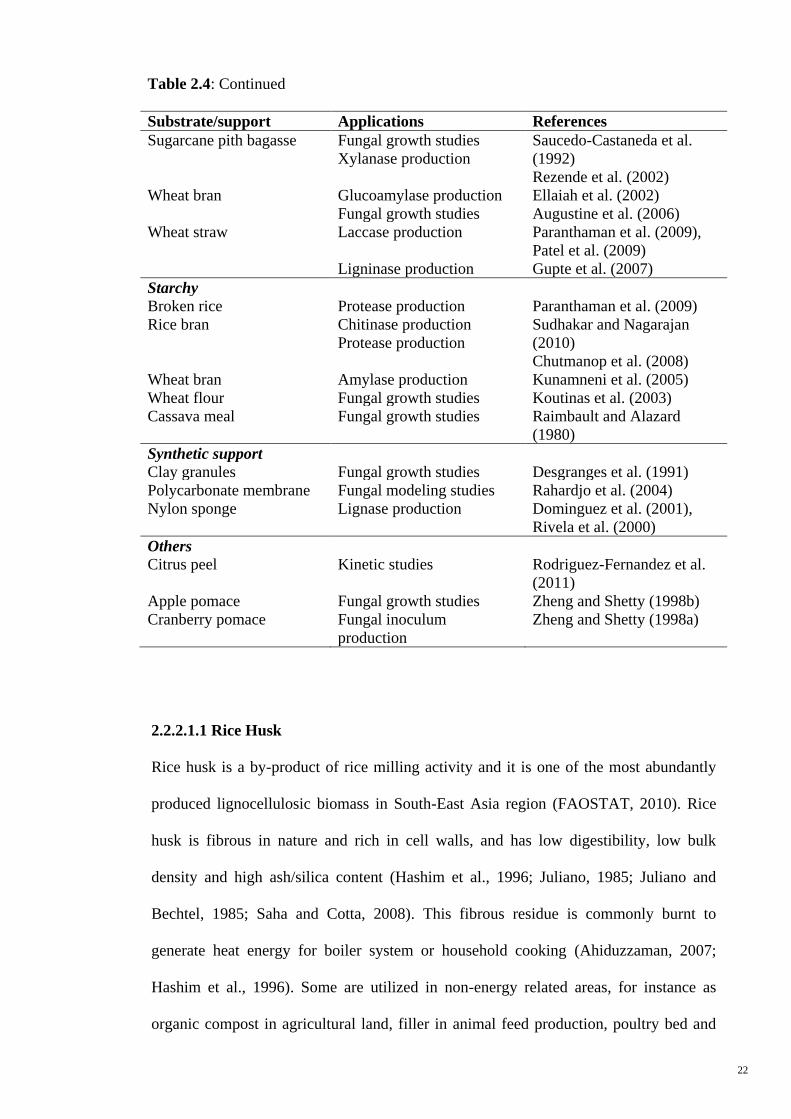
Table 2.4: Substrates used in solid-state fermentation and their applications
Substrate/support Applications References
Lignocellulosic
Areca nut husk Manganese peroxidases
production
Rajan et al. (2010)
Banana leaf Ligninase and cellulase
production
Reddy et al. (2003)
Corn stover Lignin and cellulose
degradation for
bioremediation
Pometto III and Crawford
(1986)
Linseed oil cake Phytase production Rani and Ghosh (2011)
Oat husk Manganese peroxidases and
laccase production
Winquist et al. (2008)
Oil palm empty fruit bunch Cellulase production Alam et al. (2009), Alam et
al. (2005)
Rice straw Laccase production Niladevi et al. (2007)
22
Table 2.4: Continued
Substrate/support Applications References
Sugarcane pith bagasse Fungal growth studies
Xylanase production
Saucedo-Castaneda et al.
(1992)
Rezende et al. (2002)
Wheat bran Glucoamylase production
Fungal growth studies
Ellaiah et al. (2002)
Augustine et al. (2006)
Wheat straw Laccase production
Ligninase production
Paranthaman et al. (2009),
Patel et al. (2009)
Gupte et al. (2007)
Starchy
Broken rice Protease production Paranthaman et al. (2009)
Rice bran Chitinase production
Protease production
Sudhakar and Nagarajan
(2010)
Chutmanop et al. (2008)
Wheat bran Amylase production Kunamneni et al. (2005)
Wheat flour Fungal growth studies Koutinas et al. (2003)
Cassava meal Fungal growth studies Raimbault and Alazard
(1980)
Synthetic support
Clay granules Fungal growth studies Desgranges et al. (1991)
Polycarbonate membrane Fungal modeling studies Rahardjo et al. (2004)
Nylon sponge Lignase production Dominguez et al. (2001),
Rivela et al. (2000)
Others
Citrus peel Kinetic studies Rodriguez-Fernandez et al.
(2011)
Apple pomace Fungal growth studies Zheng and Shetty (1998b)
Cranberry pomace Fungal inoculum
production
Zheng and Shetty (1998a)
2.2.2.1.1 Rice Husk
Rice husk is a by-product of rice milling activity and it is one of the most abundantly
produced lignocellulosic biomass in South-East Asia region (FAOSTAT, 2010). Rice
husk is fibrous in nature and rich in cell walls, and has low digestibility, low bulk
density and high ash/silica content (Hashim et al., 1996; Juliano, 1985; Juliano and
Bechtel, 1985; Saha and Cotta, 2008). This fibrous residue is commonly burnt to
generate heat energy for boiler system or household cooking (Ahiduzzaman, 2007;
Hashim et al., 1996). Some are utilized in non-energy related areas, for instance as
organic compost in agricultural land, filler in animal feed production, poultry bed and
23
reinforce materials in building, disposed as waste and etc. (Ahiduzzaman, 2007;
ESCAP, 2000; Muthadhi and Anitha, 2007). With the accumulation of knowledge and
technology development in the utilization of lignocellulosic biomass, rice husk could be
used as feedstock for the production of added-value products (Alam et al., 2005; Pang et
al., 2006a).
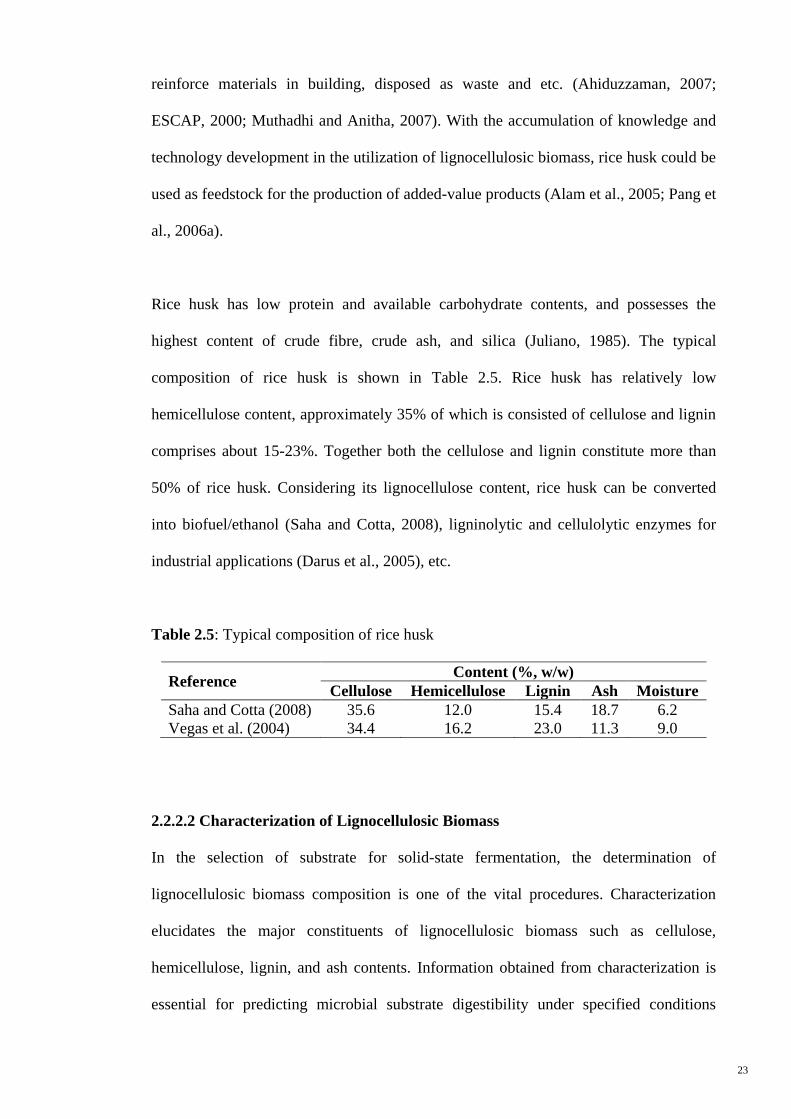
Rice husk has low protein and available carbohydrate contents, and possesses the
highest content of crude fibre, crude ash, and silica (Juliano, 1985). The typical
composition of rice husk is shown in Table 2.5. Rice husk has relatively low
hemicellulose content, approximately 35% of which is consisted of cellulose and lignin
comprises about 15-23%. Together both the cellulose and lignin constitute more than
50% of rice husk. Considering its lignocellulose content, rice husk can be converted
into biofuel/ethanol (Saha and Cotta, 2008), ligninolytic and cellulolytic enzymes for
industrial applications (Darus et al., 2005), etc.
Table 2.5: Typical composition of rice husk
Reference Content (%, w/w)
Cellulose Hemicellulose Lignin Ash Moisture
Saha and Cotta (2008) 35.6 12.0 15.4 18.7 6.2
Vegas et al. (2004) 34.4 16.2 23.0 11.3 9.0
2.2.2.2 Characterization of Lignocellulosic Biomass
In the selection of substrate for solid-state fermentation, the determination of
lignocellulosic biomass composition is one of the vital procedures. Characterization
elucidates the major constituents of lignocellulosic biomass such as cellulose,
hemicellulose, lignin, and ash contents. Information obtained from characterization is
essential for predicting microbial substrate digestibility under specified conditions
24
(Goering and van Soest, 1970). At present, there are a few recognized standard
protocols being employed for characterization of lignocellulosic biomass, namely the
official methods of analysis of the Association of Official Analytical Chemists
(AOAC), the Standard Biomass Analytical Methods of the National Renewable Energy
Laboratory (NREL), and the testing procedures of Technical Association of the Pulp
and Paper Industry (TAPPI). Each of the mentioned standard protocols uses different
analytical approaches, but they give relatively the same outcomes.
A relevant standard protocol is the official methods of AOAC for characterization of
lignocellulosic biomass as animal feed. The cellulose, hemicellulose and lignin contents
can be determined by a series of extractions with acid or neutral detergents, washings
and digestions with acid or enzyme (AOAC, 2005). Extraction with acid detergent
solution removes acid-labile carbohydrates and fats leaving primarily cellulose and
lignin, the resulting lignocellulose in the extracted biomass is known as acid detergent
fibre (ADF) (Goering and van Soest, 1970). For sulphuric acid lignin determination,
the acid detergent fibre is subjected to digestion with 72% sulphuric acid (Goering and
van Soest, 1970). Extraction with neutral detergent solution and heat-stable α-amylase
remove easily digested proteins, lipids and polysaccharides in the lignocellulosic
biomass, leaving a fibrous residue consisted of mainly cellulose, hemicellulose and
lignin, the resulting lignocellulose is called neutral detergent fibre (NDF) (AOAC,
2005). The difference between acid detergent fibre and sulphuric acid lignin is an
estimate of cellulose content. The difference between acid detergent fibre and neutral
detergent fibre is an estimate of hemicellulose content.
25
2.2.2.3 Pretreatment of Lignocellulosic Biomass
Lignocellulose is available in abundant at low cost, but using it directly in bioprocesses
incurs high cost. This is because the enzymatic conversion process requires high
amount of expensive enzymes (Neureiter et al., 2004; Saha et al., 1998). Moreover, a
long incubation time is needed when microbe, such as fungus, is applied in the
bioconversion of untreated lignocellulosic biomass due to its recalcitrant nature.
Therefore, subjecting lignocellulosic biomass to an efficient pretreatment step would
reduce the recalcitrant properties of the lignocellulose (Neureiter et al., 2004).
Apart from the type of substrate, characteristic of the substrate also affects the
performance of the solid-state fermentation (Rodriguez-Leon et al., 2008a). Different
strategies, namely physical, biological, chemical pretreatments, or a combination of two
or more of the pretreatments, have been employed for the pretreatment of
lignocellulosic biomass to improve microbial growth in the solid-state fermentation.
Besides that, non-conventional methods involve the dissolution of lignocellulosic
biomass in a solvent followed by regeneration of the cellulose-rich material also have
been developed for similar purpose (Dogan and Hilmioglu, 2009; Dong et al., 2009;
Jiang et al., 2011; Li et al., 2009; Zhao et al., 2009).
The selection criteria of a pretreatment process must be effective in treating
lignocellulose, economical in large scale, safe and environmental friendly and easy to
apply (Chang et al., 1997). Both the application of conventional and non-conventional
pretreatment methods in pretreating lignocellulosic biomass is discussed in greater
details in the following sections.
26
2.2.2.3.1 Conventional Pretreatment Methods
Pretreatment is necessary to improve the utilization of lignocellulosic biomass in the
bioconversion process. The main purpose of pretreatment is to partially disrupt the
recalcitrant structure of lignocellulosic biomass. Conventional pretreatment approaches
used in pretreating lignocellulosic biomass are physical, biological (microbial), and
chemical methods (Chandra et al., 2007; Ribeiro, 1991).
Pretreatment by physical means involve the breaking-down of the lignocellulosic
biomass into smaller fragments or particles by using blender in laboratory scale, and
hammer- or ball-mill in larger scale. Physical pretreatment increases the specific surface
area of the biomass (Chandra et al., 2007) rendering it more accessible to fungus, while
facilitating the mass and heat transfer in solid-state fermentation (Rodriguez-Leon et al.,
2008a).
Biological pretreatment is similar to conducting solid-state fermentation on untreated
lignocellulosic biomass. Biological pretreatment employs wood degrading fungus, such
as soft, brown or white rot fungus, to change the chemical composition of the
lignocellulosic biomass (Chandra et al., 2007).
Among the conventional pretreatment methods, chemical pretreatments have been
commonly employed. Chemical reagents have been used in pretreating lignocellulosic
biomass are sulphuric acid, phosphoric acid, sodium hydroxide, calcium hydroxide, etc.
Chemical pretreatment disrupts the lignocellulosic matrix making it more susceptible to
be broken down in the subsequent fungal solid-state fermentation or enzymatic
hydrolysis (Chang et al., 1998; Zheng et al., 2007). Acid pretreatments generally
hydrolyze cellulose/hemicellulose and disrupt the structure of lignocellulose (Orozco et
27
al., 2007; Saha et al., 2005), while alkaline pretreatments partially remove lignin and
solubilise hemicellulose (Gowthaman et al., 2001). Chemical pretreatments can be
operated at wide range of temperatures and durations. Most of the chemical
pretreatments are carried out at high temperature with a relatively short duration. In
short, different pretreatment conditions, i.e. level of reagent loading, pretreatment
temperature, and duration, are needed for chemical pretreatment of lignocellulosic
biomass according to their compositional difference.
Chemical pretreatments of lignocellulosic biomass result in the hydrolysate, and the
partially hydrolyzed residue with disrupted structure. The hydrolysate from the
pretreatment can be used for subsequent fermentation as it contains reducing sugars.
Also, the residue with disrupted lignocellulosic matrix can be used for solid-state
fermentation.
2.2.2.3.2 Non-Conventional Pretreatment Methods
In plant, cellulose forms a native composite material with lignin and hemicellulose. Due
to the complex supramolecular structure, cellulose is not soluble in water and in most of
the organic liquids (Klemm et al., 2005). To dissolve cellulose, specific cellulose
solvent capable of disrupting hydrogen bonds and dissolving its supramolecular
structure is required (Klemm et al., 2005). Examples of the cellulose dissolving solvents
are trifluoroacetic acid (≥99%) (Dong et al., 2009), N-methylmorpholine-N-oxide
(NMMO) (Dogan and Hilmioglu, 2009; Shafiei et al., 2010), and ionic liquids (Jiang et
al., 2011; Li et al., 2009; Zhao et al., 2009). The dissolved cellulosic material can be
regenerated from the solvent by the addition of an anti-solvent. The latter must be
miscible with solvent, but not with dissolved cellulosic material. The commonly used
anti-solvents in the regeneration of cellulose are water, alcohol and polar organic liquids
28
(Swatloski et al., 2002). Most of the dissolution pretreatments are conducted at
relatively low temperatures and involved relatively short pretreatment durations from as
short as 30 minutes up to a few hours. The dissolution pretreatments are effective in
reducing the crystallinity of cellulose (Dong et al., 2009; Kuo and Lee, 2009a;
Swatloski et al., 2002; Zhu et al., 2006), and produces regenerated cellulose that are
favourable to subsequent conversions.
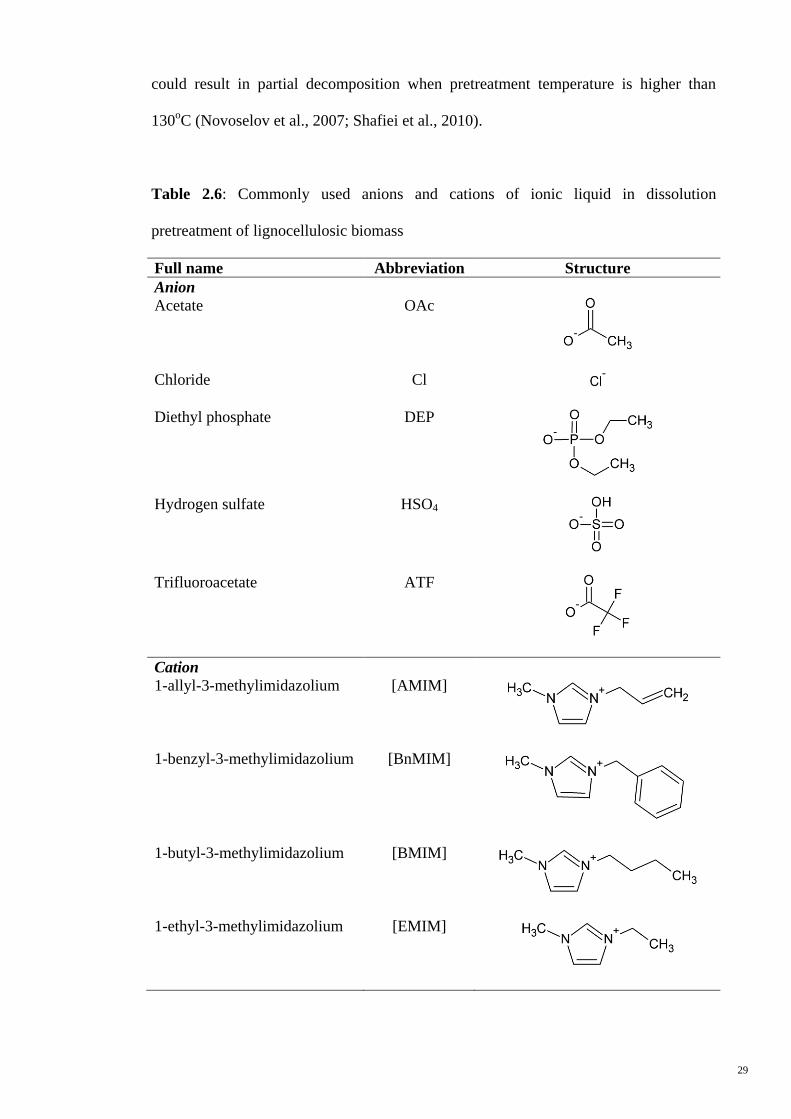
The use of ionic liquids to dissolve cellulose has been employed in the non-
conventional pretreatment (Dadi et al., 2006; Jagadeeswara Rao et al., 2007; Li et al.,
2009; Yang and Pan, 2005; Zhao et al., 2009). Various ionic liquids, such as 1-butyl-3-
methylimidazolium chloride ([BMIM]Cl) (Dadi et al., 2006), 1-ethyl-3-
methylimidazolium acetate ([EMIM]OAc) (Li et al., 2010), and 1-ethyl-3-
methylimidazolium diethyl phosphate ([EMIM]DEP) (Li et al., 2009), have been
applied in pretreatment step before enzymatic saccharification to enhance reducing
sugars yield. The dissolution of cellulose is facilitated by interaction of hydrogen
bonding between ionic liquid and cellulose (Klemm et al., 2005), and the dissolved
cellulose is regenerated through competitive hydrogen bonding interaction between
cellulose and anti-solvent. The structures of some commonly used anion and cation of
ionic liquid in dissolution pretreatments are shown in Table 2.6.
Dissolution pretreatment with certain solvents at higher temperatures can hydrolyze the
dissolved cellulose. Thus, when regenerated cellulose is the desired product, dissolution
pretreatment using trifluoroacetic acid (≥99%) or phosphoric acid (95%) is performed at
low temperatures. High pretreatment temperatures can also lead to hydrolysis of
cellulose instead of dissolution of cellulose (Fanta et al., 1984; Zhang and Lynd, 2005).
Furthermore, NMMO becomes relatively instable at temperatures above 100oC, and
29
could result in partial decomposition when pretreatment temperature is higher than
130oC (Novoselov et al., 2007; Shafiei et al., 2010).
Table 2.6: Commonly used anions and cations of ionic liquid in dissolution
pretreatment of lignocellulosic biomass
Full name Abbreviation Structure
Anion
Acetate OAc
Chloride Cl
Diethyl phosphate DEP
Hydrogen sulfate HSO4
Trifluoroacetate ATF
Cation
1-allyl-3-methylimidazolium [AMIM]
1-benzyl-3-methylimidazolium [BnMIM]
1-butyl-3-methylimidazolium [BMIM]
1-ethyl-3-methylimidazolium [EMIM]
30
2.2.3 Optimization of Process Parameters
Fungal solid-state fermentation is influenced by biological and physico-chemical factors
(Rodriguez-Leon et al., 2008b). Biological factors are related to the biology, metabolic
process and reproduction of a microorganism, and they determine the behaviour of the
particular microorganism in a specific way (Rodriguez-Leon et al., 2008b). Physico-
chemical factors are related to the physico-chemical phenomena occurring in the
fermentation system, for instance, thermodynamic considerations involving transport
phenomena of momentum, energy and mass (Rodriguez-Leon et al., 2008b). All these
factors are interrelated, thus it is important to determine which factors are independent
or dependent. As the number of parameters increase, optimization of process parameters
becomes complicated and time consuming. Therefore, response surface methodology is
a useful tool for process optimization where it considers the effect imposed by the
parameters while reducing the number of experiments to be conducted.
Response surface methodology is a statistical technique useful for modelling and
investigation of process in which the response of interest is influenced by several
parameters, and the ultimate objective is to optimize the response (Montgomery, 2009).
The use of response surface methodology is not limited to optimization of chemical
processes, but also biological processes like solid-state fermentation. Response surface
methodology has been employed to optimize the production of enzymes in solid-state
fermentation involving multiple parameters (Francis et al., 2003; Vuddaraju et al.,
2010). In the optimization, the data are fitted with regression analysis to produce a
model.
Prior to the optimization studies, understanding of the effective process parameters is
essential for better manipulation of the bioconversion process. The following sub-
31
sections describe the process parameters relevant to production of enzyme by means of
solid-state fermentation.
2.2.3.1 Process Parameters
This section addresses the process parameters of solid-state fermentation with emphasis
on the production of enzymes. Besides temporal and spatial variation of the parameters,
a mutual interaction exists between the parameters (Smits, 1998). The increase in
fermentation temperature leads to changes in the rates of microbial growth and
metabolic activity. The temperature changes in solid bed differ locally, and eventually
cause microbial growth and metabolic activity to differ at varied spots of the bed.
Therefore, the interaction between/among the parameters determines the complexity of
a solid-state fermentation process (Smits, 1998).
The process parameters that are commonly investigated in solid-state fermentation are
(i) substrate loading; (ii) initial moisture content of solid substrate; (iii) initial pH of
moistening agent; (iv) fermentation duration; (v) fermentation temperature; (vi)
agitation and aeration; (vii) inoculum loading; and (viii) inclusion of
inducer/supplementation.
(i) Substrate Loading
The level of substrate loading influences the porosity and aeration of the substrate in
solid-state fermentation conducted in flasks as well as tray solid-state fermentation
process (Ellaiah et al., 2002). Substrate weight-to-flask volume ratio of 1:25 and 1:50
are most commonly applied in laboratory-scale solid-state fermentation investigation to
provide sufficient air in the headspace of the fermenter to cater for microbial growth
and activity.
32
(ii) Initial Moisture Content of Solid Substrate
Moisture content is closely related to the definition of solid-state fermentation, and with
the characteristics of the lignocellulosic materials (Rodriguez-Leon et al., 2008a).
Hence, moisture content of solid substrate in solid-state fermentation is a critical
parameter for growth, biosynthesis and secretion of metabolites like enzymes (Ellaiah et
al., 2002; Ramachandran et al., 2004). Moisture level is governed by the nature of
substrate, type of end-product and the requirement of the microbe (Lonsane et al.,
1985). Manipulation of this parameter could modify the metabolic production or
excretion of a microorganism (Pandey, 2003). This is because the synthesis of enzyme
by the fungus is affected by the variation in initial moisture content of solid substrate,
and the availability of moisture.
Moisture content of a substrate is affected by its composition and structure. The type of
microorganism that can grow in a solid-state fermentation system is determined by
water activity (Pandey, 2003). In fungal solid-state fermentation, the moisture content
of solid matrix oscillates between 20 to 70% (Perez-Guerra et al., 2003; Rodriguez-
Leon et al., 2008a). The wide range of applicable moisture content is advantageous for
the development of a specific solid-state fermentation process. Besides, it also has a
marked effect on growth kinetics on the fungus used in solid-state fermentation
(Raimbault, 1998). Thus, the desirable moisture content level depends on both the
fungus and solid substrate used.
(iii) Initial pH of Moistening Agent
The pH of substrate may change during solid-state fermentation due to fungal metabolic
activities. During the process, fungus secretes organic acids such as citric, acetic or
33
lactic acids, which cause decrement in the pH, and thus, the kinetics of pH variation is
depended on the fungal strain (Raimbault, 1998). Besides, nature of substrate also has
influence on the pH kinetics mainly due to the buffering effect of lignocellulosic
materials (Raimbault, 1998). Fungus has an optimal pH range between 3.5 and 6.0 for
its growth and activity (Rodriguez-Leon et al., 2008a) as fungal metabolic activities are
very sensitive to changes in pH. Similar to initial moisture content, fungal activity is
affected if pH level is higher or lower compared to the optimum (Ellaiah et al., 2002). It
is suggested that a slightly low pH is preferable for ligninolytic enzymes production via
fungal fermentation. However, too low pH is not beneficial for laccase enzyme
production, which might be due to their susceptibility to acidic proteases (Mansur et al.,
2003).
(iv) Fermentation Duration
The duration of fungal fermentation in enzyme production is closely related to the other
parameters, such as inoculum preparation, type and nature of substrate, and conditions
that favour the growth and enzyme production of the fungus. Solid-state fermentation of
various lignocellulosic biomasses for laccase enzyme production using Pleurotus
ostreatus exhibited the first sign of growth after 2 – 3 days of incubation and complete
colonization of substrates within 8 days of fermentation with maximum laccase activity
on day 8 of incubation for the substrates (Patel et al., 2009).
It might seem that longer incubation duration is favourable for solid-state fermentation
as there is sufficient time for the fungus to colonize and produce desired enzyme
products. However, prolong fermentation duration is not beneficial for enzyme
production as incubation beyond the maximum period of 72 hours resulted in decreased
34
α-amylase enzyme and biomass production, which might be owing to exhausted
substrate nutrient and limited space for growth (Ramachandran et al., 2004).
(v) Fermentation Temperature
Temperature is an important parameter influencing fungal metabolic patterns in solid-
state fermentation (Ramachandran et al., 2004). It affects the fungal growth,
formation/germination of spores, formation of products, denaturation of protein or
enzyme, promotion or inhibition on metabolites production, and cell death (Pandey,
2003; Rodriguez-Leon et al., 2008a). A solid-state fermentation study demonstrated
little laccase enzyme activity by Pleurotus ostreatus at temperatures other than the
optimal fermentation temperature (28oC), and also no fungal growth was observed at
50oC due to drying of substrate (Patel et al., 2009). Therefore, fermentation temperature
is a significant consideration in the development of biological processes.
In general, fungal growth in aerobic fermentations result in the increase of solid bed
temperature, where the rise in temperature is caused by the heat released from
exothermic fungal respiration (Perez-Guerra et al., 2003; Rodriguez-Leon et al., 2008a).
Due to the limited thermal conductivity and low moisture content of the lignocellulosic
biomass, insufficient heat removal also can lead to the formation of thermal gradient in
the solid bed (Perez-Guerra et al., 2003; Raimbault, 1998). In addition, heterogeneity
nature of the lignocellulosic biomass too contributes to the development of temperature
gradients (Rodriguez-Leon et al., 2008a). As a summary, the degree of temperature
increase depends on the type of microbe employed, and the porosity, particle size and
depth of the substrate bed (Gervais and Molin, 2003).
35
(vi) Agitation and Aeration
In solid-state fermentation, the reduced liquid phase that is approximately the water
holding capacity of the biomass presents a high viscosity to the solid substrate (Gervais
and Molin, 2003). Agitation/mixing improves homogeneity and disrupt temperature
gradients of solid substrate (Rodriguez-Leon et al., 2008a). Unlike liquid-
state/submerged fermentations, it is difficult to mix or agitate solid substrate in solid-
state fermentation (Gervais and Molin, 2003). Even though agitation improves
homogeneity and helps to control temperature of substrate bed (Perez-Guerra et al.,
2003; Rodriguez-Leon et al., 2008a), excessive agitation imposes great shear forces that
disrupt the integrity of microbial cell particularly when mycelial fungi are used in solid-
state fermentation (Gervais and Molin, 2003). Fungal mycelium was damaged when
agitation was constantly applied to mix the solid substrate. Therefore, intermittent
agitation is usually employed in solid-state fermentation to avoid causing damage to the
fungal mycelium (Rodriguez-Leon et al., 2008a).
Unlike agitation/mixing, aeration can be easily applied in solid-state fermentation
compared to liquid-state/submerged fermentation due to free access of atmospheric air
to the solid substrate to maintain aerobic conditions, desorption of carbon dioxide, and
regulation of substrate temperature and moisture level (Gervais and Molin, 2003;
Raimbault, 1998). Gaseous exchange in aeration is important in solid-state fermentation
as the gas environment affects the relative production of biomass and enzyme
(Raimbault, 1998).
Aeration also serves important function in heat and moisture transfer between the solid
and gas phases (Pandey, 2003; Raimbault, 1998). Without aeration, heat removal is very
slow due to low thermal conductivity of the substrate (Pandey, 2003). Therefore,

36
aeration is employed to control temperature of the substrate during solid-state
fermentation (Raimbault, 1998). In contrast, high aeration rate reduces moisture content
of the solid substrate by evaporation (Raghavarao et al., 2003). In cases whereby high
aeration rate reduces moisture content of solid substrate, water-saturated air is supplied
(Rodriguez-Leon et al., 2008a).
(vii) Inoculum Loading
The determination of an optimum inoculum loading is one of the crucial steps in solid-
state fermentation. A low inoculum loading may be insufficient to initiate the growth of
microbe and longer time is required for the microbe to multiply to adequate amount for
substrate utilization and production of desired product (Ramachandran et al., 2004). On
the other hand, a high inoculum loading may result in competitive inhibition on
microbial growth (Ellaiah et al., 2002; Kunamneni et al., 2005), and decrease microbial
metabolic activity due to fast depletion of nutrients (Patel et al., 2009). Thus, a suitable
loading of inoculum is needed to ensure a rapid proliferation and synthesis of microbial
biomass by striking a balance between growth and nutrient availability (Ramachandran
et al., 2004).
(viii) Inclusion of Inducer/Supplementation
The production of enzymes by microbes in fermentations can be stimulated by the
addition of a variety of inducing substances depending on the targeted enzymes (Osma
et al., 2011). Inducing substances such as surfactants can reduce surface tension of the
liquid adsorbed on the solid substrate. One commonly used surfactant in fermentations
is Tween 80 that increases the bioavailability of less soluble substrates for microbial
growth and stimulates the growth of fungal spores (Zheng and Obbard, 2001).
37
Besides surfactants, some micronutrients play important role in inducing ligninolytic
enzymes transcription and production, and also as metal activator for the enzymes. In
the case of laccase enzyme, copper is essential to induce the expression and production
of the enzyme from fungi (Palmieri et al., 2000; Patrick et al., 2011; Rajendran et al.,
2011). This element is also a co-factor for laccase enzyme where each of four copper
ions is associated with a single polypeptide chain. The threshold concentration of
copper sulphate leading to suppression of fungal laccase expression varies with
microbes and types of fermentation.
Furthermore, some aromatic compounds like 2,5-xylidine, lignosulfonates, veratryl
alcohol, ferulic acid, vanillic acid, coumaric acid and Kraft lignin (Barbosa et al., 1996;
Eggert et al., 1996; Halaburgi et al., 2011; Xiao et al., 2003) have inducing effect on
fungal ligninolytic enzymes production. The aromatic inducers such as veratryl alcohol
serve as secondary metabolite that plays crucial role in the degradation of lignin
(Barbosa et al., 1996). However, some aromatic compounds like guaiacol and
syringaldehyde do not have significant effect in inducing fungal laccase enzyme
production (Eggert et al., 1996; Halaburgi et al., 2011).
Supplementations of carbon and nitrogen encourage the adaptation of fungus in
fermentation and they are useful for the production of ligninolytic enzymes (Patel et al.,
2009). The addition of carbon source such as simple sugars promotes fungal growth and
allow rapid establishment of the fungus on the solid substrate. Nevertheless, the
presence of easily metabolised carbon source accelerates the degradation of lignin from
lignocellulosic substrate (Kirk et al., 1976).
38
2.2.4 Isolation and Purification of Products
In fermentations, the desired product is often released into the aqueous phase. The
fermentation product of liquid-state/submerged fermentation is released into the liquid
culture medium, whereas fermentation product of solid-state fermentation is released
into the thin liquid layer on the solid substrate. Thus, extraction of the desired product is
done by separating it from microbial cells and substrate constituents (Riviere, 1977). In
solid-state fermentation, the commonly used solvents or extractants for harvesting
enzymes are distilled water with or without the surfactant Tween 80 (Ramachandran et
al., 2004; Rezende et al., 2002), and buffer solution i.e. acetate buffer (pH 4.5) (Cruz-
Cordova et al., 1999). During extraction, the mixture of fermented solid substrate and
solvent is agitated before they are centrifuged or pressed to get the clear supernatant,
which is the crude enzyme filtrate.
Crude laccase enzyme filtrates have low enzyme activity. To obtain preparations with
higher enzyme activity and purity, further purification steps are required. A generalized
procedure for purification of laccase enzyme includes the concentration of crude
enzyme filtrate, dialysis in removing small and unwanted compounds, and separation of
targeted protein by chromatography (Coll et al., 1993; Khammuang and Sarnthima,
2009; Mansur et al., 2003).
2.3 Modelling of Solid-State Fermentation
From industrial perspective, monitoring and controlling solid-state fermentation
parameters are critical for scaling-up. However, scaling-up of solid-state fermentation
processes is complicated and unreliable. This is due to difference in the growth
conditions of microbe in large-scale fermenter compared to laboratory-scale fermenter
(Toca-Herrera et al., 2007). The inhomogeneity of solid substrate complicates drawing
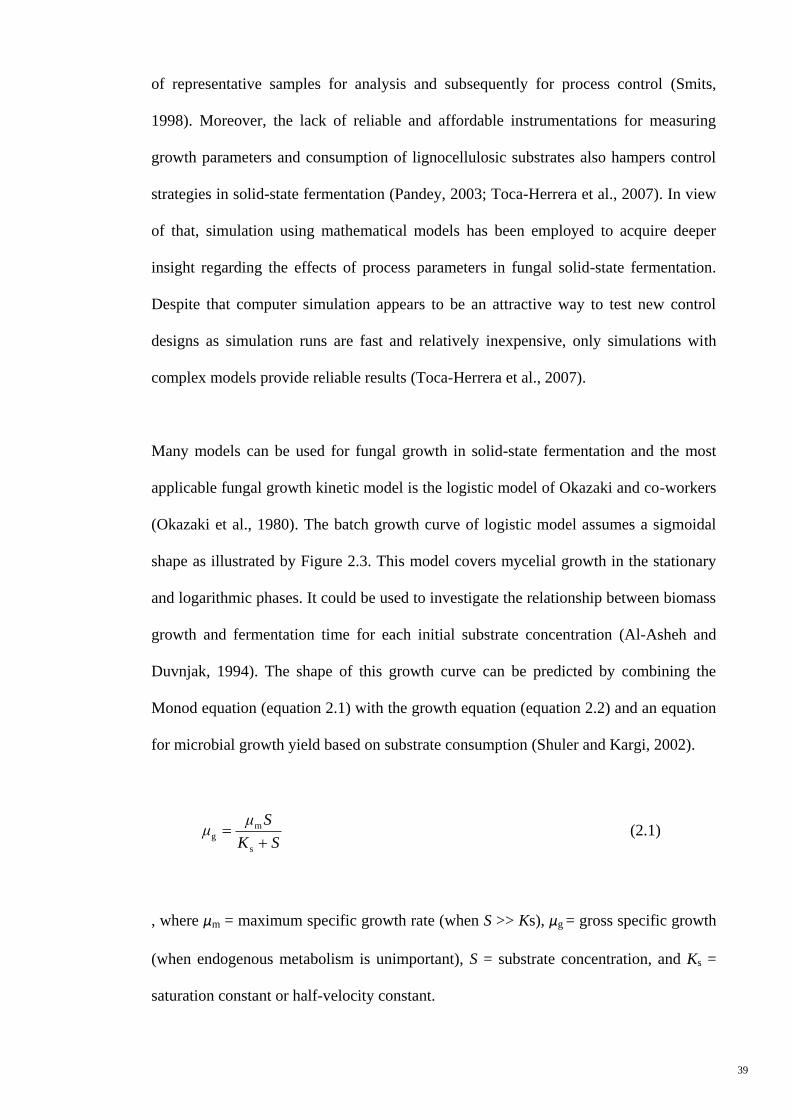
39
of representative samples for analysis and subsequently for process control (Smits,
1998). Moreover, the lack of reliable and affordable instrumentations for measuring
growth parameters and consumption of lignocellulosic substrates also hampers control
strategies in solid-state fermentation (Pandey, 2003; Toca-Herrera et al., 2007). In view
of that, simulation using mathematical models has been employed to acquire deeper
insight regarding the effects of process parameters in fungal solid-state fermentation.
Despite that computer simulation appears to be an attractive way to test new control
designs as simulation runs are fast and relatively inexpensive, only simulations with
complex models provide reliable results (Toca-Herrera et al., 2007).
Many models can be used for fungal growth in solid-state fermentation and the most
applicable fungal growth kinetic model is the logistic model of Okazaki and co-workers
(Okazaki et al., 1980). The batch growth curve of logistic model assumes a sigmoidal
shape as illustrated by Figure 2.3. This model covers mycelial growth in the stationary
and logarithmic phases. It could be used to investigate the relationship between biomass
growth and fermentation time for each initial substrate concentration (Al-Asheh and
Duvnjak, 1994). The shape of this growth curve can be predicted by combining the
Monod equation (equation 2.1) with the growth equation (equation 2.2) and an equation
for microbial growth yield based on substrate consumption (Shuler and Kargi, 2002).
SK
Sμμ
s
mg (2.1)
, where μm = maximum specific growth rate (when S >> Ks), μg = gross specific growth
(when endogenous metabolism is unimportant), S = substrate concentration, and Ks =
saturation constant or half-velocity constant.
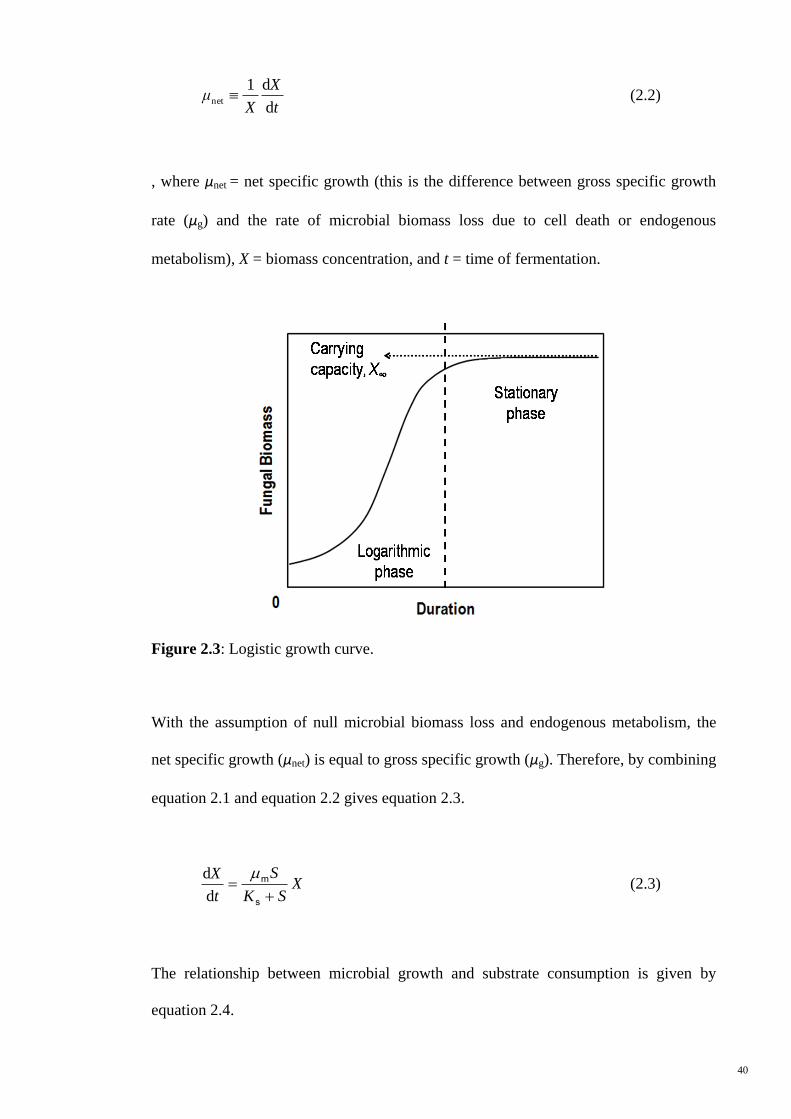
40
t
X
Xμ
d
d1net (2.2)
, where μnet = net specific growth (this is the difference between gross specific growth
rate (μg) and the rate of microbial biomass loss due to cell death or endogenous
metabolism), X = biomass concentration, and t = time of fermentation.
Figure 2.3: Logistic growth curve.
With the assumption of null microbial biomass loss and endogenous metabolism, the
net specific growth (μnet) is equal to gross specific growth (μg). Therefore, by combining
equation 2.1 and equation 2.2 gives equation 2.3.
XSK
S
t
X
s
m
d
d (2.3)
The relationship between microbial growth and substrate consumption is given by
equation 2.4.
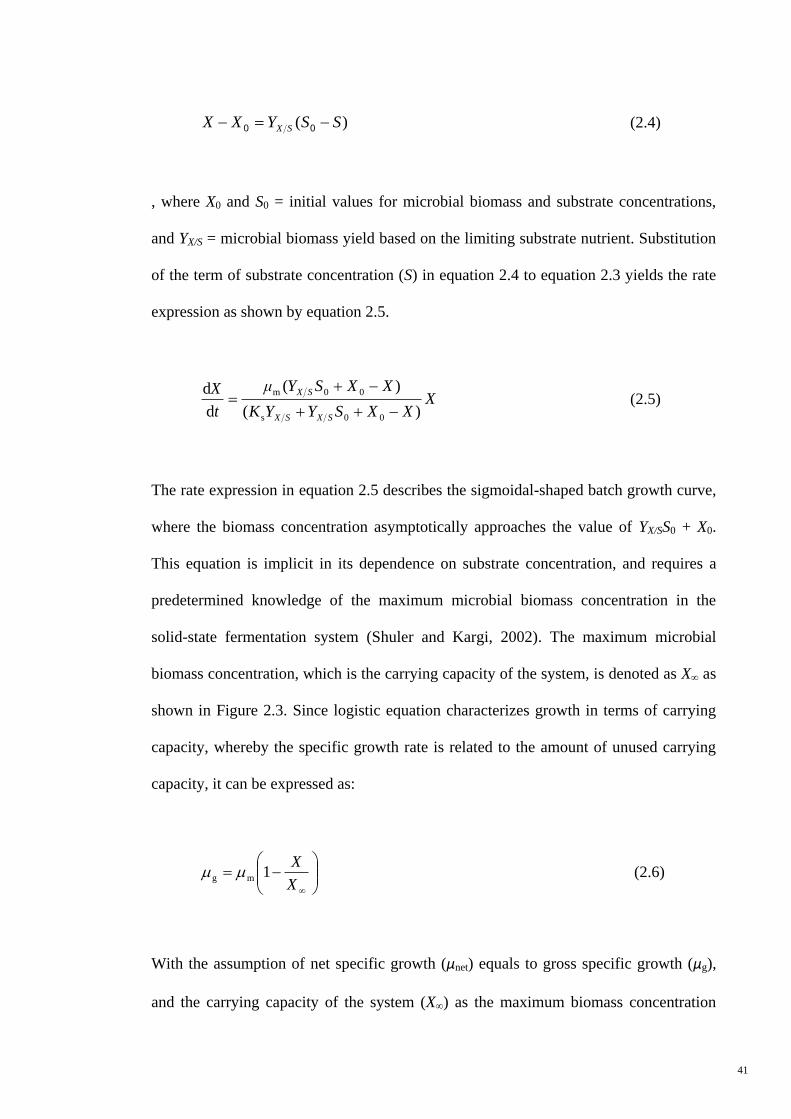
41
)( SSYXX SX 00 (2.4)
, where X0 and S0 = initial values for microbial biomass and substrate concentrations,
and YX/S = microbial biomass yield based on the limiting substrate nutrient. Substitution
of the term of substrate concentration (S) in equation 2.4 to equation 2.3 yields the rate
expression as shown by equation 2.5.
XXXSYYK
XXSYμ
t
X
SXSX
SX
)(
)(
d
d
00s
00m
(2.5)
The rate expression in equation 2.5 describes the sigmoidal-shaped batch growth curve,
where the biomass concentration asymptotically approaches the value of YX/SS0 + X0.
This equation is implicit in its dependence on substrate concentration, and requires a
predetermined knowledge of the maximum microbial biomass concentration in the
solid-state fermentation system (Shuler and Kargi, 2002). The maximum microbial
biomass concentration, which is the carrying capacity of the system, is denoted as X∞ as
shown in Figure 2.3. Since logistic equation characterizes growth in terms of carrying
capacity, whereby the specific growth rate is related to the amount of unused carrying
capacity, it can be expressed as:
X
X1mg (2.6)
With the assumption of net specific growth (μnet) equals to gross specific growth (μg),
and the carrying capacity of the system (X∞) as the maximum biomass concentration
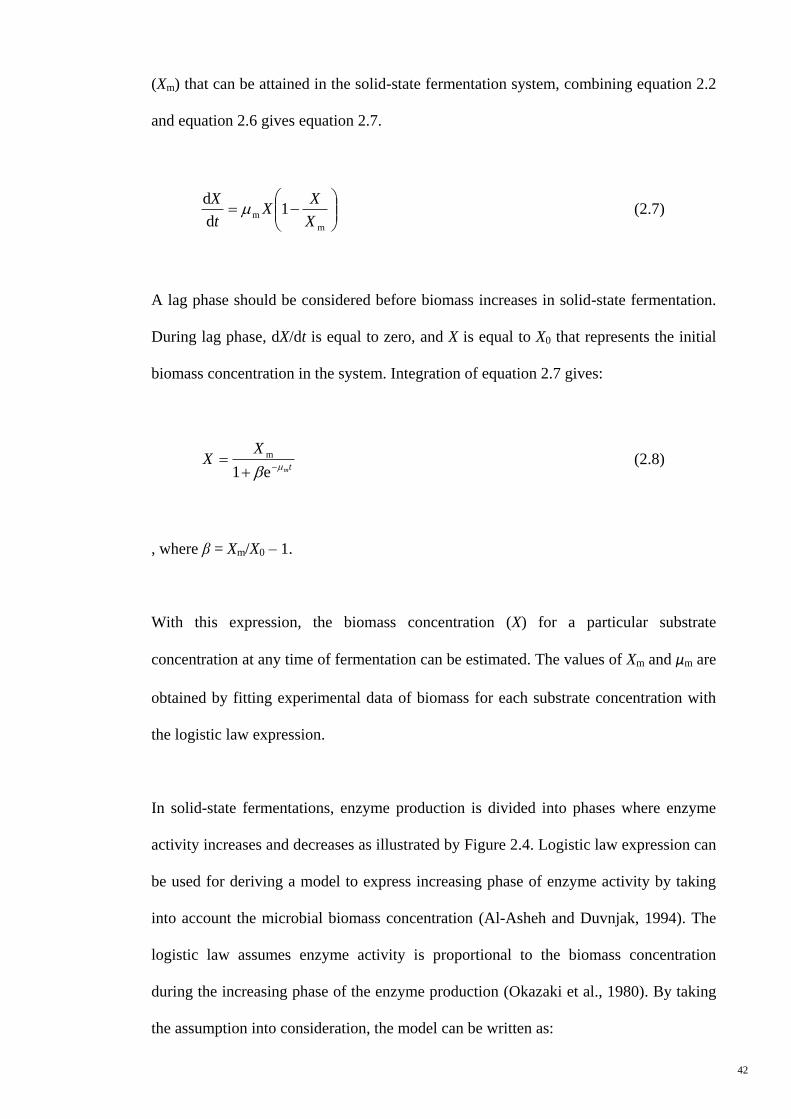
42
(Xm) that can be attained in the solid-state fermentation system, combining equation 2.2
and equation 2.6 gives equation 2.7.
m
m 1d
d
X
XX
t
X (2.7)
A lag phase should be considered before biomass increases in solid-state fermentation.
During lag phase, dX/dt is equal to zero, and X is equal to X0 that represents the initial
biomass concentration in the system. Integration of equation 2.7 gives:
tm
XX
e1
m (2.8)
, where β = Xm/X0 – 1.
With this expression, the biomass concentration (X) for a particular substrate
concentration at any time of fermentation can be estimated. The values of Xm and μm are
obtained by fitting experimental data of biomass for each substrate concentration with
the logistic law expression.
In solid-state fermentations, enzyme production is divided into phases where enzyme
activity increases and decreases as illustrated by Figure 2.4. Logistic law expression can
be used for deriving a model to express increasing phase of enzyme activity by taking
into account the microbial biomass concentration (Al-Asheh and Duvnjak, 1994). The
logistic law assumes enzyme activity is proportional to the biomass concentration
during the increasing phase of the enzyme production (Okazaki et al., 1980). By taking
the assumption into consideration, the model can be written as:

43
Xkt
vd
d
(2.9)
, where υ = enzyme activity, and kv = rate constant for enzyme production. Substitution
of equation 2.8 into equation 2.9 gives,
te
Xk
t m1d
d mv
(2.10)
At initial condition, υ is equal to υ0 that represents the enzyme activity after inoculation.
Integration of equation 2.10 leads to equation 2.11, which relates enzyme concentration
with fermentation duration and the parameters of logistic law.
1lnmv
teXk m
m
0 (2.11)
Figure 2.4: Increasing and decreasing phases of enzyme production.
44
When the enzyme activity has achieved a maximal value, enzyme activity decreases as
fermentation duration is prolonged (Figure 2.4). Unlike the increasing phase, the
production of enzyme activity does not increase with microbial biomass concentration
during the decay phase, but behave independently of the microbial growth. The
decrease in enzyme activity is dependent on the concentration of enzyme, and the latter
is dependent on the production of hydrolytic enzymes that reduce enzyme activity (Al-
Asheh and Duvnjak, 1994). In view of the logistic expression for increasing phase of
enzyme production cannot predict the decay phase of enzyme production, another
model is required. There are relatively few studies conducted on the decay phase of
enzyme production because batch solid-state fermentation processes usually are
terminated before the start of this phase (Al-Asheh and Duvnjak, 1994).
45
CHAPTER 3
MATERIALS AND METHODS
3.1 Characterization of Rice Husk
Rice husk sample was characterized using the Association of Official Analytical
Chemists (AOAC) official methods (2005). The moisture, ash, cellulose, hemicellulose,
and lignin contents of the rice husk sample were determined and the methodology for
each determination was detailed in the following sub-sections.
3.1.1 Preparation of Rice Husk Sample
Rice husk sample was collected from a rice mill in Sekinchan, Selangor, Malaysia. The
rice husk was washed and dried at 55oC before being ground into smaller particle size
(about 30 mesh size) using a blender (Waring®
Commercial, model 32BL80). Ground
rice husk was stored in a dry cabinet prior to use.
3.1.2 Determination of Moisture Content
The moisture content of rice husk sample was determined with AOAC Official Method
934.01 (2005). 2 g of rice husk sample was dried in a drying dish at 100oC overnight
until reaching a constant weight. The weights of the sample before and after drying
were recorded. The moisture content (%, w/w) of rice husk was estimated by equation
3.1 based on loss on drying (LOD) of rice husk sample. The moisture content value was
reported as an average of five test portions.
(g)husk wt Rice
(g) wt LOD100 (w/w) % Moisture, (3.1)

46
3.1.3 Determination of Ash Content
The ash content of rice husk sample was determined with AOAC Official Method
942.05 (2005). 2 g rice husk sample was weighed in a porcelain crucible and placed in a
pre-heated furnace at 600oC for 3 hours. The crucible was cooled in an oven at 100
oC
for 1 hour before it was further cooled to room temperature in a desiccator. The carbon-
free ash was weighed immediately and the average ash content (%, w/w) of five test
portions was estimated by equation 3.2.
(g)husk wt Rice
(g) wt ashingon Loss-(g)husk wt Rice100 (w/w) % Ash, (3.2)
3.1.4 Determination of Acid-Detergent Fibre and H2SO4 Lignin Contents
Sulphuric acid solutions of 0.5 M and 72.0% (w/v) were prepared from concentrated
H2SO4 (96%, w/v; analytical grade, Fisher Scientific) using volumetric flasks in cooling
bath. The acid-detergent solution was prepared by dissolving 10 g of N-cetyl-N, N, N-
trimethyl-ammonium bromide (analytical grade, Merck) in 1 L of 0.5 M H2SO4
standardized previously. The solution was stirred using a magnetic stirrer (B. Braun,
model REO-S9) at a moderate speed until the detergent was completely dissolved.
Acid-detergent fibre (ADF) and H2SO4 lignin contents of rice husk sample were
determined with AOAC Official Method 973.18 (2005). This method starts with the
extraction of ADF followed by digestion of the sample with 72.0% (w/v) H2SO4. The
weight of a 50 ml Gooch crucible of porosity grade 3 (W1) was recorded after drying
overnight at 105oC. Approximately 1 g of rice husk sample was weighed (W2) into a
500 ml round bottom flask. 100 ml acid-detergent solution was added to the rice husk
sample. The rice husk-acid-detergent solution mixture was refluxed for 60 minutes from
the onset of boiling. After the acid-detergent extraction, the flask was removed from the
47
heating unit, and the content was filtered into a pre-weighed Gooch crucible to remove
the acid-detergent solution. Then, the rice husk residue was rinsed with hot water in the
crucible, and the sample was soaked in ~40 ml of hot water for 5 minutes before the hot
water was removed by vacuum filtration. The hot water soaking was repeated twice
prior to soaking in ~40 ml of acetone (analytical grade, Merck) for 5 minutes in
duplicate. Lastly, the sample was dried overnight at 105oC and weighed (W3). The
Gooch crucible was allowed to cool for about 15 minutes in a desiccator before
weighing. Blank sample was treated in the same manner without rice husk sample. The
average ADF percentage of five test portions was estimated by equation 3.3.
2
1313100 (w/w) % ADF,W
BBWW (3.3)
, where W1 = weight of oven dried empty crucible,
W2 = weight of rice husk sample test portion,
W3 = weight of oven dried crucible with sample after acid-detergent extraction,
B1 = weight of oven dried empty crucible before acid-detergent extraction, and
B3 = weight of oven dried empty crucible after acid-detergent extraction.
The acid-detergent extracted rice husk was used for the subsequent determination of
H2SO4 lignin content. The rice husk sample in Gooch crucible was covered with cooled
72% (w/v) H2SO4 to about three quarter of the crucible. The content was allowed to
stand for 3 hours, and it was stirred hourly to break up lumps. After which the H2SO4
was removed by vacuum filtration and the sample was washed with hot water until acid
free to non-bleeding pH-indicator strips (Merck). The sample was dried overnight at
100oC and weighed (W4). Following that, the sample was ignited at 500
oC in a furnace
(Thermconcept, model KL15/11) for 2 hours. The crucible was cooled in an oven
48
maintained at 100oC for an hour before it was cooled in a desiccator and weighed (W5).
The average H2SO4 lignin content of five test portions was estimated by equation 3.4.
2
5454
42 100 (w/w) % Lignin, SOHW
BBWW (3.4)
, where W2 = weight of rice husk sample test portion,
W4 = weight of oven dried crucible with sample after H2SO4 hydrolysis,
W5 = weight of crucible with sample after ashing,
B4 = weight of oven dried empty crucible after H2SO4 hydrolysis, and
B5 = weight of empty crucible after ashing.
3.1.5 Determination of Neutral-Detergent Fibre Content
Neutral-detergent (ND) solution was prepared by dissolving 18.6 g
ethylenediaminetetraacetic acid disodium (disodium EDTA, Merck), 4.56 g dibasic
sodium phosphate (Na2HPO4, Merck), 6.81 g sodium borate decahydrate
(Na2B4O7.10H2O, Sigma-Aldrich), 30 g sodium dodecyl sulphate (SDS, Merck), and 10
ml triethylene glycol (Merck) in distilled water and the volume was adjusted to 1 L. The
pH of the ND solution was verified and adjusted to between 6.95 and 7.05 with HCl or
NaOH, if necessary. The ND solution was stored at room temperature prior to be used
in NDF content determination. The Burke iodine solution was prepared using 20 g/L
potassium iodide (KI, Merck) and 10 g/L iodine (I2, Merck) in an opaque bottle.
NDF content of rice husk was determined with AOAC Official Method 2002.04 (2005).
The weight of a 50 ml Gooch crucible of porosity grade 3 (We) dried at 105oC was
recorded. Approximately 0.5 g of rice husk was weighed (S) into a 500 ml round bottom
flask. Next, ~50 ml ND solution and 0.5 g sodium sulphite anhydrous (Na2SO3, Merck)
49
were added to the sample, and the reaction mixture was heated to boiling. Upon the
onset of boiling, 2 ml of standardized α-amylase working solution was added to the
reaction mixture (refer to Appendix A: Standardization of working α-amylase for NDF
determination). The reaction mixture was refluxed for 60 minutes at boiling
temperature. Subsequently, the flask was removed from the heating unit and the
particles were allowed to settle for 30 to 60 seconds. The content of flask was filtered
into a pre-weighed Gooch crucible to remove ND solution, and particles attached on the
wall were rinsed with hot water into the crucible. The crucible was half-filled with hot
water and the second dose of 2 ml α-amylase working solution was added to the
solution and stirred. The α-amylase was allowed to react for 45 to 60 seconds before the
enzyme solution was removed, and the sample was soaked in ~40 ml of boiling water
for 5 minutes. The hot water soaking was repeated twice. The procedure was followed
by two times acetone soaking (~40 ml) for 5 minutes. After acetone soaking, the sample
was air dried for 10 to 60 minutes to remove excess acetone before it was dried at
105oC overnight and weighed (Wf). The crucible and its content were ignited at 500
oC
furnace for 5 hours or until the sample is carbon free. The hot crucible was tempered in
105oC for one hour before cooling down to room temperature in a desiccator and
weighed (Wa). Blank sample followed the same procedure without the rice husk sample.
The average aNDF (organic matter) (aNDFom) of five test portions was estimated by
equation 3.5.
2
afaf100 (w/w) % aNDFom,W
BBWW (3.5)
, where W2 = weight of rice husk sample test portion,
Wa = weight of crucible with sample after ashing,
Wf = weight of crucible with sample after amylase-treated ND extraction,
50
Bf = weight of empty crucible after amylase-treated ND extraction, and
Ba = weight of empty crucible after ashing.
3.2 Pretreatment of Rice Husk
Prior to pretreatment of rice husk, screening for both conventional and ionic liquid
dissolution pretreatments by assessing various pretreatment reagents were carried out.
For conventional pretreatment, the alkalis and acids screened were sodium hydroxide,
calcium hydroxide, sulphuric acid, hydrochloric acid, phosphoric acid, acetic acid, and
nitric acid. For ionic liquid dissolution pretreatment, the ionic liquids screened were 1-
butyl-3-methylimidazolium chloride, 1-ethyl-3-methylimidazolium acetate, and 1-ethyl-
3-methylimidazolium diethyl phosphate. The best performing pretreatment reagent was
selected and optimized in the subsequent rice husk pretreatment study.
3.2.1 Pretreatment Reagents
The alkaline solutions were prepared from pellets and powder of sodium hydroxide
(NaOH, Merck) and calcium hydroxide (Ca(OH)2, Sigma-Aldrich), respectively. The
acid solutions were prepared from concentrated acids, namely 96% sulphuric acid
(H2SO4, Fisher Scientific), 37% hydrochloric acid (HCl, Merck), 85% phosphoric acid
(H3PO4, Ajax Chemicals), 99.8% glacial acetic acid (CH3COOH, Riedel-de Haen) and
65% nitric acid (HNO3, Scharlau Chemie).
The ionic liquids 1-butyl-3-methylimidazolium chloride ([BMIM]Cl, Merck), 1-ethyl-3-
methylimidazolium acetate ([EMIM]OAc, Sigma-Aldrich) and 1-ethyl-3-
methylimidazolium diethyl phosphate ([EMIM]DEP, Sigma-Aldrich) were used without
further purification. The chemical structures of the ionic liquids are shown in Figure
3.1.
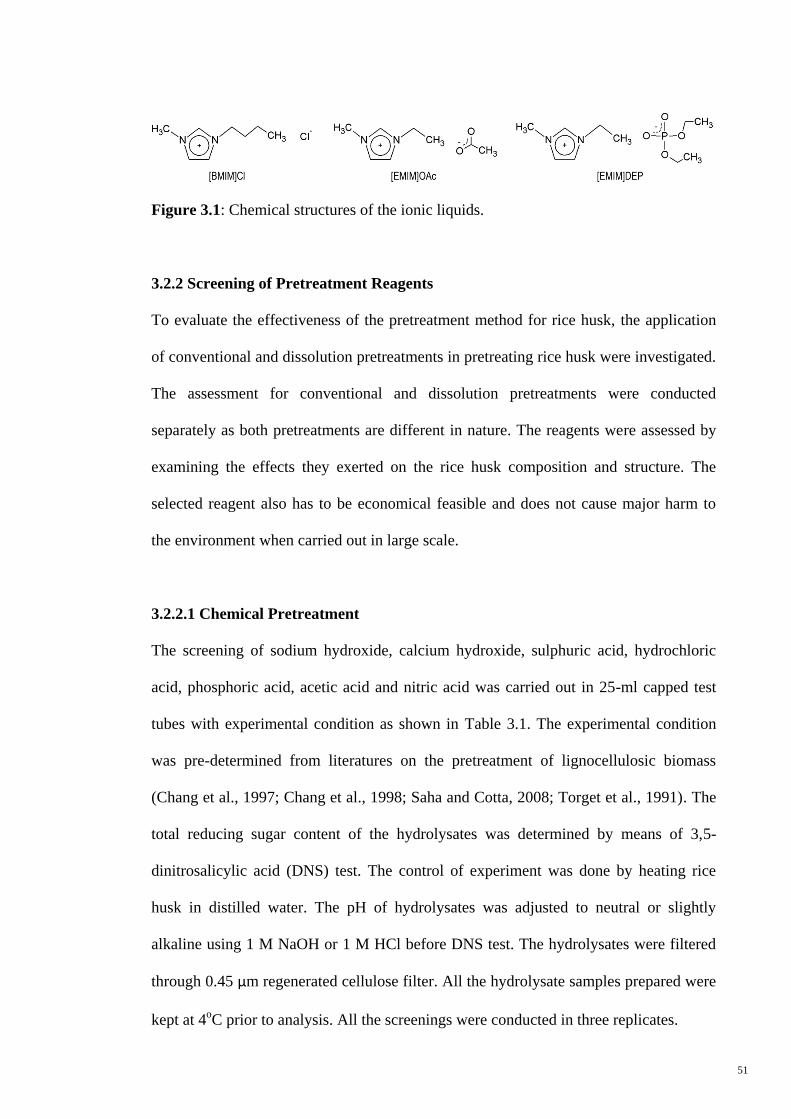
51
Figure 3.1: Chemical structures of the ionic liquids.
3.2.2 Screening of Pretreatment Reagents
To evaluate the effectiveness of the pretreatment method for rice husk, the application
of conventional and dissolution pretreatments in pretreating rice husk were investigated.
The assessment for conventional and dissolution pretreatments were conducted
separately as both pretreatments are different in nature. The reagents were assessed by
examining the effects they exerted on the rice husk composition and structure. The
selected reagent also has to be economical feasible and does not cause major harm to
the environment when carried out in large scale.
3.2.2.1 Chemical Pretreatment
The screening of sodium hydroxide, calcium hydroxide, sulphuric acid, hydrochloric
acid, phosphoric acid, acetic acid and nitric acid was carried out in 25-ml capped test
tubes with experimental condition as shown in Table 3.1. The experimental condition
was pre-determined from literatures on the pretreatment of lignocellulosic biomass
(Chang et al., 1997; Chang et al., 1998; Saha and Cotta, 2008; Torget et al., 1991). The
total reducing sugar content of the hydrolysates was determined by means of 3,5-
dinitrosalicylic acid (DNS) test. The control of experiment was done by heating rice
husk in distilled water. The pH of hydrolysates was adjusted to neutral or slightly
alkaline using 1 M NaOH or 1 M HCl before DNS test. The hydrolysates were filtered
through 0.45 µm regenerated cellulose filter. All the hydrolysate samples prepared were
kept at 4oC prior to analysis. All the screenings were conducted in three replicates.

52
Table 3.1: Screening condition for conventional pretreatment
Parameter Condition
Reagent loading 0.5% (w/v)
Rice husk loading 10% (w/v)
Water loading 10 ml/g
Pretreatment temperature 100 ± 1oC
Pretreatment duration 2 hours
The performance of the reagents was evaluated based on the amount of total reducing
sugar detected in the hydrolysate. Total reducing sugar content was employed as an
indirect indicator for the extent of rice husk pretreatment. Higher total reducing sugar
content in hydrolysate indicates more severe disruption of rice husk structure, and vice
versa.
3.2.2.2 Ionic Liquid Dissolution Pretreatment
The performance three ionic liquids, namely 1-butyl-3-methylimidazolium chloride, 1-
ethyl-3-methylimidazolium acetate, and 1-ethyl-3-methylimidazolium diethyl
phosphate, were evaluated. The ionic liquids selected were based on the dissolution and
regeneration of cellulose studies reported previously in the literature (Jagadeeswara Rao
et al., 2007; Li et al., 2009; Sun et al., 2009; Swatloski et al., 2002; Zhao et al., 2009;
Zhu et al., 2006).
Screening of ionic liquids for dissolution pretreatment was conducted in 25-ml capped
test tubes. The condition for dissolution pretreatment is shown in Table 3.2. The
reaction mixture of rice husk and ionic liquid was pretreated in an oil bath (Julabo MC
(V.2), Germany), and maintained at 100oC for 10 hours. At the end of the pretreatment,
the reaction mixture is consisted of ionic liquid-dissolved cellulose and undissolved rice
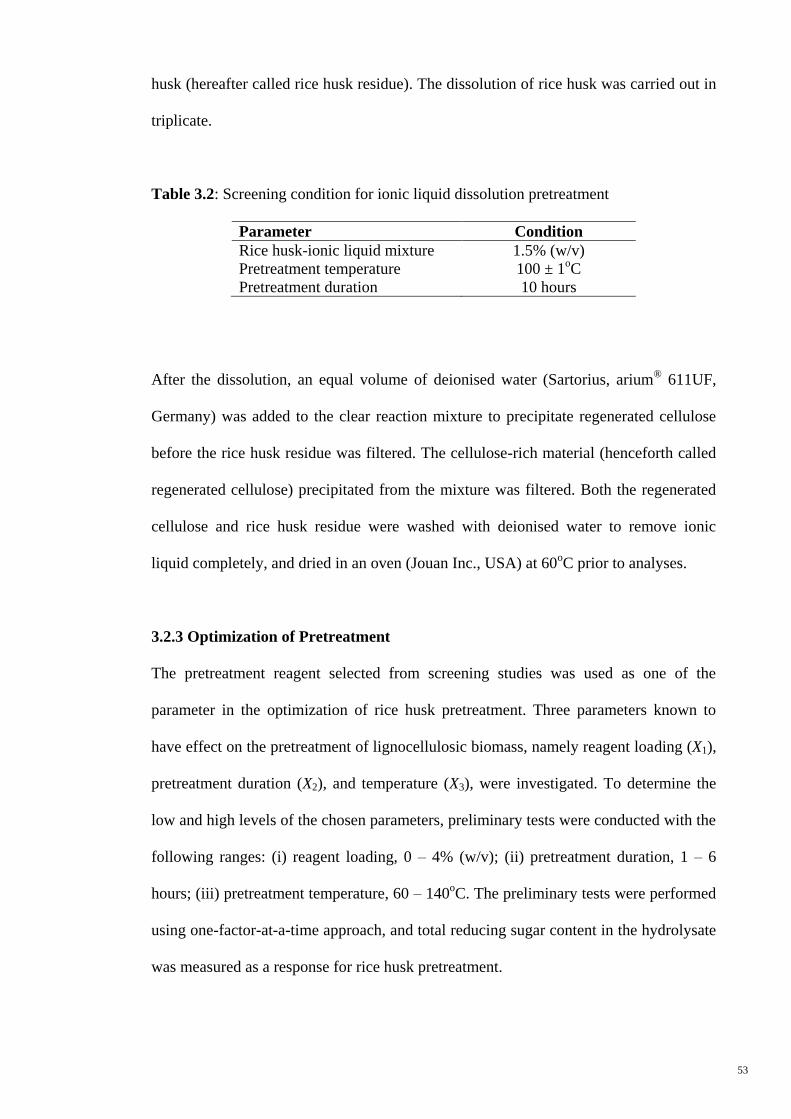
53
husk (hereafter called rice husk residue). The dissolution of rice husk was carried out in
triplicate.
Table 3.2: Screening condition for ionic liquid dissolution pretreatment
Parameter Condition
Rice husk-ionic liquid mixture 1.5% (w/v)
Pretreatment temperature 100 ± 1oC
Pretreatment duration 10 hours
After the dissolution, an equal volume of deionised water (Sartorius, arium®
611UF,
Germany) was added to the clear reaction mixture to precipitate regenerated cellulose
before the rice husk residue was filtered. The cellulose-rich material (henceforth called
regenerated cellulose) precipitated from the mixture was filtered. Both the regenerated
cellulose and rice husk residue were washed with deionised water to remove ionic
liquid completely, and dried in an oven (Jouan Inc., USA) at 60oC prior to analyses.
3.2.3 Optimization of Pretreatment
The pretreatment reagent selected from screening studies was used as one of the
parameter in the optimization of rice husk pretreatment. Three parameters known to
have effect on the pretreatment of lignocellulosic biomass, namely reagent loading (X1),
pretreatment duration (X2), and temperature (X3), were investigated. To determine the
low and high levels of the chosen parameters, preliminary tests were conducted with the
following ranges: (i) reagent loading, 0 – 4% (w/v); (ii) pretreatment duration, 1 – 6
hours; (iii) pretreatment temperature, 60 – 140oC. The preliminary tests were performed
using one-factor-at-a-time approach, and total reducing sugar content in the hydrolysate
was measured as a response for rice husk pretreatment.
54
The low and high levels of the parameters determined from the preliminary tests were
used in the optimization of rice husk pretreatment using Box-Behnken experimental
design (BBD). This design is a combination of 2k factorials with incomplete block
design consisted of 17 sets of experiments, including 5 replications of the centre point.
Total reducing sugar content of the hydrolysate was determined as response (Y). The
response was optimized with response surface methodology (RSM) with the ultimate
aim to maximize the release of total reducing sugar from rice husk pretreatment.
Regression analysis of data was performed with the aid of Design-Expert version 6.0.6
(Stat-Ease Inc., Minneapolis).
3.2.4 Analytical Methods
The total reducing sugar content in the hydrolysate from the pretreatment of rice husk
was determined by 3, 5-dinitrosalicylic acid (DNS) test. The chemical and structural
characteristics of the pretreated samples were analyzed using Fourier transform-infrared
(FT-IR) spectroscopy, X-ray diffraction (XRD), scanning electron microscopy (SEM),
and Brunauer, Emmett and Teller (BET) surface area analysis.
3.2.4.1 3, 5-dinitrosalicylic acid (DNS) Test
The DNS reagent containing 1% (w/v) 3,5-dinitrosalicyclic acid (DNS, Merck), 0.2%
(w/v) phenol (Merck), 0.05% sodium metabisulfite (Merck), and 1% (w/v) sodium
hydroxide (Merck) was prepared as outlined by Miller (1959). The stock solution was
prepared without sodium metabisulfite in an opaque bottle. Appropriate amount of
sodium metabisulfite was added to the aliquot prior to use. Rochelle salt solution (40%,
w/v) was prepared by dissolving sodium potassium tartrate in distilled water.
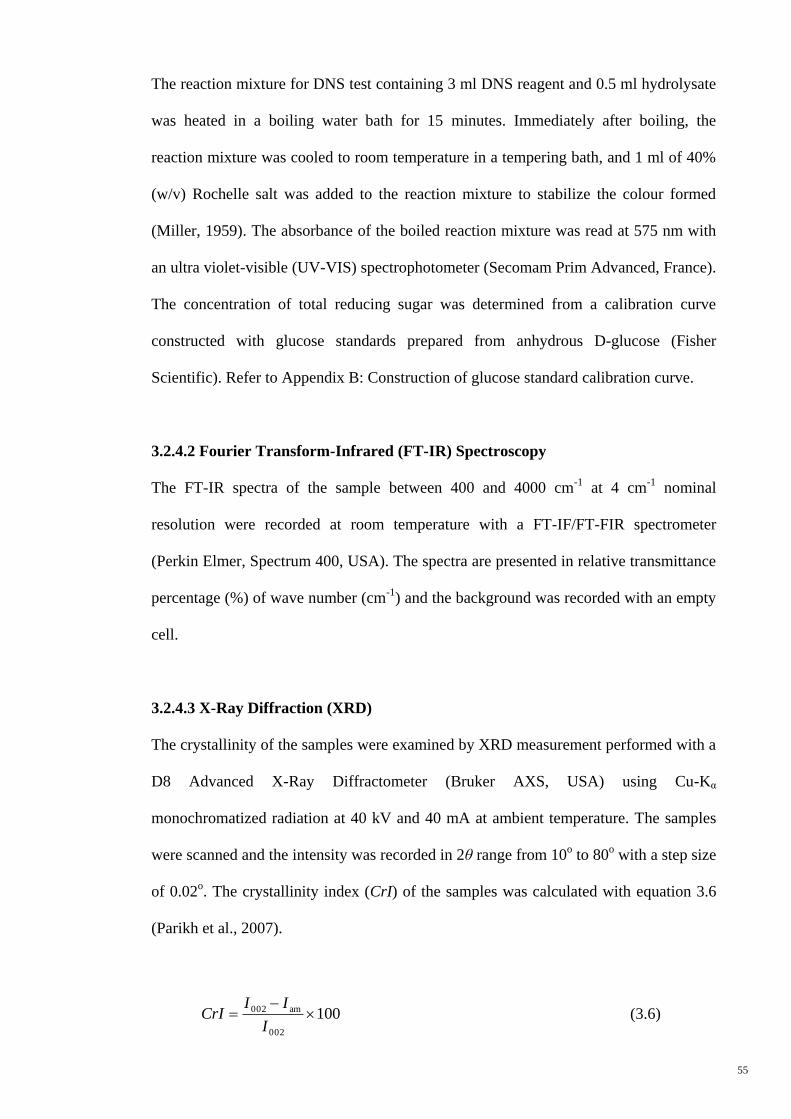
55
The reaction mixture for DNS test containing 3 ml DNS reagent and 0.5 ml hydrolysate
was heated in a boiling water bath for 15 minutes. Immediately after boiling, the
reaction mixture was cooled to room temperature in a tempering bath, and 1 ml of 40%
(w/v) Rochelle salt was added to the reaction mixture to stabilize the colour formed
(Miller, 1959). The absorbance of the boiled reaction mixture was read at 575 nm with
an ultra violet-visible (UV-VIS) spectrophotometer (Secomam Prim Advanced, France).
The concentration of total reducing sugar was determined from a calibration curve
constructed with glucose standards prepared from anhydrous D-glucose (Fisher
Scientific). Refer to Appendix B: Construction of glucose standard calibration curve.
3.2.4.2 Fourier Transform-Infrared (FT-IR) Spectroscopy
The FT-IR spectra of the sample between 400 and 4000 cm-1
at 4 cm-1
nominal
resolution were recorded at room temperature with a FT-IF/FT-FIR spectrometer
(Perkin Elmer, Spectrum 400, USA). The spectra are presented in relative transmittance
percentage (%) of wave number (cm-1
) and the background was recorded with an empty
cell.
3.2.4.3 X-Ray Diffraction (XRD)
The crystallinity of the samples were examined by XRD measurement performed with a
D8 Advanced X-Ray Diffractometer (Bruker AXS, USA) using Cu-Kα
monochromatized radiation at 40 kV and 40 mA at ambient temperature. The samples
were scanned and the intensity was recorded in 2θ range from 10o to 80
o with a step size
of 0.02o. The crystallinity index (CrI) of the samples was calculated with equation 3.6
(Parikh et al., 2007).
100002
am002
I
IICrI (3.6)
56
, where I002 = intensity of the diffraction from the 002 plane at 2θ = 22.6o (crystalline
area), and
Iam = intensity of the background scatter measured at 2θ = ~18.7o (amorphous
area).
3.2.4.4 Scanning Electron Microscopy (SEM)
The structural changes of the pretreated rice husk was assessed with scanning electron
microscope Quanta™
200 FESEM (FEI, USA) operated at 2 - 5 kV accelerating voltage
under low vacuum. Rice husk samples were affixed onto aluminium stubs with double
sided adhesive carbon tapes and examined without metal-coating.
3.2.4.5 Brunauer, Emmett and Teller (BET) Surface Area Determination
The surface area and average pore size samples were determined by nitrogen adsorption
isotherm at 77 K using a high-performance six-sample surface area and pore size
analyzer Autosorb®
-6B (Quantachrome, Florida, USA). The nitrogen adsorption-
desorption isotherm was operated at relative pressure P/P0 of 0.3, where P is the system
pressure and P0 is the initial pressure at 1 bar. The BET surface area of samples was
determined using equation 3.7.
0mm0
11
1
1
P
P
CW
C
CWPPW (3.7)
, where W = sample weight,
Wm = weight of constituting monolayer thickness of nitrogen coverage on
sample, and
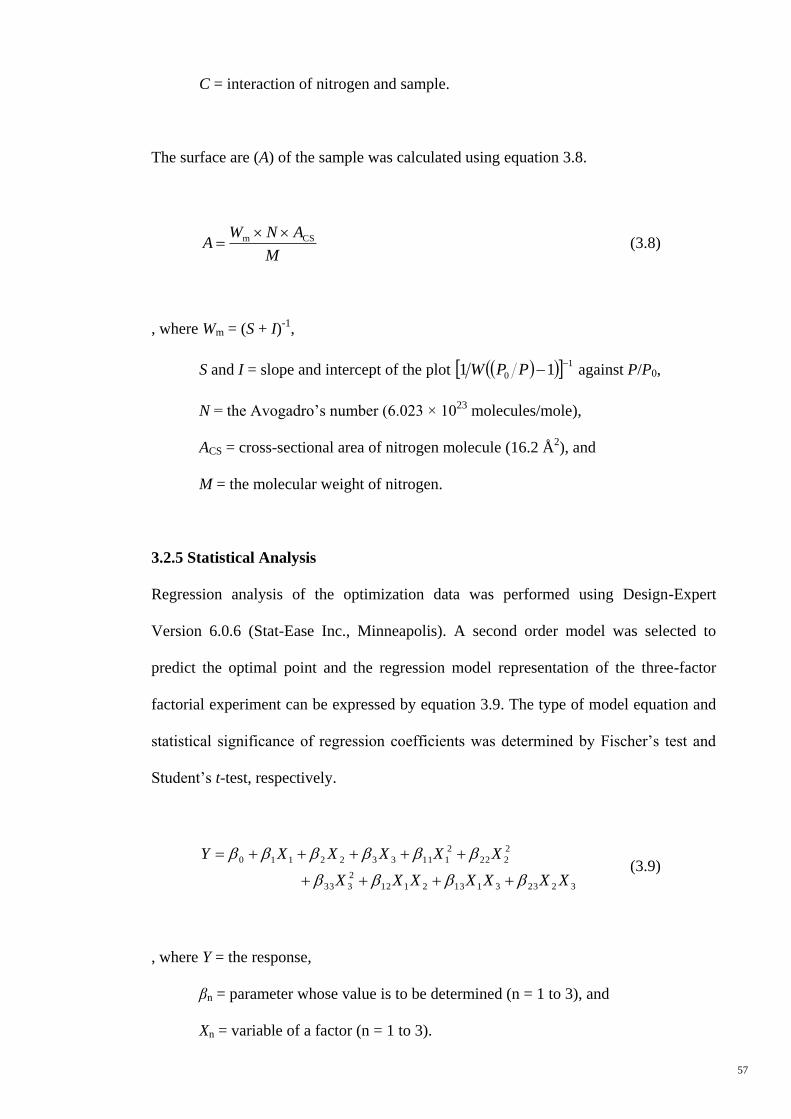
57
C = interaction of nitrogen and sample.
The surface are (A) of the sample was calculated using equation 3.8.
M
ANWA CSm (3.8)
, where Wm = (S + I)-1
,
S and I = slope and intercept of the plot 1
0 11
PPW against P/P0,
N = the Avogadro‟s number (6.023 × 10²³
molecules/mole),
ACS = cross-sectional area of nitrogen molecule (16.2 Å2), and
M = the molecular weight of nitrogen.
3.2.5 Statistical Analysis
Regression analysis of the optimization data was performed using Design-Expert
Version 6.0.6 (Stat-Ease Inc., Minneapolis). A second order model was selected to
predict the optimal point and the regression model representation of the three-factor
factorial experiment can be expressed by equation 3.9. The type of model equation and
statistical significance of regression coefficients was determined by Fischer‟s test and
Student‟s t-test, respectively.
322331132112
2
333
2
222
2
1113322110
XXXXXXX
XXXXXY
(3.9)
, where Y = the response,
βn = parameter whose value is to be determined (n = 1 to 3), and
Xn = variable of a factor (n = 1 to 3).
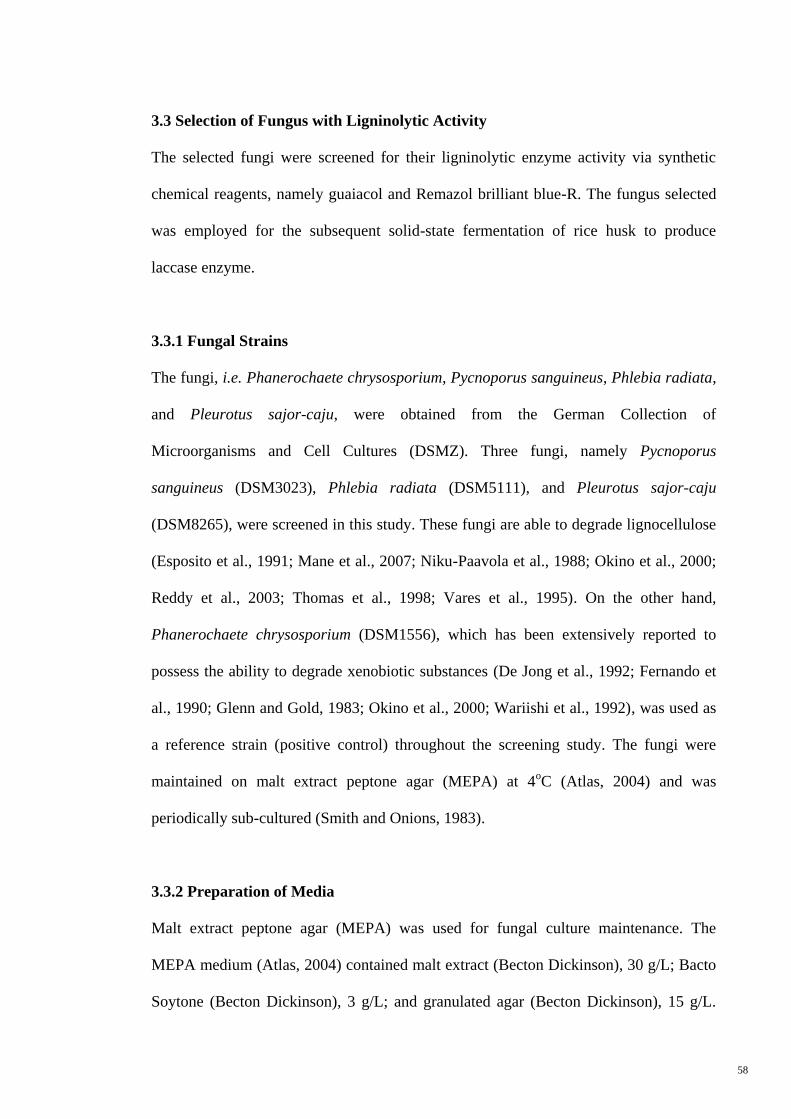
58
3.3 Selection of Fungus with Ligninolytic Activity
The selected fungi were screened for their ligninolytic enzyme activity via synthetic
chemical reagents, namely guaiacol and Remazol brilliant blue-R. The fungus selected
was employed for the subsequent solid-state fermentation of rice husk to produce
laccase enzyme.
3.3.1 Fungal Strains
The fungi, i.e. Phanerochaete chrysosporium, Pycnoporus sanguineus, Phlebia radiata,
and Pleurotus sajor-caju, were obtained from the German Collection of
Microorganisms and Cell Cultures (DSMZ). Three fungi, namely Pycnoporus
sanguineus (DSM3023), Phlebia radiata (DSM5111), and Pleurotus sajor-caju
(DSM8265), were screened in this study. These fungi are able to degrade lignocellulose
(Esposito et al., 1991; Mane et al., 2007; Niku-Paavola et al., 1988; Okino et al., 2000;
Reddy et al., 2003; Thomas et al., 1998; Vares et al., 1995). On the other hand,
Phanerochaete chrysosporium (DSM1556), which has been extensively reported to
possess the ability to degrade xenobiotic substances (De Jong et al., 1992; Fernando et
al., 1990; Glenn and Gold, 1983; Okino et al., 2000; Wariishi et al., 1992), was used as
a reference strain (positive control) throughout the screening study. The fungi were
maintained on malt extract peptone agar (MEPA) at 4oC (Atlas, 2004) and was
periodically sub-cultured (Smith and Onions, 1983).
3.3.2 Preparation of Media
Malt extract peptone agar (MEPA) was used for fungal culture maintenance. The
MEPA medium (Atlas, 2004) contained malt extract (Becton Dickinson), 30 g/L; Bacto
Soytone (Becton Dickinson), 3 g/L; and granulated agar (Becton Dickinson), 15 g/L.
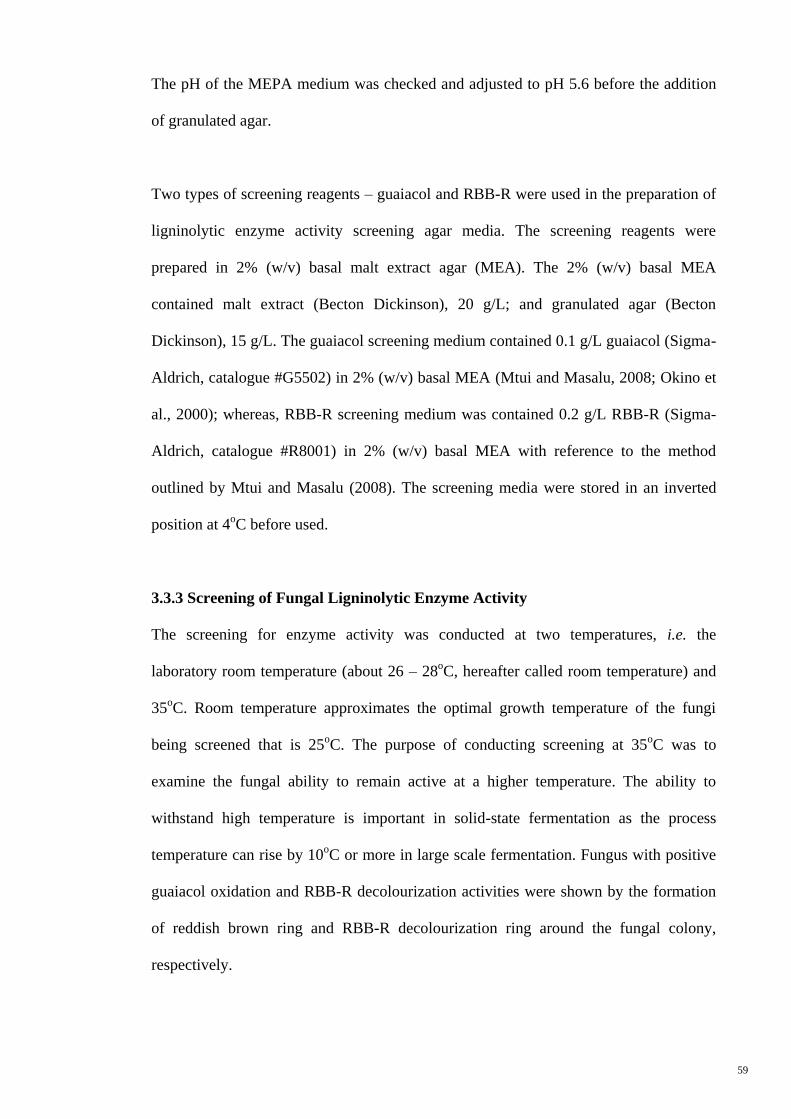
59
The pH of the MEPA medium was checked and adjusted to pH 5.6 before the addition
of granulated agar.
Two types of screening reagents – guaiacol and RBB-R were used in the preparation of
ligninolytic enzyme activity screening agar media. The screening reagents were
prepared in 2% (w/v) basal malt extract agar (MEA). The 2% (w/v) basal MEA
contained malt extract (Becton Dickinson), 20 g/L; and granulated agar (Becton
Dickinson), 15 g/L. The guaiacol screening medium contained 0.1 g/L guaiacol (Sigma-
Aldrich, catalogue #G5502) in 2% (w/v) basal MEA (Mtui and Masalu, 2008; Okino et
al., 2000); whereas, RBB-R screening medium was contained 0.2 g/L RBB-R (Sigma-
Aldrich, catalogue #R8001) in 2% (w/v) basal MEA with reference to the method
outlined by Mtui and Masalu (2008). The screening media were stored in an inverted
position at 4oC before used.
3.3.3 Screening of Fungal Ligninolytic Enzyme Activity
The screening for enzyme activity was conducted at two temperatures, i.e. the
laboratory room temperature (about 26 – 28oC, hereafter called room temperature) and
35oC. Room temperature approximates the optimal growth temperature of the fungi
being screened that is 25oC. The purpose of conducting screening at 35
oC was to
examine the fungal ability to remain active at a higher temperature. The ability to
withstand high temperature is important in solid-state fermentation as the process
temperature can rise by 10oC or more in large scale fermentation. Fungus with positive
guaiacol oxidation and RBB-R decolourization activities were shown by the formation
of reddish brown ring and RBB-R decolourization ring around the fungal colony,
respectively.
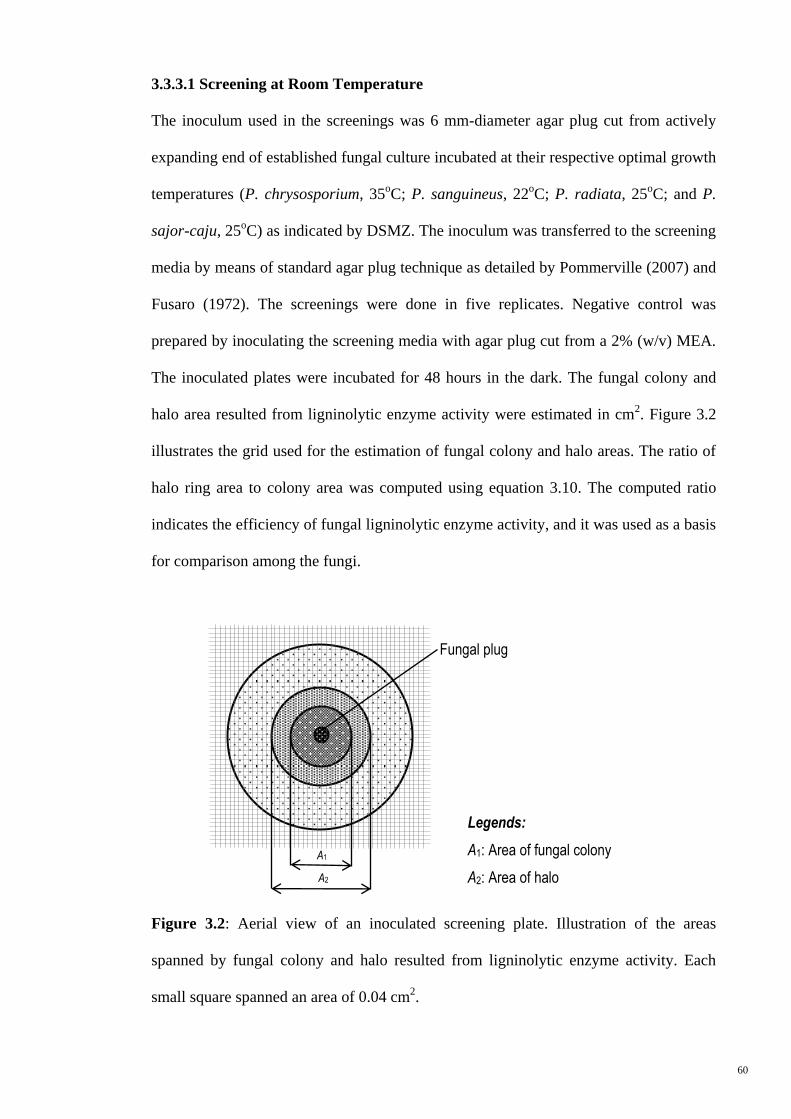
60
3.3.3.1 Screening at Room Temperature
The inoculum used in the screenings was 6 mm-diameter agar plug cut from actively
expanding end of established fungal culture incubated at their respective optimal growth
temperatures (P. chrysosporium, 35oC; P. sanguineus, 22
oC; P. radiata, 25
oC; and P.
sajor-caju, 25oC) as indicated by DSMZ. The inoculum was transferred to the screening
media by means of standard agar plug technique as detailed by Pommerville (2007) and
Fusaro (1972). The screenings were done in five replicates. Negative control was
prepared by inoculating the screening media with agar plug cut from a 2% (w/v) MEA.
The inoculated plates were incubated for 48 hours in the dark. The fungal colony and
halo area resulted from ligninolytic enzyme activity were estimated in cm2. Figure 3.2
illustrates the grid used for the estimation of fungal colony and halo areas. The ratio of
halo ring area to colony area was computed using equation 3.10. The computed ratio
indicates the efficiency of fungal ligninolytic enzyme activity, and it was used as a basis
for comparison among the fungi.
Figure 3.2: Aerial view of an inoculated screening plate. Illustration of the areas
spanned by fungal colony and halo resulted from ligninolytic enzyme activity. Each
small square spanned an area of 0.04 cm2.
Legends:
A1: Area of fungal colony
A2: Area of halo
Fungal plug
A1
A2
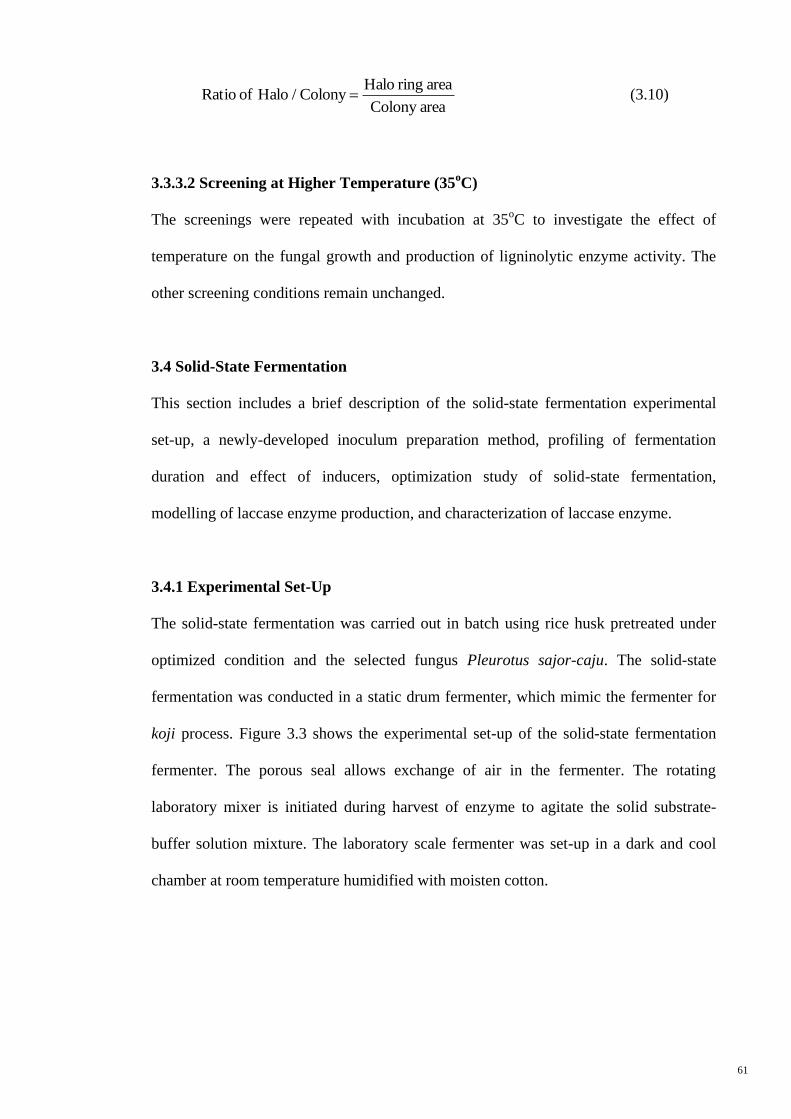
61
areaColony
area ring HaloColony / Halo of Ratio (3.10)
3.3.3.2 Screening at Higher Temperature (35oC)
The screenings were repeated with incubation at 35oC to investigate the effect of
temperature on the fungal growth and production of ligninolytic enzyme activity. The
other screening conditions remain unchanged.
3.4 Solid-State Fermentation
This section includes a brief description of the solid-state fermentation experimental
set-up, a newly-developed inoculum preparation method, profiling of fermentation
duration and effect of inducers, optimization study of solid-state fermentation,
modelling of laccase enzyme production, and characterization of laccase enzyme.
3.4.1 Experimental Set-Up
The solid-state fermentation was carried out in batch using rice husk pretreated under
optimized condition and the selected fungus Pleurotus sajor-caju. The solid-state
fermentation was conducted in a static drum fermenter, which mimic the fermenter for
koji process. Figure 3.3 shows the experimental set-up of the solid-state fermentation
fermenter. The porous seal allows exchange of air in the fermenter. The rotating
laboratory mixer is initiated during harvest of enzyme to agitate the solid substrate-
buffer solution mixture. The laboratory scale fermenter was set-up in a dark and cool
chamber at room temperature humidified with moisten cotton.
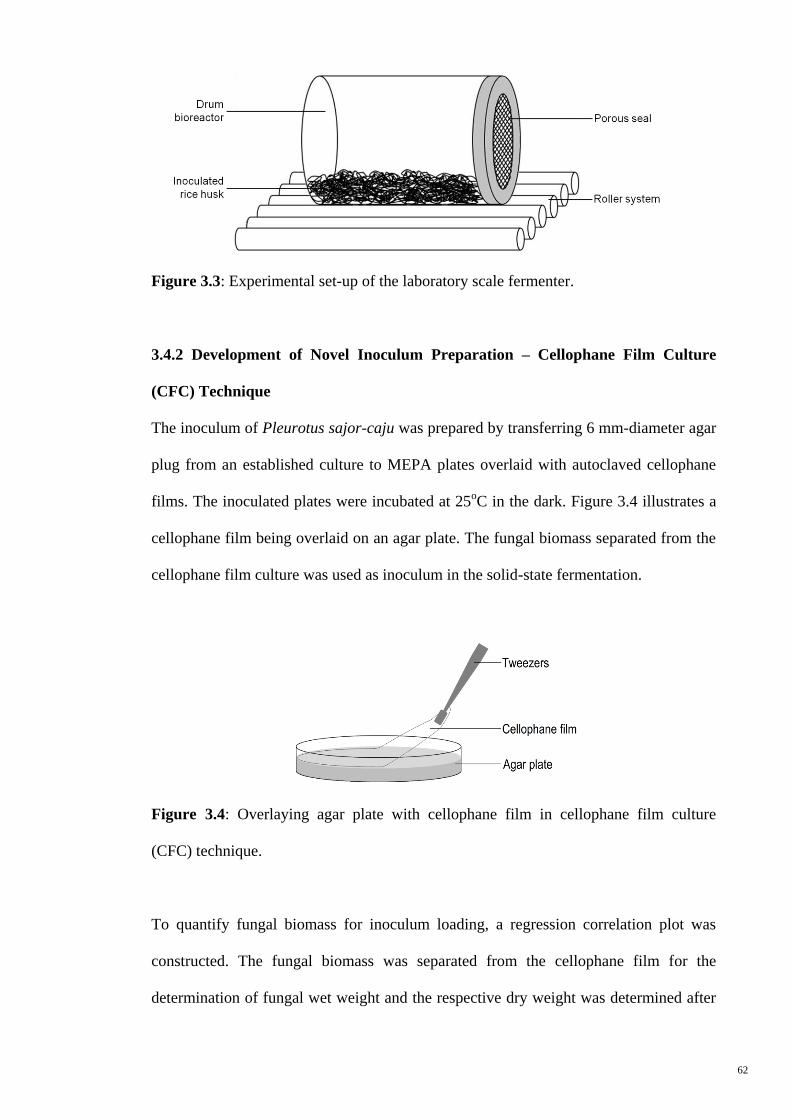
62
Figure 3.3: Experimental set-up of the laboratory scale fermenter.
3.4.2 Development of Novel Inoculum Preparation – Cellophane Film Culture
(CFC) Technique
The inoculum of Pleurotus sajor-caju was prepared by transferring 6 mm-diameter agar
plug from an established culture to MEPA plates overlaid with autoclaved cellophane
films. The inoculated plates were incubated at 25oC in the dark. Figure 3.4 illustrates a
cellophane film being overlaid on an agar plate. The fungal biomass separated from the
cellophane film culture was used as inoculum in the solid-state fermentation.
Figure 3.4: Overlaying agar plate with cellophane film in cellophane film culture
(CFC) technique.
To quantify fungal biomass for inoculum loading, a regression correlation plot was
constructed. The fungal biomass was separated from the cellophane film for the
determination of fungal wet weight and the respective dry weight was determined after
63
drying at 80oC overnight as outlined by Reeslev and Kjoller (1995). A total of 57
replicates were performed, and sampling was carried out from the third day of
incubation onwards until complete colonization of the plates. A correlation was
established for the fungal wet and dry weight. For regression analysis, the fungal wet
and dry weights were fitted to a linear model with linear regression by using SigmaPlot
for Windows Version 11.0 (Systat Software, Inc., Germany).
3.4.2.1 Technique Verification and Validation
Verification of the technique was carried out in solid-state fermentation of pretreated
rice husk, and the viability of the inoculum was measured by using laccase enzyme
activity as an indicator. The technique verification was conducted with a pre-determined
solid-state fermentation conditions: initial moisture level of substrate, 55% (w/w);
inoculum loading, 0.5% (w/w); fermentation duration, 10 days; and incubation
temperature, ~26oC.
For comparison, P. sajor-caju was grown on MEPA plates overlaid with nylon
membrane, where it has been used to grow mycelial fungus for microbiological studies
(Funder and Johannessen, 1957). A total of 20 replicates were carried out in the study.
The validity of the inoculum preparation technique was conducted by using Pycnoporus
sanguineus, which has also been reported for its laccase production in solid-state
fermentation (Abdul Karim and Mohamad Annuar, 2009). A total of 20 replicates were
carried out in the validation study.
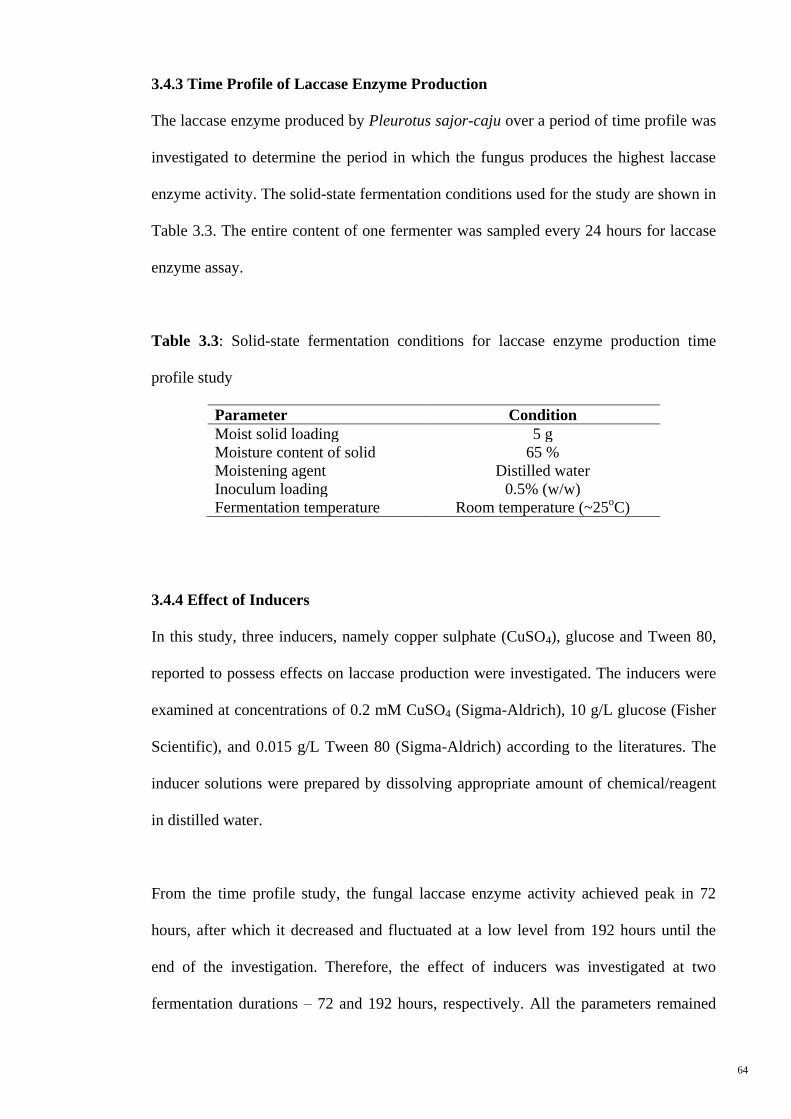
64
3.4.3 Time Profile of Laccase Enzyme Production
The laccase enzyme produced by Pleurotus sajor-caju over a period of time profile was
investigated to determine the period in which the fungus produces the highest laccase
enzyme activity. The solid-state fermentation conditions used for the study are shown in
Table 3.3. The entire content of one fermenter was sampled every 24 hours for laccase
enzyme assay.
Table 3.3: Solid-state fermentation conditions for laccase enzyme production time
profile study
Parameter Condition
Moist solid loading 5 g
Moisture content of solid 65 %
Moistening agent Distilled water
Inoculum loading 0.5% (w/w)
Fermentation temperature Room temperature (~25oC)
3.4.4 Effect of Inducers
In this study, three inducers, namely copper sulphate (CuSO4), glucose and Tween 80,
reported to possess effects on laccase production were investigated. The inducers were
examined at concentrations of 0.2 mM CuSO4 (Sigma-Aldrich), 10 g/L glucose (Fisher
Scientific), and 0.015 g/L Tween 80 (Sigma-Aldrich) according to the literatures. The
inducer solutions were prepared by dissolving appropriate amount of chemical/reagent
in distilled water.
From the time profile study, the fungal laccase enzyme activity achieved peak in 72
hours, after which it decreased and fluctuated at a low level from 192 hours until the
end of the investigation. Therefore, the effect of inducers was investigated at two
fermentation durations – 72 and 192 hours, respectively. All the parameters remained

65
the same as in the time profile study, except the moistening agent was replaced with
solution containing the respective inducer. The experimental control was conducted in
the absent of inducers. The laccase enzyme activity of the crude enzyme filtrate was
analyzed.
3.4.5 Optimization of Solid-State Fermentation
The optimization of laccase enzyme production was conducted with four parameters,
i.e. fermentation duration (X’1), concentrations of copper sulphate (X’2), glucose (X’3)
and Tween 80 (X’4). The optimization was carried out using central composite
experimental design (CCD). The experimental design, which consisted of a fractional
factorial design, a set of central points and a set of axial points, has 30 runs that were
divided into three blocks to reduce the variability transmitted from different batches of
pretreated rice husk and inoculum. The ranges of the parameters were determined from
the time profile and effect of inducers studies. Laccase enzyme activity and total soluble
protein of the crude enzyme filtrate were assayed for the computation of specific
laccase enzyme activity. The ultimate aim of the optimization was to maximize the
specific laccase enzyme activity (Y’) in the crude enzyme filtrate using response surface
methodology (RSM). Regression analysis of the optimization data was performed using
Design-Expert Version 6.0.6 (Stat-Ease Inc., Minneapolis).
The optimized solid-state fermentation condition was further verified with independent
runs in triplicate. The error between predicted and experimental response of laccase
enzyme activity was estimated.
66
3.4.6 Recovery of Enzyme
A 500 ml citrate buffer stock (1 M, pH 4.5) was prepared by dissolving 105 g citric acid
monohydrate salt (Merck) in approximately 375 ml of distilled water. The pH of the
solution was adjusted to about 4.3 with NaOH, and diluted to a final volume of 500 ml.
Citrate buffer (100 mM, pH 4.8) used for harvesting of laccase enzyme was prepared by
diluting 1 M citrate buffer stock to an appropriate volume.
To harvest the enzyme, 10 ml of 100 mM citrate buffer was added to the fermented rice
husk. The content was agitated on a laboratory rotating mixer for 1 hour before the
liquid portion was transferred to a capped-test tube. The test tube was spinned in a
refrigerated centrifuged (Eppendorf Centrifuge 5918 R, Germany) at 3,500 rpm for 20
minutes to remove residual rice husk particle and fungal biomass. The cell-free
supernatant (hereafter named crude enzyme filtrate) was transferred to another test tube
and stored at -20oC prior to analyses.
3.4.7 Analytical Methods
3.4.7.1 Laccase Enzyme Assay (ABTS)
The 2,2‟-azino-bis (3-ethylbenzothiazoline)-6-sulphonic acid (ABTS) reagent for
laccase enzyme assay was prepared from ABTS chromophore, diammonium salt
(Calbiochem, catalogue #194430). The reagent was prepared as 30 mM solution, which
was subsequently diluted to 2.5 mM in the final reaction mixture volume. Citrate buffer
solution (300 mM) was prepared by diluting 1 M citrate buffer stock to an appropriate
volume. The citrate buffer solution was diluted to 100 mM in the final reaction mixture
volume.
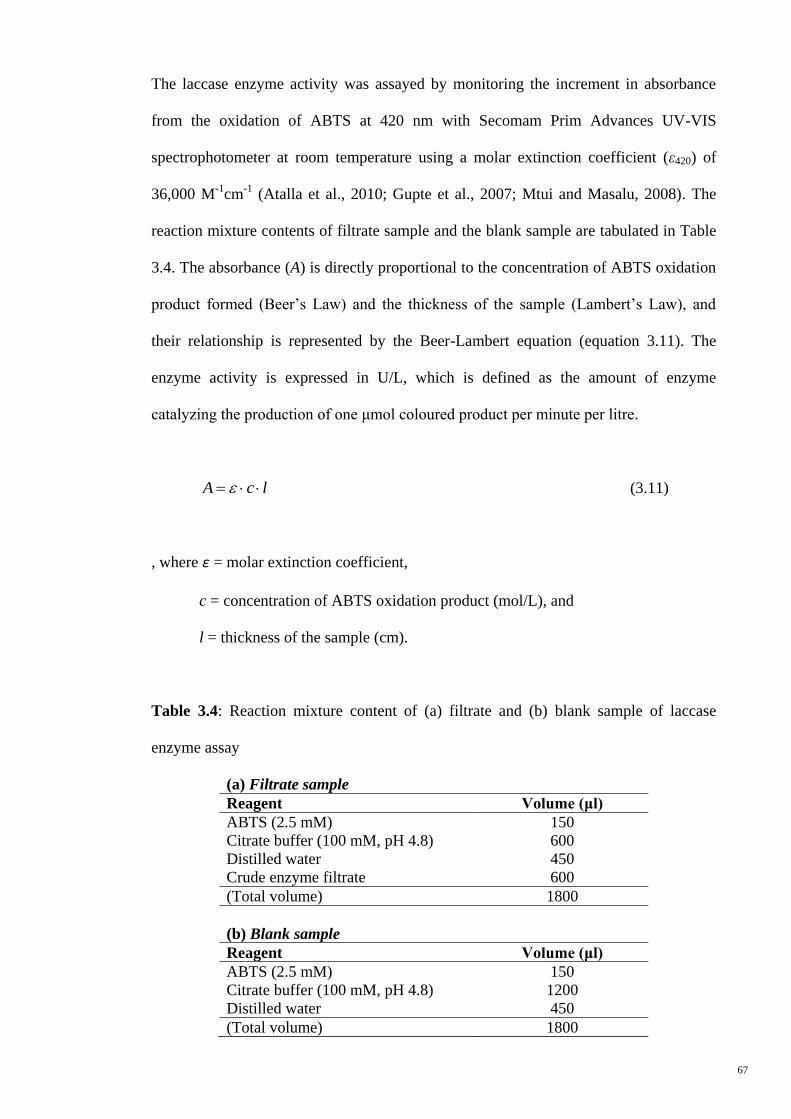
67
The laccase enzyme activity was assayed by monitoring the increment in absorbance
from the oxidation of ABTS at 420 nm with Secomam Prim Advances UV-VIS
spectrophotometer at room temperature using a molar extinction coefficient (ε420) of
36,000 M-1
cm-1
(Atalla et al., 2010; Gupte et al., 2007; Mtui and Masalu, 2008). The
reaction mixture contents of filtrate sample and the blank sample are tabulated in Table
3.4. The absorbance (A) is directly proportional to the concentration of ABTS oxidation
product formed (Beer‟s Law) and the thickness of the sample (Lambert‟s Law), and
their relationship is represented by the Beer-Lambert equation (equation 3.11). The
enzyme activity is expressed in U/L, which is defined as the amount of enzyme
catalyzing the production of one μmol coloured product per minute per litre.
lcA (3.11)
, where ε = molar extinction coefficient,
c = concentration of ABTS oxidation product (mol/L), and
l = thickness of the sample (cm).
Table 3.4: Reaction mixture content of (a) filtrate and (b) blank sample of laccase
enzyme assay
(a) Filtrate sample
Reagent Volume (μl)
ABTS (2.5 mM) 150
Citrate buffer (100 mM, pH 4.8) 600
Distilled water 450
Crude enzyme filtrate 600
(Total volume) 1800
(b) Blank sample
Reagent Volume (μl)
ABTS (2.5 mM) 150
Citrate buffer (100 mM, pH 4.8) 1200
Distilled water 450
(Total volume) 1800
68
3.4.7.2 Total Soluble Protein Content
The total soluble protein content of the enzyme samples was quantified by using Total
Protein Kit (product no. TP0300 and L3540, Sigma-Aldrich, USA), which applies
Peterson‟s modification of Micro Lowry method. The chemical reagents, i.e. Lowry
reagent, and Folin and Ciocalteu‟s phenol reagent working solutions were prepared
according to the instruction given by the manufacturer (Sigma-Aldrich, USA). The
prepared reagents were stored at room temperature. Protein standard used in the assay
was bovine serum albumin (BSA). The protein standard stock solution (400 μg/ml) was
prepared by adding approximately 5 ml of deionised water to 2 mg of BSA, and swirled
to completely dissolve the content.
Total soluble protein determination was conducted with reference to the protocol
provided by the manufacturer (refer to Appendix C: Protocol for total soluble protein
determination). The absorbance of laccase enzyme sample was measured at 765 nm.
Absorbance reading of the samples was completed within 30 minutes after colour
development. Blank sample was carried out by substituting the sample with 1 ml of
deionised water. The protein standards, blank sample, and samples were treated the
same during the assay.
3.4.8 Modelling of Laccase Enzyme Production
The increasing phase of enzyme production of the optimized solid-state fermentation
was modelled based on the logistic model, and it is assumed that the laccase enzyme
activity in the increasing phase is proportional to the fungal biomass concentration (Al-
Asheh and Duvnjak, 1994; Okazaki et al., 1980).
69
The data of specific laccase enzyme activity was collected from a total of 26 runs at
random fermentation intervals between 0 and 84 hours under the optimized conditions.
The model parameters were estimated from all experimental data simultaneously using
the parameter estimation software Matlab®
V7.6.0.324 (R2008a) (The MathWorks, Inc.,
USA). The ordinary differential equations were solved by finding a constrained
minimum of the model equations coefficients at an initial estimation. The initial
estimate of the coefficients are adopted from Al-Asheh and Duvnjak (1994): (i)
maximum specific growth rate (μm) = 0.0560 h-1
; (ii) maximum biomass concentration
(Xm) = 0.078 g/g moist rice husk; (iii) rate constant for enzyme production (kv) = 0.531
units/g moist rice husk/h. The initial fungal biomass concentration (X0) = 0.01114 g/g
moist rice husk was used in the study. The fitted curve was validated with another set of
experimental data that were collected at 12-hour intervals between 0 and 84 hours.
Lastly, the root-mean-square (RMS) error between the fitted curve and the experimental
data was calculated.
3.4.9 Characterization of Laccase Enzyme
The characterization studies were preceded with partially purification of laccase enzyme
followed by the molecular weight determination and substrate specificity investigation
of the partial purified laccase enzyme.
3.4.9.1 Partial Purification of Laccase Enzyme
The crude enzyme filtrate was partially purified with Amicon®
Ultra-15 centrifugal
filter (Millipore, USA) with a 30 kDa cut-off regenerated cellulose membrane.
Approximately 15 ml of crude enzyme filtrate was added to the filter device and
spinned at 4,000 × g for 15 minutes with a refrigerated centrifuge with swinging bucket

70
rotor (Eppendorf Centrifuge 5918 R, Germany). Immediately after centrifugation, the
concentrated enzyme filtrate was withdrawn from the filter device using a side-to-side
sweeping motion to ensure total recovery. The ultrafiltrate was stored in a centrifuge
tube. The partially purified enzyme and ultrafiltrate were subjected to subsequent
enzyme characterization studies.
3.4.9.2 Sodium Dodecyl Sulphate-Polyacrylamide Gel Electrophoresis (SDS-
PAGE) of Laccase Enzyme
Running buffer for the SDS-PAGE is 1× Tris/glycine/SDS. It was prepared from 10
times dilution of 10× Tris/glycine/SDS buffer stock (Bio-Rad, USA). The diluted
running buffer was stored at room temperature.
The apparent molecular mass of the laccase enzyme was estimated by SDS-PAGE with
Criterion vertical electrophoresis system (Bio-Rad Criterion™
Cell, USA). The SDS-
PAGE was conducted with a 7.5% Criterion Tris-HCl precast gel with 12 wells and
thickness 1.0 mm (Bio-Rad, USA) at room temperature. The partial purified laccase
sample was treated with 5% β-mercaptoethanol (Bio-Rad, USA), diluted with Laemmli
sample buffer (Bio-Rad, USA) at a ratio of 1:1, and the diluted sample was heated at
70oC for 10 minutes. After heating, 45 μl of the treated sample was loaded to the sample
well. Precision Plus Protein™
standards containing protein markers with molecular mass
of 10 kD, 15 kD, 20 kD, 37 kD, 50 kD, 75 kD, 100 kD, 150 kD, and 250 kD were used
as standards. The gel was run at 70 V constant for 145 minutes. The gel was visualised
with SimplyBlue™
SafeStain (Comassie G-250 stain, Novex®
by Life Technologies,
USA). Refer to Appendix D: Protocol for staining SDS-PAGE gel.
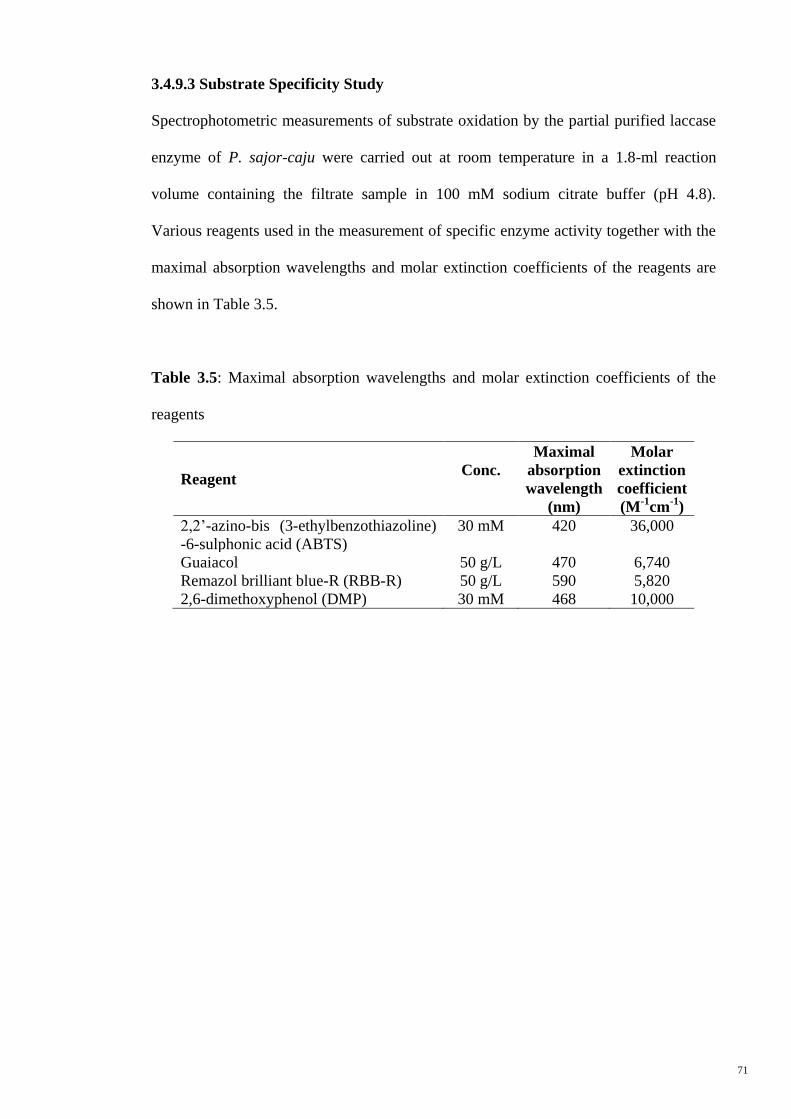
71
3.4.9.3 Substrate Specificity Study
Spectrophotometric measurements of substrate oxidation by the partial purified laccase
enzyme of P. sajor-caju were carried out at room temperature in a 1.8-ml reaction
volume containing the filtrate sample in 100 mM sodium citrate buffer (pH 4.8).
Various reagents used in the measurement of specific enzyme activity together with the
maximal absorption wavelengths and molar extinction coefficients of the reagents are
shown in Table 3.5.
Table 3.5: Maximal absorption wavelengths and molar extinction coefficients of the
reagents
Reagent Conc.
Maximal
absorption
wavelength
(nm)
Molar
extinction
coefficient
(M-1
cm-1
)
2,2‟-azino-bis (3-ethylbenzothiazoline)
-6-sulphonic acid (ABTS)
30 mM 420 36,000
Guaiacol 50 g/L 470 6,740
Remazol brilliant blue-R (RBB-R) 50 g/L 590 5,820
2,6-dimethoxyphenol (DMP) 30 mM 468 10,000
72
CHAPTER 4
PRETREATMENT OF RICE HUSK
Pretreatment of rice husk serves as a crucial step in improving substrate digestibility by
microbes via partially breaking the recalcitrant structure of rice husk for fungal solid-
state fermentation to produce ligninolytic enzyme. This chapter consists of two sections.
The first section reports comprehensive screening and selection of pretreatment reagent
studies that include conventional and non-conventional reagents for pretreating rice
husk. Screening and assessment of pretreatment reagents are necessary for the
pretreatment of rice husk. The findings of conventional and ionic liquid dissolution
pretreatments of rice husk were reported. The feasibility of employing these
pretreatments to rice husk was discussed by considering the modifications that they
imparted to rice husk chemical composition and structure. The second section reports
the optimization of rice husk pretreatment with response surface methodology by using
the selected reagent. This section involves preliminary studies for the determination of
suitable ranges for parameters under consideration, followed by optimization using
Box-Behnken experimental design (BBD).
4.1 Results and Discussion
4.1.1 Characterization of Rice Husk
Prior to the comprehensive pretreatment studies, the chemical composition of the rice
husk sample was characterized. The acid detergent fibre (ADF) and neutral detergent
fibre (NDF) contents of the rice husk sample were 72.9 ± 0.7% (w/w) and 77.5 ± 0.2%
(w/w), respectively. These values were slightly lower compared to the values reported
by Contreras Lara and co-workers (1999) whereby the ADF and NDF contents were
79.0 ± 3.1% (w/w) and 83.1 ± 2.0% (w/w), respectively. The differences in values
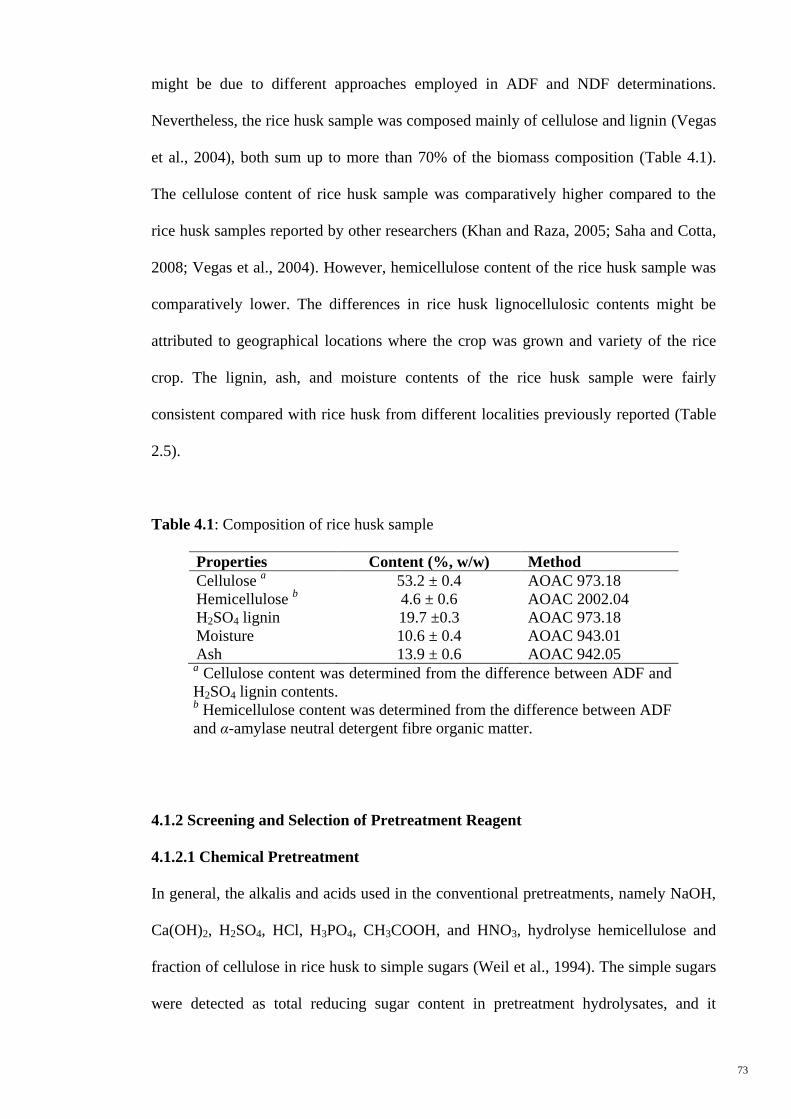
73
might be due to different approaches employed in ADF and NDF determinations.
Nevertheless, the rice husk sample was composed mainly of cellulose and lignin (Vegas
et al., 2004), both sum up to more than 70% of the biomass composition (Table 4.1).
The cellulose content of rice husk sample was comparatively higher compared to the
rice husk samples reported by other researchers (Khan and Raza, 2005; Saha and Cotta,
2008; Vegas et al., 2004). However, hemicellulose content of the rice husk sample was
comparatively lower. The differences in rice husk lignocellulosic contents might be
attributed to geographical locations where the crop was grown and variety of the rice
crop. The lignin, ash, and moisture contents of the rice husk sample were fairly
consistent compared with rice husk from different localities previously reported (Table
2.5).
Table 4.1: Composition of rice husk sample
Properties Content (%, w/w) Method
Cellulose a 53.2 ± 0.4 AOAC 973.18
Hemicellulose b 4.6 ± 0.6 AOAC 2002.04
H2SO4 lignin 19.7 ±0.3 AOAC 973.18
Moisture 10.6 ± 0.4 AOAC 943.01
Ash 13.9 ± 0.6 AOAC 942.05 a Cellulose content was determined from the difference between ADF and
H2SO4 lignin contents. b Hemicellulose content was determined from the difference between ADF
and α-amylase neutral detergent fibre organic matter.
4.1.2 Screening and Selection of Pretreatment Reagent
4.1.2.1 Chemical Pretreatment
In general, the alkalis and acids used in the conventional pretreatments, namely NaOH,
Ca(OH)2, H2SO4, HCl, H3PO4, CH3COOH, and HNO3, hydrolyse hemicellulose and
fraction of cellulose in rice husk to simple sugars (Weil et al., 1994). The simple sugars
were detected as total reducing sugar content in pretreatment hydrolysates, and it
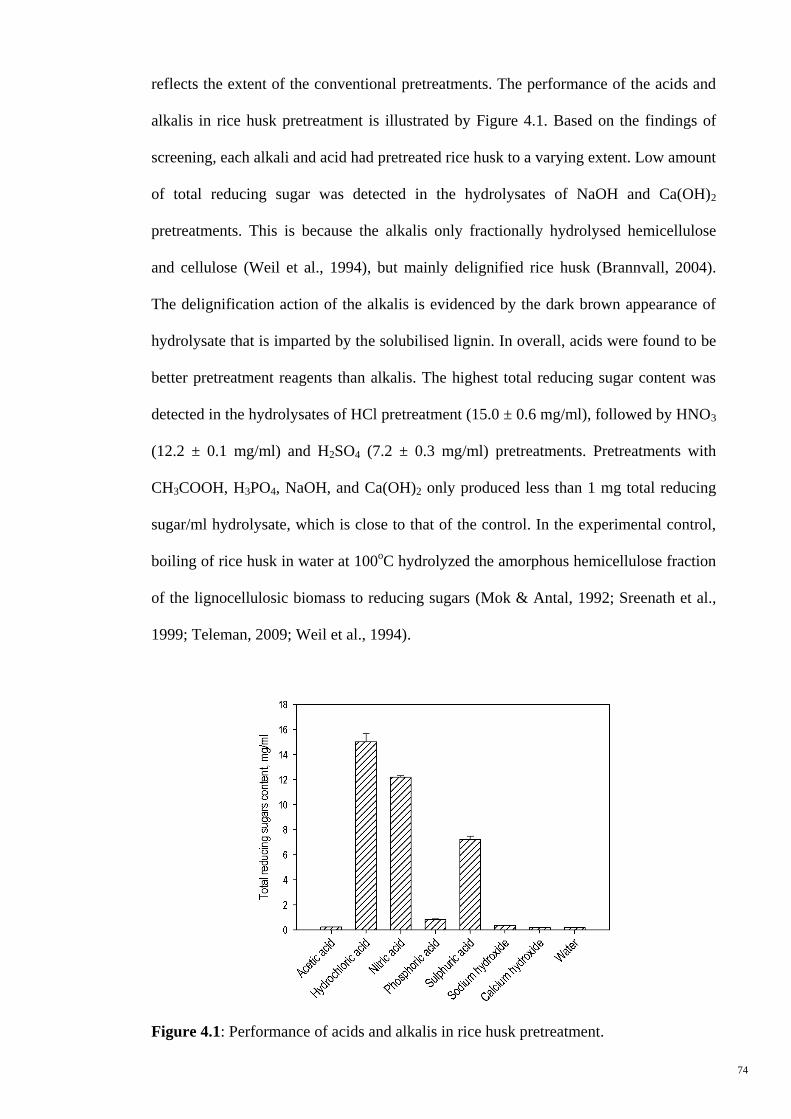
74
reflects the extent of the conventional pretreatments. The performance of the acids and
alkalis in rice husk pretreatment is illustrated by Figure 4.1. Based on the findings of
screening, each alkali and acid had pretreated rice husk to a varying extent. Low amount
of total reducing sugar was detected in the hydrolysates of NaOH and Ca(OH)2
pretreatments. This is because the alkalis only fractionally hydrolysed hemicellulose
and cellulose (Weil et al., 1994), but mainly delignified rice husk (Brannvall, 2004).
The delignification action of the alkalis is evidenced by the dark brown appearance of
hydrolysate that is imparted by the solubilised lignin. In overall, acids were found to be
better pretreatment reagents than alkalis. The highest total reducing sugar content was
detected in the hydrolysates of HCl pretreatment (15.0 ± 0.6 mg/ml), followed by HNO3
(12.2 ± 0.1 mg/ml) and H2SO4 (7.2 ± 0.3 mg/ml) pretreatments. Pretreatments with
CH3COOH, H3PO4, NaOH, and Ca(OH)2 only produced less than 1 mg total reducing
sugar/ml hydrolysate, which is close to that of the control. In the experimental control,
boiling of rice husk in water at 100oC hydrolyzed the amorphous hemicellulose fraction
of the lignocellulosic biomass to reducing sugars (Mok & Antal, 1992; Sreenath et al.,
1999; Teleman, 2009; Weil et al., 1994).
Figure 4.1: Performance of acids and alkalis in rice husk pretreatment.
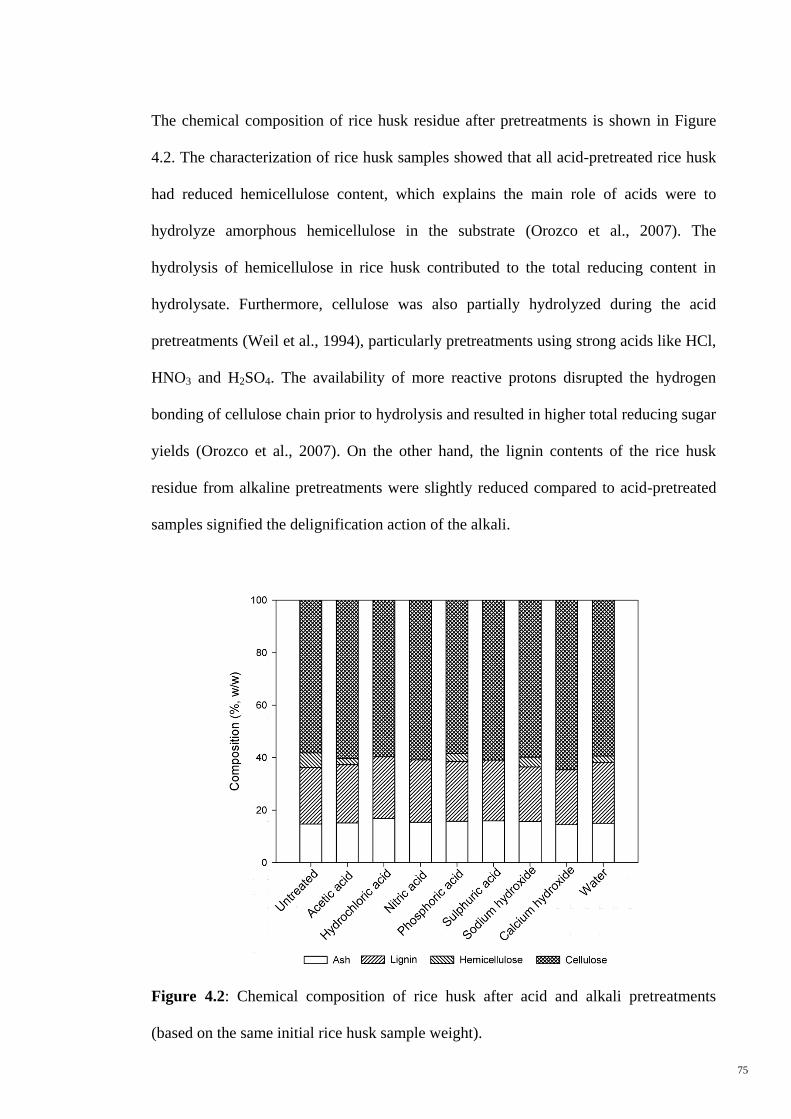
75
The chemical composition of rice husk residue after pretreatments is shown in Figure
4.2. The characterization of rice husk samples showed that all acid-pretreated rice husk
had reduced hemicellulose content, which explains the main role of acids were to
hydrolyze amorphous hemicellulose in the substrate (Orozco et al., 2007). The
hydrolysis of hemicellulose in rice husk contributed to the total reducing content in
hydrolysate. Furthermore, cellulose was also partially hydrolyzed during the acid
pretreatments (Weil et al., 1994), particularly pretreatments using strong acids like HCl,
HNO3 and H2SO4. The availability of more reactive protons disrupted the hydrogen
bonding of cellulose chain prior to hydrolysis and resulted in higher total reducing sugar
yields (Orozco et al., 2007). On the other hand, the lignin contents of the rice husk
residue from alkaline pretreatments were slightly reduced compared to acid-pretreated
samples signified the delignification action of the alkali.
Figure 4.2: Chemical composition of rice husk after acid and alkali pretreatments
(based on the same initial rice husk sample weight).
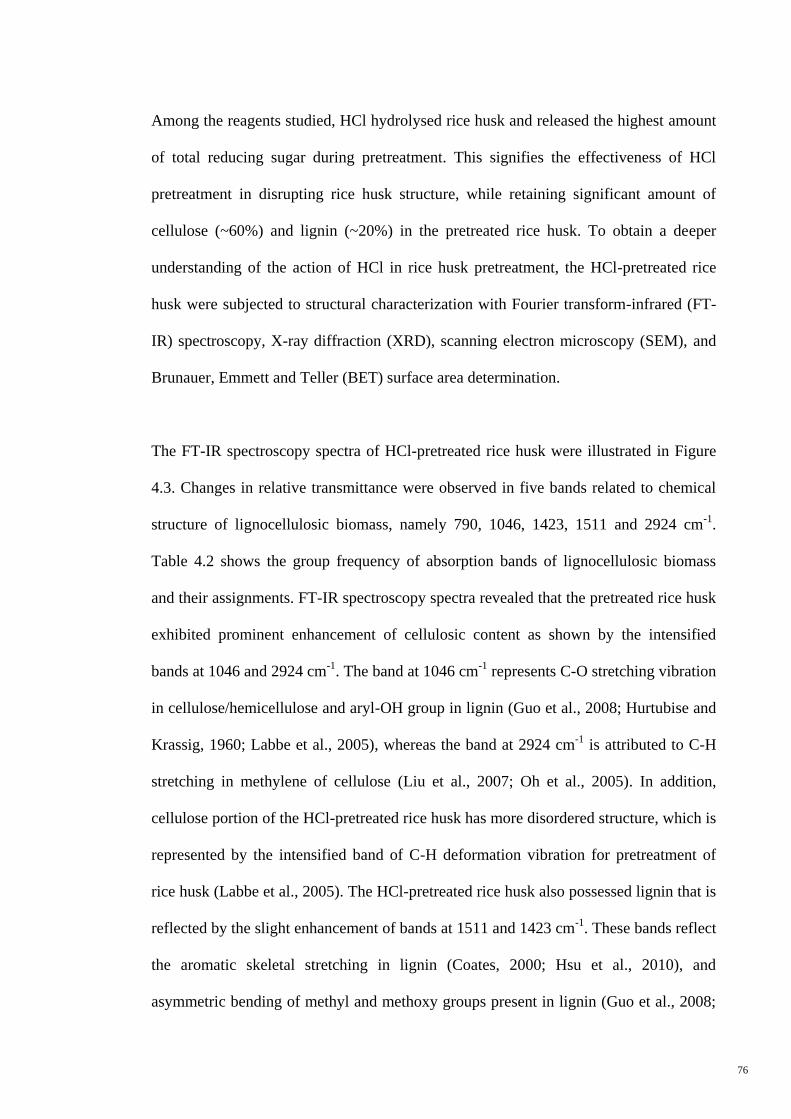
76
Among the reagents studied, HCl hydrolysed rice husk and released the highest amount
of total reducing sugar during pretreatment. This signifies the effectiveness of HCl
pretreatment in disrupting rice husk structure, while retaining significant amount of
cellulose (~60%) and lignin (~20%) in the pretreated rice husk. To obtain a deeper
understanding of the action of HCl in rice husk pretreatment, the HCl-pretreated rice
husk were subjected to structural characterization with Fourier transform-infrared (FT-
IR) spectroscopy, X-ray diffraction (XRD), scanning electron microscopy (SEM), and
Brunauer, Emmett and Teller (BET) surface area determination.
The FT-IR spectroscopy spectra of HCl-pretreated rice husk were illustrated in Figure
4.3. Changes in relative transmittance were observed in five bands related to chemical
structure of lignocellulosic biomass, namely 790, 1046, 1423, 1511 and 2924 cm-1
.
Table 4.2 shows the group frequency of absorption bands of lignocellulosic biomass
and their assignments. FT-IR spectroscopy spectra revealed that the pretreated rice husk
exhibited prominent enhancement of cellulosic content as shown by the intensified
bands at 1046 and 2924 cm-1
. The band at 1046 cm-1
represents C-O stretching vibration
in cellulose/hemicellulose and aryl-OH group in lignin (Guo et al., 2008; Hurtubise and
Krassig, 1960; Labbe et al., 2005), whereas the band at 2924 cm-1
is attributed to C-H
stretching in methylene of cellulose (Liu et al., 2007; Oh et al., 2005). In addition,
cellulose portion of the HCl-pretreated rice husk has more disordered structure, which is
represented by the intensified band of C-H deformation vibration for pretreatment of
rice husk (Labbe et al., 2005). The HCl-pretreated rice husk also possessed lignin that is
reflected by the slight enhancement of bands at 1511 and 1423 cm-1
. These bands reflect
the aromatic skeletal stretching in lignin (Coates, 2000; Hsu et al., 2010), and
asymmetric bending of methyl and methoxy groups present in lignin (Guo et al., 2008;
77
Labbe et al., 2005; Sun et al., 2009), respectively. The findings of FT-IR spectroscopy
complemented and confirmed the chemical composition analysis of pretreated rice husk
mainly consisted of cellulose and lignin.
Figure 4.3: FT-IR spectra of untreated and HCl-pretreated rice husk.
FT-IR spectral bands (cm-1
): (a) 2924; (b) 1511; (c) 1423; (d) 1046; (e) 790.
The crystallinity of rice husk samples was determined via XRD analysis. The HCl-
pretreated rice husk pretreated was found to be slightly more crystalline than the
untreated rice husk as indicated by the occurrence of a sharper peak at 2θ = 22.6o
(Figure 4.4). The increased in the crystallinity index (CrI) from 51.5 of the untreated
rice husk to 56.3 of the pretreated rice husk is attributed to the removal of amorphous
hemicellulose and a fraction of amorphous cellulose during HCl pretreatment. Similar
findings on acid-pretreated substrates with higher CrI than the untreated substrates were
also reported by Barl et al. (1991). The evidence for hemicellulose/cellulose removal is
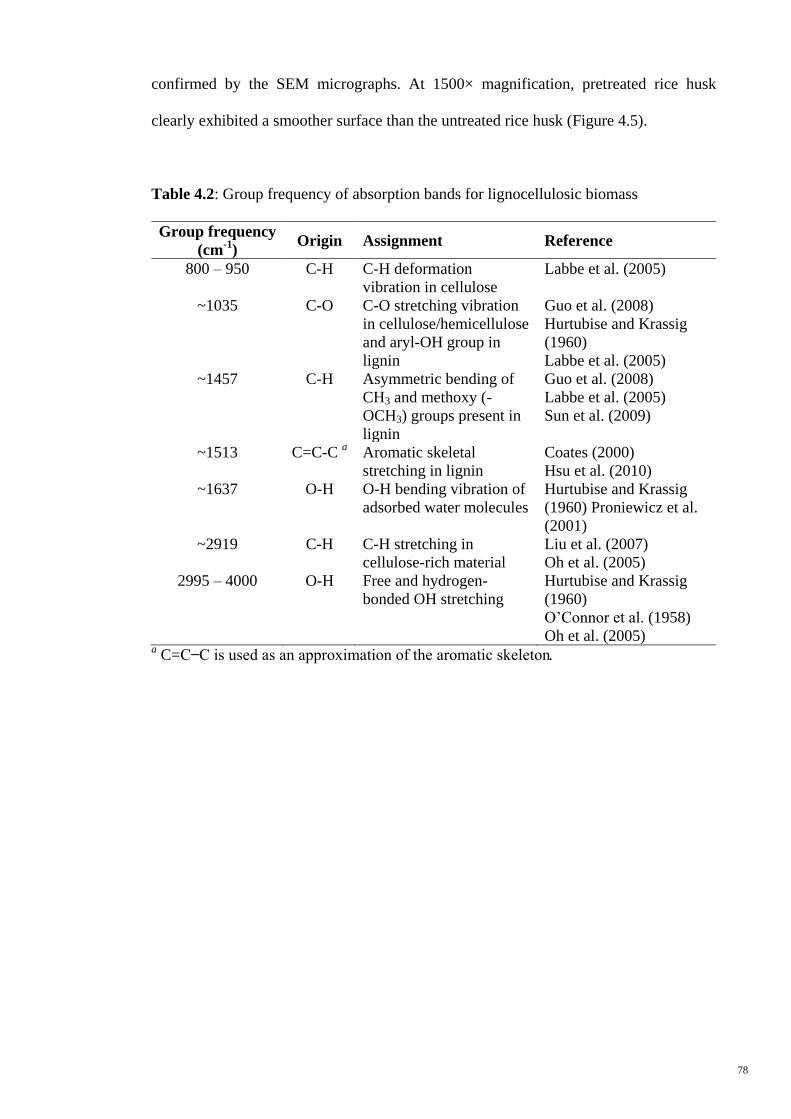
78
confirmed by the SEM micrographs. At 1500× magnification, pretreated rice husk
clearly exhibited a smoother surface than the untreated rice husk (Figure 4.5).
Table 4.2: Group frequency of absorption bands for lignocellulosic biomass
Group frequency
(cm-1
) Origin Assignment Reference
800 – 950 C-H C-H deformation
vibration in cellulose
Labbe et al. (2005)
~1035 C-O C-O stretching vibration
in cellulose/hemicellulose
and aryl-OH group in
lignin
Guo et al. (2008)
Hurtubise and Krassig
(1960)
Labbe et al. (2005)
~1457 C-H Asymmetric bending of
CH3 and methoxy (-
OCH3) groups present in
lignin
Guo et al. (2008)
Labbe et al. (2005)
Sun et al. (2009)
~1513 C=C-C a Aromatic skeletal
stretching in lignin
Coates (2000)
Hsu et al. (2010)
~1637 O-H O-H bending vibration of
adsorbed water molecules
Hurtubise and Krassig
(1960) Proniewicz et al.
(2001)
~2919 C-H C-H stretching in
cellulose-rich material
Liu et al. (2007)
Oh et al. (2005)
2995 – 4000 O-H Free and hydrogen-
bonded OH stretching
Hurtubise and Krassig
(1960)
O‟Connor et al. (1958)
Oh et al. (2005) a C=C ̶ C is used as an approximation of the aromatic skeleton.
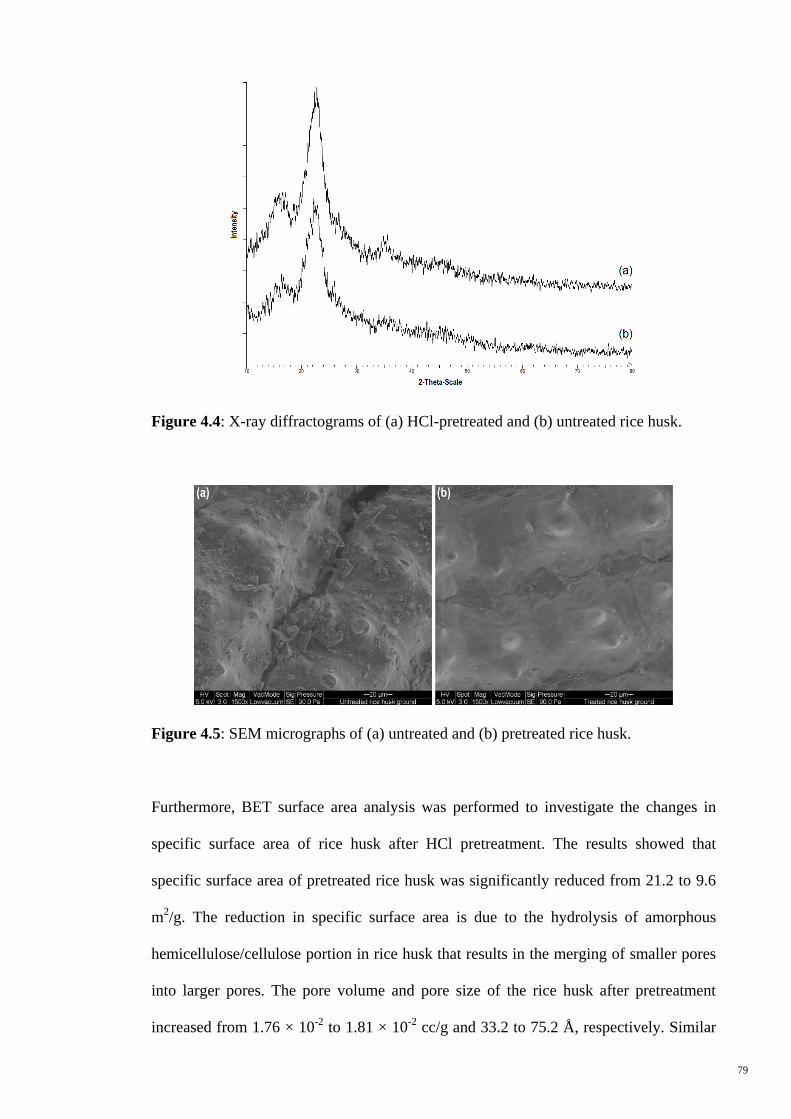
79
Figure 4.4: X-ray diffractograms of (a) HCl-pretreated and (b) untreated rice husk.
Figure 4.5: SEM micrographs of (a) untreated and (b) pretreated rice husk.
Furthermore, BET surface area analysis was performed to investigate the changes in
specific surface area of rice husk after HCl pretreatment. The results showed that
specific surface area of pretreated rice husk was significantly reduced from 21.2 to 9.6
m2/g. The reduction in specific surface area is due to the hydrolysis of amorphous
hemicellulose/cellulose portion in rice husk that results in the merging of smaller pores
into larger pores. The pore volume and pore size of the rice husk after pretreatment
increased from 1.76 × 10⁻²
to 1.81 × 10⁻²
cc/g and 33.2 to 75.2 Å, respectively. Similar

80
observation has been reported by Hsu et al. (2010), hydrolysis of hemicellulose and
cellulose by HCl results in increased pore volume in pretreated rice husk. The pretreated
solid residue with higher pore volume and bigger pore size is advantageous for fungal
growth during fermentation (Hsu et al., 2010; Zhu et al., 2008), albeit its slightly higher
CrI and lower specific surface area compared to the untreated rice husk. The change in
CrI and specific surface area of cellulosic substrates has been reported to have no effect
on the enzymatic hydrolysis rate (Grethlein, 1985). Nevertheless, the underlying
relationship of structural features and biomass digestibility of the pretreated substrate
depends on the size of enzyme used in enzymatic hydrolysis (Zhu et al., 2008), and the
accessibility of microbes to substrate during fermentation. All these characteristics
shown in the pretreated rice husk shows that HCl is a suitable reagent for the
pretreatment of rice husk.
4.1.2.2 Ionic Liquid Dissolution Pretreatment
A non-conventional pretreatment of rice husk using ionic liquids was also conducted.
The ionic liquid dissolution pretreatment of rice husk was assessed at 100oC for 10
hours. The experimental conditions were chosen as a compromise to allow sufficient
dissolution of rice husk for subsequent investigations. Moreover, pretreatment at such
temperature and duration minimizes the possibility of cellulose degradation as previous
study showed that prolong pretreatment at high temperatures poses risk of degradation
of dissolved cellulose (Sun et al., 2009). In dissolution pretreatment, the ionic liquids
namely [BMIM]Cl, [EMIM]DEP and [EMIM]OAc were employed for dissolution of
rice husk and subsequent regeneration of cellulose. The regenerated cellulose was
precipitated from the reaction mixture after being agitated in the anti-solvent indicating
that all the ionic liquids under investigation dissolved rice husk.
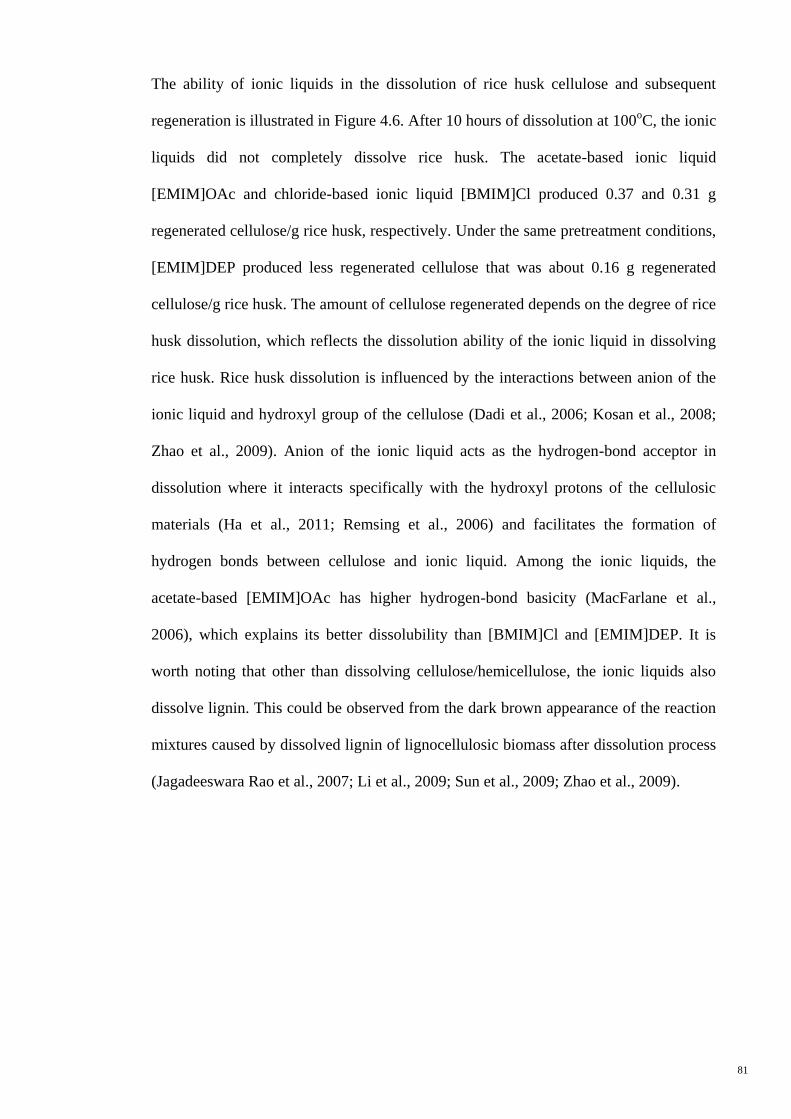
81
The ability of ionic liquids in the dissolution of rice husk cellulose and subsequent
regeneration is illustrated in Figure 4.6. After 10 hours of dissolution at 100oC, the ionic
liquids did not completely dissolve rice husk. The acetate-based ionic liquid
[EMIM]OAc and chloride-based ionic liquid [BMIM]Cl produced 0.37 and 0.31 g
regenerated cellulose/g rice husk, respectively. Under the same pretreatment conditions,
[EMIM]DEP produced less regenerated cellulose that was about 0.16 g regenerated
cellulose/g rice husk. The amount of cellulose regenerated depends on the degree of rice
husk dissolution, which reflects the dissolution ability of the ionic liquid in dissolving
rice husk. Rice husk dissolution is influenced by the interactions between anion of the
ionic liquid and hydroxyl group of the cellulose (Dadi et al., 2006; Kosan et al., 2008;
Zhao et al., 2009). Anion of the ionic liquid acts as the hydrogen-bond acceptor in
dissolution where it interacts specifically with the hydroxyl protons of the cellulosic
materials (Ha et al., 2011; Remsing et al., 2006) and facilitates the formation of
hydrogen bonds between cellulose and ionic liquid. Among the ionic liquids, the
acetate-based [EMIM]OAc has higher hydrogen-bond basicity (MacFarlane et al.,
2006), which explains its better dissolubility than [BMIM]Cl and [EMIM]DEP. It is
worth noting that other than dissolving cellulose/hemicellulose, the ionic liquids also
dissolve lignin. This could be observed from the dark brown appearance of the reaction
mixtures caused by dissolved lignin of lignocellulosic biomass after dissolution process
(Jagadeeswara Rao et al., 2007; Li et al., 2009; Sun et al., 2009; Zhao et al., 2009).
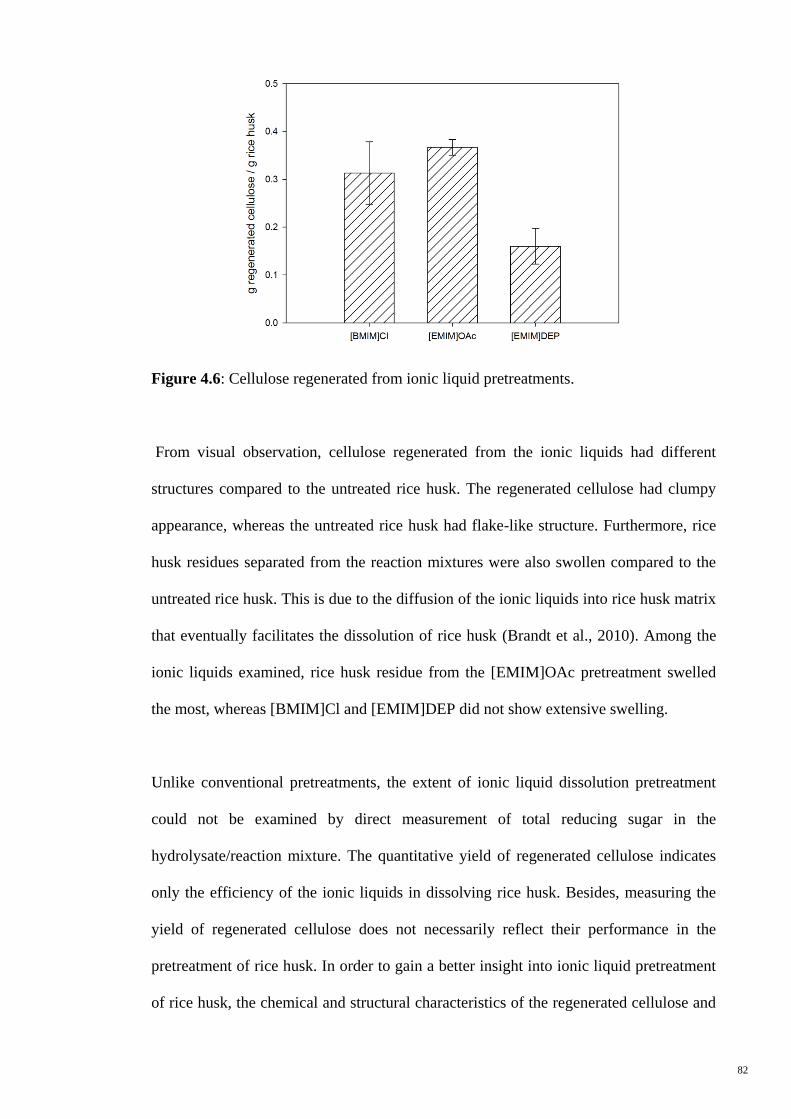
82
Figure 4.6: Cellulose regenerated from ionic liquid pretreatments.
From visual observation, cellulose regenerated from the ionic liquids had different
structures compared to the untreated rice husk. The regenerated cellulose had clumpy
appearance, whereas the untreated rice husk had flake-like structure. Furthermore, rice
husk residues separated from the reaction mixtures were also swollen compared to the
untreated rice husk. This is due to the diffusion of the ionic liquids into rice husk matrix
that eventually facilitates the dissolution of rice husk (Brandt et al., 2010). Among the
ionic liquids examined, rice husk residue from the [EMIM]OAc pretreatment swelled
the most, whereas [BMIM]Cl and [EMIM]DEP did not show extensive swelling.
Unlike conventional pretreatments, the extent of ionic liquid dissolution pretreatment
could not be examined by direct measurement of total reducing sugar in the
hydrolysate/reaction mixture. The quantitative yield of regenerated cellulose indicates
only the efficiency of the ionic liquids in dissolving rice husk. Besides, measuring the
yield of regenerated cellulose does not necessarily reflect their performance in the
pretreatment of rice husk. In order to gain a better insight into ionic liquid pretreatment
of rice husk, the chemical and structural characteristics of the regenerated cellulose and
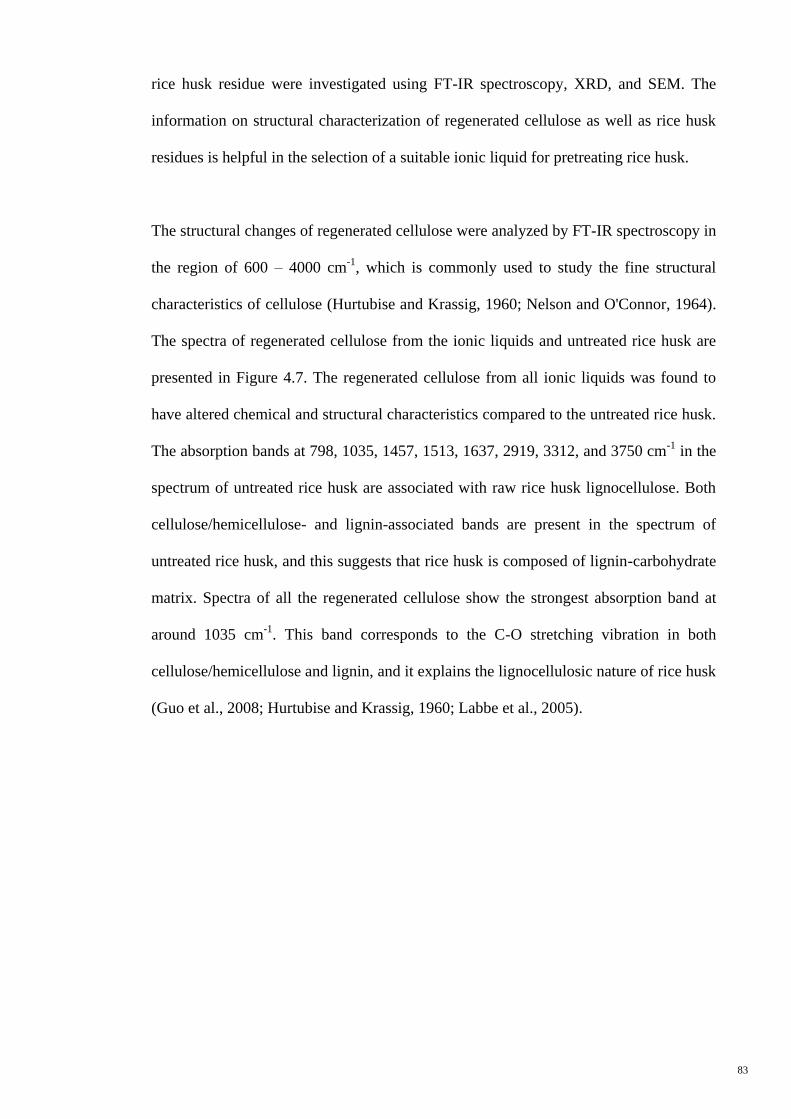
83
rice husk residue were investigated using FT-IR spectroscopy, XRD, and SEM. The
information on structural characterization of regenerated cellulose as well as rice husk
residues is helpful in the selection of a suitable ionic liquid for pretreating rice husk.
The structural changes of regenerated cellulose were analyzed by FT-IR spectroscopy in
the region of 600 – 4000 cm-1
, which is commonly used to study the fine structural
characteristics of cellulose (Hurtubise and Krassig, 1960; Nelson and O'Connor, 1964).
The spectra of regenerated cellulose from the ionic liquids and untreated rice husk are
presented in Figure 4.7. The regenerated cellulose from all ionic liquids was found to
have altered chemical and structural characteristics compared to the untreated rice husk.
The absorption bands at 798, 1035, 1457, 1513, 1637, 2919, 3312, and 3750 cm-1
in the
spectrum of untreated rice husk are associated with raw rice husk lignocellulose. Both
cellulose/hemicellulose- and lignin-associated bands are present in the spectrum of
untreated rice husk, and this suggests that rice husk is composed of lignin-carbohydrate
matrix. Spectra of all the regenerated cellulose show the strongest absorption band at
around 1035 cm-1
. This band corresponds to the C-O stretching vibration in both
cellulose/hemicellulose and lignin, and it explains the lignocellulosic nature of rice husk
(Guo et al., 2008; Hurtubise and Krassig, 1960; Labbe et al., 2005).
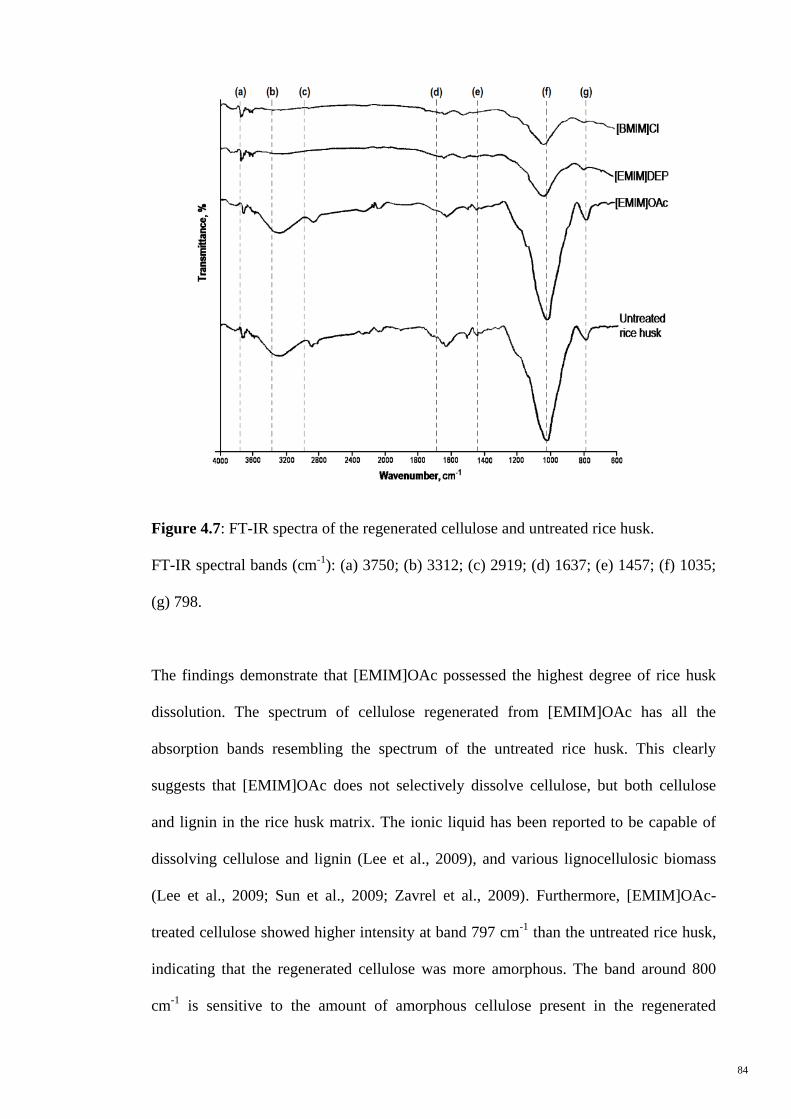
84
Figure 4.7: FT-IR spectra of the regenerated cellulose and untreated rice husk.
FT-IR spectral bands (cm-1
): (a) 3750; (b) 3312; (c) 2919; (d) 1637; (e) 1457; (f) 1035;
(g) 798.
The findings demonstrate that [EMIM]OAc possessed the highest degree of rice husk
dissolution. The spectrum of cellulose regenerated from [EMIM]OAc has all the
absorption bands resembling the spectrum of the untreated rice husk. This clearly
suggests that [EMIM]OAc does not selectively dissolve cellulose, but both cellulose
and lignin in the rice husk matrix. The ionic liquid has been reported to be capable of
dissolving cellulose and lignin (Lee et al., 2009), and various lignocellulosic biomass
(Lee et al., 2009; Sun et al., 2009; Zavrel et al., 2009). Furthermore, [EMIM]OAc-
treated cellulose showed higher intensity at band 797 cm-1
than the untreated rice husk,
indicating that the regenerated cellulose was more amorphous. The band around 800
cm-1
is sensitive to the amount of amorphous cellulose present in the regenerated
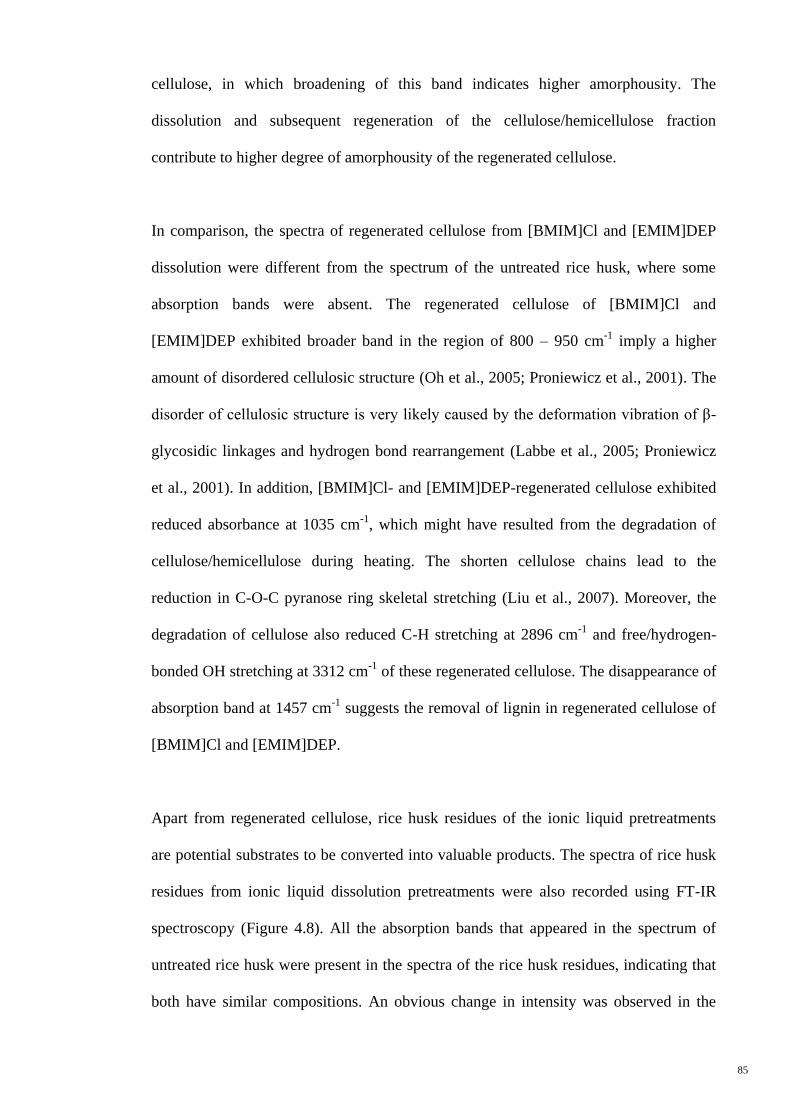
85
cellulose, in which broadening of this band indicates higher amorphousity. The
dissolution and subsequent regeneration of the cellulose/hemicellulose fraction
contribute to higher degree of amorphousity of the regenerated cellulose.
In comparison, the spectra of regenerated cellulose from [BMIM]Cl and [EMIM]DEP
dissolution were different from the spectrum of the untreated rice husk, where some
absorption bands were absent. The regenerated cellulose of [BMIM]Cl and
[EMIM]DEP exhibited broader band in the region of 800 – 950 cm-1
imply a higher
amount of disordered cellulosic structure (Oh et al., 2005; Proniewicz et al., 2001). The
disorder of cellulosic structure is very likely caused by the deformation vibration of β-
glycosidic linkages and hydrogen bond rearrangement (Labbe et al., 2005; Proniewicz
et al., 2001). In addition, [BMIM]Cl- and [EMIM]DEP-regenerated cellulose exhibited
reduced absorbance at 1035 cm-1
, which might have resulted from the degradation of
cellulose/hemicellulose during heating. The shorten cellulose chains lead to the
reduction in C-O-C pyranose ring skeletal stretching (Liu et al., 2007). Moreover, the
degradation of cellulose also reduced C-H stretching at 2896 cm-1
and free/hydrogen-
bonded OH stretching at 3312 cm-1
of these regenerated cellulose. The disappearance of
absorption band at 1457 cm-1
suggests the removal of lignin in regenerated cellulose of
[BMIM]Cl and [EMIM]DEP.
Apart from regenerated cellulose, rice husk residues of the ionic liquid pretreatments
are potential substrates to be converted into valuable products. The spectra of rice husk
residues from ionic liquid dissolution pretreatments were also recorded using FT-IR
spectroscopy (Figure 4.8). All the absorption bands that appeared in the spectrum of
untreated rice husk were present in the spectra of the rice husk residues, indicating that
both have similar compositions. An obvious change in intensity was observed in the

86
band of approximately 1035 cm-1
. Compared with their untreated counter-parts, the
transmittance of this band increased in all the rice husk residues indicating they contain
considerable amount of cellulose/hemicellulose, and possibly lignin, after the ionic
liquid pretreatments. Besides, this also implies that the ionic liquid pretreatments
dissolve components other than cellulose/hemicellulose contributing to proportionate
increase in the relative cellulose/hemicellulose content of rice husk residues. The
intensity of absorption band in the region 800 – 950 cm-1
remained unchanged,
signifying that both the rice husk residues and untreated rice husk do not vary very
much in terms of amorphousity.
Figure 4.8: FT-IR spectra of rice husk residues and untreated rice husk.
FT-IR spectral bands (cm-1
): (a) 3750; (b) 3312; (c) 2919; (d) 1637; (e) 1457; (f) 1035;
(g) 798.

87
On the other hand, a less crystalline regenerated cellulose structures was confirmed by
XRD analysis with the occurrence of a sharper peak at 2θ = 18.7o compared with the
untreated rice husk (Kumar et al., 2009). The lower crystallinity index indicates a higher
amount of amorphous cellulose was present in the regenerated cellulose (Kuo and Lee,
2009b). The results complemented and confirmed the findings of FT-IR analysis
reported previously, in which the cellulose regenerated from ionic liquid pretreatments
exhibited higher amorphousity. All the regenerated cellulose has an estimated 25%
lower crystallinity index compared to untreated rice husk (Table 4.3). Among the
regenerated cellulose, cellulose regenerated from [EMIM]DEP pretreatment gave the
lowest crystallinity index (32.0), followed by regenerated cellulose of [EMIM]OAc and
[BMIM]Cl pretreatments, which were 34.4 and 37.7, respectively.
Table 4.3: Crystallinity indexes of untreated rice husk, regenerated cellulose and rice
husk residue
Rice husk sample Crystallinity index
Untreated rice husk 46.0
Regenerated cellulose
[BMIM]Cl
37.7
[EMIM]OAc 34.4
[EMIM]DEP 32.0
Rice husk residue
[BMIM]Cl
56.1
[EMIM]OAc 39.1
[EMIM]DEP 49.5
Interestingly, rice husk residues of [BMIM]Cl and [EMIM]DEP pretreatments showed
higher crystallinity index compared with the untreated rice husk. Rice husk residue of
[EMIM]OAc pretreatment showed slightly lower crystallinity index than the untreated
rice husk (Table 4.3). The dissolution of amorphous cellulose/hemicellulose in rice husk
88
leaving the more crystalline lignocellulosic matrix in the residue, which accounts for the
higher crystallinity index in rice husk residues of [BMIM]Cl and [EMIM]DEP
pretreatments. The lower crystallinity of rice husk residue of [EMIM]OAc pretreatment
could be due to the swollen structure of rice husk caused by ionic liquid pretreatment.
The structural morphology of cellulose regenerated from the ionic liquids was examined
by SEM (Figure 4.9). All the regenerated cellulose showed rough and conglomerate
textures (Swatloski et al., 2002) and these ribbon-like fibre aggregates were disorderly
arranged in the matrix. The well organized structure commonly present in raw
lignocellulosic biomass was absent signifying the structure of the regenerated cellulose
was more amorphous (Cuissinat et al., 2008). The findings of SEM were in agreement
with the findings of FT-IR analysis where ionic liquid pretreatment reduces crystallinity
of the cellulosic biomass.
Figure 4.9: SEM images of regenerated cellulose from (a) [BMIM]Cl, (b)
[EMIM]OAc, and (c) [EMIM]DEP pretreatments.
Although FT-IR analysis did not demonstrate many changes in chemical compositions
of the residues compared to untreated rice husk, the SEM micrographs show that the
surface structure of the rice husk residues changed significantly (Figure 4.10). The
untreated rice husk had an intact and rather smooth surfaces (Figure 4.10a) while the
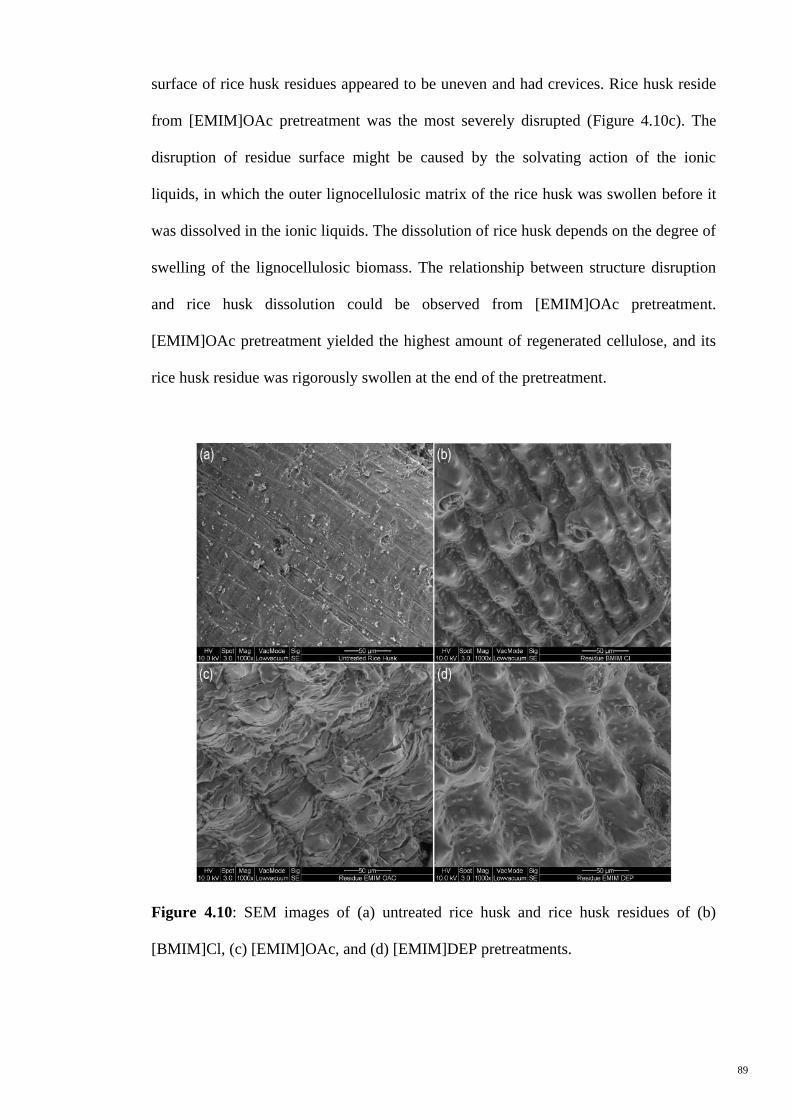
89
surface of rice husk residues appeared to be uneven and had crevices. Rice husk reside
from [EMIM]OAc pretreatment was the most severely disrupted (Figure 4.10c). The
disruption of residue surface might be caused by the solvating action of the ionic
liquids, in which the outer lignocellulosic matrix of the rice husk was swollen before it
was dissolved in the ionic liquids. The dissolution of rice husk depends on the degree of
swelling of the lignocellulosic biomass. The relationship between structure disruption
and rice husk dissolution could be observed from [EMIM]OAc pretreatment.
[EMIM]OAc pretreatment yielded the highest amount of regenerated cellulose, and its
rice husk residue was rigorously swollen at the end of the pretreatment.
Figure 4.10: SEM images of (a) untreated rice husk and rice husk residues of (b)
[BMIM]Cl, (c) [EMIM]OAc, and (d) [EMIM]DEP pretreatments.

90
The collective findings of structural characterization suggest that the pretreatment
products – regenerated cellulose and rice husk residue exhibit favourable properties for
solid-state fermentation. In general, the regenerated cellulose is comprised of low
crystallinity, amorphous cellulose-rich materials; whereas, the rice husk residues are
composed of low crystallinity lignocellulosic biomass with disrupted surface structure.
Among the ionic liquids assessed, [EMIM]OAc that dissolved rice husk and regenerated
the highest amount of regenerated cellulose is a promising reagent for pretreatment of
rice husk. Rice husk pretreated with [EMIM]OAc demonstrated the most severe rice
husk surface structure swelling. The disrupted surface structure of rice husk residues
was favourable for solid-state fermentation where it facilitates microbial growth by
allowing access of microbes to lignocellulosic matrix.
4.1.2.3 Comparison between Chemical and Ionic Liquid Dissolution Pretreatments
The assessments of various reagents in the pretreatment of rice husk using acids, alkalis
and ionic liquids suggest that HCl and [EMIM]OAc are suitable reagents. Both the
pretreatment reagents modified the rice husk structure, and the pretreated biomass
exhibited favourable characteristics for fungal solid-state fermentation. To select a
pretreatment reagent for pretreating rice husk, pros and cons associated with the
mentioned pretreatment methods in terms of operational and economical feasibility, and
handling of reagent were discussed.
The feasibility of a pretreatment process takes into consideration whether the process
could be scaled-up for industrial applications as well as the cost of reagent associated
with the pretreatment process. In the assessment studies, the HCl pretreatment was
conducted at a bigger scale than the [EMIM]OAc pretreatment because of operational
and cost constraints. Due to the availability of many reactor designs and relatively low
91
cost of chemical reagent, HCl pretreatment could potentially be scaled up for pilot or
industrial application. On the contrary, the dissolution pretreatment with [EMIM]OAc
was conducted at a smaller scale due to the limitation of ionic liquid cost that is very
much higher compared to acids or alkalis. When the scale of pretreatment increases, the
amount of ionic liquid required increases proportionately, so does the overall cost of
pretreatment process. Besides, ionic liquid pretreatments need more sophisticated
reactors that could handle viscous and semi-solid reaction mixture during the processes.
Considering the economical feasibility, the preparation of pretreatment reagent in-house
should reduce the overall cost of the dissolution pretreatment. While HCl pretreatment
requires only dilution of concentrated HCl, the synthesis of ionic liquids is more
complicated and involves hazardous organic solvents and chemicals, for instance 1-
methylimidazole, 1-chlorobutane and diethyl ether (Jiang et al., 2006; Lateef et al.,
2009). Ionic liquids too have been named as green solvents for pretreatment of
lignocellulosic biomass because they could be recycled and reused in the pretreatment
processes (Seoud et al., 2007; Zhu et al., 2006). However, regeneration and recycling of
ionic liquids incurs additional cost to the overall dissolution process because the process
involves the use of regeneration chemicals as well as purification column for removal of
impurities (Li et al., 2009).
Besides, the selection of reagent for the pretreatment of rice husk depends largely on the
final achievable aim, cost of overall process, and handling of the reagent. From the
discussed points, HCl was found to be superior pretreatment reagent for rice husk than
[EMIM]OAc because HCl pretreatment is more economically feasible compared to the
ionic liquid pretreatment.
92
4.1.3 Optimization of Rice Husk Pretreatment
Preliminary studies were conducted to determine the range of pretreatment duration,
HCl loading, and pretreatment temperature prior to optimization of rice husk
pretreatment. The mentioned parameters are important and affect rice husk
pretreatment. Figure 4.11 illustrates the findings of the preliminary studies. Under the
pretreatment conditions at 100oC with 0.5% (w/v) HCl loading, the total reducing sugar
content increased sharply in the first two hours of pretreatment and reached plateau
after heating for more than three hours (Figure 4.11a). This indicates that it is not
necessary to prolong the heating duration in the pretreatment of rice husk. From the HCl
loading study, total reducing sugar content increased sharply with HCl loading range
between 0.25 and 0.75% (w/v) (Figure 4.11b). Little increment in total reducing sugar
content was observed with HCl loading higher than 1.0% (w/v). In the study, total
reducing sugar content increased proportionally with the pretreatment temperature
(Figure 4.11c). Several attempts to pretreat rice husk at temperature higher than 140oC
were conducted resulted in charred rice husk sample, and the HCl solution was boiled to
dry. Therefore, the maximum pretreatment temperature for the study was 140oC.
Moreover, pretreatment at higher temperatures requires higher energy cost and
expensive reactor.
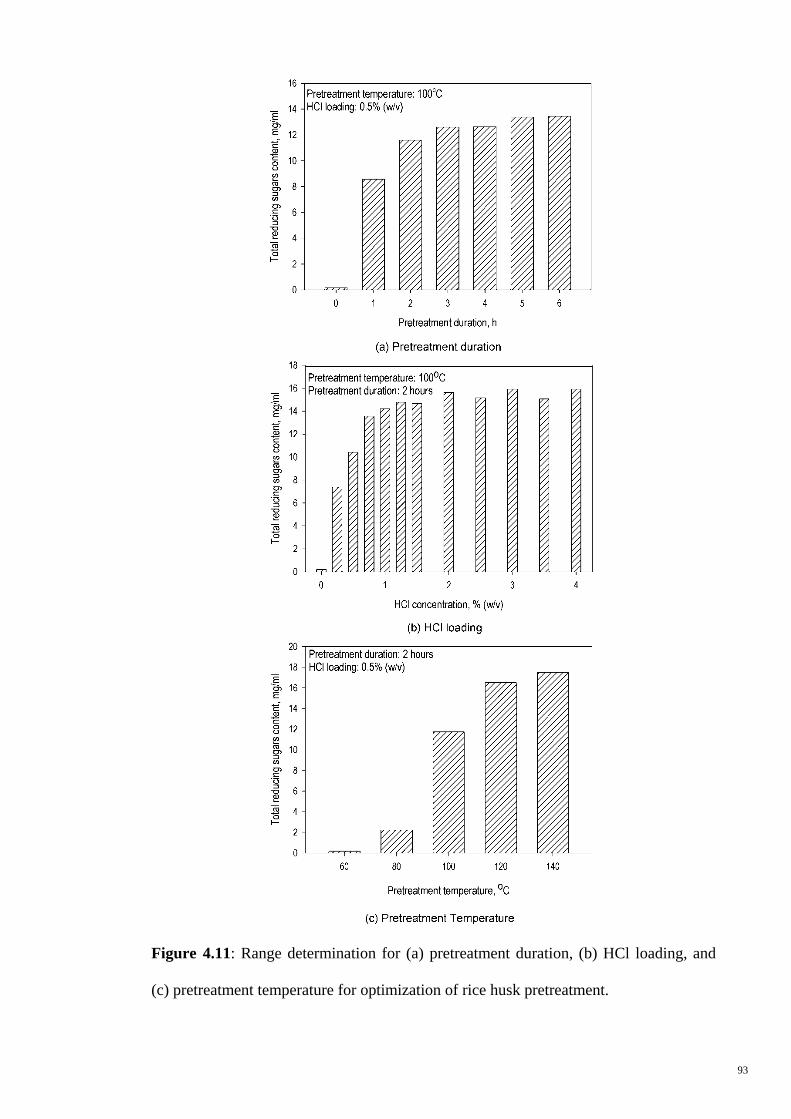
93
Figure 4.11: Range determination for (a) pretreatment duration, (b) HCl loading, and
(c) pretreatment temperature for optimization of rice husk pretreatment.
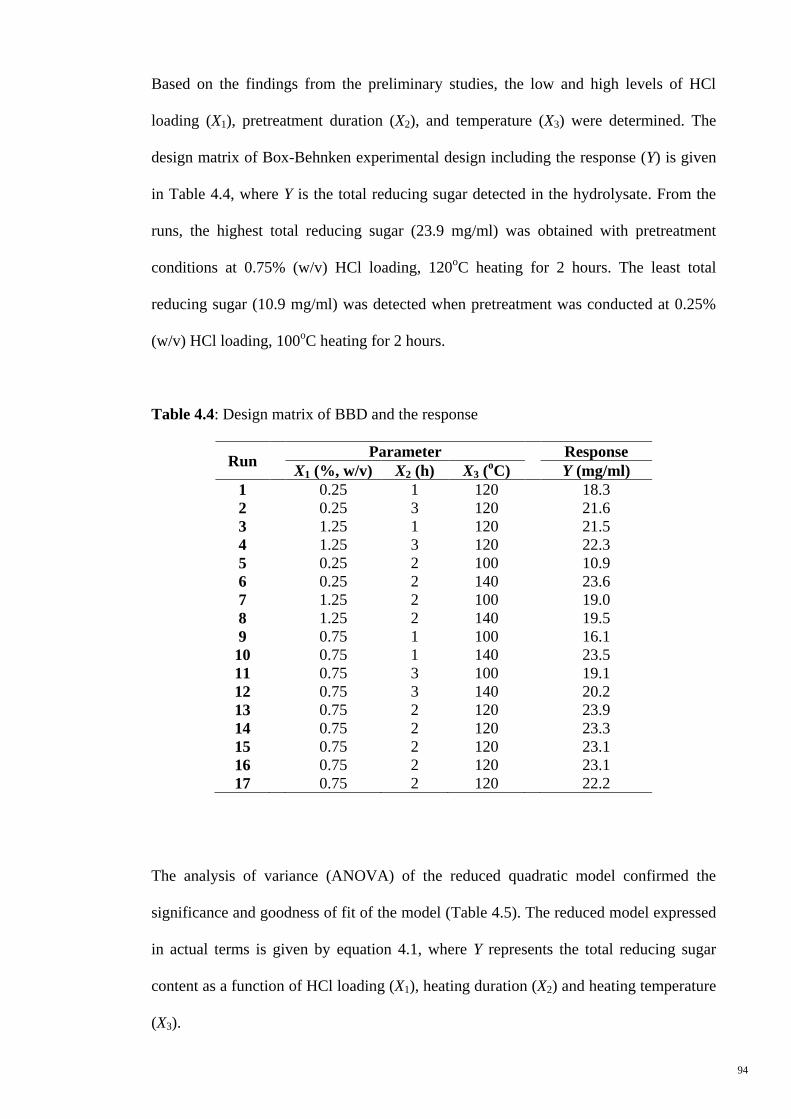
94
Based on the findings from the preliminary studies, the low and high levels of HCl
loading (X1), pretreatment duration (X2), and temperature (X3) were determined. The
design matrix of Box-Behnken experimental design including the response (Y) is given
in Table 4.4, where Y is the total reducing sugar detected in the hydrolysate. From the
runs, the highest total reducing sugar (23.9 mg/ml) was obtained with pretreatment
conditions at 0.75% (w/v) HCl loading, 120oC heating for 2 hours. The least total
reducing sugar (10.9 mg/ml) was detected when pretreatment was conducted at 0.25%
(w/v) HCl loading, 100oC heating for 2 hours.
Table 4.4: Design matrix of BBD and the response
Run Parameter Response
X1 (%, w/v) X2 (h) X3 (oC) Y (mg/ml)
1 0.25 1 120 18.3
2 0.25 3 120 21.6
3 1.25 1 120 21.5
4 1.25 3 120 22.3
5 0.25 2 100 10.9
6 0.25 2 140 23.6
7 1.25 2 100 19.0
8 1.25 2 140 19.5
9 0.75 1 100 16.1
10 0.75 1 140 23.5
11 0.75 3 100 19.1
12 0.75 3 140 20.2
13 0.75 2 120 23.9
14 0.75 2 120 23.3
15 0.75 2 120 23.1
16 0.75 2 120 23.1
17 0.75 2 120 22.2
The analysis of variance (ANOVA) of the reduced quadratic model confirmed the
significance and goodness of fit of the model (Table 4.5). The reduced model expressed
in actual terms is given by equation 4.1, where Y represents the total reducing sugar
content as a function of HCl loading (X1), heating duration (X2) and heating temperature
(X3).
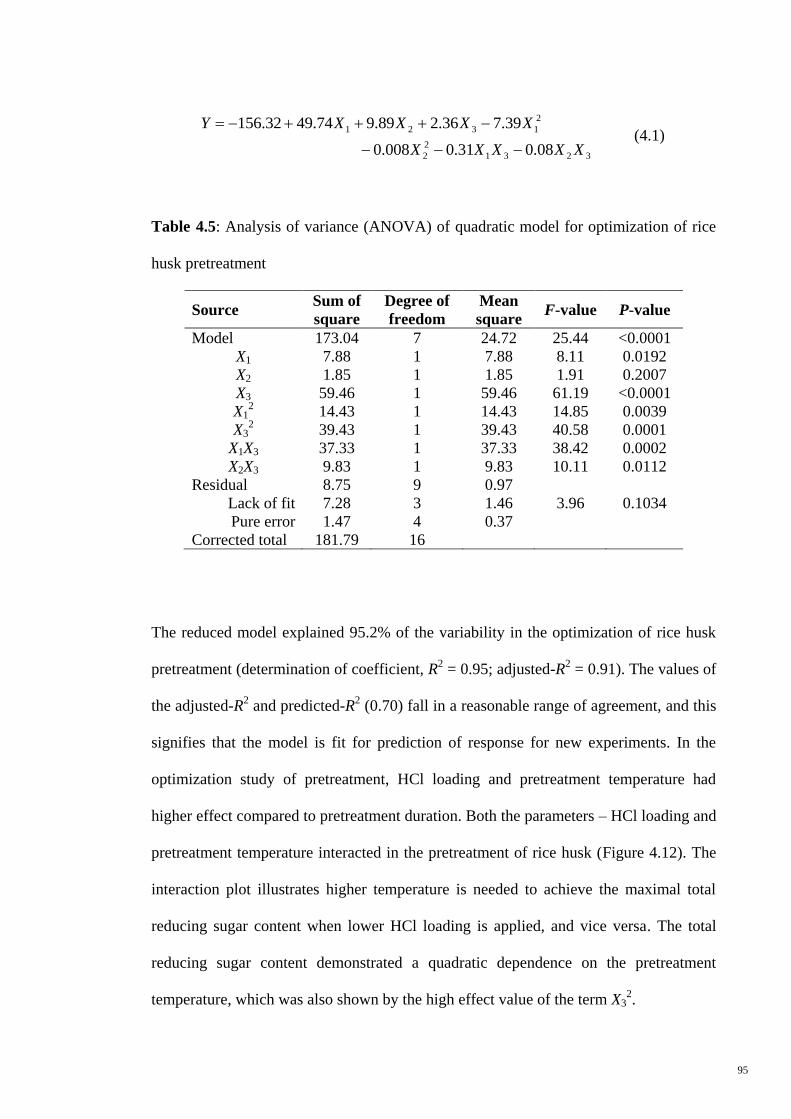
95
3231
2
2
2
1321
08.031.0008.0
39.736.289.974.4932.156
XXXX X
XXXXY
(4.1)
Table 4.5: Analysis of variance (ANOVA) of quadratic model for optimization of rice
husk pretreatment
Source Sum of
square
Degree of
freedom
Mean
square F-value P-value
Model 173.04 7 24.72 25.44 <0.0001
X1 7.88 1 7.88 8.11 0.0192
X2 1.85 1 1.85 1.91 0.2007
X3 59.46 1 59.46 61.19 <0.0001
X12 14.43 1 14.43 14.85 0.0039
X32 39.43 1 39.43 40.58 0.0001
X1X3 37.33 1 37.33 38.42 0.0002
X2X3 9.83 1 9.83 10.11 0.0112
Residual 8.75 9 0.97
Lack of fit 7.28 3 1.46 3.96 0.1034
Pure error 1.47 4 0.37
Corrected total 181.79 16
The reduced model explained 95.2% of the variability in the optimization of rice husk
pretreatment (determination of coefficient, R2 = 0.95; adjusted-R
2 = 0.91). The values of
the adjusted-R2 and predicted-R
2 (0.70) fall in a reasonable range of agreement, and this
signifies that the model is fit for prediction of response for new experiments. In the
optimization study of pretreatment, HCl loading and pretreatment temperature had
higher effect compared to pretreatment duration. Both the parameters – HCl loading and
pretreatment temperature interacted in the pretreatment of rice husk (Figure 4.12). The
interaction plot illustrates higher temperature is needed to achieve the maximal total
reducing sugar content when lower HCl loading is applied, and vice versa. The total
reducing sugar content demonstrated a quadratic dependence on the pretreatment
temperature, which was also shown by the high effect value of the term X32.
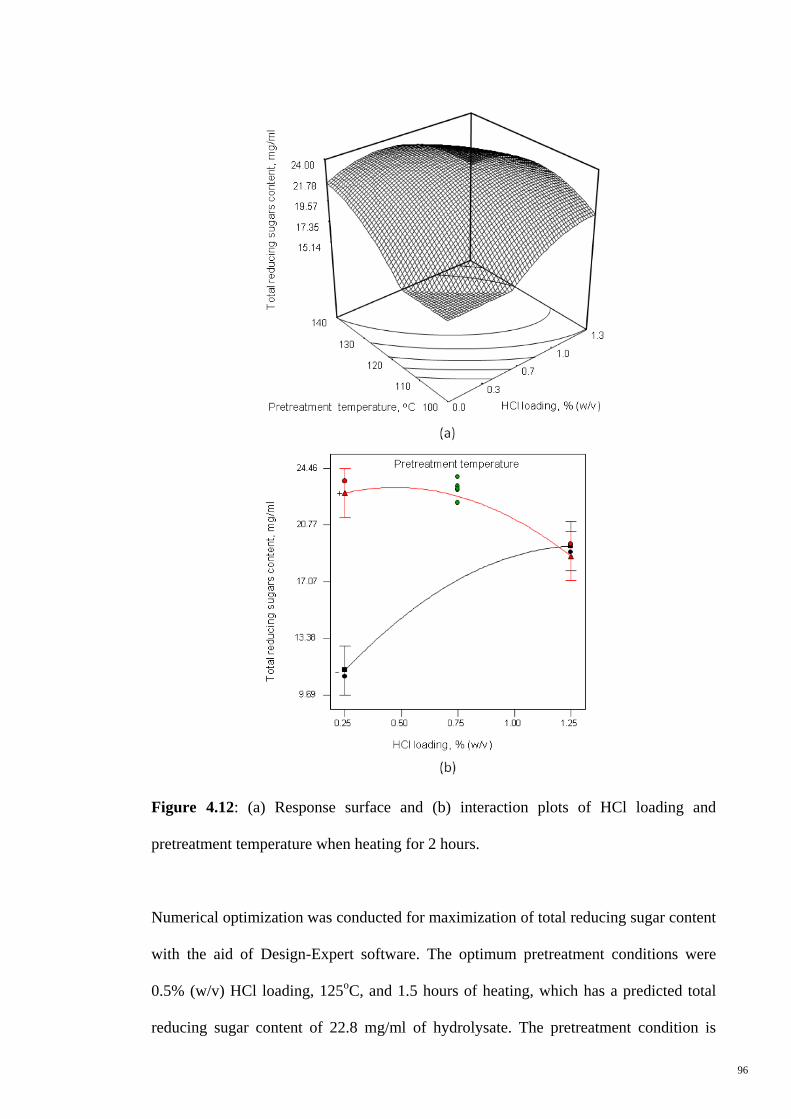
96
Figure 4.12: (a) Response surface and (b) interaction plots of HCl loading and
pretreatment temperature when heating for 2 hours.
Numerical optimization was conducted for maximization of total reducing sugar content
with the aid of Design-Expert software. The optimum pretreatment conditions were
0.5% (w/v) HCl loading, 125oC, and 1.5 hours of heating, which has a predicted total
reducing sugar content of 22.8 mg/ml of hydrolysate. The pretreatment condition is

97
relatively mild compared to similar acid pretreatment studies (Kootstra et al., 2009;
Saha et al., 2005; Vazquez et al., 2007), where it involves low acid loading and
pretreatment temperature. The predicted optimum was verified with triplicate
pretreatment runs. The average total reducing sugar released from the runs was 22.3 ±
0.3 mg/ml. A mere 2% discrepancy between the actual experimental and predicted total
reducing sugar content suggests good predictability of the reduced model.
4.1.4 Concluding Remarks
There are relatively few pretreatment studies carried out to assess the performance of
different types of reagents in pretreating rice husk. In this study, various reagents
including acids, alkalis and ionic liquids were investigated in the pretreatment of rice
husk. Among the reagents investigated, HCl was found to be more superior for
pretreating rice husk. The comprehensive structural studies demonstrated that HCl-
pretreated rice husk, which composed mainly of cellulose and lignin, possessed
enlarged pore size and pore volume. Despite slightly higher crystallinity index, bigger
pore size and volume of the pretreated rice husk is favourable to the attachment and
growth of microbe during solid-state fermentation. The optimization of HCl
pretreatment gives relatively mild optimal condition (0.5% (w/v) HCl loading, 125oC,
and 1.5 hours) involving low HCl loading, low pretreatment temperature and short
duration. The reduced model exhibits 2% discrepancy between the predicted and
experimental suggests its accurate predictability.
98
CHAPTER 5
SCREENING OF FUNGI WITH LIGNINOLYTIC ACTIVITY
Following the pretreatment of rice husk, screening of fungi with ligninolytic activity
was performed. The aim of which is to select a fungus with desired characteristics
intended for various applications, particularly with ligninolytic activity. In general, most
of the screenings of fungal enzyme activities are conducted via colourimetric method, in
which colour changes of synthetic chemicals in media are associated with specific
fungal enzyme activity. In the case of ligninolytic activity, fungi possess ligninolytic
activity are capable of degrading synthetic chemicals with structure similar to lignin
(Esposito et al., 1991; Glenn and Gold, 1983; Gowthaman et al., 2001; Wunch et al.,
1997). Most screening methods interpret ligninolytic activity as either being present or
absent in fungi (Kiiskinen et al., 2004; Mtui and Masalu, 2008; Okino et al., 2000),
while very few approaches associate ligninolytic activity to fungal growth (Keyser et
al., 1978). Hence, qualitative observations of the presence or absence of enzyme activity
in screenings provide little information on the fungus. Typically, fungal ligninolytic
activity has a close relationship to the growth of the fungus. The halo ring formed on
the screening plates indicates fungal ligninolytic activity, while the size of colony is an
estimate of fungal growth. Due to the fact that evaluating fungal growth from dry fungal
cell weight is tedious, the measurement of colony area serves as an alternative and
simpler method to estimate fungal growth in screenings.
A quantitative method to measure fungal ligninolytic activity using media plates
containing screening reagents, namely guaiacol and Remazol brilliant blue-R was
developed. In addition to quantifying fungal ligninolytic activity, the effect of
incubation temperatures on the expression of ligninolytic enzymes was also assessed.

99
From the screening assessments, a potential fungus with desired ligninolytic activity
was selected for subsequent solid-state fermentation.
5.1 Results and Discussion
5.1.1 Screening of Fungal Ligninolytic Enzyme Activity
In this study, a quantitative method to measure ligninolytic activity was developed by
considering the ratio of halo ring to fungal colony against incubation period. A higher
ratio signifies higher ligninolytic activity, and it indicates the fungus has relatively high
ligninolytic activity with respect to its growth. Furthermore, with desirable high ratio
values, fungus does not need to have densely grown biomass before it exhibits enzyme
activity. Densely grown fungal biomass in enzyme filtrate is problematic as it requires
additional processing steps and cost in separating and purifying the target enzyme.
However, a proper separation of fungal biomass from enzyme filtrate is necessary as
some by-products from fungal metabolism inactivate enzyme activity such as lactic acid
(a fungal metabolic by-product) that changes the pH of the enzyme extract and
inactivates the enzyme under acidic conditions.
In the screening studies, the desired ligninolytic activity is shown by the formation of
reddish brown halo ring and/or clear halo ring around fungal colony resulting from
fungal guaiacol oxidation and/or RBB-R decolourization activity, respectively. The
areas of fungal colony (A1) and halo ring (A2) formed are tabulated in Table 5.1, where
the areas of fungal colony and the resulting halo ring are indications of fungal growth
and ligninolytic activity, respectively. The findings show that all the fungi demonstrated
ligninolytic activity, and they were in agreement with the results of the other researchers
(Gowthaman et al., 2001; Mane et al., 2007; Reddy et al., 2003; Thomas et al., 1998).

100
Table 5.1: Areas of fungal colony (A1) and halo ring (A2) for guaiacol oxidation and RBB-R decolourization screenings (incubation period: 48 hours)
(a) Guaiacol oxidation
Area (cm2)
T a
P. chrysosporium P. radiata P. sajor-caju P. sanguineus
A1 A2 R c A1 A2 R
c A1 A2 R
c A1 A2 R
c
RT b 29.3
(± 1.3)
0.0
(± 0.0) 0
0.4
(± 0.0)
4.7
(± 0.4) 12.9
0.8
(± 0.2)
5.3
(± 0.4) 6.8
2.5
(± 1.3)
7.3
(± 0.2) 3.0
35oC 56.8
d
(± 0.0)
0.0
(± 0.0) 0
0.4
(± 0.0)
3.1
(± 0.5) 8.5
0.4
(± 0.0)
5.4
(± 0.4) 14.9
6.7
(± 0.1)
7.4
(± 0.3) 1.1
(b) RBB-R decolourization
Area (cm2)
T a
P. chrysosporium P. radiata P. sajor-caju P. sanguineus
A1 A2 R c A1 A2 R
c A1 A2 R
c A1 A2 R
c
RT b 27.1
(± 0.8)
0.0
(± 0.0) 0
0.4
(± 0.0)
1.5
(± 0.1) 3.9
1.3
(± 0.1)
1.9
(± 0.1) 1.5
1.8
(± 0.3)
2.9
(± 0.3) 1.6
35oC 56.8
d
(± 0.0)
3.2
(± 0.9) 0.1
0.4
(± 0.0)
0.0
(± 0.0) 0
0.4
(± 0.0)
1.7
(± 0.3) 4.6
5.6
(± 0.6)
3.4
(± 0.2) 0.6
a T = incubation temperature.
b RT = laboratory room temperature (in the range of 26 to 28
oC).
c R = ratio of halo ring to fungal colony area.
d Total colonisable surface area of a 9-cm diameter Petri plate = ~56.8 cm
2.
101
In guaiacol oxidation screening, the reference strain P. chrysosporium demonstrated the
highest growth compared to the fungi being screened (Table 5.1a), where its colony
area was 29.3 cm2 after 48 hours of incubation at room temperature. When incubated at
35oC, P. chrysosporium fully colonized the screening plate within 48 hours. Among the
fungi being screened, the highest growth was shown by P. sanguineus, whereby its
colony areas were 2.5 cm2 and 6.7 cm
2 at room temperature and 35
oC, respectively. The
other two fungi P. sajor-caju and P. radiata did not show extensive growth under the
screening conditions. Their colony areas remained at ~0.4 cm2 at both screening
temperatures, except P. sajor-caju demonstrated a slightly higher growth (0.8 cm2)
when being incubated at room temperature. The general trend of fungal growth in
descending order is P. sanguineus, P. sajor-caju and P. radiata. The guaiacol oxidation
screening suggests that P. sanguineus exhibited the highest halo area among the fungi
when incubated at room temperature (7.3 cm2) and 35
oC (7.4 cm
2) (Table 5.1a). The
next highest guaiacol oxidation halo area was given by P. sajor-caju and followed by P.
radiata at both screening temperatures. As for the fungal guaiacol oxidation activity, P.
sanguineus has the highest activity, followed by P. sajor-caju and P. radiata.
Unexpectedly, the guaiacol oxidation activity appeared to be independent of fungal
growth. Despite P. radiata did not show significant changes in growth, it showed
observable guaiacol oxidation activity. This signifies the fungus might have utilized the
nutrient substrate for non-growth associated processes such as the production of
ligninolytic enzymes for the metabolism of guaiacol in screening agar medium as
reported by Lester and Birkett (1999). On the other hand, the reference strain P.
chrysosporium that exhibited the highest growth did not show guaiacol oxidation
activity after 48 hours of incubation at both temperatures. A low degree of guaiacol
oxidation activity was detected only after being incubated at 35oC for 72 hours and
beyond (Figure 5.1). The delay in the occurrence of guaiacol oxidation activity could be

102
attributed to the fungal requirement for longer adaptation time to synthesize ligninolytic
enzymes (Lester and Birkett, 1999). The length of the adaptation time varies, and
depends on the physiology of fungal strain. The observations from P. chrysosporium
shown that incubation temperatures affect the expression of ligninolytic enzymes,
where guaiacol is oxidised only at the fungal optimum growth temperature of 35oC.
Figure 5.1: Guaiacol oxidation screening plates of P. chrysosporium after 72 hours
incubation at (a) room temperature and (b) 35oC.
In RBB-R decolourization screening, the growth of fungi on RBB-R screening plate did
not vary greatly compared to guaiacol oxidation screening. The findings show that P.
chrysosporium was the fastest growing fungus after 48 hours of incubation at both
screening temperatures (Table 5.1b), with colony area of 27.1 cm2 and 56.8 cm
2 at room
temperature and 35oC, respectively. The growth of fungi being screened in this study
was comparable to the guaiacol oxidation screening. Similarly, P. sanguineus
demonstrated the highest growth of 1.8 cm2 and 5.6 cm
2 at room temperature and 35
oC,
respectively. Meanwhile, the other two fungi did not show significant growth under the
screening conditions, except P. sajor-caju showed slightly higher growth (1.3 cm2) at
room temperature. The general growth trend of the fungi being screened is in the
descending order of P. sanguineus, P. sajor-caju and P. radiata. While all the fungi
103
being screened exhibited RBB-R decolourization activity at both the screening
temperatures, P. radiata only showed the activity at room temperature (refer Table
5.1b). Among the fungi screened, P. sanguineus has the highest areas of decolourization
halo of 2.9 cm2 and 3.4 cm
2 at room temperature and 35
oC, respectively. The sequence
was followed by P. sajor-caju and P. radiata. The reference strain did not show any
guaiacol oxidation activity at both room temperature and 35oC, but RBB-R
decolourization at 35oC. It had relatively high decolourization halo area (3.2 cm
2) that
was comparable to P. sanguineus. At both screening temperatures, the RBB-R
decolourization activity of the fungi was in descending order of P. sanguineus, P. sajor-
caju and P. radiata.
In both guaiacol oxidation and RBB-R decolourization screenings, the reference strain
demonstrated the highest growth, and it colonized the plates completely after 48 hours
at 35oC. The fungus with the next highest growth was P. sanguineus followed by P.
sajor-caju and P. radiata. It was observed that the growth of P. sanguineus was
approximately two to three folds higher when incubated at 35oC compared to room
temperature in both screenings. In contrast, the oyster mushroom P. sajor-caju has two
to three folds higher growth when incubated at room temperature than at 35oC.
Meanwhile, the growth of P. radiata appeared to be unaffected by the screening
incubation temperatures. Despite the unusual behaviour of P. radiata, all other fungi
demonstrated that incubation temperatures have effect on fungal growth.
In addition to the areas of halo ring and fungal colony, the ratio of halo ring area to
fungal colony area as previously mentioned in equation 3.10. Comparatively, all fungi
have about two to five folds higher guaiacol oxidation activity than RBB-R
decolourization activity. At room temperature, the halo to colony area ratio of guaiacol
104
oxidation as in descending order of P. radiata (12.9), P. sajor-caju (6.8), and P.
sanguineus (3.0). However, at 35oC, P. sajor-caju has the highest ratio (14.9) followed
by P. radiata (8.5) and P. sanguineus (1.1). The reference strain P. chrysosporium did
not exhibit guaiacol oxidation activity in the screening. For RBB-R decolourization
screening, the ratio of decolourization halo ring area to colony area at room temperature
in descending order was P. radiata (3.9), P. sanguineus (1.6), and P. sajor-caju (1.5).
At 35oC, the edible oyster mushroom P. sajor-caju possessed the highest ratio (4.6)
followed by P. sanguineus (0.6) and the reference fungus P. chrysosporium (0.1).
5.1.2 Selection of Fungus for Solid-State Fermentation
The fungus selected was applied in solid-state fermentation of rice husk to produce
ligninolytic enzymes. The selection was made based on fungus having high ratio values
in guaiacol oxidation and RBB-R decolourization screenings. The ratio values provide a
basis for ligninolytic activity of the fungi, and they indicate the fungal performance in
producing the enzymes. In the selection of fungi, there might be more than one strain of
fungi showing desired characteristics. Thus, the ultimate applications of the fungus have
to be taken into consideration during the selection of fungus.
Based on the ratio values computed, P. radiata might be a potential fungus for the
subsequent solid-state fermentation showing the highest ratio values in both screenings
at room temperature. However, when this fungus was incubated at 35oC, it exhibited a
low ratio value in guaiacol oxidation screening, and the RBB-R decolourization activity
was completely absent. On the other hand, the edible oyster mushroom P. sajor-caju,
which has moderate ratio values at room temperature, showed a better ratio values than
P. radiata at 35oC. This signifies that P. sajor-caju is a good producer of ligninolytic
105
enzymes at both room temperature and 35oC. The other fungus P. sanguineus showed
only insignificant ratio values in the screenings at the incubation temperatures.
Fungi do not strive equally well on all the lignocellulosic agricultural by-products as
these lignocellulosic substrates vary in their nutrient compositions. The lignocellulosic
biomass – rice husk used in this study, which has been identified as rich in cellulose,
has been reported to be beneficial for the cultivation of Pleurotus species oyster
mushroom (Frimpong-Manso et al., 2011; Hanai et al., 2005). The presence of rice husk
in the growth substrate improves the biological efficiency (yield potential) of the
mushrooms (Frimpong-Manso et al., 2011).
In view of the discussion presented, P. sajor-caju was selected for the subsequent solid-
state fermentation of rice husk. Its application in solid-state fermentation has several
advantages as the fungus could grow and produce ligninolytic enzymes at ambient
temperature, and maintaining its growth as well as ligninolytic activity when the
temperature of the solid bed increases during the process.
5.1.3 Concluding Remarks
In the screening assessments, all the fungi had demonstrated positive guaiacol oxidation
and RBB-R decolourization activities suggesting their ability in producing ligninolytic
enzymes. The findings of the screenings show P. sajor-caju is the most suitable fungus
for solid-state fermentation of rice husk as it exhibits ligninolytic activity at both room
temperature and 35oC. The capability of P. sajor-caju in preserving its ligninolytic
enzymes expression at higher temperatures is crucial in solid-state fermentation to
ensure fungal performance as the temperature of the solid bed increases during
fermentation.

106
CHAPTER 6
SOLID-STATE FERMENTATION
Comprehensive pretreatment reagent screening study and the selection of fungus have
been addressed in the previous chapters. This chapter reports on the production of
laccase enzyme via the application of Pleurotus sajor-caju in solid-state fermentation of
rice husk. Pleurotus sajor-caju that shows desirable ligninolytic activity was selected
from the screening of various strains. Novel findings contributing to the development of
fungal solid-state fermentation was presented with the development of a novel and user-
friendly inoculum preparation technique. The challenges involving the preparation of
actively growing and quantifiable fungal inoculum were addressed. Prior to solid-state
fermentation studies, the time profile of laccase enzyme production of the fungus and
the effect of inducers on the fungal laccase enzyme production system were also
conducted. Lastly, the fungal laccase enzyme was characterized and its performance
was evaluated.
To present the findings comprehensively, five main sections of namely (i) preparation
of inoculum, (ii) time profile study and the effect of inducers on laccase enzyme
production, (iii) optimization of solid-state fermentation, (iv) modelling of laccase
enzyme production, and (v) characterization of laccase enzyme will be discussed.
6.1 Results and Discussion
6.1.1 Development of Novel Inoculum Preparation – Cellophane Film Culture
(CFC) Technique
To date, most of the solid-state fermentations were conducted at laboratory scale with
only a few conducted in industrial scale due to the unresolved technological and
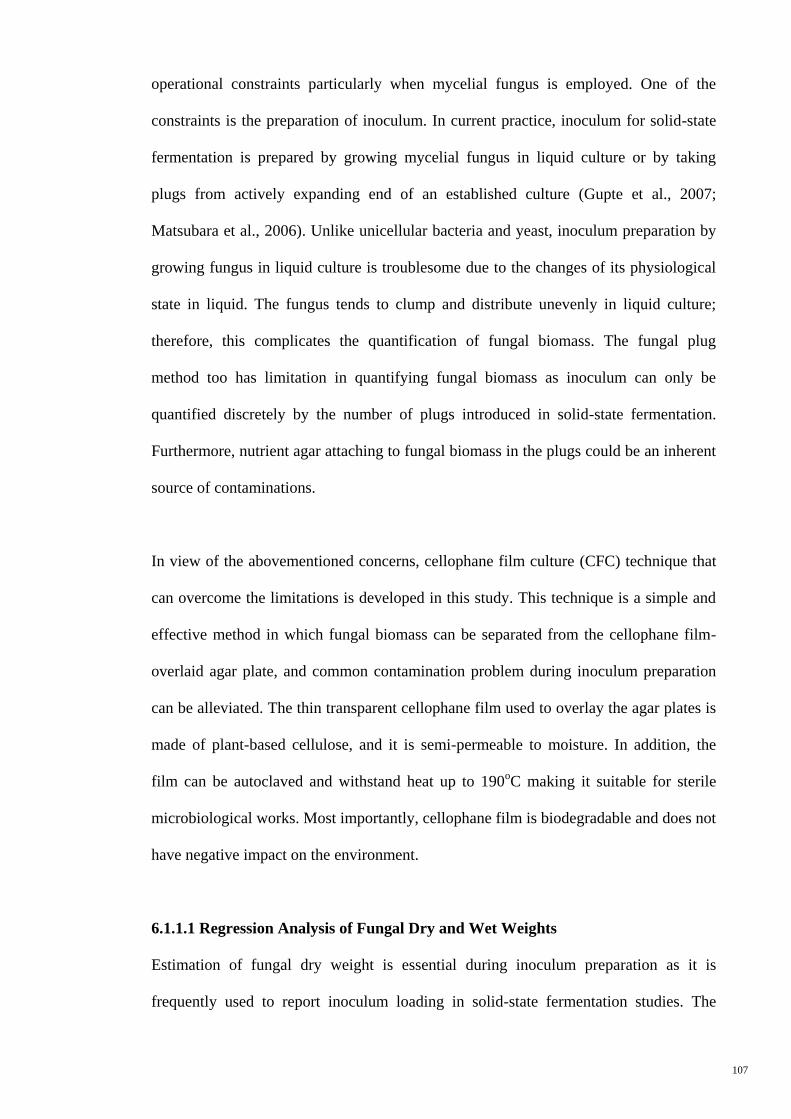
107
operational constraints particularly when mycelial fungus is employed. One of the
constraints is the preparation of inoculum. In current practice, inoculum for solid-state
fermentation is prepared by growing mycelial fungus in liquid culture or by taking
plugs from actively expanding end of an established culture (Gupte et al., 2007;
Matsubara et al., 2006). Unlike unicellular bacteria and yeast, inoculum preparation by
growing fungus in liquid culture is troublesome due to the changes of its physiological
state in liquid. The fungus tends to clump and distribute unevenly in liquid culture;
therefore, this complicates the quantification of fungal biomass. The fungal plug
method too has limitation in quantifying fungal biomass as inoculum can only be
quantified discretely by the number of plugs introduced in solid-state fermentation.
Furthermore, nutrient agar attaching to fungal biomass in the plugs could be an inherent
source of contaminations.
In view of the abovementioned concerns, cellophane film culture (CFC) technique that
can overcome the limitations is developed in this study. This technique is a simple and
effective method in which fungal biomass can be separated from the cellophane film-
overlaid agar plate, and common contamination problem during inoculum preparation
can be alleviated. The thin transparent cellophane film used to overlay the agar plates is
made of plant-based cellulose, and it is semi-permeable to moisture. In addition, the
film can be autoclaved and withstand heat up to 190oC making it suitable for sterile
microbiological works. Most importantly, cellophane film is biodegradable and does not
have negative impact on the environment.
6.1.1.1 Regression Analysis of Fungal Dry and Wet Weights
Estimation of fungal dry weight is essential during inoculum preparation as it is
frequently used to report inoculum loading in solid-state fermentation studies. The
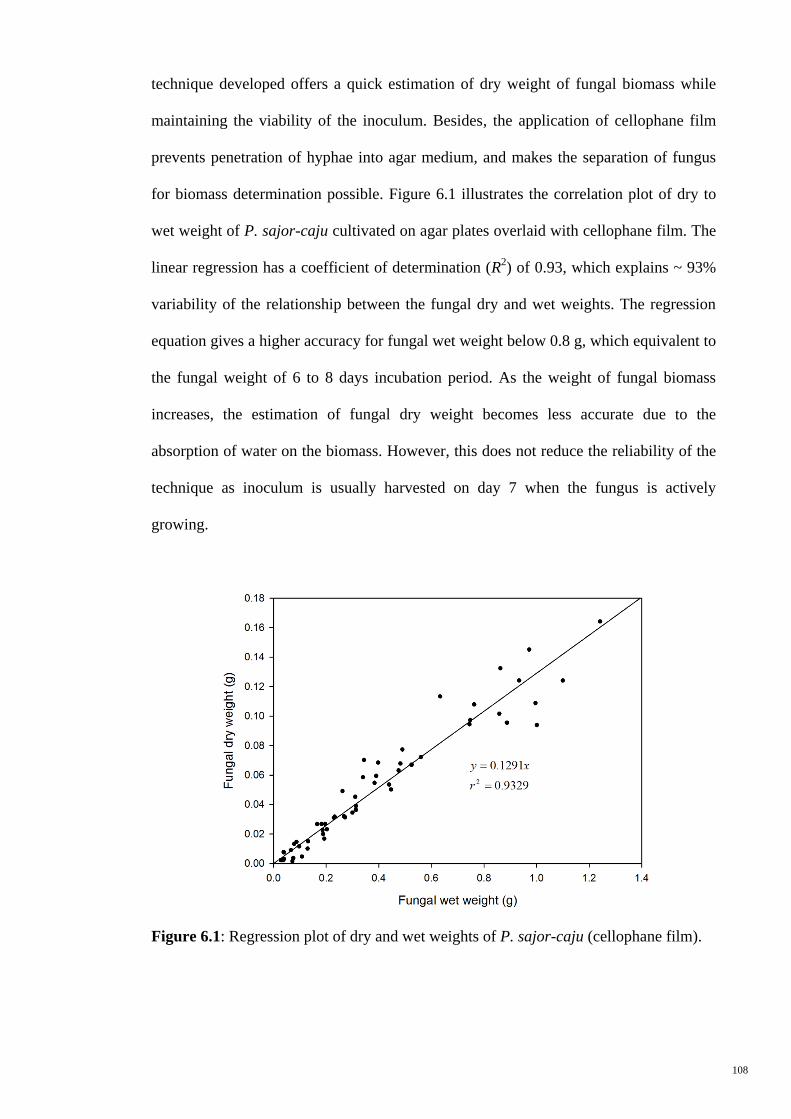
108
technique developed offers a quick estimation of dry weight of fungal biomass while
maintaining the viability of the inoculum. Besides, the application of cellophane film
prevents penetration of hyphae into agar medium, and makes the separation of fungus
for biomass determination possible. Figure 6.1 illustrates the correlation plot of dry to
wet weight of P. sajor-caju cultivated on agar plates overlaid with cellophane film. The
linear regression has a coefficient of determination (R2) of 0.93, which explains ~ 93%
variability of the relationship between the fungal dry and wet weights. The regression
equation gives a higher accuracy for fungal wet weight below 0.8 g, which equivalent to
the fungal weight of 6 to 8 days incubation period. As the weight of fungal biomass
increases, the estimation of fungal dry weight becomes less accurate due to the
absorption of water on the biomass. However, this does not reduce the reliability of the
technique as inoculum is usually harvested on day 7 when the fungus is actively
growing.
Figure 6.1: Regression plot of dry and wet weights of P. sajor-caju (cellophane film).
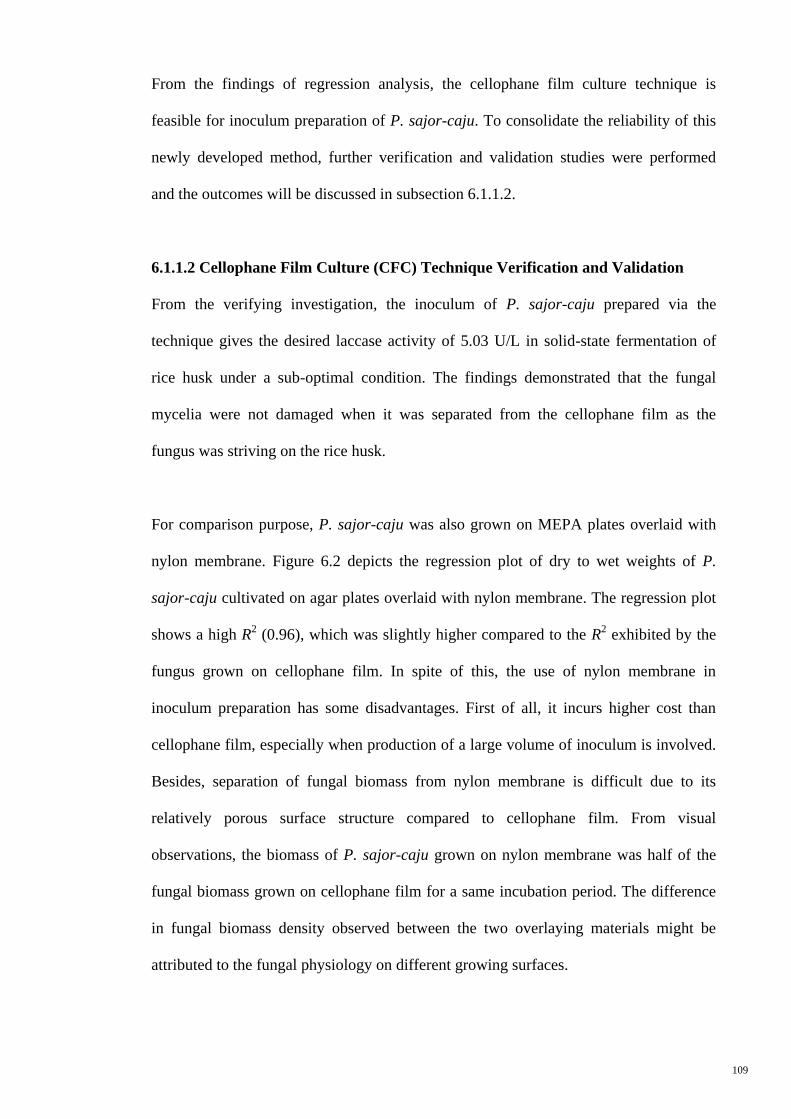
109
From the findings of regression analysis, the cellophane film culture technique is
feasible for inoculum preparation of P. sajor-caju. To consolidate the reliability of this
newly developed method, further verification and validation studies were performed
and the outcomes will be discussed in subsection 6.1.1.2.
6.1.1.2 Cellophane Film Culture (CFC) Technique Verification and Validation
From the verifying investigation, the inoculum of P. sajor-caju prepared via the
technique gives the desired laccase activity of 5.03 U/L in solid-state fermentation of
rice husk under a sub-optimal condition. The findings demonstrated that the fungal
mycelia were not damaged when it was separated from the cellophane film as the
fungus was striving on the rice husk.
For comparison purpose, P. sajor-caju was also grown on MEPA plates overlaid with
nylon membrane. Figure 6.2 depicts the regression plot of dry to wet weights of P.
sajor-caju cultivated on agar plates overlaid with nylon membrane. The regression plot
shows a high R2 (0.96), which was slightly higher compared to the R
2 exhibited by the
fungus grown on cellophane film. In spite of this, the use of nylon membrane in
inoculum preparation has some disadvantages. First of all, it incurs higher cost than
cellophane film, especially when production of a large volume of inoculum is involved.
Besides, separation of fungal biomass from nylon membrane is difficult due to its
relatively porous surface structure compared to cellophane film. From visual
observations, the biomass of P. sajor-caju grown on nylon membrane was half of the
fungal biomass grown on cellophane film for a same incubation period. The difference
in fungal biomass density observed between the two overlaying materials might be
attributed to the fungal physiology on different growing surfaces.
110
Figure 6.2: Regression plot of dry and wet weights of P. sajor-caju (nylon membrane).
To evaluate the applicability of the cellophane film culture technique for other strains of
fungi, further validation of the technique was conducted by using another strain of
white-rot fungus (P. sanguineus). The findings showed that P. sanguineus can also
grow on cellophane film and its regression plot shown in Figure 6.3 gives a good
correlation of fungal dry to wet weights. This signifies that the technique is applicable
to other fungal strains. Besides that, the cellophane film culture technique has added
benefits compared to the existing inoculum preparation methods, which will be detailed
in the following section.
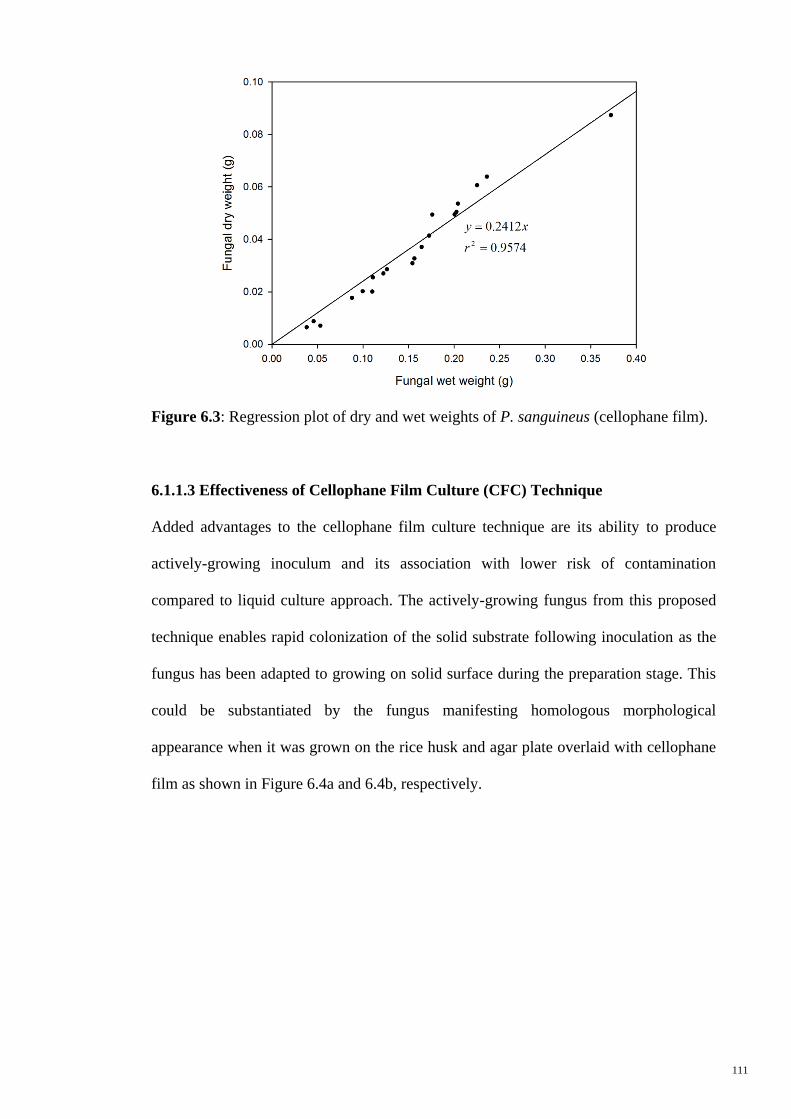
111
Figure 6.3: Regression plot of dry and wet weights of P. sanguineus (cellophane film).
6.1.1.3 Effectiveness of Cellophane Film Culture (CFC) Technique
Added advantages to the cellophane film culture technique are its ability to produce
actively-growing inoculum and its association with lower risk of contamination
compared to liquid culture approach. The actively-growing fungus from this proposed
technique enables rapid colonization of the solid substrate following inoculation as the
fungus has been adapted to growing on solid surface during the preparation stage. This
could be substantiated by the fungus manifesting homologous morphological
appearance when it was grown on the rice husk and agar plate overlaid with cellophane
film as shown in Figure 6.4a and 6.4b, respectively.
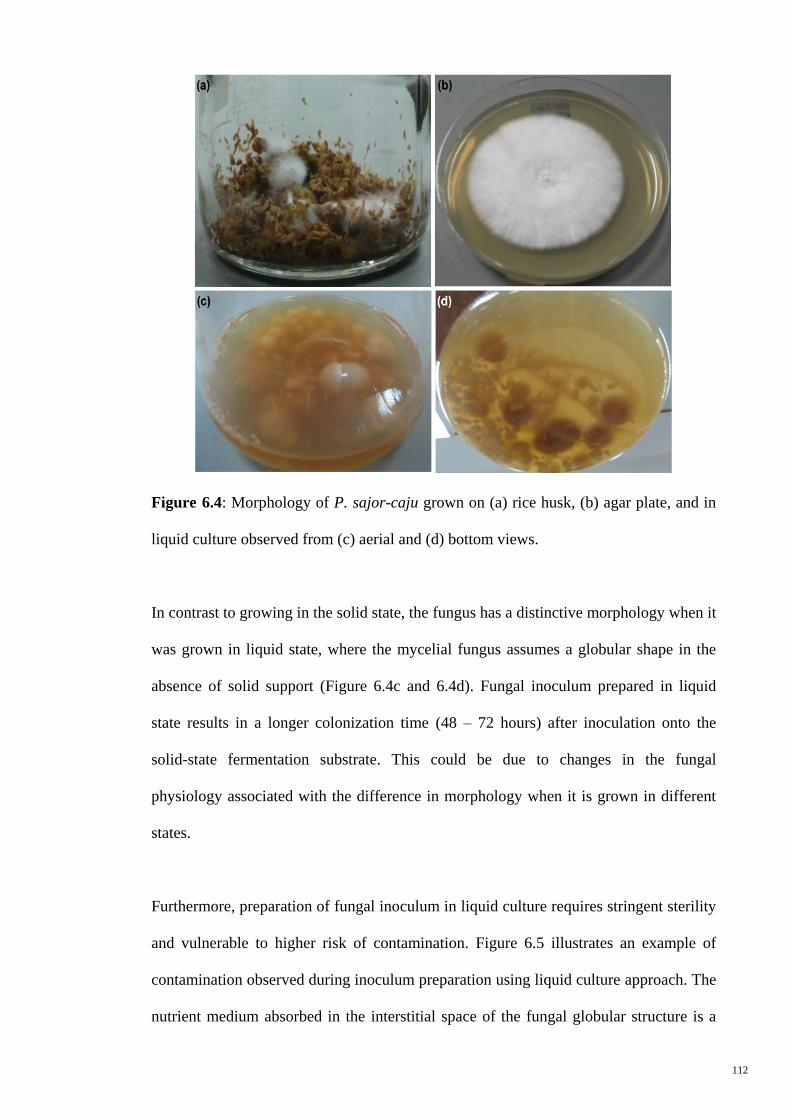
112
Figure 6.4: Morphology of P. sajor-caju grown on (a) rice husk, (b) agar plate, and in
liquid culture observed from (c) aerial and (d) bottom views.
In contrast to growing in the solid state, the fungus has a distinctive morphology when it
was grown in liquid state, where the mycelial fungus assumes a globular shape in the
absence of solid support (Figure 6.4c and 6.4d). Fungal inoculum prepared in liquid
state results in a longer colonization time (48 – 72 hours) after inoculation onto the
solid-state fermentation substrate. This could be due to changes in the fungal
physiology associated with the difference in morphology when it is grown in different
states.
Furthermore, preparation of fungal inoculum in liquid culture requires stringent sterility
and vulnerable to higher risk of contamination. Figure 6.5 illustrates an example of
contamination observed during inoculum preparation using liquid culture approach. The
nutrient medium absorbed in the interstitial space of the fungal globular structure is a
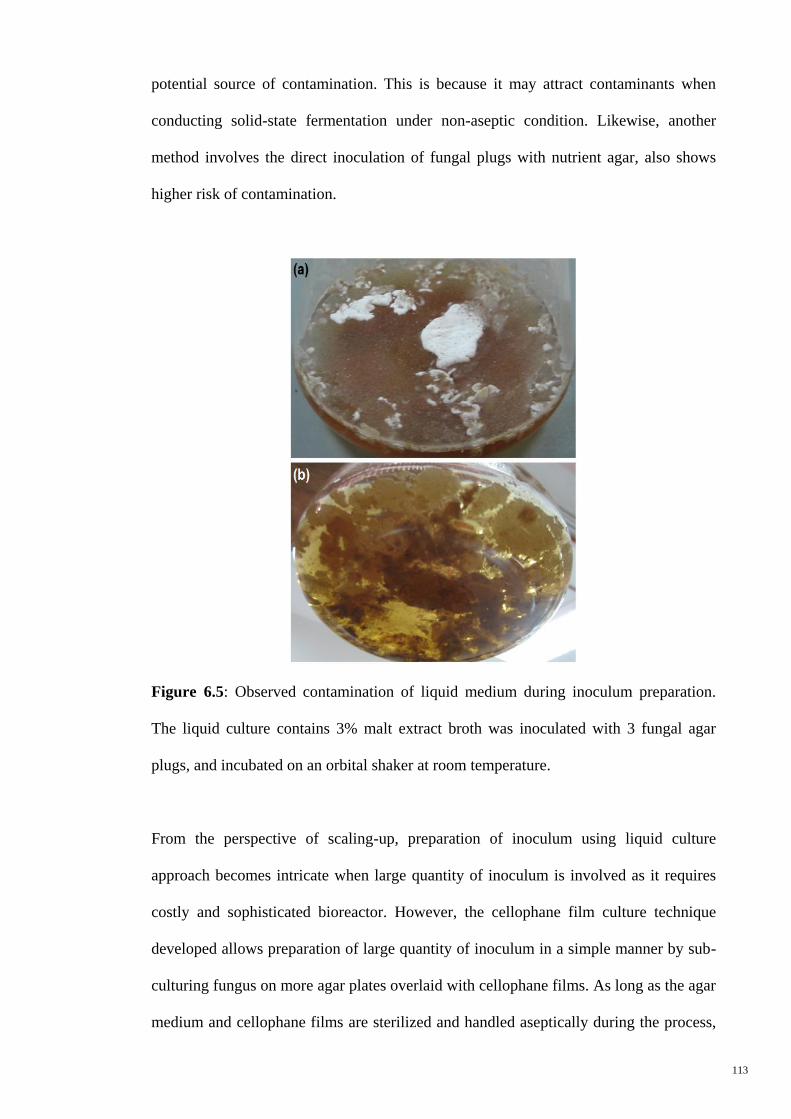
113
potential source of contamination. This is because it may attract contaminants when
conducting solid-state fermentation under non-aseptic condition. Likewise, another
method involves the direct inoculation of fungal plugs with nutrient agar, also shows
higher risk of contamination.
Figure 6.5: Observed contamination of liquid medium during inoculum preparation.
The liquid culture contains 3% malt extract broth was inoculated with 3 fungal agar
plugs, and incubated on an orbital shaker at room temperature.
From the perspective of scaling-up, preparation of inoculum using liquid culture
approach becomes intricate when large quantity of inoculum is involved as it requires
costly and sophisticated bioreactor. However, the cellophane film culture technique
developed allows preparation of large quantity of inoculum in a simple manner by sub-
culturing fungus on more agar plates overlaid with cellophane films. As long as the agar
medium and cellophane films are sterilized and handled aseptically during the process,
114
this technique is capable of producing good quality inoculum. With respect to the
sterility of the autoclaved cellophane films on agar plates, it can be maintained up to a
period of 12 months or longer under room temperature. In addition to that, the transfer
of inoculum from agar plates to solid substrate can be preformed without the need of a
laminar flow cabinet.
6.1.2 Time Profile Study and Effect of Inducers
A careful experimental design for solid-state fermentation can save time and resources
by avoiding unnecessarily long fermentation duration. Thus, the time profile of laccase
enzyme production is useful in deciding a suitable length of duration for the solid-state
fermentation. Besides, the inclusion of inducers into the fermentation substrate can also
improve the laccase enzyme production. Selected inducers like copper sulphate, glucose
and Tween 80 were examined on the enhancement of laccase enzyme activity, which is
essential for the subsequent solid-state fermentation process and optimization study.
The time profile investigation was conducted with rice husk as the sole nutrient source
without the addition of inducers. The time profile plot of laccase activity of the crude
enzyme filtrate from solid-state fermentation of rice husk is shown in Figure 6.6. The
laccase enzyme activity increased sharply during the first 48 hours of fermentation and
reached its maximum of 45 U/L in 72 hours. After that the laccase enzyme activity
gradually declined and remained at a low enzyme activity level of ~10 U/L from 192
until 480 hours. The sharp increase in laccase enzyme activity within 48 hours of
inoculation was evidenced from the rapid colonization of the rice husk substrate by the
fungus. The fungal inoculum employed in this study has been acclimatized to grow
under solid-state condition, and thus, it colonized rice husk without a significant lag
phase. As the fungus grows, it produces ligninolytic enzymes such as laccase to

115
breakdown lignin in rice husk. When sufficient degradation of lignin in the rice husk
was achieved at localized spots, laccase enzyme may reduce in production leading to a
gradual decrease in its activity.
Figure 6.6: Time profile plot of laccase activity of the crude enzyme filtrate in solid-
state fermentation of rice husk.
Maximum laccase enzyme activity was observed in less than 100 hours of fermentation,
which is earlier than a similar fungal solid-state fermentation of wheat straw that
employs Pleurotus ostreatus whereby its maximum enzyme activity was shown at 192-
hour of fermentation (Patel et al., 2009). The difference could be attributed to the fungal
physiology of the different type of fungal inoculum employed. Patel and co-workers
(2009) applied mycelial plugs that contained residue agar medium, which is easily
utilized by the fungus before it produces ligninolytic enzymes for breaking down the
lignocellulosic wheat straw. On the other hand, the inoculum prepared in this study
consisted mainly of actively growing fungal biomass, thus it is essential for the fungus
to produce ligninolytic enzymes before the biomass can be utilized.
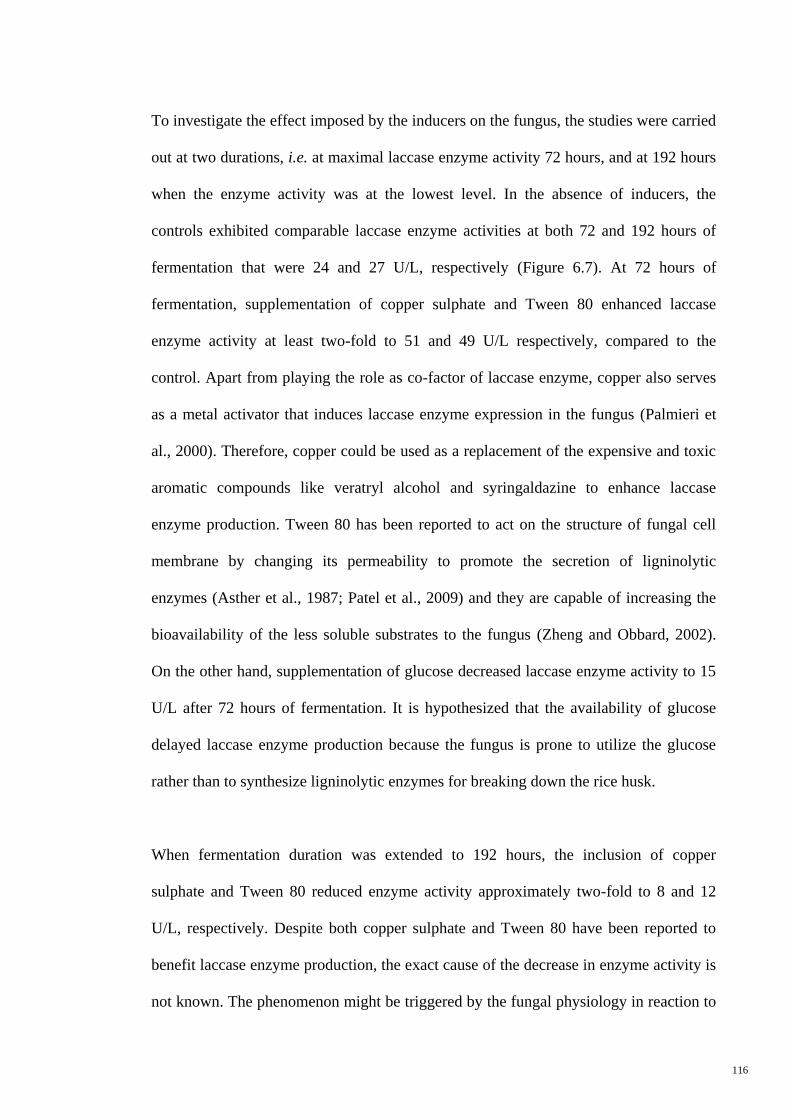
116
To investigate the effect imposed by the inducers on the fungus, the studies were carried
out at two durations, i.e. at maximal laccase enzyme activity 72 hours, and at 192 hours
when the enzyme activity was at the lowest level. In the absence of inducers, the
controls exhibited comparable laccase enzyme activities at both 72 and 192 hours of
fermentation that were 24 and 27 U/L, respectively (Figure 6.7). At 72 hours of
fermentation, supplementation of copper sulphate and Tween 80 enhanced laccase
enzyme activity at least two-fold to 51 and 49 U/L respectively, compared to the
control. Apart from playing the role as co-factor of laccase enzyme, copper also serves
as a metal activator that induces laccase enzyme expression in the fungus (Palmieri et
al., 2000). Therefore, copper could be used as a replacement of the expensive and toxic
aromatic compounds like veratryl alcohol and syringaldazine to enhance laccase
enzyme production. Tween 80 has been reported to act on the structure of fungal cell
membrane by changing its permeability to promote the secretion of ligninolytic
enzymes (Asther et al., 1987; Patel et al., 2009) and they are capable of increasing the
bioavailability of the less soluble substrates to the fungus (Zheng and Obbard, 2002).
On the other hand, supplementation of glucose decreased laccase enzyme activity to 15
U/L after 72 hours of fermentation. It is hypothesized that the availability of glucose
delayed laccase enzyme production because the fungus is prone to utilize the glucose
rather than to synthesize ligninolytic enzymes for breaking down the rice husk.
When fermentation duration was extended to 192 hours, the inclusion of copper
sulphate and Tween 80 reduced enzyme activity approximately two-fold to 8 and 12
U/L, respectively. Despite both copper sulphate and Tween 80 have been reported to
benefit laccase enzyme production, the exact cause of the decrease in enzyme activity is
not known. The phenomenon might be triggered by the fungal physiology in reaction to
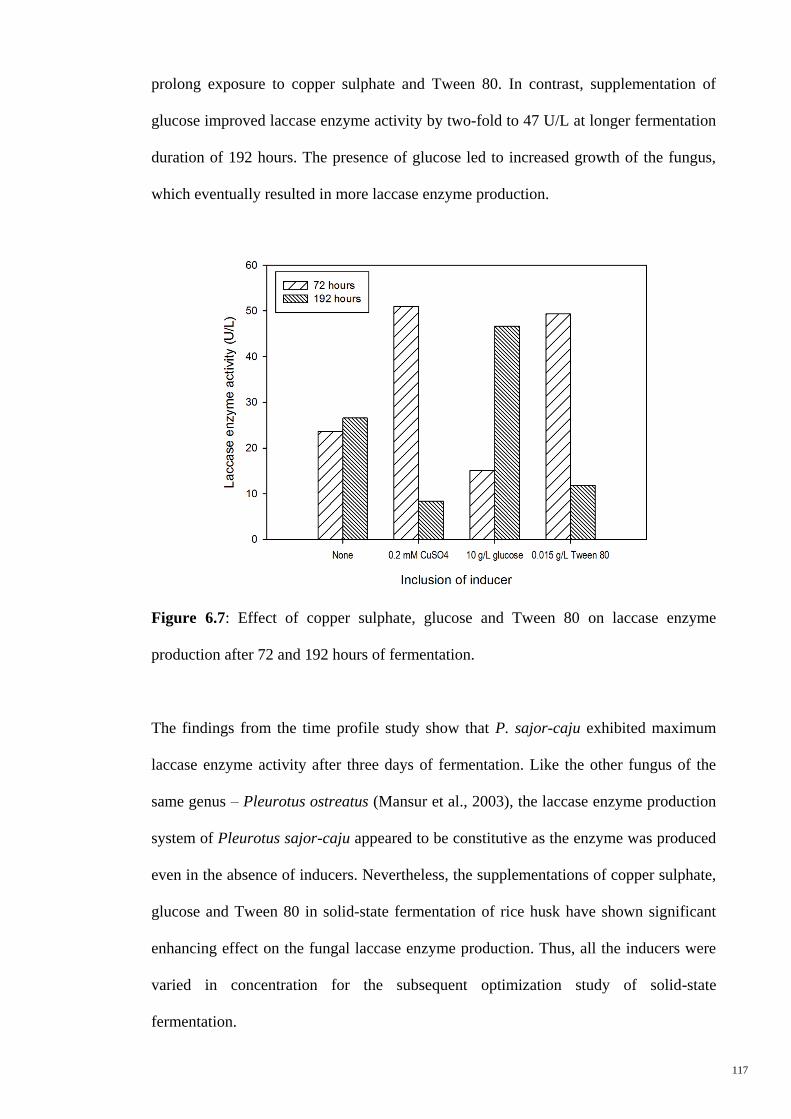
117
prolong exposure to copper sulphate and Tween 80. In contrast, supplementation of
glucose improved laccase enzyme activity by two-fold to 47 U/L at longer fermentation
duration of 192 hours. The presence of glucose led to increased growth of the fungus,
which eventually resulted in more laccase enzyme production.
Figure 6.7: Effect of copper sulphate, glucose and Tween 80 on laccase enzyme
production after 72 and 192 hours of fermentation.
The findings from the time profile study show that P. sajor-caju exhibited maximum
laccase enzyme activity after three days of fermentation. Like the other fungus of the
same genus – Pleurotus ostreatus (Mansur et al., 2003), the laccase enzyme production
system of Pleurotus sajor-caju appeared to be constitutive as the enzyme was produced
even in the absence of inducers. Nevertheless, the supplementations of copper sulphate,
glucose and Tween 80 in solid-state fermentation of rice husk have shown significant
enhancing effect on the fungal laccase enzyme production. Thus, all the inducers were
varied in concentration for the subsequent optimization study of solid-state
fermentation.

118
6.1.3 Optimization of Solid-State Fermentation
The optimization of solid-state fermentation was conducted using central composite
experimental design with four parameters at five levels. The parameters considered are
fermentation duration (X’1), copper sulphate (X’2), glucose (X’3), and Tween 80
concentrations (X’4). Based on the findings from the previous section, the low and high
levels of the parameters were determined (Table 6.1). The design matrix of central
composite experimental design including the response (Y’) is tabulated in Table 6.2,
where Y’ is the specific laccase enzyme activity of the crude enzyme filtrate. The
specific enzyme activity instead of laccase activity was used in the response for
reporting enzyme production yield. The highest specific laccase enzyme activity (0.96
U/mg) was obtained at fermentation conditions with supplementation of 0.4 mM copper
sulphate, 20 g/L glucose, 0.02 g/L Tween 80, and fermentation for 120 hours. The least
specific laccase enzyme activity (0.02 U/mg) was observed when no copper sulphate
was supplemented while the other parameters remained the same.
Considering the large ratio of the maximum response (0.96 U/mg) to the minimum
response (0.02 U/mg), the response (Y’) was transformed by taking logarithm to the
base of 10 prior to statistical analysis of variance (ANOVA). The ANOVA of the
reduced quadratic model is summarized in Table 6.3, and it confirmed the significance
and goodness of fit of the model. The expression of reduced model in actual terms is
shown in equation 6.1, where Y’ represents the specific laccase enzyme activity as a
function of fermentation duration (X’1), copper sulphate (X’2), glucose (X’3), and Tween
80 concentrations (X’4).

119
Table 6.1: Low and high levels with alpha values of CCD
Parameter Unit Low
level
High
level
Low
Alpha
High
Alpha
Fermentation duration (X’1) h 84 156 48 192
Copper sulphate (X’2) mM 0.2 0.6 0 0.8
Glucose (X’3) g/L 10 30 0 40
Tween 80 (X’4) g/L 0.01 0.03 0 0.04
The reduced model explained ~80% of the variability in the optimization of fungal
solid-state fermentation of rice husk for laccase production (determination of
coefficient, R2 = 0.80; adjusted-R
2 = 0.70). Compared with the non-reduced model, the
predicted-R2 value of the reduced model has improved considerably. This makes the
model fit for predicting specific laccase enzyme activity produced in solid-state
fermentation. From the optimization study, the concentration of copper sulphate (X’2)
had the most significant effect on the specific laccase enzyme activity, which agreed
with earlier discussion in which copper is one of the components that constitutes the
laccase enzyme, and its presence in the fermentation substrate induces the fungus to
express and produce more laccase enzyme (Palmieri et al., 2000). Although the
inclusion of Tween 80 (X’4) was shown to promote laccase enzyme activity production,
its effect is comparatively smaller than the inclusion of glucose (X’3) in the optimization
of solid-state fermentation.
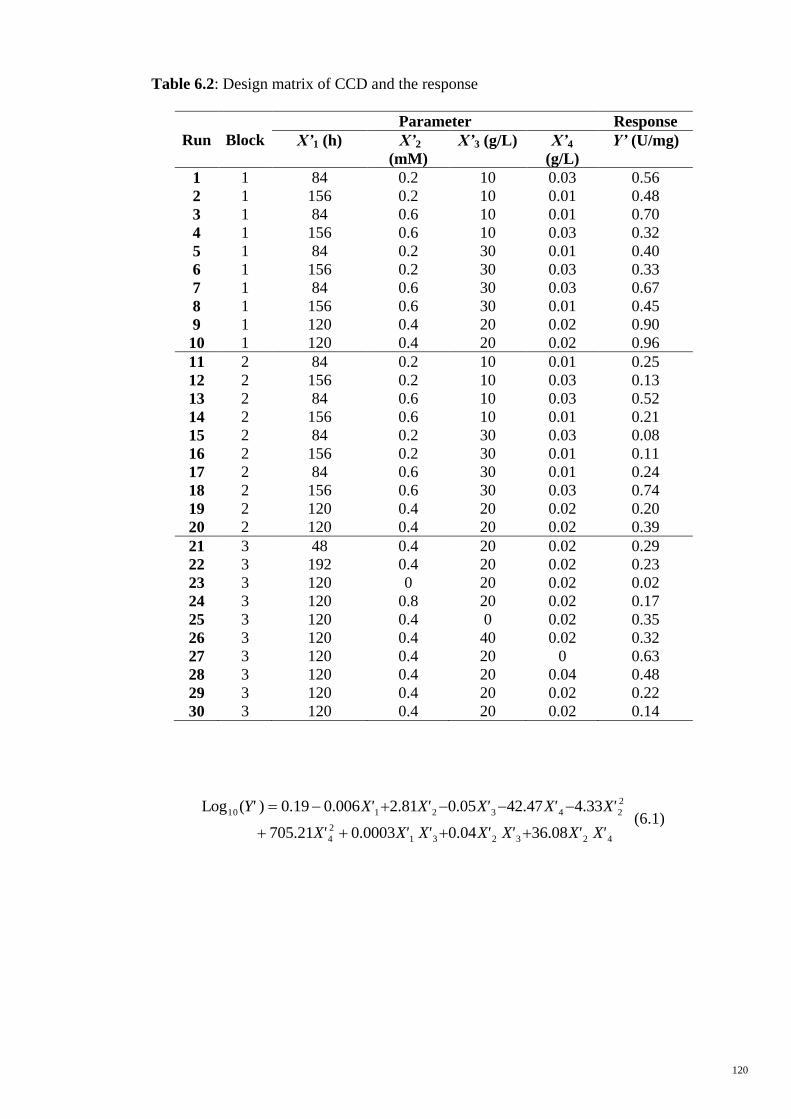
120
Table 6.2: Design matrix of CCD and the response
Run Block
Parameter Response
X’1 (h) X’2
(mM)
X’3 (g/L) X’4
(g/L)
Y’ (U/mg)
1 1 84 0.2 10 0.03 0.56
2 1 156 0.2 10 0.01 0.48
3 1 84 0.6 10 0.01 0.70
4 1 156 0.6 10 0.03 0.32
5 1 84 0.2 30 0.01 0.40
6 1 156 0.2 30 0.03 0.33
7 1 84 0.6 30 0.03 0.67
8 1 156 0.6 30 0.01 0.45
9 1 120 0.4 20 0.02 0.90
10 1 120 0.4 20 0.02 0.96
11 2 84 0.2 10 0.01 0.25
12 2 156 0.2 10 0.03 0.13
13 2 84 0.6 10 0.03 0.52
14 2 156 0.6 10 0.01 0.21
15 2 84 0.2 30 0.03 0.08
16 2 156 0.2 30 0.01 0.11
17 2 84 0.6 30 0.01 0.24
18 2 156 0.6 30 0.03 0.74
19 2 120 0.4 20 0.02 0.20
20 2 120 0.4 20 0.02 0.39
21 3 48 0.4 20 0.02 0.29
22 3 192 0.4 20 0.02 0.23
23 3 120 0 20 0.02 0.02
24 3 120 0.8 20 0.02 0.17
25 3 120 0.4 0 0.02 0.35
26 3 120 0.4 40 0.02 0.32
27 3 120 0.4 20 0 0.63
28 3 120 0.4 20 0.04 0.48
29 3 120 0.4 20 0.02 0.22
30 3 120 0.4 20 0.02 0.14
423231
2
4
2
2432110
36.080.040.0003 705.21
4.3342.470.052.810.0060.19)(Log
X'X'X'X'X'X'X'
X'X'X'X'X'Y'
(6.1)
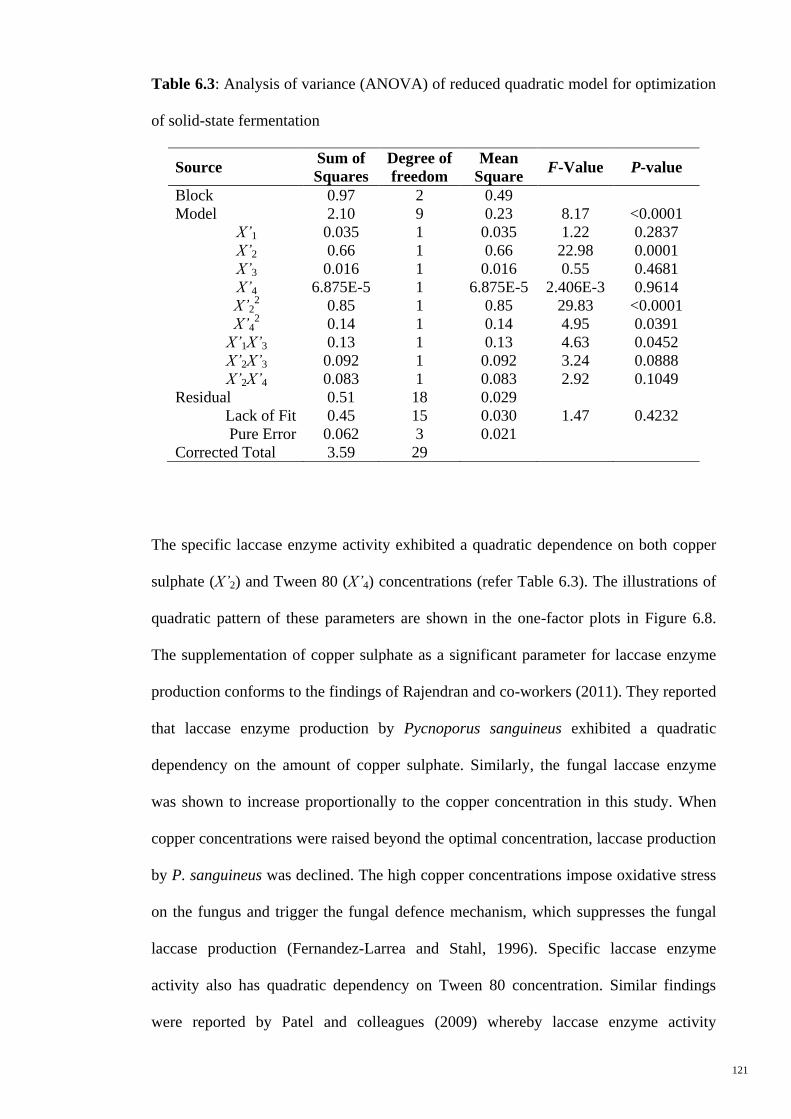
121
Table 6.3: Analysis of variance (ANOVA) of reduced quadratic model for optimization
of solid-state fermentation
Source Sum of
Squares
Degree of
freedom
Mean
Square F-Value P-value
Block 0.97 2 0.49
Model 2.10 9 0.23 8.17 <0.0001
X’1 0.035 1 0.035 1.22 0.2837
X’2 0.66 1 0.66 22.98 0.0001
X’3 0.016 1 0.016 0.55 0.4681
X’4 6.875E-5 1 6.875E-5 2.406E-3 0.9614
X’22 0.85 1 0.85 29.83 <0.0001
X’42 0.14 1 0.14 4.95 0.0391
X’1X’3 0.13 1 0.13 4.63 0.0452
X’2X’3 0.092 1 0.092 3.24 0.0888
X’2X’4 0.083 1 0.083 2.92 0.1049
Residual 0.51 18 0.029
Lack of Fit 0.45 15 0.030 1.47 0.4232
Pure Error 0.062 3 0.021
Corrected Total 3.59 29
The specific laccase enzyme activity exhibited a quadratic dependence on both copper
sulphate (X’2) and Tween 80 (X’4) concentrations (refer Table 6.3). The illustrations of
quadratic pattern of these parameters are shown in the one-factor plots in Figure 6.8.
The supplementation of copper sulphate as a significant parameter for laccase enzyme
production conforms to the findings of Rajendran and co-workers (2011). They reported
that laccase enzyme production by Pycnoporus sanguineus exhibited a quadratic
dependency on the amount of copper sulphate. Similarly, the fungal laccase enzyme
was shown to increase proportionally to the copper concentration in this study. When
copper concentrations were raised beyond the optimal concentration, laccase production
by P. sanguineus was declined. The high copper concentrations impose oxidative stress
on the fungus and trigger the fungal defence mechanism, which suppresses the fungal
laccase production (Fernandez-Larrea and Stahl, 1996). Specific laccase enzyme
activity also has quadratic dependency on Tween 80 concentration. Similar findings
were reported by Patel and colleagues (2009) whereby laccase enzyme activity
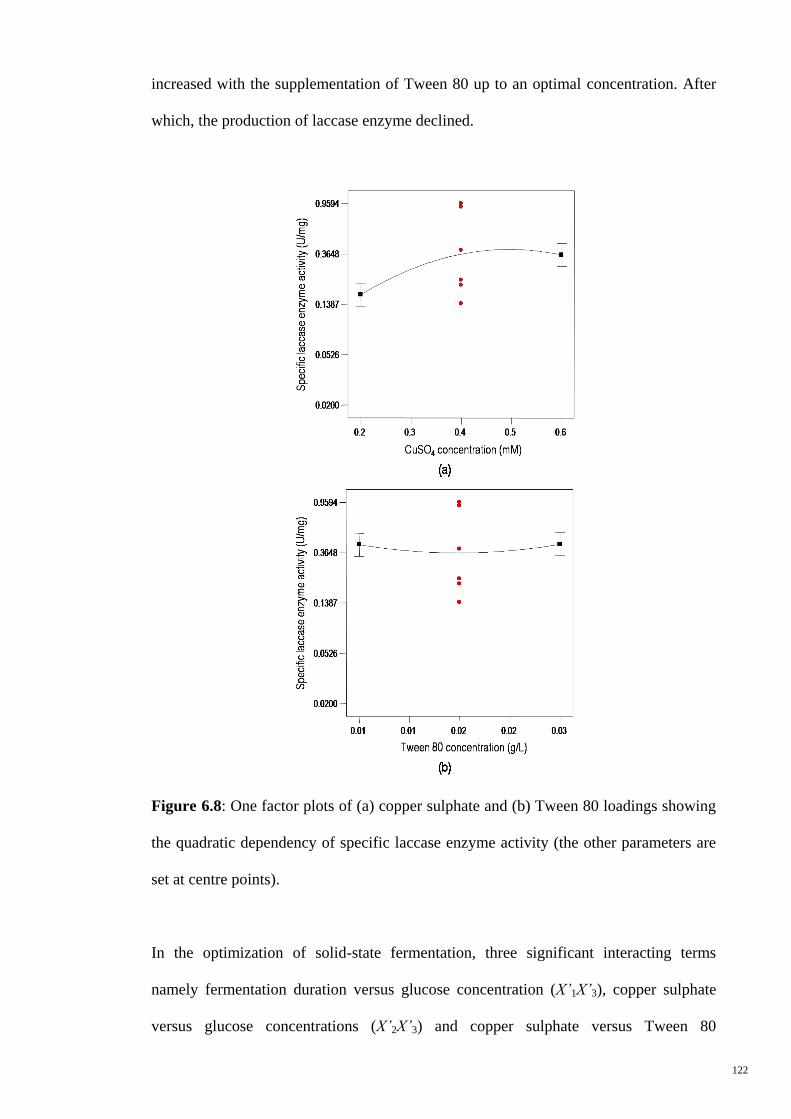
122
increased with the supplementation of Tween 80 up to an optimal concentration. After
which, the production of laccase enzyme declined.
Figure 6.8: One factor plots of (a) copper sulphate and (b) Tween 80 loadings showing
the quadratic dependency of specific laccase enzyme activity (the other parameters are
set at centre points).
In the optimization of solid-state fermentation, three significant interacting terms
namely fermentation duration versus glucose concentration (X’1X’3), copper sulphate
versus glucose concentrations (X’2X’3) and copper sulphate versus Tween 80
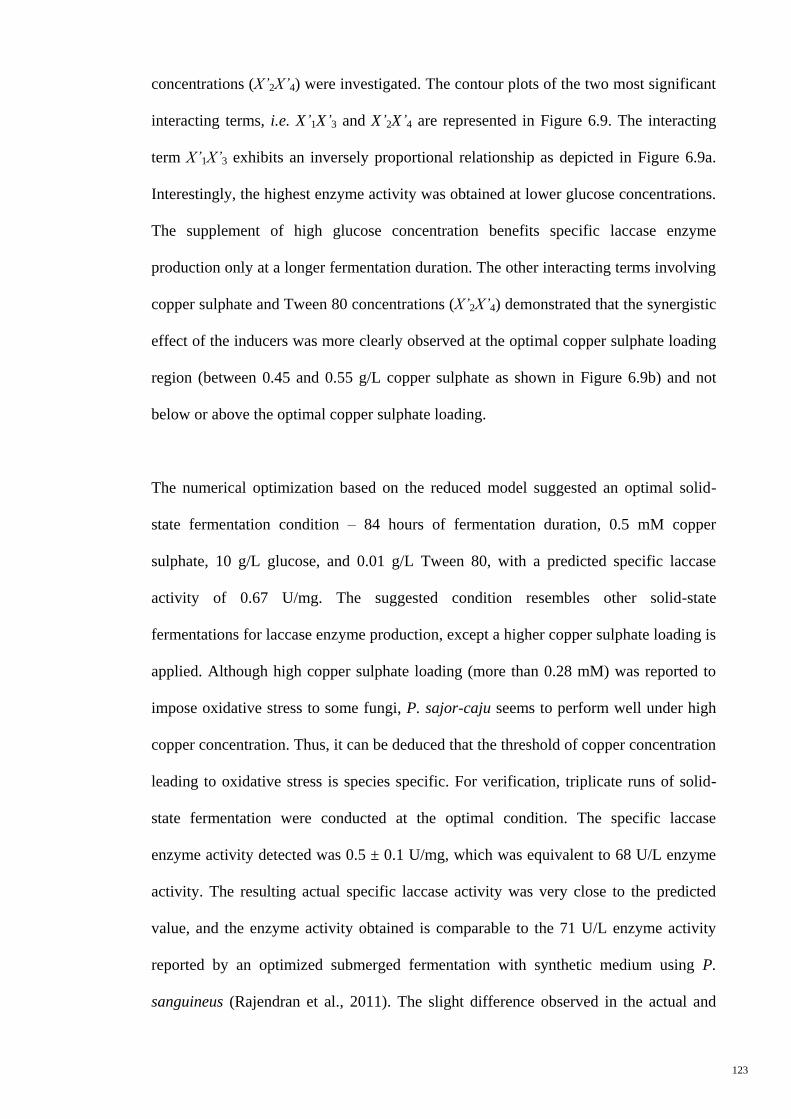
123
concentrations (X’2X’4) were investigated. The contour plots of the two most significant
interacting terms, i.e. X’1X’3 and X’2X’4 are represented in Figure 6.9. The interacting
term X’1X’3 exhibits an inversely proportional relationship as depicted in Figure 6.9a.
Interestingly, the highest enzyme activity was obtained at lower glucose concentrations.
The supplement of high glucose concentration benefits specific laccase enzyme
production only at a longer fermentation duration. The other interacting terms involving
copper sulphate and Tween 80 concentrations (X’2X’4) demonstrated that the synergistic
effect of the inducers was more clearly observed at the optimal copper sulphate loading
region (between 0.45 and 0.55 g/L copper sulphate as shown in Figure 6.9b) and not
below or above the optimal copper sulphate loading.
The numerical optimization based on the reduced model suggested an optimal solid-
state fermentation condition – 84 hours of fermentation duration, 0.5 mM copper
sulphate, 10 g/L glucose, and 0.01 g/L Tween 80, with a predicted specific laccase
activity of 0.67 U/mg. The suggested condition resembles other solid-state
fermentations for laccase enzyme production, except a higher copper sulphate loading is
applied. Although high copper sulphate loading (more than 0.28 mM) was reported to
impose oxidative stress to some fungi, P. sajor-caju seems to perform well under high
copper concentration. Thus, it can be deduced that the threshold of copper concentration
leading to oxidative stress is species specific. For verification, triplicate runs of solid-
state fermentation were conducted at the optimal condition. The specific laccase
enzyme activity detected was 0.5 ± 0.1 U/mg, which was equivalent to 68 U/L enzyme
activity. The resulting actual specific laccase activity was very close to the predicted
value, and the enzyme activity obtained is comparable to the 71 U/L enzyme activity
reported by an optimized submerged fermentation with synthetic medium using P.
sanguineus (Rajendran et al., 2011). The slight difference observed in the actual and
124
predicted values might be attributed by the complexity of biological system, the
lignocellulosic substrate used, and the batch-to-batch variation of solid-state
fermentation.
Figure 6.9: Contour plots of the interacting parameters (a) fermentation duration versus
glucose concentration, and (b) copper sulphate versus Tween 80 concentrations (the
other parameters are set at centre points).
125
6.1.4 Modelling of Laccase Enzyme Production
To have better understanding on the principles of laccase enzyme production in fungal
solid-state fermentation, modelling of the enzyme production was performed. With the
aid of response surface methodology, an optimal condition with respect to the
maximum specific laccase enzyme activity was obtained. The response surface
methodology develops optimization model via empirical approach using various
mathematical and statistical techniques. The modelling of laccase enzyme production
was considered only at the increasing phase in this study because solid-state
fermentation is usually discontinued at maximum enzyme activity before the decay
phase of enzyme production.
Several attempts were made to measure fungal growth in terms of total protein and
relative glucosamine contents to determine the maximum biomass concentration (Xm)
and specific growth rate (μm) for the solid-state fermentation. The total protein content
of the crude enzyme filtrate decreased since the beginning until ~18-hour of the
fermentation, after which the total protein content remained constant at a relatively low
level (Figure 6.10a). On the other hand, the relative glucosamine content of the fungus
did not change significantly during the course of the fermentation (Figure 6.10b). This
might be due to the relatively short fermentation duration for any significant changes in
fungal glucosamine content to be detected (Sugama and Okazaki, 1979).
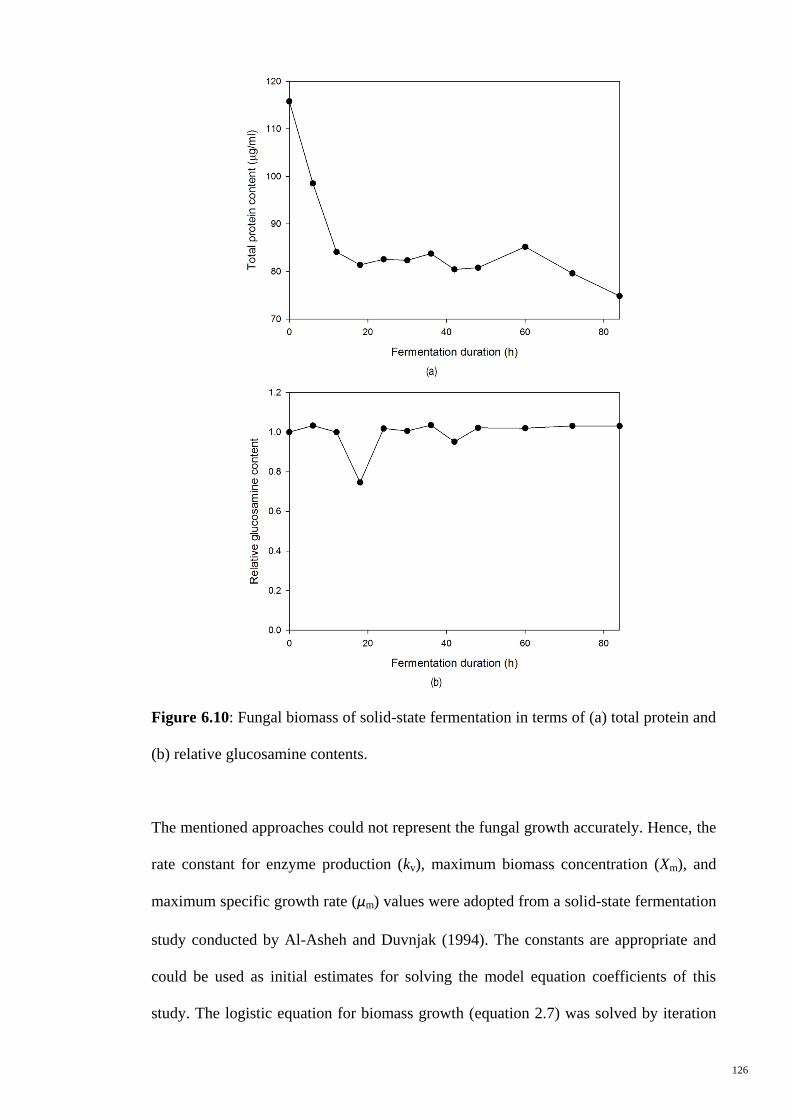
126
Figure 6.10: Fungal biomass of solid-state fermentation in terms of (a) total protein and
(b) relative glucosamine contents.
The mentioned approaches could not represent the fungal growth accurately. Hence, the
rate constant for enzyme production (kv), maximum biomass concentration (Xm), and
maximum specific growth rate (μm) values were adopted from a solid-state fermentation
study conducted by Al-Asheh and Duvnjak (1994). The constants are appropriate and
could be used as initial estimates for solving the model equation coefficients of this
study. The logistic equation for biomass growth (equation 2.7) was solved by iteration
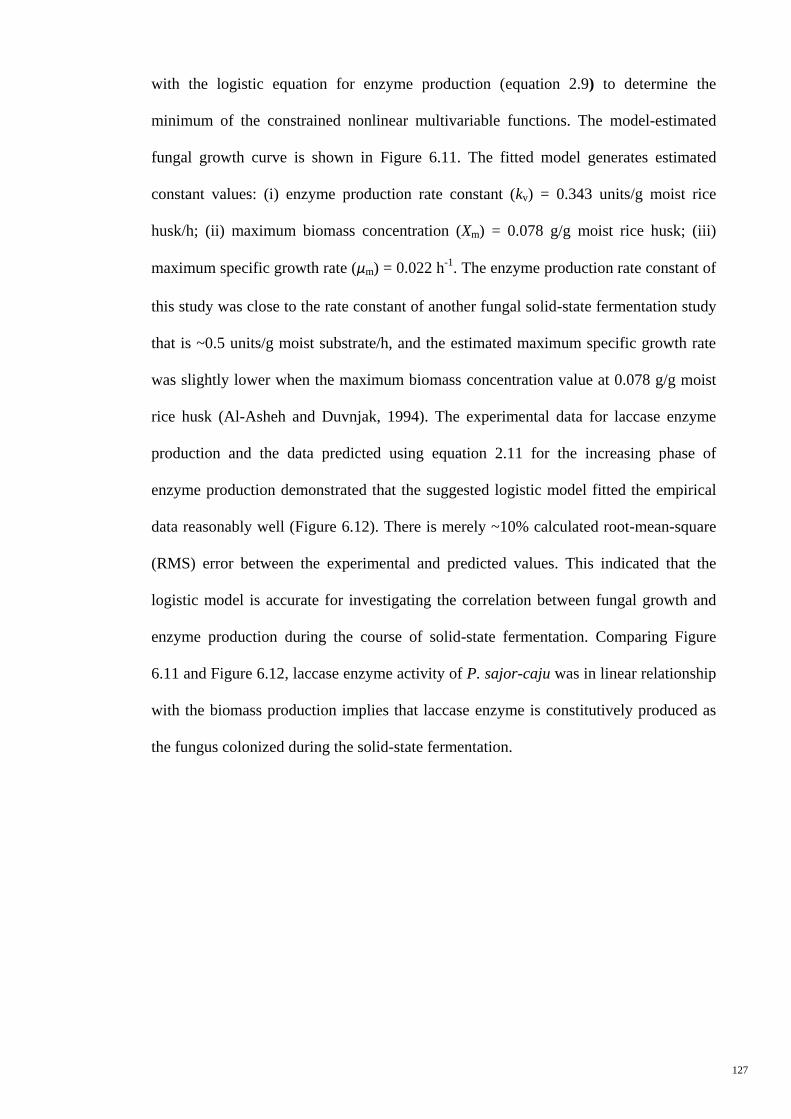
127
with the logistic equation for enzyme production (equation 2.9) to determine the
minimum of the constrained nonlinear multivariable functions. The model-estimated
fungal growth curve is shown in Figure 6.11. The fitted model generates estimated
constant values: (i) enzyme production rate constant (kv) = 0.343 units/g moist rice
husk/h; (ii) maximum biomass concentration (Xm) = 0.078 g/g moist rice husk; (iii)
maximum specific growth rate (μm) = 0.022 h-1
. The enzyme production rate constant of
this study was close to the rate constant of another fungal solid-state fermentation study
that is ~0.5 units/g moist substrate/h, and the estimated maximum specific growth rate
was slightly lower when the maximum biomass concentration value at 0.078 g/g moist
rice husk (Al-Asheh and Duvnjak, 1994). The experimental data for laccase enzyme
production and the data predicted using equation 2.11 for the increasing phase of
enzyme production demonstrated that the suggested logistic model fitted the empirical
data reasonably well (Figure 6.12). There is merely ~10% calculated root-mean-square
(RMS) error between the experimental and predicted values. This indicated that the
logistic model is accurate for investigating the correlation between fungal growth and
enzyme production during the course of solid-state fermentation. Comparing Figure
6.11 and Figure 6.12, laccase enzyme activity of P. sajor-caju was in linear relationship
with the biomass production implies that laccase enzyme is constitutively produced as
the fungus colonized during the solid-state fermentation.

128
Figure 6.11: Model-estimated fungal growth curve for optimized solid-state
fermentation (using initial fungal biomass, X0 = 0.01114 g/g moist rice husk).
Figure 6.12: Experimental and model-estimated laccase enzyme production kinetics
plots under optimized solid-state fermentation condition.
6.1.5 Characterization of Laccase Enzyme
To verify the activity of laccase enzyme produced in solid-state fermentation, the crude
laccase enzyme was partially purified to approximately 16-fold. It was used in the
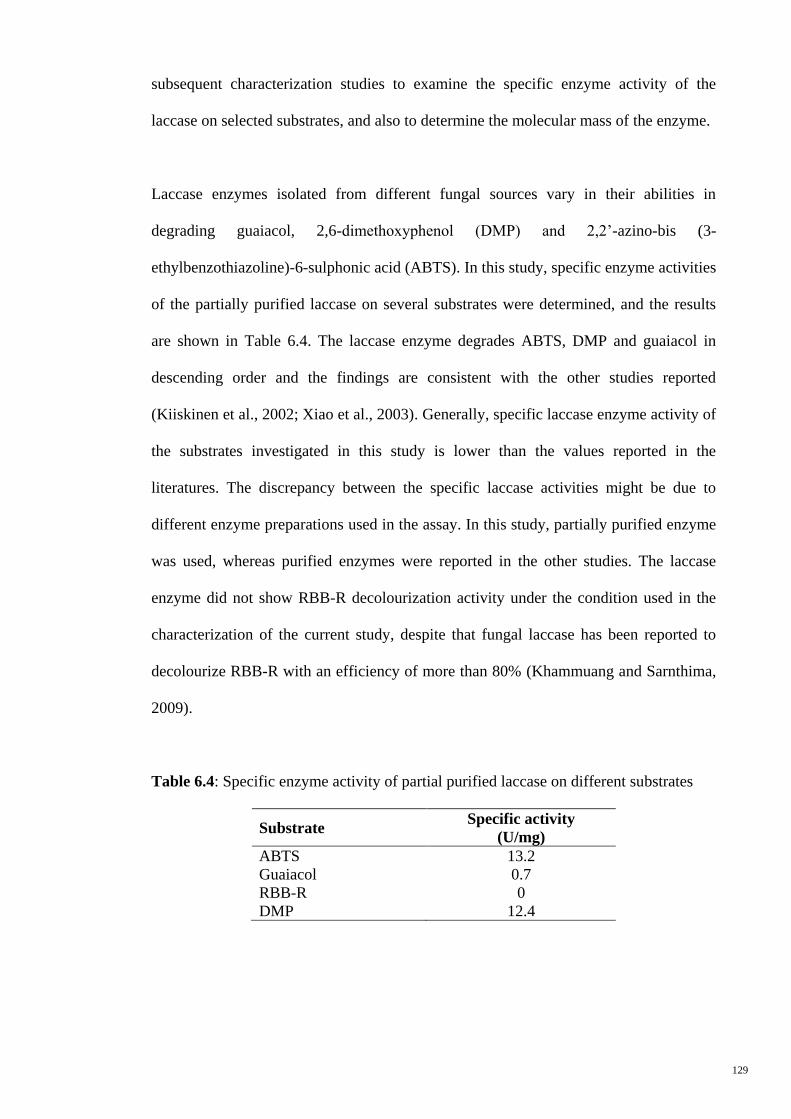
129
subsequent characterization studies to examine the specific enzyme activity of the
laccase on selected substrates, and also to determine the molecular mass of the enzyme.
Laccase enzymes isolated from different fungal sources vary in their abilities in
degrading guaiacol, 2,6-dimethoxyphenol (DMP) and 2,2‟-azino-bis (3-
ethylbenzothiazoline)-6-sulphonic acid (ABTS). In this study, specific enzyme activities
of the partially purified laccase on several substrates were determined, and the results
are shown in Table 6.4. The laccase enzyme degrades ABTS, DMP and guaiacol in
descending order and the findings are consistent with the other studies reported
(Kiiskinen et al., 2002; Xiao et al., 2003). Generally, specific laccase enzyme activity of
the substrates investigated in this study is lower than the values reported in the
literatures. The discrepancy between the specific laccase activities might be due to
different enzyme preparations used in the assay. In this study, partially purified enzyme
was used, whereas purified enzymes were reported in the other studies. The laccase
enzyme did not show RBB-R decolourization activity under the condition used in the
characterization of the current study, despite that fungal laccase has been reported to
decolourize RBB-R with an efficiency of more than 80% (Khammuang and Sarnthima,
2009).
Table 6.4: Specific enzyme activity of partial purified laccase on different substrates
Substrate Specific activity
(U/mg)
ABTS 13.2
Guaiacol 0.7
RBB-R 0
DMP 12.4
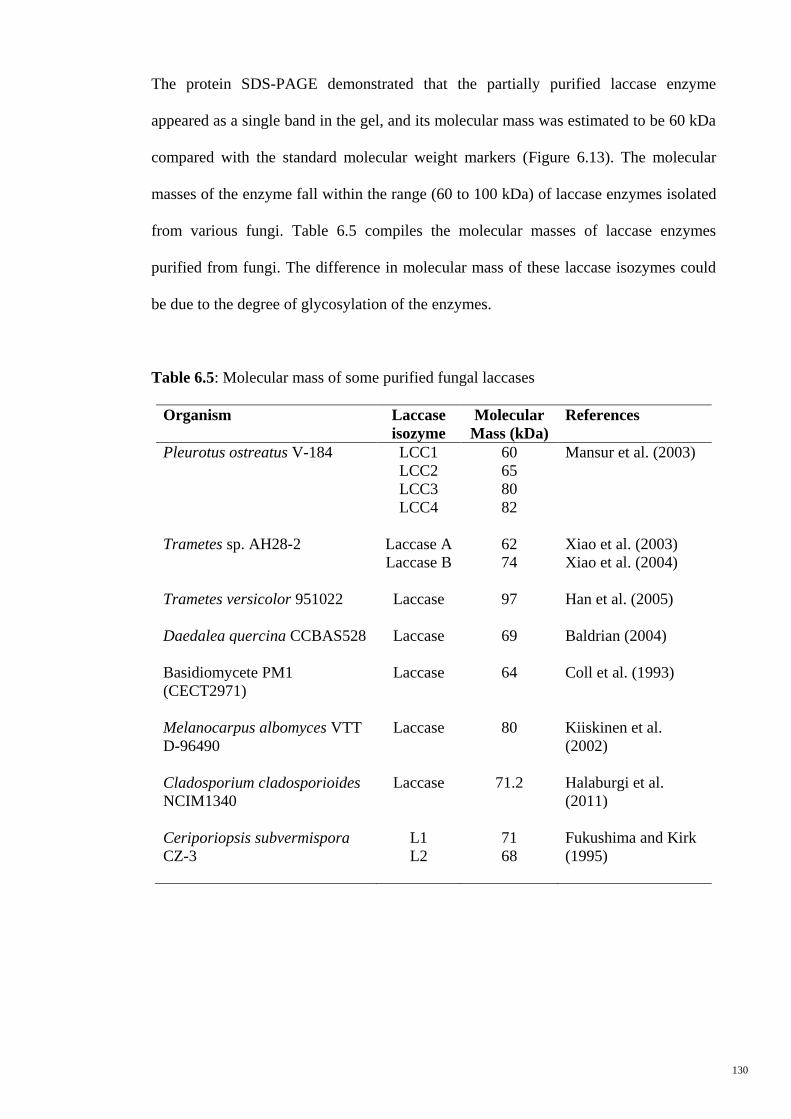
130
The protein SDS-PAGE demonstrated that the partially purified laccase enzyme
appeared as a single band in the gel, and its molecular mass was estimated to be 60 kDa
compared with the standard molecular weight markers (Figure 6.13). The molecular
masses of the enzyme fall within the range (60 to 100 kDa) of laccase enzymes isolated
from various fungi. Table 6.5 compiles the molecular masses of laccase enzymes
purified from fungi. The difference in molecular mass of these laccase isozymes could
be due to the degree of glycosylation of the enzymes.
Table 6.5: Molecular mass of some purified fungal laccases
Organism Laccase
isozyme
Molecular
Mass (kDa)
References
Pleurotus ostreatus V-184 LCC1
LCC2
LCC3
LCC4
60
65
80
82
Mansur et al. (2003)
Trametes sp. AH28-2 Laccase A
Laccase B
62
74
Xiao et al. (2003)
Xiao et al. (2004)
Trametes versicolor 951022 Laccase 97 Han et al. (2005)
Daedalea quercina CCBAS528 Laccase 69 Baldrian (2004)
Basidiomycete PM1
(CECT2971)
Laccase 64 Coll et al. (1993)
Melanocarpus albomyces VTT
D-96490
Laccase 80 Kiiskinen et al.
(2002)
Cladosporium cladosporioides
NCIM1340
Laccase 71.2 Halaburgi et al.
(2011)
Ceriporiopsis subvermispora
CZ-3
L1
L2
71
68
Fukushima and Kirk
(1995)
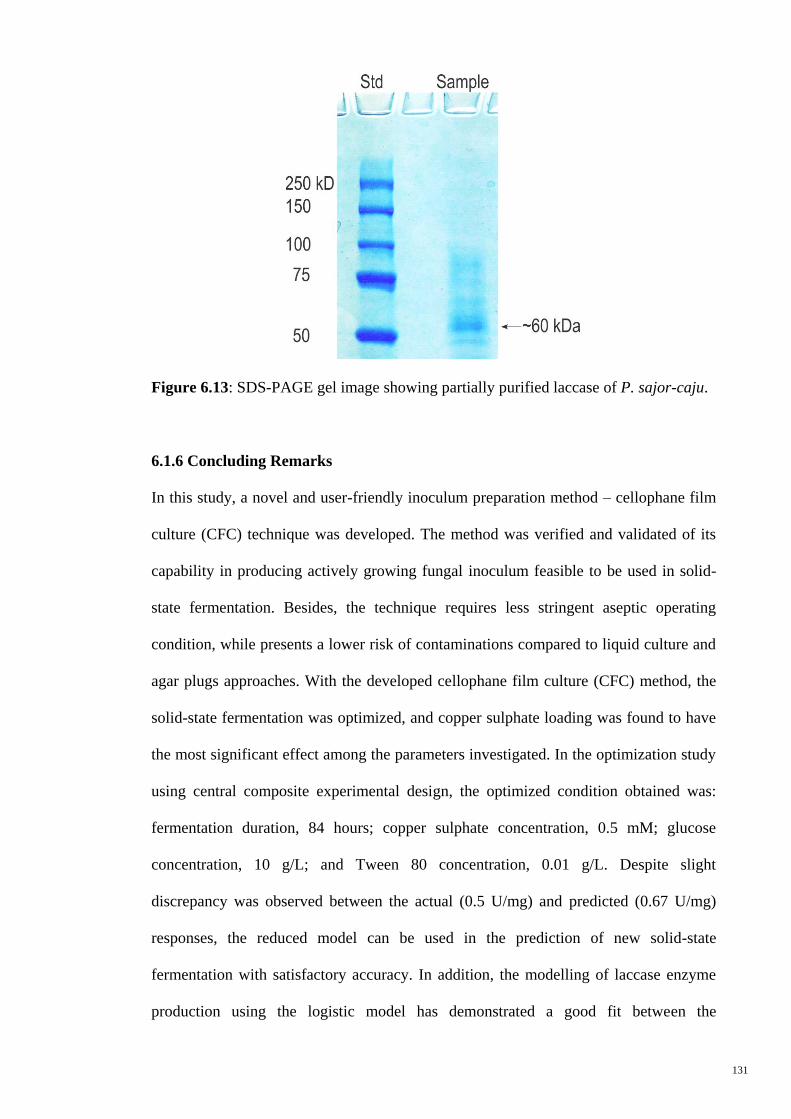
131
Figure 6.13: SDS-PAGE gel image showing partially purified laccase of P. sajor-caju.
6.1.6 Concluding Remarks
In this study, a novel and user-friendly inoculum preparation method – cellophane film
culture (CFC) technique was developed. The method was verified and validated of its
capability in producing actively growing fungal inoculum feasible to be used in solid-
state fermentation. Besides, the technique requires less stringent aseptic operating
condition, while presents a lower risk of contaminations compared to liquid culture and
agar plugs approaches. With the developed cellophane film culture (CFC) method, the
solid-state fermentation was optimized, and copper sulphate loading was found to have
the most significant effect among the parameters investigated. In the optimization study
using central composite experimental design, the optimized condition obtained was:
fermentation duration, 84 hours; copper sulphate concentration, 0.5 mM; glucose
concentration, 10 g/L; and Tween 80 concentration, 0.01 g/L. Despite slight
discrepancy was observed between the actual (0.5 U/mg) and predicted (0.67 U/mg)
responses, the reduced model can be used in the prediction of new solid-state
fermentation with satisfactory accuracy. In addition, the modelling of laccase enzyme
production using the logistic model has demonstrated a good fit between the
132
experimental and predicted data with a mere 10% root-mean-square (RSM) error. This
signified that the model is suitable for studying enzyme production in solid-state
fermentation systems. The laccase enzyme produced by P. sajor-caju has a molecular
mass of 60 kDa, and its ability in degrading ABTS, DMP and guaiacol demonstrates its
potential application in bioremediation of industrial effluents containing phenolic
compounds.
133
CHAPTER 7
CONCLUSIONS AND RECOMMENDATIONS
7.1 Conclusions
Laccase is a versatile enzyme that can be used in various industries like paper and pulp,
textile, petrochemical, polymer synthesis, bioremediation of contaminated site, wine
and beverage, etc. However, one of the limitations to large-scale application is the lack
of capacity to produce large volume of active enzyme at affordable prices. Therefore, a
fungal solid-state fermentation scheme, which utilize rice husk as substrate, was
proposed. The conclusions from the research findings are as follow:
i. Assessments of rice husk pretreatment using chemicals and ionic liquids were
conducted. From the assessments, the dilute hydrochloric acid (HCl)
pretreatment was found to be effective in pretreating rice husk. The pretreated
rice husk showed desired structural and chemical characteristics for the
subsequent fungal solid-state fermentation. Besides, the optimization of rice
husk pretreatment with response surface methodology resulted in a relatively
mild pretreatment condition (HCl loading, 0.5% (w/v); heating temperature,
125oC; duration, 1.5 hours) that is economically feasible to be carried out in a
bigger scale.
ii. Ligninolytic enzyme activity screenings were carried out for Pycnoporus
sanguineus, Phlebia radiata and Pleurotus sajor-caju. Under the screening
conditions, all the fungus showed varying extent of guaiacol oxidation and/or
RBB-R decolourization activities. The selected fungus, P. sajor-caju, exhibited
both guaiacol oxidation and RBB-R decolourization activities at room
134
temperature as well as 35oC. Also, the fungus is reported to be able to strive on
rice husk and give good biological efficiency. These findings demonstrated the
potential of P. sajor-caju for the subsequent solid-state fermentation.
iii. A novel inoculum preparation method – the cellophane film culture (CFC)
technique for solid-state fermentation was developed. With the verified and
validated inoculum preparation method, solid-state fermentation of pretreated
rice husk for the production of laccase enzyme using P. sajor-caju was
optimized and resulted in an optimized fermentation condition of 84 hours
fermentation, 0.5 mM copper sulphate, 10 g/L glucose, and 0.01 g/L Tween 80.
Copper sulphate that induces laccase enzyme production was found to be the
most significant parameter in the solid-state fermentation. Furthermore, the
increasing phase of laccase production was successfully modelled using logistic
model with only 10% root-mean-square (RSM) error between the empirical and
predicted data. From the characterization studies, the partially purified laccase of
P. sajor-caju has a molecular mass of ~60 kDa, and it can degrade ABTS, DMP
and guaiacol like other fungal laccases.
Incorporating the dilute hydrochloric acid pretreatment of rice husk and the
optimization of solid-state fermentation using the white-rot fungus P. sajor-caju, the
proposed solid-state fermentation process is feasible for application in the production of
laccase enzyme using the lignocellulosic rice husk. The process is practical both in cost
and operation as it involves relatively low cost substrate and chemical reagents.
135
7.2 Novelties and Implications of Study
Some significant novelties and implications of this research project are highlighted
below:
i. Rice husk that contains relatively high cellulose and hemicellulose is rarely used
in fermentation for bioconversion due to its recalcitrant structure. The research
addressed the potential application of pretreated rice husk as substrate in solid-
state fermentation to produce laccase enzyme.
ii. The study has comprehensively examined and compared the effect of various
pretreatment reagents on rice husk and its suitability for solid-state fermentation.
In addition to the widely employed acid and alkali, the application of ionic
liquids in dissolution pretreatment of rice husk was investigated. These findings
are helpful in selecting suitable reagent for the pretreatment of lignocellulosic
biomass to improve the microbial substrate digestibility in solid-state
fermentation.
iii. A qualitative method for fungal ligninolytic enzyme activity screening was
developed. This screening method is user-friendly and it can be used to estimate
fungal growth and enzyme activity. With the application of this method, large
number of fungi could be screened concurrently in a relatively short duration.
iv. To further improve the solid-state fermentation process, a new inoculum
preparation method – cellophane film culture (CFC) technique was developed.
The method is suitable for preparing actively growing fungal inoculum and
overcome limitations present in the existing inoculum preparation methods.
136
7.3 Recommendations
All the scopes outlined in the study have been accomplished, some potential areas in
solid-state fermentation and its associated upstream and downstream processes for
possible future studies are recommended as below:
i. To research and refine on the isolation and purification protocols. These
protocols are crucial steps in enzymology as they are important in producing
good quality enzymes for subsequent studies. The costs of enzyme isolation and
purification constitute a major portion of the commercial enzyme price.
Therefore, more cost-effective isolation and purification protocols would benefit
large-scale applications of the enzyme.
ii. To investigate the industrial applications of laccase enzyme, such as
bioremediation of contaminated sites and decolourization of colour effluents.
Besides, exploration of the new applications for laccase enzyme such as
applications in medical or food industries are beneficial as this enzyme might be
useful to replace some hazardous chemicals in the process.
iii. To characterize the purified laccase in a broader perspective, such as examine its
molecular and structural components, substrate specificity and inhibition studies
and etc. as to elucidate the mechanism of reactions catalyzed by the enzyme.
Moreover, it would also provide a platform for engineering of the protein into a
more potent and versatile enzyme for industrial applications.
iv. To study the fungal solid-state fermentation process in larger laboratory scales,
which involves the design of bioreactor that overcomes mass transfer limitations

137
and eases the downstream processing of the end-product. The knowledge
obtained has significant contribution to the application of solid-state
fermentation process at pilot and industrial scales.
138
REFERENCES
Abdul Karim, M. A., and Mohamad Annuar, M. S. (2009). Novel application of
coconut husk as growth support matrix and natural inducer of fungal laccase
production in a bubble column reactor. Asia Pac. J. Mol. Biol. Biotechnol., 17,
47-52.
Ahiduzzaman, M. (2007). Rice husk energy technologies in Bangladesh. Agric. Eng.
Int.: CIGR E-j., 9, 10 pages.
Al-Asheh, S., and Duvnjak, Z. (1994). Effect of glucose concentration on the biomass
and phytase productions and the reduction of the phytic acid content in canola
meal by Aspergillus carbonarius during a solid-state fermentation process.
Biotechnol. Progr., 10, 353-359.
Alam, M. Z., Mamun, A. A., Qudsieh, I. Y., Muyibi, S. A., Salleh, H. M., and Omar, N.
M. (2009). Solid state bioconversion of oil palm empty fruit bunches for
cellulase enzyme production using a rotary drum bioreactor. Biochem. Eng, J.,
46, 61-64.
Alam, M. Z., Muhammad, N., and Mahmat, M. E. (2005). Production of cellulase from
oil palm biomass as substrate by solid state bioconversion. Am. J. Appl. Sci., 2,
569-572.
Alexandre, G., and Zhulin, I. Z. (2000). Laccases are widespread in bacteria. Tibtech,
18, 41-42.
AOAC. (2005). "Official methods of analysis of the Association of Official Analytical
Chemists". City: The Association Official Analytical Chemists: Washington.
Asther, M., Corrieu, G., Drapron, R., and Odier, E. (1987). Effect of Tween 80 and
oleic acid on ligninase production by Phanerochaete chrysosporium INA-12.
Enzyme Microb. Tech., 9, 245-249.
Atalla, M. M., Zeinab, H. K., Eman, R. H., Amani, A. Y., and Abeer, A. A. E. A.
(2010). Screening of some marine-derived isolates for lignin degrading enzymes
(LDEs) production. Agr. Biol. J. N. Am., 1, 591-599.
Atlas, R. M. (2004). Handbook of microbiology media, 3rd
edition, New York: CRC
Press.
139
Augustine, A., Joseph, I., and Paul Raj, R. (2006). Biomass estimation of Aspergillus
niger S14 a mangrove fungal isolate and A. oryzae NCIM 1212 in solid-state
fermentation. J. Mar. Biol. Assoc. India, 48, 139-146.
Baldrian, P. (2003). Interactions of heavy metals with white-rot fungi. Enzyme Microb.
Tech., 32, 78-91.
Baldrian, P. (2004). Purification and characterization of laccase from the white-rot
fungus Daedalea quercina and decolorization of synthetic dyes by the enzyme.
Appl. Microbiol. Biotechnol., 63, 560-563.
Barbosa, A. M., Dekker, R. F. H., and St Hardy, G. E. (1996). Veratryl alcohol as an
inducer of laccase by an ascomycete, Botryosphaeria sp., when screened on the
polymeric dye Poly R-478. Lett. Appl. Microbiol., 23, 93-96.
Barl, B., Biliaderis, C. G., Murray, E. D., and MacGregor, A. W. (1991). Combined
chemical and enzymic treatments of corn husk lignocellulosics. J. Sci. Food
Agric., 56, 195-214.
Bollag, J.-M., and Leonowicz, A. (1984). Comparative studies of extracellular fungal
laccases. Appl. Environ. Microbiol., 48, 849-854.
Bourbonnais, R., and Paice, M. G. (1990). Oxidation of non-phenolic substrates: An
expanded role for laccase in lignin biodegradation. FEBS Lett., 267, 99-102.
Bramorski, A., Christen, P., Ramirez, M., Soccol, C. R., and Revah, S. (1998).
Production of volatile compounds by the edible fungus Rhizopus oryzae during
solid state cultivation on tropical agro-industrial substrates. Biotechnol. Lett., 20,
359-362.
Brandt, A., Hallett, J. P., Leak, D. J., Murphy, R. J., and Welton, T. (2010). The effect
of the ionic liquid anion in the pretreatment of pine wood chips. Green Chem.,
12, 672-679.
Brannvall, E. (2004). "Pulping technology", in M. Ek, G. Gellerstedt, and G.
Henriksson, (eds.), Pulp and paper chemistry and technology. Volume 2 Pulping
chemistry and technology. Berlin: Walter de Gruyter GmbH & Co.
Cavalcante, R. S., Lima, H. L. S., Pinto, G. A. S., Gava, C. A. T., and Rodriguez, S.
(2008). Effect of moisture on Trichoderma conidia production on corn and
wheat bran by solid state fermentation. Food Bioprocess Technol., 1, 100-104.
140
Chandra, R. P., Bura, R., Mabee, W. E., Berlin, A., Pan, X., and Saddler, J. N. (2007).
Substrate pretreatment: the key to effective enzymatic hydrolysis of
lignocellulosics. Adv. Biochem. Eng. Biotechnol., 5, 904-910.
Chang, V. S., Burr, B., and Holtzapple, M. T. (1997). Lime pretreatment of switchgrass.
Appl. Biochem. Biotechnol., 63-65, 3-19.
Chang, V. S., Nagwani, M., and Holtzapple, M. T. (1998). Lime pretreatment of crop
residue bagasse and wheat straw. Appl. Biochem. Biotechnol., 74, 135-159.
Chutmanop, J., Chuichulcherm, S., Chisti, Y., and Srinophakun, P. (2008). Protease
production by Aspergillus oryzae in solid-state fermentation using agroindustrial
substrates. J. Chem. Tech. Biotechnol., 83, 1012-1018.
Claus, H. (2004). Laccases: structure, reactions, distribution. Micron, 35, 93-96.
Coates, J. (2000). Interpretation of infrared spectra, a practical approach, Chichester:
John Wiley & Sons Ltd.
Coll, P. M., Fernandez-Abalos, J. M., Villanueva, J. R., Santamaria, R., and Perez, P.
(1993). Purification and characterization of a phenoloxidase (laccase) from the
lignin-degrading basidiomycete PM1 (CECT 2971). Appl. Environ. Microbiol.,
59, 2607-2613.
Contreras Lara, D., Gutierrez Chavez, L., Valdivia Macedo, I., Govea Casares, R., and
Ramirez Carillo, J. T. (1999). Two techniques for measuring Neutral Detergent
(NDF) and Acid Detergent Fibers (ADF) in forages and by-products. Arch.
Zootec., 48, 351-354.
Coughlan, M. P. (1990). "Cellulose degradation by fungi", in M. Fogarty and C. T.
Kelly, (eds.), Microbial Enzymes and Biotechnology. London and New York:
Elsevier Applied Science.
Cruz-Cordova, T., Roldan-Carrillo, T. G., Diaz-Cervantes, D., Ortega-Lopez, J.,
Saucedo-Castaneda, G., Tomasini-Campocosio, A., and Rodriguez-Vazquez, R.
(1999). CO2 ecolution and ligninolytic and proteolytic activities of
Phanerochaete chrysosporium grown in solid state fermentation. Resour.
Conserv. Recy., 27, 3-7.
Cuissinat, C., Navard, P., and Heinze, T. (2008). Swelling and dissolution of cellulose,
Part V: cellulose derivatives fibres in aqueous systems and ionic liquids.
Cellulose, 15, 75-80.
141
D'Souza, T. M., Merritt, C. S., and Reddy, C. A. (1999). Lignin-modifying enzymes of
the white rot Basidiomycete Ganoderma lucidum. Appl. Environ. Microbiol., 65,
5307-5313.
Dadi, A. P., Varanasi, S., and Schall, C. A. (2006). Enhancement of cellulose
saccharification kinetics using an ionic liquid pretreatment step. Biotechnol.
Bioeng., 95, 904-910.
Darus, F. M., Zainol, S., Vadiveloo, J., and Yusof, M. N. Solid state fermentation of
rice husks by white-rot fungi. Presented at Proceeding of the 3rd
Workshop on
Regional Network Formation for Enhancing Research and Education on
Material Engineering and Green Energy Technologies, Parkroyal Hotel, Batu
Feringi, Pulau Pinang, 7-10 August 2005.
De Jong, E., De Vries, F. P., Field, J. A., Van Der Zwan, R. P., and De Bont, J. A. M.
(1992). Isolation and Screening of Basidiomycetes with High Peroxidative
Activity. Mycological Research, 12, 1098-1104.
Desgranges, C., Vergoignan, C., Georges, M., and Durand, A. (1991). Biomass
estimation in solid state fermentation. I. Manual biochemical methods. Appl.
Microbiol. Biotechnol., 35, 200-205.
Doerge, D. R., Divi, R. L., and Churchwell, M. I. (1997). Identification of the colored
guaiacol oxidation product produced by peroxidases. Anal. Biochem., 250, 10-
17.
Dogan, H., and Hilmioglu, N. D. (2009). Dissolution of cellulose with NMMO by
microwave heating. Carbohydr. Polymer., 75, 90-94.
Dominguez, A., Rivela, I., Rodriguez Couto, S., and Sanroman, M. A. (2001). Design
of a new rotating drum reactor for ligninolytic enzyme production by
Phanerochaete chrysosporium grown on an inert support. Process Biochem., 37,
549-554.
Dong, D., Sun, J., Huang, F., Gao, Q., Wang, Y., and Li, R. (2009). Using
trifluoroacetic acid to pretreat lignocellulosic biomass. Biomass Bioenerg., 33,
1719-1723.
Eggert, C., Temp, U., and Eriksson, K.-E. L. (1996). The ligninolytic system of the
white rot fungus Pycnoporus cinnabarinus: purification and characterization of
the laccase. Appl. Environ. Microbiol., 62, 1151-1158.

142
Ellaiah, P., Adinarayana, K., Bhavani, Y., Padmaja, P., and Srinivasulu, B. (2002).
Optimization of process parameters for glucoamylase production under solid
state fermentation by a newly isolated Aspergillus species. Process Biochem.,
38, 615-620.
ESCAP. (2000). State of environment in Asia and the Pacific 2000 (Asian Development
Bank). United Nations, New York.
Esposito, E., Canhos, V. P., and Duran, N. (1991). Screening of lignin-degrading fungi
for removal of color from kraft mill wastewater with no additional extra carbon-
source. Biotechnol. Lett., 13, 571-576.
Esposito, E., and da Silva, M. (1998). Systematics and environmental application of the
genus Trichoderma. Crit. Rev. Microbiol., 24, 89-98.
Fanta, G. F., Abbott, T. P., Herman, A. I., Burr, R. C., and Doane, W. M. (1984).
Hydrolysis of wheat straw hemicellulose with trifluoroacetic acid. Fermentation
of xylose with Pachysolen tannophilus. Biotechnol. Bioeng., 26, 1122-1125.
FAOSTAT. (2010). "Food and agricultural commodities production". City: Food and
Agriculture Organization of the United Nations.
Fernandez-Larrea, J., and Stahl, U. (1996). Isolation and characterization of a laccase
gene from Podospora anserina. Mol. Gen. Genet., 252, 539-551.
Fernando, T., Bumpus, J. A., and Aust, S. D. (1990). Biodegradation of TNT (2,4,6-
trinitrotoluene) by Phanerochaete chrysosporium. Appl. Environ. Microbiol.,
56, 1666-1671.
Floch, C., Alarcon-Gutierrez, E., and Criquet, S. (2007). ABTS assay of phenol oxidase
activity in soil. J. Microbiol. Meth., 71, 319-324.
Francis, F., Sabu, A., Nampoothiri, K. M., Ramachandran, S., Ghosh, S., Szakacs, G.,
and Pandey, A. (2003). Use of response surface methodology for optimizing
process parameters for the production of α-amylase by Aspergillus oryzae.
Biochem. Eng, J., 15, 107-115.
Frimpong-Manso, J., Obodai, M., Dzomeku, M., and Apertorgbor, M. M. (2011).
Influence of rice husk on biological efficiency and nutrient content of Pleurotus
ostreatus (Jacq. ex. Fr.) Kummer. Int. Food. Res. J., 18, 249-254.
Fukushima, Y., and Kirk, T. K. (1995). Laccase component of the Ceriporiopsis
subvermispora lignin-degrading system. Appl. Environ. Microbiol., 61, 872-876.

143
Funder, S., and Johannessen, S. (1957). The membrane filter as an aid in the cultivation
and identification of fungi. J. Gen. Microbiol., 17, 117-119.
Fusaro, R. M. (1972). Inoculation technique for fungus cultures. Appl. Environ.
Microbiol., 23, 174-176.
Gervais, P., and Molin, P. (2003). The role of water in solid-state fermentation.
Biochem. Eng, J., 13, 85-101.
Gianfreda, L., Xu, F., and Bollag, J.-M. (1999). Laccases: A useful group of
oxidoreductive enzymes. Biorem. J., 3, 1-26.
Gibbons, W. R., Westby, C. A., and Dobbs, T. L. (1984). A continuous, farm-scale,
solid-phase fermentation process for fuel ethanol and protein feed production
from fodder beets. Biotechnol. Bioeng., 26, 1098-1107.
Glenn, J. K., and Gold, M. H. (1983). Decolorization of several polymeric dyes by the
lignin-degrading Basidiomycete Phanerochaete chrysosporium. Appl. Environ.
Microbiol., 45, 1741-1747.
Goering, H. K., and van Soest, P. J. (1970). "Forage fiber analyses (apparatus, reagents,
procedures, and some applications)". City: Agricultural Research Service,
United States Department of Agriculture: Washington, D C.
Gowthaman, M. K., Krishna, C., and Moo-Young, M. (2001). "Fungal solid state
fermentation - an overview", in G. G. Khachatourians and D. K. Arora, (eds.),
Applied mycology and biotechnology. Volume I: agricultural and food
production. Elsevier Sciences B.V.
Grethlein, H. E. (1985). The effect of pore size distribution on the rate of enzmatic
hydrolysis of cellulosic substrates. Nat. Biotechnol., 3, 155-160.
Gumbira-Sa'id, E., Doelle, H. W., Greenfield, P. F., and Mitchell, D. A. (1991). Protein
enrichment of sago starch by solid-state fermentation with Rhizopus spp. World
J. Microbiol. Biotechnol., 7, 419-427.
Guo, G. L., Chen, W. H., Chen, W. H., Men, L. C., and Hwang, W. S. (2008).
Characterization of dilute acid pretreatment of silvergrass for ethanol
production. Bioresource Technol., 99, 6046-6053.
Gupte, A., Gupte, S., and Patel, H. (2007). Ligninolytic enzyme production under solid-
state fermentation by white rot fungi. J. Sci. Ind. Res., 66, 611-614.
144
Ha, S. H., Mai, N. L., An, G., and Koo, Y.-M. (2011). Microwave-assisted pretreatment
of cellulose in ionic liquid for accelerated enzymatic hydrolysis. Bioresource
Technol., 102, 1214-1219.
Halaburgi, V. M., Sharma, S., Sinha, M., Singh, T. P., and Karegoudar, T. B. (2011).
Purification and characterization of a thermostable laccase from the ascomycetes
Cladosporium cladosporioides and its applications. Process Biochem., 46, 1146-
1152.
Han, M.-J., Choi, H.-T., and Song, H.-G. (2005). Purification and characterization of
laccase from the white rot fungus Trametes versicolor. J. Microbiol., 43, 555-
560.
Hanai, H., Ishida, S., Saito, C., Maita, T., Kusano, M., Tamogami, S., and Noma, M.
(2005). Stimulation of mycelia growth in several mushroom species by rice
husks. Biosci. Biotechnol. Biochem., 69, 123-127.
Hao, J., Song, F., Huang, F., Yang, C., Zhang, Z., Zheng, Y., and Tian, X. (2007).
Production of laccase by a newly isolated deuteromycete fungus Pestalotiopsis
sp. and its decolorization of azo dye. J. Ind. Microbiol. Biotechnol., 34, 233-240.
Hashim, A. B., Aminuddin, H., and Siva, K. B. (1996). Nutrient content in rice husk ash
of some Malaysian rice varieties. Pertanika J. Trop. Agric. Sci., 19, 77-80.
Hermann, T. E., Kurtz, M. B., and Champe, S. P. (1983). Laccase localized in hulle
cells and cleistothecial primordia of Aspergillus nidulans. J. Bacteriol., 154,
955-964.
Holker, U., Hofer, M., and Lenz, J. (2004). Biotechnological advantages of laboratory-
scale solid-state fermentation with fungi. Appl. Microbiol. Biotechnol., 64, 175-
186.
Hrubant, G. R., Rhodes, R. A., and Orton, W. L. (1989). Continuous solid-substrate
fermentation of feedlot waste with grain. Biol. Waste, 28, 277-291.
Hsu, T. C., Guo, G. L., Chen, W. H., and Hwang, W. S. (2010). Effect of dilute acid
pretreatment of rice straw on structural properties and enzymatic hydrolysis.
Bioresource Technol., 101, 4907-4913.
Hurtubise, F. G., and Krassig, H. (1960). Classification of fine structural characteristics
in cellulose by infrared spectroscopy. Anal. Chem., 32, 177-181.
Ibrahim, C. O. (2008). Development of applications of industrial enzymes from
Malaysian indigenous microbial sources. Bioresource Technol., 99, 4572-4582.
145
Jagadeeswara Rao, C., Venkatesan, K. A., Nagarajan, K., Srinivasan, T. G., and
Vasudeva Rao, P. R. (2007). Treatment of tissue paper containing radioactive
waste and electrochemical recovery of valuables using ionic liquids.
Electrochim. Acta, 53, 1911-1919.
Jiang, M., Zhao, M., Zhou, Z., Huang, T., Chen, X., and Wang, Y. (2011). Isolation of
cellulose with ionic liquid from steam exploded rice straw. Ind. Crop. Prod., 33,
734-738.
Jiang, X. C., Yu, C. Y., Feng, J., Li, C. X., and Wang, Z. H. (2006). Synthesis and
application of ionic liquid 1-butyl-3-methylimidazolium dibutyl phosphate. J. B.
Univ. Chem. Technol., 33, 5-7.
Juliano, B. O. (1985). "Rice hull and rice straw", in B. O. Juliano, (ed.), Rice: chemistry
and technology. USA: The American Association of Cereal Chemists, Inc.
Juliano, B. O., and Bechtel, D. B. (1985). "The rice grain and its gross composition", in
B. O. Juliano, (ed.), Rice: chemistry and technology. USA: The American
Association of Cereal Chemists, Inc.
Keyser, P., Kirk, T. K., and Zeikus, J. G. (1978). Ligninolytic enzyme system of
Phanerochaete chrysosporium: synthesized in the absence of lignin in response
to nitrogen starvation. J. Bacteriol., 135, 790-797.
Khalil, A. I. (2002). Production and characterization of cellulolytic and xylanolytic
enzymes from ligninolytic white-rot fungus Phanerochaete chrysosporium
grown on sugarcane bagasse. World J. Microbiol. Biotechnol., 18, 753-759.
Khammuang, S., and Sarnthima, R. (2009). Laccase activity from fresh fruiting bodies
of Garnoderma sp. MK05: purification and remazol brilliant blue R
decolorization. J. Biol. Sci., 9, 83-87.
Khan, M. R., and Raza, S. A. (2005). Cellulose content of the fibrous materials of
Pakistan. J. Chem. Soc. Pakistan, 27, 106-108.
Kiiskinen, L.-L., Ratto, M., and Kruus, K. (2004). Screening for novel laccase
producing microbes. J. Appl. Microbiol., 97, 640-646.
Kiiskinen, L.-L., Viikari, L., and Kruus, K. (2002). Purification and characterization of
a novel laccase from the ascomycete Melanocarpus albomyces. Appl. Microbiol.
Biotechnol., 59, 198-204.
146
Kirk, T. K., Connors, W. J., and Zeikus, J. G. (1976). Requirement for a growth
substrate during lignin decomposition by two wood-rotting fungi. Appl. Environ.
Microbiol., 32, 192-194.
Klemm, D., Heublein, B., Fink, H.-P., and Bohn, A. (2005). Cellulose: Fascinating
biopolymer and sustainable raw material. Angew. Chem. Int. Ed., 44, 3358-3393.
Kocher, G. S., Kalra, K. L., and Banta, G. (2008). Optimization of cellulase production
by submerged fermentation of rice straw by Trichoderma harzanium Rut-C
8230. Internet J. Microbiol., 5, 7.
Koegel, R. G., Sreenath, H. K., and Straub, R. J. Liquid hot water (LHW) pretreatment
of alfalfa fiber destined for ethanol production. Presented at Proceedings of
American Society of Agricultural Engineers Symposium, Saint Joseph, MI, 10-
14 August 1997.
Kootstra, A. M. J., Beeftink, H. H., Scott, E. L., and Sanders, J. P. M. (2009).
Comparison of dilute mineral and organic acid pretreatment for enzymatic
hydrolysis of wheat straw. Biochem. Eng, J., 46, 126-131.
Kosan, B., Michels, C., and Meister, F. (2008). Dissolution and forming of cellulose
with ionic liquids. Cellulose, 15, 59-66.
Koutinas, A. A., Wang, R., and Webb, C. (2003). Estimation of fungal growth in
complex, heterogeneous culture. Biochem. Eng, J., 14, 93-100.
Kumar, R., Mago, G., Balan, V., and Wyman, C. E. (2009). Physical and chemical
characterizations of corn stover and poplar solids resulting from leading
pretreatment technologies. Bioresource Technol., 100, 3948-3962.
Kunamneni, A., Permaul, K., and Singh, S. (2005). Amylase production in solid state
fermentation by the thermophilic fungus Thermomyces lanuginosus. J. Biosci.
Bioeng., 100, 168-171.
Kuo, C.-H., and Lee, C.-K. (2009a). Enhanced enzymatic hydrolysis of sugarcane
bagasse by N-methylmorpholine-N-oxide pretreatment. Bioresource Technol.,
100, 866-871.
Kuo, C.-H., and Lee, C.-K. (2009b). Enhancement of enzymatic saccharication of
cellulose by cellulose dissolution pretreatments. Carbohydr. Polymer., 77, 41-
46.

147
Labbe, N., Rials, T. G., Kelley, S. S., Cheng, Z. M., Kim, J. Y., and Li, Y. (2005). FT-
IR imaging and pyrolysis-molecular beam mass spectrometry: new tools to
investigate wood tissues. Wood Sci. Tech., 39, 61-77.
Lateef, H., Grimes, S., Kewcharoenwong, P., and Feinberg, B. (2009). Separation and
recovery of cellulose and lignin using ionic liquids: a process for recovery from
paper-based waste. J. Chem. Tech. Biotechnol., 84, 1818-1827.
Lee, S. H., Doherty, T. V., Linhardt, R. J., and Dordick, J. S. (2009). Ionic liquid-
mediated selective extraction of lignin from wood leading to enhanced
enzymatic cellulose hydrolysis. Biotechnol. Bioeng., 102, 1368-1376.
Lester, J. N., and Birkett, J. W. (1999). Microbiology and chemistry for encironmental
scientists and engineers, 2nd
edition, London and New York: E & FN Spon.
Li, C., Knierim, B., Manisseri, C., Arora, R., Scheller, H. V., Auer, M., Vogel, K. P.,
Simmons, B. A., and Singh, S. (2010). Comparison of dilute acid and ionic
liquid pretreatment of switchgrass: Biomass recalcitrance, delignification and
enzymatic saccharification. Bioresource Technol., 101, 4900-4906.
Li, Q., He, Y., Xian, M., Jun, G., Xu, X., Yang, J., and Li, L. (2009). Improving
enzymatic hydrolysis of wheat straw using ionic liquid 1-ethyl-3-methyl
imidazolium diethyl phosphate pretreatment. Bioresource Technol., 100, 3570-
3575.
Liu, C. F., Sun, R. C., Zhang, A. P., and Ren, J. L. (2007). Preparation of sugarcane
bagasse cellulosic phthalate using an ionic liquid as reaction medium.
Carbohydr. Polymer., 68, 17-25.
Lonsane, B. K., Ghildyal, N. P., Budiatman, S., and Ramakrishna, S. V. (1985).
Engineering aspects of solid state fermentation. Enzyme Microb. Tech., 7, 258-
265.
Maas, R. H. W., Bakker, R. R., Boersma, A. R., Bisschops, I., Pels, J. R., De Jong, E.,
Weusthuis, R. A., and Reith, H. (2008). Pilot-scale conversion of lime-treated
wheat straw into bioethanol: quality assessment of bioethanol and valorization
of side streams by anaerobic digestion and combustion. Biotechnol. Biofuels, 1,
13 pages.
MacFarlane, D. R., Pringle, J. M., Johansson, K. M., Forsyth, S. A., and Forsyth, M.
(2006). Lewis base ionic liquids. Chem. Comm., 1905-1917.
Madigan, M. T., Martinko, J. M., and Parker, J. (2003). Brock biology of
microorganisms, Upper Saddle River, New Jersey: Pearson Education, Inc.
148
Mane, V. P., Patil, S. S., Syed, A. A., and Baig, M. M. V. (2007). Bioconversion of low
quality lignocellulosic agricultural waste into edible protein by Pleurotus sajur-
caju (Fr.) Singer. J. Zhejiang Univ. - Sci. B, 8, 745-751.
Mansur, M., Arias, M. E., Copa-Patino, J. L., Flardh, M., and Gonzalez, A. E. (2003).
The white-rot fungus Pleurotus ostreatus secretes laccase isozymes with
different substrate specificities. Mycologia, 95, 1013-1020.
Matsubara, M., Lynch, J. M., and De Leij, F. A. A. M. (2006). A simple screening
procedure for selecting fungi with potential for use in the bioremediation of
contaminated land. Enzyme Microb. Tech., 39, 1365-1372.
Mayer, A. M., and Staples, R. C. (2002). Laccase: new functions for an old enzyme.
Phytochemistry, 60, 551-565.
Miller, G. L. (1959). Use of dinitrosalicylic acid reagent for determination of reducing
sugar. Anal. Chem., 31, 426-428.
Mishra, B. K., Pandey, A. K., and Lata. (2007). Lignocellulolytic enzyme production
from submerged fermentation of paddy straw. Indian J. Microbiol., 47, 176-179.
Mitchell, D. A., Berovic, M., and Krieger, N. (2006). "Solid-state fermentation
bioreactor fundamentals: Introduction and overview", in D. A. Mitchell, N.
Krieger, and M. Berovic, (eds.), Solid-state fermentation bioreactors:
Fundamentals of design and operation. Germany: Springer-Verlag Berlin
Heidelberg.
Mok, W. S.-L., and Antal, M. J. J. (1992). Uncatalyzed solvolysis of whole biomass
hemicellulose by hot compressed liquid water. Ind. Eng. Chem. Res., 31, 1157-
1161.
Montgomery, D. C. (2009). Design and analysis of experiment, New Jersey: John Wiley
and Sons, Inc.
Mtui, G., and Masalu, R. (2008). Extracellular enzymes from brown-rot fungus
Laetiporus sulphureus isolated from mangroves forests of coastal Tanzania. Sci.
Res. Essays, 3, 154-161.
Muthadhi, A., and Anitha, R. (2007). Rice husk ash - Properties and its uses: A review.
IE(I) J. - CV, 88, 50-56.
149
Nelson, M. L., and O'Connor, R. T. (1964). Relation of certain infrared bands to
cellulose crystallinity and crystal lattice type. Part II. A new infrared ratio for
estimation of crystallinity in celluloses I and II. J. Appl. Polymer Sci., 8, 1325-
1341.
Neureiter, M., Danner, H., Madzingaidzo, L., Miyafuji, H., Thomasser, C., Bvochora,
J., Basumi, S., and Braun, R. (2004). Lignocellulose feedstocks for the
production of lactic acid. Chem. Biochem. Eng., 18, 55-63.
Niku-Paavola, M., Karhunen, E., Salola, P., and Raunio, V. (1988). Ligninolytic
enzymes of the white-rot fungus Phlebia radiata. Biochem. J., 254, 877-884.
Niladevi, K. N., Sukumaran, R. K., and Prema, P. (2007). Utilization of rice straw for
laccase production by Streptomyces psammoticus in solid-state fermentation. J.
Ind. Microbiol. Biotechnol., 34, 665-674.
Novoselov, N. P., Sashina, E. S., Petrenko, V. E., and Zaborsky, M. (2007). Study of
dissolution of cellulose in ionic liquids by computer modeling. Fibre Chem+,
39, 153-158.
Nyanhongo, G. S., Gomes, J., Gubits, G. M., Zvauya, R., Read, J., and Steiner, W.
(2002). Decolorization of textile dyes by laccases from a newly isolated strain of
Trametes modesta. Water Res., 36, 1449-1456.
O'Connor, R. T., DuPre, E. F., and Mitcham, D. (1958). Applications of infrared
absorption spectroscopy to investigations of cotton and modified cottons. Part I:
Physical and crystalline modifications and oxidation. Textil. Res. J., 28, 382-
392.
Oh, S. Y., Yoo, D. I., Shin, Y., and Seo, G. (2005). FTIR analysis of cellulose treated
with sodium hydroxide and carbon dioxide. Carbohydr. Res., 340, 417-428.
Okazaki, N., Sugama, S., and Tanaka, T. (1980). Mathematical model for surface
culture of Koji Mold. J. Ferment. Technol., 58, 471-476.
Okino, L. K., Machado, K. M. G., Fabris, C., and Bononi, V. L. R. (2000). Ligninolytic
activity of tropical rainforest basidiomycetes. World J. Microbiol. Biotechnol.,
16, 889-893.
Orozco, A., Ahmad, M., Rooney, D., and Walker, G. (2007). Dilute acid hydrolysis of
cellulose and cellulosic bio-waste using a microwave reactor system. Trans
IChemE, Part B, PSEP, 85, 446-449.
150
Osma, J. F., Toca-Herrera, J. L., and Rodriguez-Couto, S. (2011). Cost analysis in
laccase production. J. Environ. Manage., 92, 2907-2912.
Palmieri, G., Giardina, P., Bianco, C., Fontanella, B., and Sannia, G. (2000). Copper
induction of laccase isoenzymes in the ligninolytic fungus Pleurotus ostreatus.
Appl. Environ. Microbiol., 66, 920-924.
Pandey, A. (2003). Solid-state fermentation. Biochem. Eng, J., 13, 81-84.
Pandey, A., Soccol, C. R., Rodriguez-Leon, J. A., and Nigam, P. (2001). Solid-state
fermentation in biotechnology: Fundamentals and applications, New Delhi,
India: Asiatech Publishers, Inc.
Pang, P. K., Darah, I., Poppe, L., Szakacs, G., and Ibrahim, C. O. (2006a). Xylanase
production by a local isolate Trichoderma spp. FETL c3-2 via solid state
fermentation using agricultural wastes as substrate. Malays. J. Microbiol., 2, 7-
14.
Pang, P. K., Ibrahim, D., Poppe, L., Szakacs, G., and Che Omar, I. (2006b). Production
of cellulolytic enzymes by a newly isolated, Trichoderma sp. FETL c3-2 via
solid state fermentation grown on sugar cane bagasse: palm kernel cake as
substrates. Pakistan J. Biol. Sci., 9, 1430-1437.
Paranthaman, R., Alagusundaram, K., and Indhumathi, J. (2009). Production of protease
from rice mill wastes by Aspergillus niger in solid state fermentation. World J.
Agr. Sci., 5, 308-312.
Patel, H., Gupte, A., and Gupte, S. (2009). Effect of different culture conditions and
inducers on production of laccase by a basidiomycete fungal isolate Pleurotus
ostreatus HP-1 under solid state fermentation. BioResources, 4, 268-284.
Patrick, F., Mtui, G., Mshandete, A. M., and Kivaisi, A. (2011). Optimization of laccase
and manganese peroxidase production in submerged culture of Pleurotus sajor-
caju. Afr. J. Biotechnol., 10, 10166-10177.
Perez-Guerra, N., Torrado-Agrasar, A., Lopez-Macias, C., and Pastrana, L. (2003).
Main characteristics and applications of solid substrate fermentation. Elec. J.
Env. Agricult. Food Chem., 2, 343-350.
Pometto III, A. L., and Crawford, D. L. (1986). Effects of pH on lignin and cellulose
degradation by Streptomyces viridosporus. Appl. Environ. Microbiol., 52, 246-
250.
151
Pommerville, J. C. (2007). Alcamo's laboratory fundamentals of microbiology, 8th
edition: Jones & Bartlett Publishers.
Proniewicz, L. M., Paluszkiewicz, C., Weselucha-Birczynska, A., Majcherczyk, H.,
Baranski, A., and Konieczna, A. (2001). FT-IR and FT-Raman study of
hydrothermally degradated cellulose. J. Mol. Struct., 596, 163-169.
Raghavarao, K. S. M. S., Ranganathan, T. V., and Karanth, N. G. (2003). Some
engineering aspects of solid-state fermentation. Biochem. Eng, J., 13, 127-135.
Rahardjo, Y. S. P., Korona, D., Haemers, S., Weber, F. J., Tramper, J., and Rinzema, A.
(2004). Limitations of membrane cultures as a model solid-state fermentation
system. Lett. Appl. Microbiol., 39, 504-508.
Raimbault, M. (1998). General and microbiological aspects of solid substrate
fermentation. Electron. J. Biotechnol., 1, 174-188.
Raimbault, M., and Alazard, D. (1980). Culture method to study fungal growth in solid
fermentation. European J. Appl. Micrbiol. Biotechnol., 9, 199-209.
Rajan, A., Kurup, J. G., and Abraham, T. E. (2010). Solid state production of
manganese peroxidases using arecanut husk as substrate. Braz. Arch. Biol.
Tech., 53, 555-562.
Rajendran, K., Mohamad Annuar, M. S., and Abdul Karim, M. A. (2011). Optimization
of nutrient levels for laccase fermentation using statistical techniques. Asia Pac.
J. Mol. Biol. Biotechnol., 19, 73-81.
Ramachandran, S., Patel, A. K., Nampoothiri, K. M., Francis, F., Nagy, V., Szakacs, G.,
and Pandey, A. (2004). Coconut oil cake - a potential raw material for the
production of α-amylase. Bioresource Technol., 93, 169-174.
Rani, R., and Ghosh, S. (2011). Production of phytase under solid-state fermentation
using Rhizopus oryzae: Novel strain improvement approach and studies on
purification and characterization. Bioresource Technol., 102, 10641-10649.
Rautela, G. S., and Cowling, E. B. (1966). Simple cultural test for relative cellulolytic
activity of fungi. Appl. Microbiol., 14, 892-898.
Reddy, G. V., Ravindra, B. P., Komaraiah, P., Roy, K. R. R. M., and Kothari, I. L.
(2003). Utilization of banana waste for the production of lignolytic and
cellulolytic enzymes by solid substrate fermentation using two Pleurotus
Species (P. ostreatus and P. sajor-caju). Process Biochem., 38, 1457-1462.

152
Reeslev, M., and Kjoller, A. (1995). Comparison of biomass dry weights and radial
growth rates of fungal colonies on media solidified with different gelling
compounds. Appl. Environ. Microbiol., 61, 4236-4239.
Remsing, R. C., Swatloski, R. P., Rogers, R. D., and Moyna, G. (2006). Mechanism of
cellulose dissolution in the ionic liquid 1-n-butyl-3-methylimidazolium chloride:
a 13
C and 35/37
Cl NMR relaxation study on model systems. Chem. Comm., 1271-
1273.
Rezende, M. I., Barbosa, A. M., Vasconcelos, A. F. D., and Endo, A. S. (2002).
Xylanase production by Trichoderma harzianum rifai by solid state
fermentation on sugarcane bagasse. Braz. J. Microbiol., 33, 66-72.
Ribeiro, J. M. C. R. (1991). Treatment of straws. Options Méditerranéennes - Série
Seminaires, 16, 55-60.
Rivela, I., Rodriguez Couto, S., and Sanroman, A. (2000). Extracellular ligninolytic
enzyme production by Phanerochaete chrysosporium in a new solid-state
bioreactor. Biotechnol. Lett., 22, 1443-1447.
Riviere, J. (1977). Industrial applications of microbiology, London: Surrey University
Press.
Rodriguez-Fernandez, D. E., Rodriguez-Leon, J. A., de Carvalho, J. C., Sturm, W., and
Soccol, C. R. (2011). The behaviour of kinetic parameters in production of
pectinase and xylanase by solid-state fermentation. Bioresource Technol., 102,
10657-10662.
Rodriguez-Leon, J. A., Soccol, C. R., Pandey, A., and Rodriguez, D. E. (2008a).
"Factors affecting solid-state fermentation", in A. Pandey, C. R. Soccol, and C.
Larroche, (eds.), Current developments in solid-state fermentation. New Delhi:
Asiatech Publishers, Inc.
Rodriguez-Leon, J. A., Soccol, C. R., Pandey, A., and Rodriguez, D. E. (2008b).
"Kinetics of solid-state fermentation", in A. Pandey, C. R. Soccol, and C.
Larroche, (eds.), Current developments in solid-state fermentation. New Delhi:
Asiatech Publishers, Inc.
Rodriguez Couto, S., and Sanroman, M. A. (2005). Application of solid-state
fermentation to ligninolytic enzyme production. Biochem. Eng, J., 22, 211-219.
Rodriguez Couto, S., and Sanroman, M. A. (2006). Application of solid-state
fermentation to food industry - a review. J. Food Eng., 76, 291-302.
153
Saha, B. C., and Cotta, M. A. (2008). Lime pretreatment, enzymatic saccharification
and fermentation of rice hulls to ethanol. Biomass Bioenerg., 32, 971-977.
Saha, B. C., Dien, B. S., and Bothast, R. J. (1998). Fuel ethanol production from corn
fiber. Current status and technical prospects. Appl. Biochem. Biotechnol., 70-72,
115-125.
Saha, B. C., Iten, L. B., Cotta, M. A., and Wu, Y. V. (2005). Dilute acid pretreatment,
enzymatic saccharification and fermentation of wheat straw to ethanol. Process
Biochem., 40, 3693-3700.
Saito, T., Hong, P., Kato, K., Okazaki, M., Inagaki, H., Maeda, S., and Yokogawa, Y.
(2003). Purification and characterization of an extracellular laccase of a fungus
(family Chaetomiaceae) isolated from soil. Enzyme Microb. Tech., 33, 520-526.
Sanchez, G., Pilcher, L., Roslander, C., Modig, T., Galbe, M., and Liden, G. (2004).
Dilute-acid hydrolysis for fermentation of the Bolivian straw material Paja
Brava. Bioresource Technol., 93, 249-256.
Sanderson, J., Wall, J. S., Donaldson, G. L., and Cavins, J. F. (1978). Effect of alkaline
pocessing of corn on its amino acids. Cereal Chem., 55, 204-213.
Saparrat, M. C. N., Bucsinszky, A. M. M., Tournier, H. A., Cabello, M. N., and
Arambarri, A. M. (2000). Extracellular ABTS-oxidizing activity of
autochthonous fungal strains from Argentina in solid medium. Rev. Iberoam.
Micol., 17, 64-68.
Saparrat, M. C. N., Martinez, M. J., Cabello, M. N., and Arambarri, A. M. (2002).
Screening for ligninolytic enzymes in autochthonous fungal strains from
Argentina isolated from different substrata. Rev. Iberoam. Micol., 19, 181-185.
Saucedo-Castaneda, G., Lonsane, B. K., Navarro, J. M., and Roussos, S. (1992).
Importance of medium pH in solid state fermentation for growth of
Schwanniomyces castellii. Lett. Appl. Microbiol., 15, 164-167.
Seoud, O. A. E., Koschella, A., Fidale, L. C., Dorn, S., and Heinze, T. (2007).
Applications of ionic liquids in carbohydrate chemistry: A window of
opportunities. Biomacromolecules, 8, 2629-2647.
Shafiei, M., Karimi, K., and Taherzadeh, M. J. (2010). Pretreatment of spruce and oak
by N-methylmorpholine-N-oxide (NMMO) for efficient conversion of their
cellulose to ethanol. Bioresource Technol., 101, 4914-4918.
154
Shuler, M. L., and Kargi, F. (2002). Bioprocess engineering: basic concepts, 2nd
edition, Upper Saddle River: Prentice-Hall, Inc.
Singh, S. K., and Srivastava, S. (2008). A textbook of fungi, New Delhi: Campus Books
International.
Smith, D., and Onions, A. H. S. (1983). The preservation and maintenance of living
fungi: Commonwealth Mycological Institute.
Smits, J. P. (1998). Solid-state fermentation: modelling fungal growth and activity,
Ph.D thesis, Wageningen Agricultural University, The Netherlands.
Soper, R., Taylor, D. J., Green, N. P. O., and Stout, G. W. (1998). Biological science
(CLPE), United Kingdom: Cambridge University Press.
Sree, N. K., Sridhar, M., Rao, L. V., and Pandey, A. (1999). Ethanol production in solid
substrate fermentation using thermotolerant yeast. Process Biochem., 34, 115-
119.
Sreenath, H. K., Koegel, R. G., Moldes, A. B., Jeffries, T. W., and Straub, R. J. (1999).
Enzymic saccharification of alfalfa fibre after liquid hot water pretreatment.
Process Biochem., 35, 33-41.
Sudhakar, P., and Nagarajan, P. (2010). Production of chitinase by solid state
fermentation from rice bran. Int. J. Environ. Sci. Technol., 1, 435-440.
Sugama, S., and Okazaki, M. (1979). Growth estimation of Aspergillus oryzae cultured
on solid media. J. Ferment. Technol., 57, 408-412.
Sun, N., Rahman, M., Qin, Y., Maxim, M. L., Rodriguez, H., and Rogers, R. D. (2009).
Complete dissolution and partial delignification of wood in the ionic liquid 1-
ethyl-3-methylimidazolium acetate. Green Chem., 11, 646-655.
Swatloski, R. P., Spear, S. K., Holbrey, J. D., and Rogers, R. D. (2002). Dissolution of
cellulose with ionic liquids. J. Am. Chem. Soc., 124, 4974-4975.
Szakacs, G., and Tengerdy, R. P. (1997). Lignocellulolytic enzyme production on
pretreated poplar wood by filamentous fungi. World J. Microbiol. Biotechnol.,
13, 487-490.
Tan, Y. H., and Wahab, M. N. (1997). Extracellular enzyme production during
anamorphic growth in the edible mushroom, Pleurotus sajor-caju. World J.
Microbiol. Biotechnol., 13, 613-617.
155
Thomas, G. V., Prabhu, S. R., Reeny, M. Z., and Bopaiah, B. M. (1998). Evaluation of
lignocellulosic biomass from coconut palm as substrate for cultivation of
Pleurotus sajor-caju (Fr.) Singer. World J. Microbiol. Biotechnol., 14, 879-882.
Thurston, C. F. (1994). The structure and function of fungal laccases. Microbiol., 140,
19-26.
Toca-Herrera, J. L., Osma, J. F., and Rodriguez Couto, S. (2007). "Potential of solid-
state fermentation for laccase production", A. Mendez-Vilas, (ed.)
Communicating current research and educational topics and trends in applied
microbiology, Volume 1. City: Formatex: Spain.
Torget, R., Himmel, M. E., and Grohmann, K. (1991). Dilute sulfuric acid pretreatment
of hardwood bark. Bioresource Technol., 35, 239-246.
Ullah, M. A., and Evans, C. S. (1999). Bioremediation of pentachlorophenol pollution
by the fungus Coriolus versicolor. Land Contam. Recl., 7, 255-260.
van de Lagemaat, J., and Pyle, D. L. (2004). Solid-state fermentation: a continuous
process for fungal tannase production. Biotechnol. Bioeng., 87, 924-929.
Vares, T., Kalsi, M., and Hatakka, A. (1995). Lignin peroxidases, manganses
peroxidases, and other ligninolytic enzymes produced by Phlebia radiata during
solid-state fermentation of wheat straw. Appl. Environ. Microbiol., 61, 3515-
3520.
Vazquez, M., Oliva, M., Tellez-Luis, S. J., and Ramirez, J. A. (2007). Hydrolysis of
sorghum straw using phosphoric acid: Evaluation of furfural production.
Bioresource Technol., 98, 3053-3060.
Vegas, R., Alonso, J. L., Dominguez, H., and Parajo, J. C. (2004). Processing of rice
husk autohydrolysis liquors for obtaining food ingredients. J. Agr. Food. Chem.,
52, 7311-7317.
Viswanath, B., Chandra, M. S., Pallavi, H., and Reddy, B. R. (2008). Screening and
assessment of lacasse producing fungi isolated from different environment
samples. Afr. J. Biotechnol., 7, 1129-1133.
Vuddaraju, S. P., Nikku, M. Y., Chaduvula, A. I. R., Dasari, V. R. R. K., and
Donthireddy, S. R. R. (2010). Application of statistical experimental designs for
the optimization of medium constituents for the production of L-asparaginase by
Serratia marcescens. J. Microb. Biochem. Technol., 2, 89-94.
156
Wariishi, H., Valli, K., and Gold, M. H. (1992). Manganese (II) oxidation by
manganese peroxidase from the Basidiomycete Phanerochaete chrysosporium.
J. Biol. Chem., 267, 23688-23695.
Webster, J., and Weber, R. W. S. (2007). Introduction to fungi, 3rd
edition, United
Kingdom: Cambridge University Press.
Weil, J., Westgate, P., Kohlmann, K., and Ladisch, M. R. (1994). Cellulose
pretreatments of lignocellulosic substrates. Enzyme Microb. Tech., 16, 1002-
1004.
Winquist, E., Moilanen, U., Mettala, A., Leisola, m., and Hatakka, A. (2008).
Production of lignin modifying enzymes on industrial waste material by solid-
state cultivation of fungi. Biochem. Eng, J., 42, 128-132.
Wunch, K. G., Feibelman, T., and Bennett, J. W. (1997). Screening for fungi capable of
removing benzo[a]pyrene in culture. Appl. Microbiol. Biotechnol., 47, 620-624.
Xiao, Y. Z., Chen, Q., Hang, J., Shi, Y. Y., Wu, J., Hong, Y. Z., and Wang, Y. P.
(2004). Selective induction, purification and characterization of a laccase
isoenzyme from the basidiomycete Trametes sp. AH28-2. Mycologia, 96, 26-35.
Xiao, Y. Z., Tu, X. M., Wang, J., Zhang, M., Cheng, Q., Zeng, W. Y., and Shi, Y. Y.
(2003). Purification, molecular characterization and reactivity with aromatic
compounds of a laccase from basidiomycete Trametes sp. strain AH28-2. Appl.
Microbiol. Biotechnol., 60, 700-707.
Yang, Z., and Pan, W. (2005). Ionic liquids: Green solvents for nonaqueous
biocatalysis. Enzyme Microb. Tech., 37, 19-28.
Yoon, L. W., Ang, T. N., Ngoh, G. C., and Chua, A. S. M. (2012). Regression analysis
on ionic liquid pretreatment of sugarcane bagasse and assessment of structural
changes. Biomass Bioenerg., 36, 160-169.
Yu, J., Zhang, X., and Tan, T. (2008). Ethanol production by solid state fermentation of
sweet sorghum using thermotolerant yeast strain. Fuel Process. Technol., 89,
1056-1059.
Zavrel, M., Bross, D., Funke, M., Buchs, J., and Spiess, A. C. (2009). High-throughput
screening for ionic liquids dissolving (ligno-)cellulose. Bioresource Technol.,
100, 2580-2587.

157
Zhang, Y.-H., and Lynd, L. R. (2005). Determination of the number-average degree of
polymerization of cellodextrins and cellulose with application to enzymatic
hydrolysis. Biomacromolecules, 6, 1510-1515.
Zhao, H., Jones, C. L., Baker, G. A., Xia, S., Olubajo, O., and Person, V. N. (2009).
Regenerating cellulose from ionic liquids for an accelerated enzymatic
hydrolysis. J. Biotechnol., 139, 47-54.
Zheng, G. J., Zhou, Y. J., Zhang, J., Cheng, K. K., Zhao, X. B., Zhang, T., and Liu, D.
H. (2007). Pretreatment of rice hulls for cellulase production by solid substrate
fermentation. J. Wood. Chem. Tech., 27, 65-71.
Zheng, Z., and Obbard, J. P. (2001). Effect of non-ionic surfactants on elimination of
polycyclic aromatic hydrocarbons (PAHs) in soil-slurry by Phanerochaete
chrysosporium. J. Chem. Tech. Biotechnol., 76, 423-429.
Zheng, Z., and Obbard, J. P. (2002). Polycyclic aromatic hydrocarbon removal from
soil by surfactant solubilization and Phanerochaete chrysosporium oxidation. J.
Environ. Qual., 31, 1842-1847.
Zheng, Z., and Shetty, K. (1998a). Cranberry processing waste for solid state fungal
inoculant production. Process Biochem., 33, 323-329.
Zheng, Z., and Shetty, K. (1998b). Solid-state production of beneficial fungi on apple
processing wastes using glucosamine as the indicator of growth. J. Agr. Food
Chem., 46, 783-787.
Zhu, L., O'Dwyer, J. P., Chang, V. S., Granda, C. B., and Holtzapple, M. T. (2008).
Structural features affecting biomass enzymatic digestibility. Bioresource
Technol., 99, 3817-3828.
Zhu, S., Wu, Y., Chen, Q., Yu, Z., Wang, C., Jin, S., Ding, Y., and Wu, G. (2006).
Dissolution of cellulose with ionic liquids and its application: a mini review.
Green Chem., 8, 325-327.
158
APPENDIX A
Standardization of Working α-Amylase for NDF Determination
Heat-stable α-amylase Type XII-A from Bacillus licheniformis (Catalogue number
A3403) stock solution was purchased from Sigma-Aldrich. The heat-stable α-amylase
stock solution was standardized so that two additions of 2 ml removed raw corn starch
from 0.5 g ground hominy corn (AOAC, 2005). The volumes of dosage examined were
in the geometric progression of 0.025 ml from 0.100 to 0.250 ml of heat-stable α-
amylase stock solution. A mixture of 0.5 g ground hominy corn and 50 ml of ND
solution was refluxed for 10 minutes. Two equal doses of stock were added to the
mixture, one dose was added at the moment when the mixture started to boil, and
allowed to reflux for 60 minutes; the other dose was added after reflux and allowed to
react for 60 seconds. The mixture was filtered through cheesecloth into 100.0 ml beaker
and placed in a cold water bath for about 5 minutes before moved to a room temperature
tempering bath. Next, 0.5 ml Burke‟s iodine solution was added and the colour of the
solution was viewed after 90 seconds and before 120 seconds has elapsed. The efficacy
of raw corn starch hydrolysis was evaluated using the scale tabulated in Table A1. The
lowest dose that gave pale yellow colour represented the volume of heat-stable α-
amylase stock solution used to make working solution. Blank (control) was prepared by
adding two doses of 0.1 ml heat-stable α-amylase stock solution to 40 ml of ND
solution. Prepared working solution was stored refrigerated and used within five days
from the day of preparation.
Table A2 showed the colour indication of raw corn starch solution reacted with two
dosages of varied volume α-amylase stock solution after addition of Burke‟s iodine
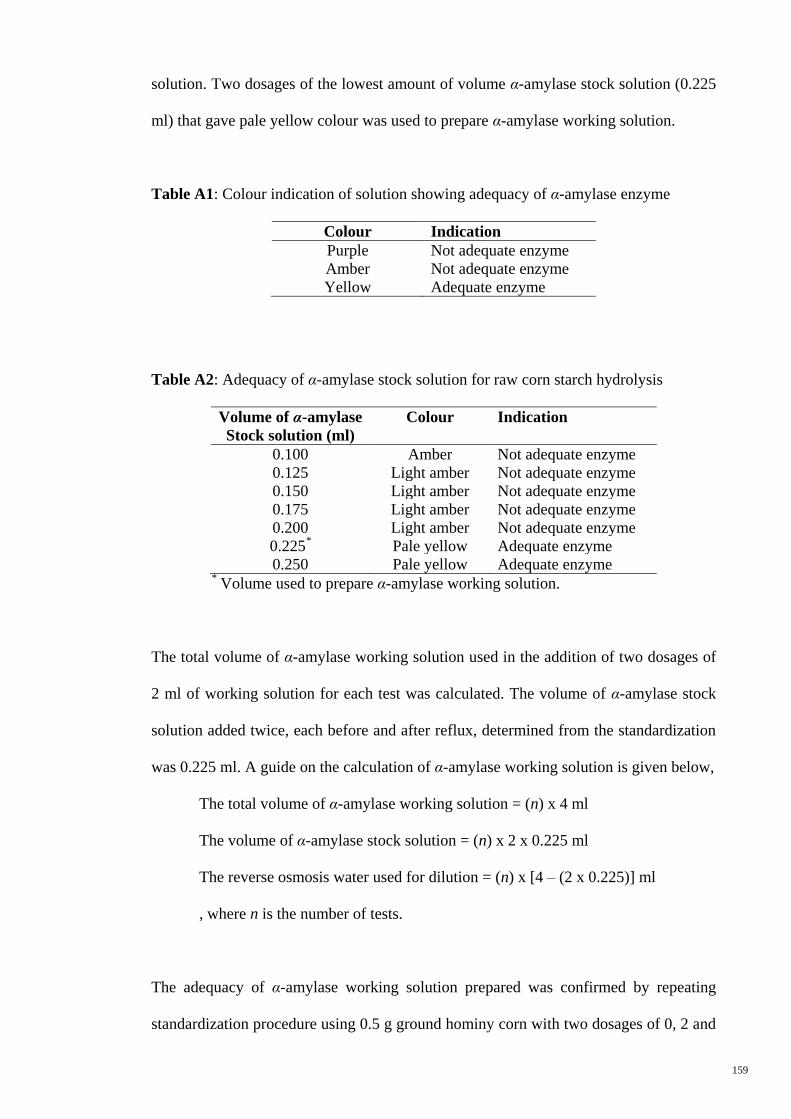
159
solution. Two dosages of the lowest amount of volume α-amylase stock solution (0.225
ml) that gave pale yellow colour was used to prepare α-amylase working solution.
Table A1: Colour indication of solution showing adequacy of α-amylase enzyme
Colour Indication
Purple Not adequate enzyme
Amber Not adequate enzyme
Yellow Adequate enzyme
Table A2: Adequacy of α-amylase stock solution for raw corn starch hydrolysis
Volume of α-amylase
Stock solution (ml)
Colour Indication
0.100 Amber Not adequate enzyme
0.125 Light amber Not adequate enzyme
0.150 Light amber Not adequate enzyme
0.175 Light amber Not adequate enzyme
0.200 Light amber Not adequate enzyme
0.225* Pale yellow Adequate enzyme
0.250 Pale yellow Adequate enzyme * Volume used to prepare α-amylase working solution.
The total volume of α-amylase working solution used in the addition of two dosages of
2 ml of working solution for each test was calculated. The volume of α-amylase stock
solution added twice, each before and after reflux, determined from the standardization
was 0.225 ml. A guide on the calculation of α-amylase working solution is given below,
The total volume of α-amylase working solution = (n) x 4 ml
The volume of α-amylase stock solution = (n) x 2 x 0.225 ml
The reverse osmosis water used for dilution = (n) x [4 – (2 x 0.225)] ml
, where n is the number of tests.
The adequacy of α-amylase working solution prepared was confirmed by repeating
standardization procedure using 0.5 g ground hominy corn with two dosages of 0, 2 and
160
4 ml working solution, each before and after reflux. The lower volume of α-amylase
working solution was selected when there is no appreciable difference in colour
between dosages. The outcome was tabulated in Table A3.
Table A3: Adequacy of α-amylase working solution dosage volume
Volume of α-amylase
working solution (ml) Colour Indication
0 * Purple Not adequate enzyme
2 Pale yellow Adequate enzyme
4 Pale yellow Adequate enzyme * Control of experiment.
Preparation of Hominy Corn for Standardization of Working α-Amylase
Hominy corn is dried corn kernel that has been treated with alkali (Sanderson et al.,
1978). The hominy corn was prepared in the laboratory according to the procedure
outlined by Sanderson et al. (1978). Dried corn (dried condiments, First Choice Brands)
was purchased from a local supermarket. The corn was washed and decanted dry to
remove foreign particles. Then, approximately 200 g of dried corn was boiled and
stirred in lime water containing 20 g/L calcium hydroxide (Sigma-Aldrich) for 15
minutes. Subsequently, it was allowed to soak in the lime water for one hour. After the
soaking, the lime-treated corn was washed several times to remove excess lime. The
corn was boiled again in 500 ml water for 30 minutes and allowed to soak for another
30 minutes. Then, the corn hulls, tip caps, and germs were removed. The remaining
endosperm of corn was boiled in water for 15 minutes and allowed to cool to room
temperature. The corn was rinsed with cool water and dried in an incubator (JEIO
TECH, model IB-10) at 50oC until constant weight was achieved. The drying was done
in mild temperature in incubator to avoid the content deterioration of the hominy corn.
Figure A1 illustrates dried hominy corn produced in the laboratory before grinding to
pass through a 500 µm sieve and stored in a dry cabinet prior to use.
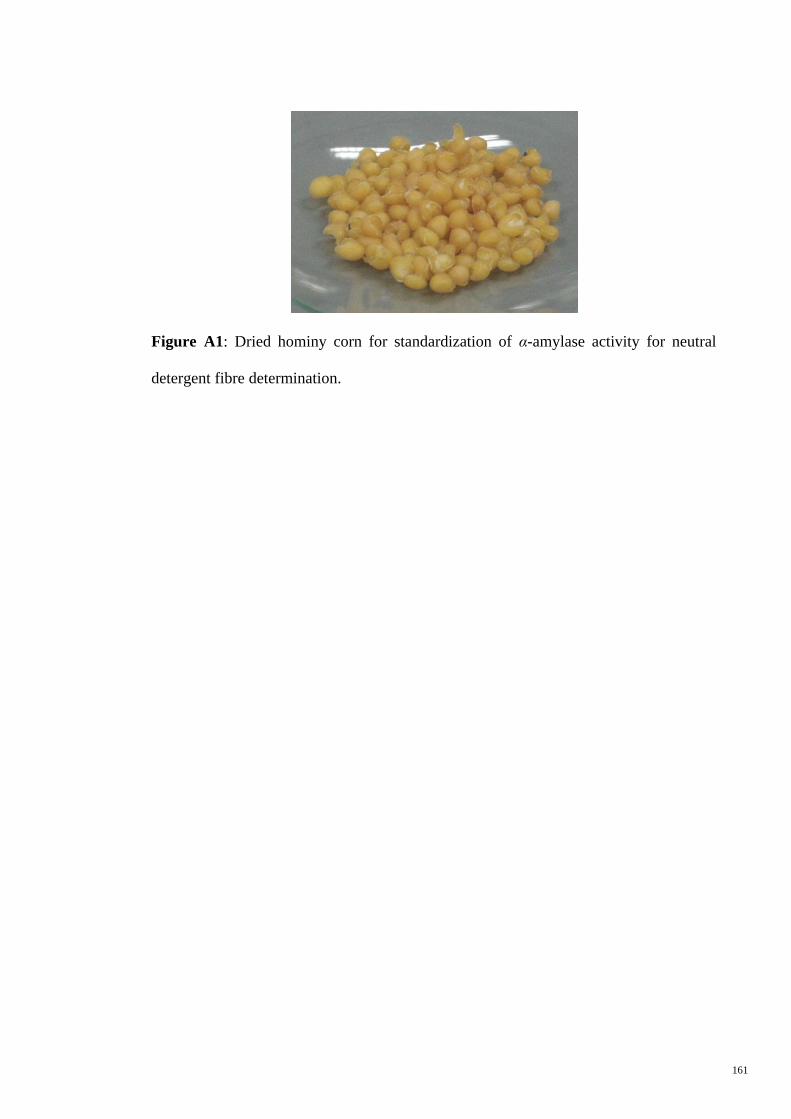
161
Figure A1: Dried hominy corn for standardization of α-amylase activity for neutral
detergent fibre determination.

162
APPENDIX B
Construction of Glucose Standard Calibration Curve
The calibration curve was constructed from standards prepared from anhydrous D-
glucose (Fisher Scientific). Glucose standards were made from serial dilutions of 1.0
mg/ml glucose stock solution as shown in Table B1.
Table B1: Ratio of glucose stock to water in the preparation of standards
Concentration of
glucose standard (mg/ml)
Volume of
glucose stock (ml)
Volume of
water (ml)
1.00 10.00 0.00
0.75 7.50 2.50
0.62 6.25 3.75
0.50 5.00 5.00
0.37 3.75 6.25
0.25 2.50 7.50
The absorbance data for the standard calibration curve was closely fit to a calculated
best-fit line with a coefficient of determination (R2) for the straight line fit close to one
(Figure B1). The concentration of reducing sugar in the samples was determined from
the calibration curve. The reducing sugar concentration of the samples must fall within
the lowest and highest value of the calibration curve. It is advised to measure the
glucose standards and samples in a single determination to minimize errors caused by
experimenter and reagents.
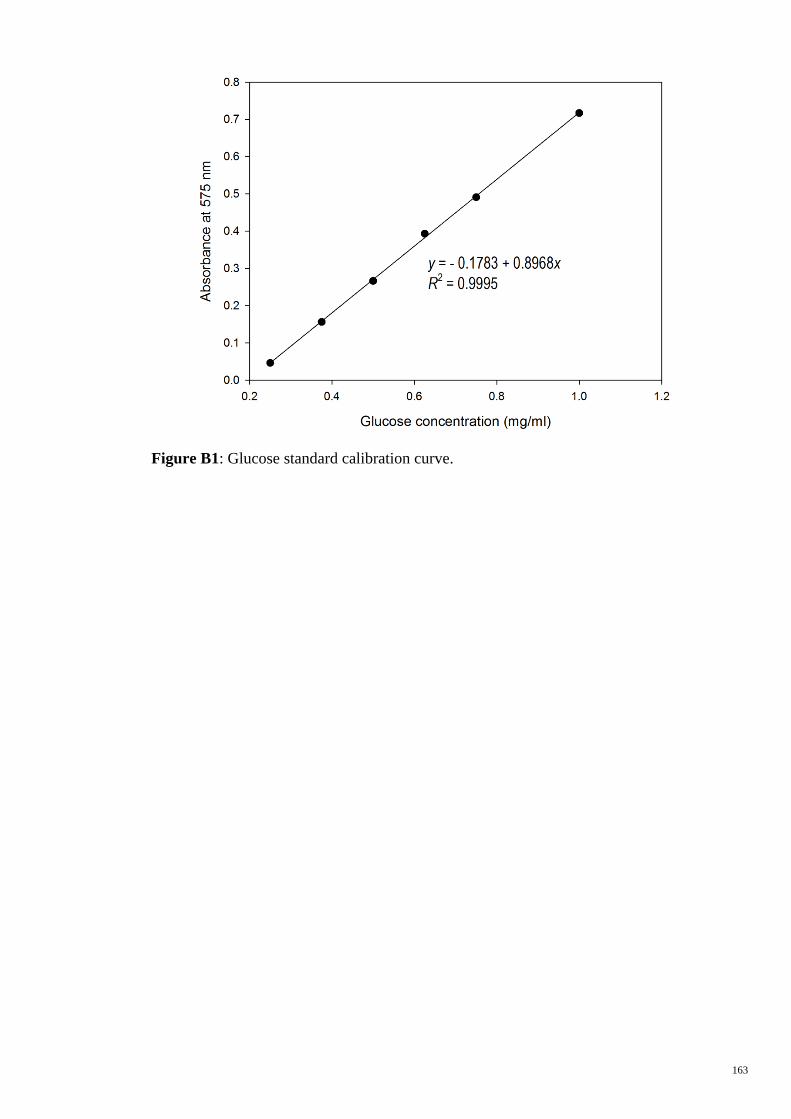
163
Figure B1: Glucose standard calibration curve.
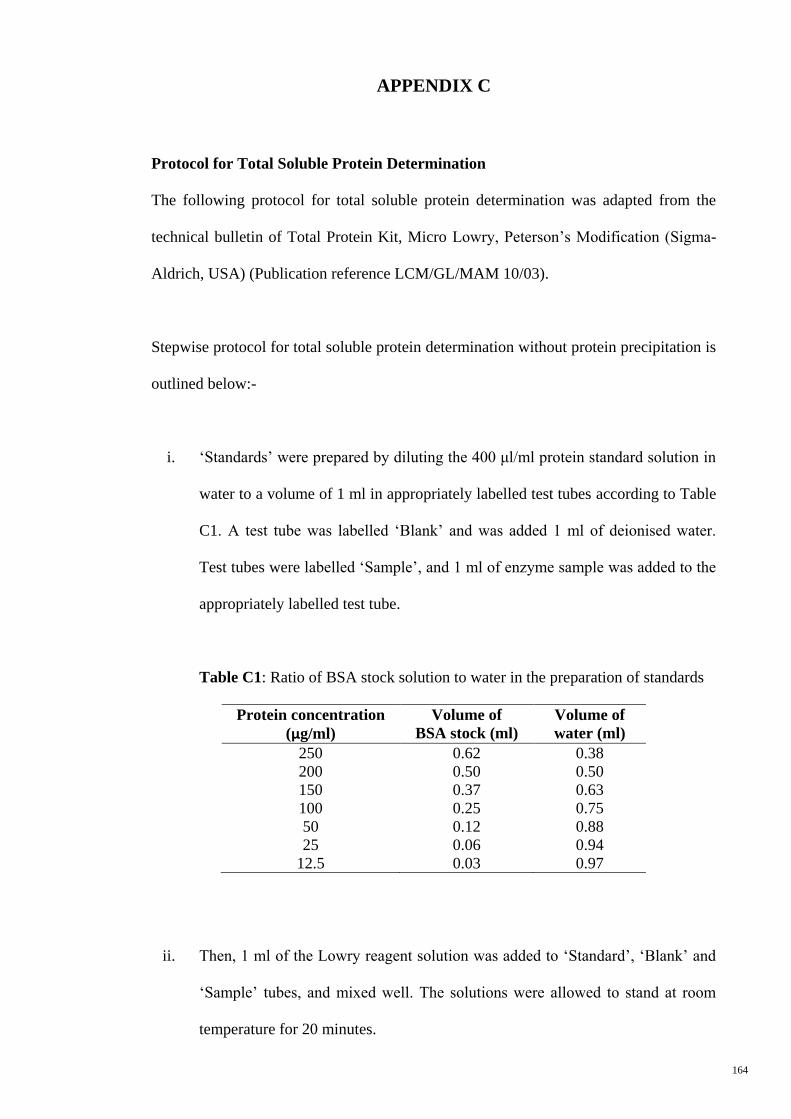
164
APPENDIX C
Protocol for Total Soluble Protein Determination
The following protocol for total soluble protein determination was adapted from the
technical bulletin of Total Protein Kit, Micro Lowry, Peterson‟s Modification (Sigma-
Aldrich, USA) (Publication reference LCM/GL/MAM 10/03).
Stepwise protocol for total soluble protein determination without protein precipitation is
outlined below:-
i. „Standards‟ were prepared by diluting the 400 μl/ml protein standard solution in
water to a volume of 1 ml in appropriately labelled test tubes according to Table
C1. A test tube was labelled „Blank‟ and was added 1 ml of deionised water.
Test tubes were labelled „Sample‟, and 1 ml of enzyme sample was added to the
appropriately labelled test tube.
Table C1: Ratio of BSA stock solution to water in the preparation of standards
Protein concentration
(μg/ml)
Volume of
BSA stock (ml)
Volume of
water (ml)
250 0.62 0.38
200 0.50 0.50
150 0.37 0.63
100 0.25 0.75
50 0.12 0.88
25 0.06 0.94
12.5 0.03 0.97
ii. Then, 1 ml of the Lowry reagent solution was added to „Standard‟, „Blank‟ and
„Sample‟ tubes, and mixed well. The solutions were allowed to stand at room
temperature for 20 minutes.
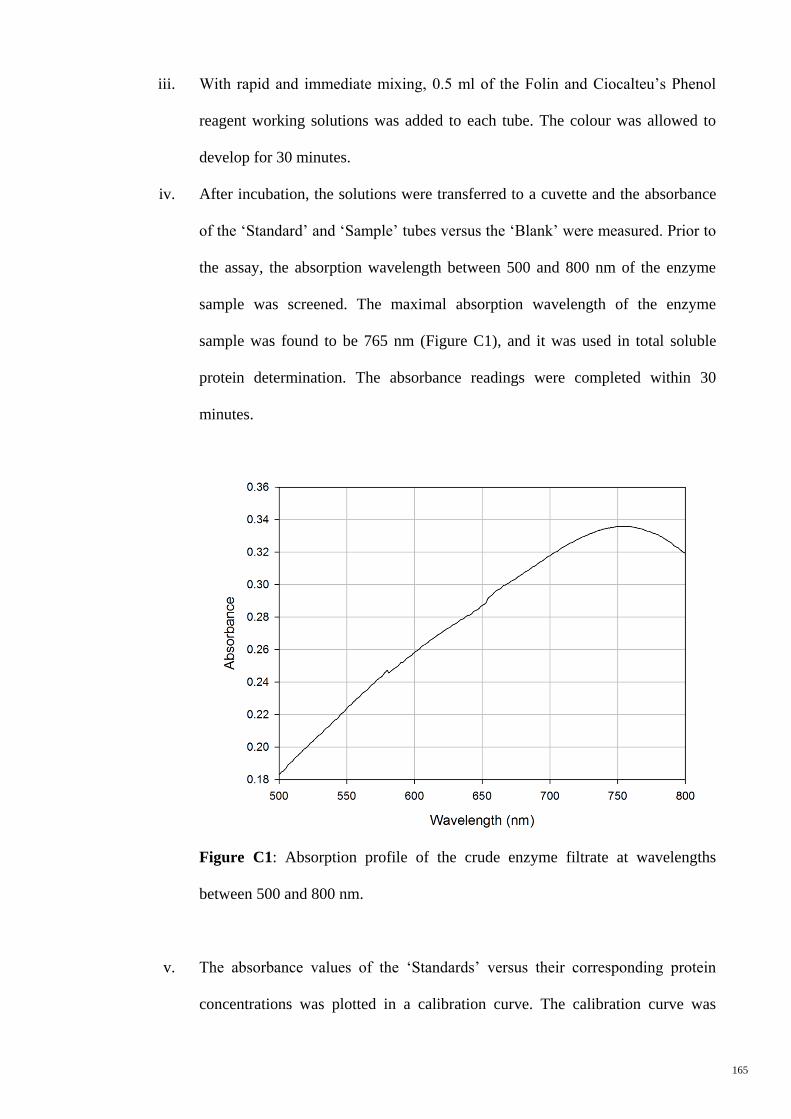
165
iii. With rapid and immediate mixing, 0.5 ml of the Folin and Ciocalteu‟s Phenol
reagent working solutions was added to each tube. The colour was allowed to
develop for 30 minutes.
iv. After incubation, the solutions were transferred to a cuvette and the absorbance
of the „Standard‟ and „Sample‟ tubes versus the „Blank‟ were measured. Prior to
the assay, the absorption wavelength between 500 and 800 nm of the enzyme
sample was screened. The maximal absorption wavelength of the enzyme
sample was found to be 765 nm (Figure C1), and it was used in total soluble
protein determination. The absorbance readings were completed within 30
minutes.
Figure C1: Absorption profile of the crude enzyme filtrate at wavelengths
between 500 and 800 nm.
v. The absorbance values of the „Standards‟ versus their corresponding protein
concentrations was plotted in a calibration curve. The calibration curve was

166
constructed from „Standards‟ prepared from bovine serum albumin (BSA,
Sigma-Aldrich). At BSA protein concentrations between 12.5 and 250 μg/ml the
absorbance data closely fit to a hyperbolic curve with a coefficient of
determination (R2) for the fitted line close to 1 (Figure C2). The protein
concentration of the „Samples‟ were determined from the calibration curve.
Figure C2: Protein standard calibration curve.
167
APPENDIX D
Protocol for Staining SDS-PAGE Gel
The following protocol for staining sodium dodecyl sulfate-polyacrylamide gel
electrophoresis (SDS-PAGE) gel of the partial purified laccase sample was adapted
from the user guide of SimplyBlue™
SafeStain (Comassie G-250 stain, Novex®
by Life
Technologies, USA) (Publication part number IM-6050; Revision date 13th
February
2012).
Stepwise protocol for staining SDS-PAGE gel is outlined below:-
i. The gel was rinsed 3 times for 5 minutes with 100 ml deionised water to
remove SDS and buffer salts that interfere with binding of the dye to protein.
The deionised water was discarded after each rinse.
ii. The gel was stained with SimplyBlue™
SafeStain using volume enough to
cover the gel. The gel was stained for 1 hour at room temperature with
gentle shaking. After incubation, the stain was discarded.
iii. The gel was washed with 100 ml of deionised water for 2 hours. Then, about
20 ml of 20% sodium chloride (NaCl) was added to the deionised water, and
the gel was continued to wash for additional 1 hour.
iv. The second wash was applied to the gel for the clearest background. The gel
was washed with 100 ml of deionised water for 1 hour. The proteins appear
blue, and there is a small amount of dye in the deionised water that is in
equilibrium with the dye bound to the proteins.