production of aligned short-fibre compositesetheses.bham.ac.uk/4705/1/jameson14mres.pdf ·...
TRANSCRIPT

i
Production of Aligned
Short-fibre Composites
MRes Science and Engineering of Materials
By Nicola Jameson
Word count: 14,846
1st September 2012
School of Metallurgy and Materials
College of Engineering and Physical sciences
The University of Birmingham

University of Birmingham Research Archive
e-theses repository This unpublished thesis/dissertation is copyright of the author and/or third parties. The intellectual property rights of the author or third parties in respect of this work are as defined by The Copyright Designs and Patents Act 1988 or as modified by any successor legislation. Any use made of information contained in this thesis/dissertation must be in accordance with that legislation and must be properly acknowledged. Further distribution or reproduction in any format is prohibited without the permission of the copyright holder.
ii
Abstract
This study investigated a manufacturing process to align short-fibres using a custom-made fibre
chopper system. With this technique, continuous waste fibres are chopped, aligned and
deposited onto an adhesive substrate to produce aligned short-fibre prepregs. Experimental
methods were developed to address issues associated with calibration, a blade inspection
criteria and the optimisation of producing parameters to achieve at least 60% fibre alignment
in the prepreg.
In order to ensure that the quality and the consistency of the chopped fibre ends were
maintained, a criteria was developed to specify when the blade or the fibre chopper should be
replaced. This production technique was used to manufacture 8-ply composites using the
aligned short-fibre prepregs. Continuous fibre prepregs were also used to manufacture
reference composites for comparison purposes. Non-destructive testing via visual inspection
and ultrasonic c-scanning was used to determine the quality of the composites.
The physical and mechanical properties of the composite were established using conventional
test methods.
The main conclusions reached were:
(i) The fibre-chopper-based technique developed in this study was capable of producing
aligned glass and carbon short-fibre prepregs.
(ii) The degree of fibre alignment was approximately 70%.
(iii) The fibre volume fraction was found to be approximately 60%.
(iv) The Young’s Modulus of the aligned glass short-fibre composite was 33 GPa ; in
comparison, the corresponding value for the continuous fibre composite was 39 GPa

iii
Acknowledgements
Firstly, I would like to thank my parents and family for their incredible support through my
education, sporting activities and social events. I love them all very much and will forever be
thankful for all they have done for me in my life to date and the future.
The exceptional network of friends I have made through school, University and sport have
left lasting memories and their support has been second to none.
As a student at the University of Birmingham I am happy to say that I have had some
incredible times and experiences over the duration of my studies which I will never forget.
I must also show my appreciation to my supervisor Professor Gerard Fernando who has
provided support and guidance as well as bringing new ideas into the research.
Finally, I would like to thank all the members of the Sensors and Composites group who have
provided an input into my research whether it was in the laboratory or the office. I am
thankful for the help and enjoyment they provided as part of the research group.
iv
Table of Contents
Front cover…………………………………………………………………..……………....... i
Abstract……………………………………………………………………….…………........ ii
Acknowledgements………………………………………………………………………….. iii
Table of Contents……………………………………………………………..………………iv
1 Introduction ...................................................................................................................... 1
2 Aims and Objectives ......................................................................................................... 3
3 Thesis Overview ................................................................................................................ 5
4 Literature Review ............................................................................................................. 6
4.1 Composites ................................................................................................................. 6
4.1.1 Preforms ............................................................................................................... 6
4.1.2 Reinforcements .................................................................................................... 7
4.1.2.1 Glass fibres ................................................................................................... 7
4.1.2.2 Carbon fibres ................................................................................................ 8
4.1.3 Matrix ................................................................................................................... 9
4.1.3.1 Epoxy resin systems ................................................................................... 10
4.1.4 Interface ............................................................................................................. 10
4.2 Fibre reinforced polymer composites ...................................................................... 11
4.2.1 Matrix cracking .................................................................................................. 15
4.2.2 Fibre fracture ...................................................................................................... 15
4.2.3 Fibre pull-out ..................................................................................................... 16
4.2.4 Delamination ...................................................................................................... 17
4.2.5 Fatigue................................................................................................................ 18
4.3 Short-fibre composites ............................................................................................. 18
4.3.1 Mechanical properties ........................................................................................ 19
4.3.2 Fibre length distribution ..................................................................................... 21
4.3.3 Fibre volume fraction ......................................................................................... 22
4.3.4 Fibre alignment methods.................................................................................... 23
4.3.4.1 Hydrodynamics ........................................................................................... 25
4.3.4.2 Extrusion ..................................................................................................... 27

v
4.3.4.3 Electrostatics ............................................................................................... 29
4.3.4.4 Magnetics.................................................................................................... 30
4.3.4.5 Spray techniques ......................................................................................... 32
4.3.4.5.1 Mechanical properties of aligned short-fibre composites ...................... 33
5 Experimental ................................................................................................................... 35
5.1 Materials .................................................................................................................. 35
5.1.1 Reinforcements .................................................................................................. 35
5.1.2 Matrix ................................................................................................................. 35
5.2 Manufacture of continuous fibre laminates ............................................................. 36
5.2.1 Differential scanning calorimetry ...................................................................... 36
5.3 Short-fibre prepreg manufacturing process ............................................................. 36
5.3.1 Fibre chopper ..................................................................................................... 37
5.3.2 Voltage-control system ...................................................................................... 38
5.3.3 Conveyor belt ..................................................................................................... 39
5.3.4 Traverse system ................................................................................................. 40
5.3.5 Unwinder............................................................................................................ 40
5.4 Calibration of the fibre chopper and conveyor belt system ..................................... 40
5.4.1 Fibre deposition rate .......................................................................................... 41
5.4.2 Chopper speed .................................................................................................... 41
5.4.3 Conveyor belt system ......................................................................................... 41
5.4.4 Traverse system ................................................................................................. 42
5.4.5 Angle of the chopper head ................................................................................. 42
5.5 Short-fibre prepreg production ................................................................................ 42
5.6 Composite manufacture ........................................................................................... 43
5.6.1 Autoclave ........................................................................................................... 44
5.6.2 Short-fibre prepreg alignment ............................................................................ 45
5.6.3 Short-fibre prepreg coverage ............................................................................. 46
5.7 Quality control ......................................................................................................... 47
5.7.1 Macro imaging ................................................................................................... 47
5.7.2 C-Scan ................................................................................................................ 47
5.7.3 Scanning Electron Microscopy .......................................................................... 47
5.7.4 Optical Microscopy ............................................................................................ 47
5.7.4.1 Chopped fibre end -face quality, blade inspection and blade replacement 48

vi
5.8 Test methods ............................................................................................................ 48
5.9 Physical properties ................................................................................................... 49
5.9.1 Composite fibre alignment ................................................................................. 49
5.9.2 Density ............................................................................................................... 50
5.9.3 Fibre volume fraction ......................................................................................... 51
5.9.3.1 Glass fibre composites ................................................................................ 51
5.9.3.2 Carbon fibre composites ............................................................................. 51
5.10 Mechanical properties .............................................................................................. 52
5.10.1 Tensile strength, failure strain, Young’s Modulus ............................................. 52
6 Results and Discussion ................................................................................................... 53
6.1 Short-fibre composite............................................................................................... 53
6.1.1 Calibrations of the fibre chopper ....................................................................... 53
6.1.1.1 Fibre deposition rate ................................................................................... 53
6.1.1.2 Chopper speed ............................................................................................ 54
6.1.1.3 Conveyor belt ............................................................................................. 55
6.1.1.4 Traverse system .......................................................................................... 56
6.1.1.5 Angle of chopper head ................................................................................ 57
6.2 Production of short-fibre composites ....................................................................... 58
6.2.1 Fibre alignment in the prepreg ........................................................................... 58
6.3 Production of continuous fibre composites.............................................................. 62
6.3.1 Differential scanning calorimetry ...................................................................... 62
6.3.2 Macro imaging ................................................................................................... 63
6.4 Quality control ......................................................................................................... 64
6.4.1 C-scans ............................................................................................................... 64
6.4.2 Scanning electron microscopy ........................................................................... 70
6.4.2.1 Blade inspection and replacement .............................................................. 70
6.4.2.2 Fibre-end quality......................................................................................... 72
6.5 Test methods ............................................................................................................ 75
6.5.1 Fibre alignment .................................................................................................. 76
6.5.2 Physical properties ............................................................................................. 81
6.5.2.1 Density ........................................................................................................ 82
6.5.2.2 Fibre volume fraction ................................................................................. 83
6.5.2.2.1 Glass fibre composites ........................................................................... 83

vii
6.5.2.2.2 Carbon fibre composites......................................................................... 83
6.5.3 Mechanical properties ........................................................................................ 85
6.5.3.1 Tensile strength........................................................................................... 85
6.5.3.2 Failure strain ............................................................................................... 85
6.5.3.3 Young’s Modulus ....................................................................................... 87
6.6 Failure analysis ........................................................................................................ 90
6.6.1 Visual inspection ................................................................................................ 90
6.6.2 Fractography (SEM) .......................................................................................... 91
6.6.2.1 Continuous carbon fibre composite ............................................................ 92
6.6.2.2 Short-carbon fibre composite ..................................................................... 93
7 Conclusions ..................................................................................................................... 97
8 Future Work ................................................................................................................... 98
9 Appendices ...................................................................................................................... 99
9.1 Recycling ................................................................................................................. 99
10 References ..................................................................................................................... 102
1
1 Introduction
It is well known that fibre-reinforced composites have high strength-to-weight and
stiffness-to-weight ratios. Other significant benefits of composites are their fatigue resistance
dimensional stability, durability and corrosion resistance. The reinforcing fibre can be in
continuous or short forms. The properties of short-fibre composites depend strongly on the
microstructural parameters such as the degree of fibre alignment and the fibre volume
fraction.
The proposed implementation of EU legislation in the composite industry requires that 85%
of composite waste must be recycled and reused by 2015 [1]. Consequently there is an
urgent need to develop techniques to reuse, recycle or redevelop waste prepregs and
composites. This will reduce the current disposal rate of waste fibre, fabrics, prepregs and
composites, as 95% are presently buried in landfill sites in the UK [1]. The increase in
demand to improve recyclability of waste fibres has led to the development of techniques to
recycle waste preforms and composites including methods to align and produce short-fibre
thermosetting composites. The current composite recycling efforts are dominated by two
main techniques: (i) the prepregs are ground, chipped, or flaked into a powder of a specified
size and distribution that can be used as filler material in polymers; and (ii) the continuous
fibres are chopped into short-fibres and are processed to produce sheet-moulding or
dough-moulding compounds.
It is generally recognised that the mechanical properties of fibre reinforced composites (FRC)
are superior in the direction of the fibres, the relative fibre volume fraction and the degree of
fibre orientation. Furthermore, in the case of short-fibre composites, increasing the degree of

2
fibre alignment and the fibre volume fraction will lead to an increase in the physical and
mechanical properties.
A sponsor associated with the project utilises carbon fibre to over-wrap aluminium cylinders
using filament winding. The product specification dictates the manufactured product should
not contain any ‘fibre joints’. Therefore, the last 10-20m of a bobbin or creel are disguarded.
Obviously, the development of techniques to utilise this waste will accrue significant
commercial, economical and environmental benefits.
This study presents a novel technique to recycle waste E-glass and carbon continuous fibres
for the production of aligned short-fibre prepregs. End-of-spool carbon and glass fibres were
used as the source materials. The production of aligned short-fibre prepregs required the
following: (i) design and construction of a fibre chopper; and (ii) design and construction of a
conveyor belt system to house the fibre chopper and an adhesive film.
3
2 Aims and Objectives
The aims and objectives of the current work were as follows:
(i). To develop a technique to enable glass and carbon fibres to be chopped and deposited in
an aligned fashion on an adhesive backed substrate.
This was achieved by modifying a commercially-available fibre chopper. The fibre chopper
was adapted to combine the chopping process and the ejection trajectory. Thus it was
possible to deposit the chopped fibres in a controlled manor on to a conveyor belt with an
adhesive backing.
(ii). To calibrate the output of the custom modified fibre chopper.
Here the chopped fibres were deposited onto an analytical weighing balance which was
connected to a data acquisition system. The rotation speed of the fibre chopper was controlled
by the applied voltage; the output of the fibre chopper, conveyor belt and traverse were
calibrated as a function of the applied voltage.
(iii). To manufacture “reference” composites using a hand lay-up technique.
In order to enable comparison between the continuous fibre and short-fibre composites
(manufactured using the fibre chopper) reference composites were made involving
end-of-spool glass and carbon fibres. These fibres were hand-laid up on an adhesive film and
laminated to give an 8-ply laminate followed by processing in an autoclave.

4
(iv). To characterise the physical and mechanical properties of the reference continuous-fibre
and the aligned short-fibre composites.
The continuous fibre and short-fibre composites were characterised and the following
properties were determined: fibre alignment, density, fibre volume fraction, void content,
tensile strength, failure strain, Young’s Modulus, flexural modulus and short-beam strength.

5
3 Thesis Overview
Section 1 introduces composites and the need to increase recyclability.
Section 2 details the aims and objectives for the project.
Section 3 shows the overview of the thesis.
Section 4 presents an overview of the literature in the following areas: Composites, fibre
reinforced polymer composites and short-fibre composites.
Section 5 details experimental procedures used in the manufacture of the continuous fibre and
short-fibre composites. Also involved in this section is information relating to the fibre
chopper system calibrations, quality control and material testing procedures.
Section 6 reports the results combined with the discussion of the completed testing
procedures.
Section 7 presents a summary of the main achievements and conclusions reached.
Section 8 contains recommendations for future work.
Section 9 contains additional information in an appendix.
Section 10 lists all references used in this report.

6
4 Literature Review
4.1 Composites
The principle characteristics of a composite material is that they have three main constitutes
that are fundamental to their performance. First is the reinforcement which can be continuous
fibres, short-fibres or particulates. The second is the matrix which secures the reinforcements
in position and transfers the applied load to the fibres. The matrix also offers a degree of
protection to the reinforcement. The third component is the interface which is the region
between the fibre and the matrix. It is necessary to understand the individual constitutes as
their structure forms an important factor in determining the properties of the composite.
Fibre-reinforced polymer composites (FRPC) are increasingly used in industrial sectors
because they offer unique properties such as: low density, high strength characteristics, high
modulus, superior corrosion resistance and higher fatigue properties [2].
4.1.1 Preforms
Preforms are generally available as chopped strand mat, woven fabrics, prepregs, stitched
fabrics or braided components [3]. The fibre is an important constituent in a composite as this
is the main load-bearing component. The fibre normally occupies 30% - 70% of the
composite volume. The fibres are generally treated with sizing agents as this improves the
bonding between the matrix [3]. The most common fibres used in polymer matrix composites
are glass, carbon and aramid. Common matrix materials include epoxies, polyesters and
polyamides [3].

7
4.1.2 Reinforcements
Table 1 provides a summary of the mechanical properties for specified fibre types. The
choice of fibre and its specific properties are selected to complement a specific matrix; the
addition of fibres in different volume fractions and orientation allow composites to be
customised for specific applications.
Type of Fibre
Tensile Strength
(GPa)
Failure Strain
(%)
Young’s Modulus
(GPa)
Density
(g/m3)
E-glass 2.4 3.0 73 2.6
S-glass 3.4 3.9 86 2.5
Carbon HS 3.5 1.5-2.2 220-240 1.8
Carbon HM 3.5 1.3-2.0 290-300 1.8
Carbon UHM 3.4-5.5 0.7-1.0 350-450 2.0
Aramid 2.0-3.0 4.4 60 1.4
HS: High Strength, HM: High Modulus, UHM: Ultra High Modulus
Table 1 Summary of physical and mechanical properties for selected reinforcing fibres [3].
4.1.2.1 Glass fibres
Glass fibres are based on silica (SiO2) with additions of oxides such as calcium and sodium
[3]. There are many classifications of glass fibres: E-glass (electrical) fibres are the most
commonly used and have good strength, stiffness and electrical properties. C-glass
(corrosive) fibres have lower strength but are better suited to corrosive environments whilst
S-glass (strength) fibres have higher strength than E-glass fibres but are more expensive [3].
AS-glass (alkaline resistant) fibres have an increase of use in specific environmental
conditions. The general advantages of fibre glass include low cost, high tensile strength, high

8
chemical resistance and excellent insulating properties [4]. The fibre itself is regarded as an
isotropic material [3]. When fibres are uniform and parallel to each other the optimal strength
of E-glass fibres can be achieved by this alignment [3]. Manufacturers of E-glass fibres are
reported to generate approximately 40 tons of waste glass-fibres each week. Therefore, the
ability to utilise these waste fibres will avoid the need for them to be deposited in land fill
sites (as they are currently).
4.1.2.2 Carbon fibres
Carbon fibres are an anisotropic material and they are used extensively in aerospace, motor
racing and top-of-the-range sporting goods. Carbon fibre composites are increasingly being
used in new manufacturing applications where the cost of the material can be secondary to
design considerations such as increased performance, high strength and reduced weight [5].
Carbon fibres have the disadvantage of lower impact strength than aramid and glass fibres but
have a higher fatigue resistance [3].

9
4.1.3 Matrix
Two classes of resins that are used as the matrix material in FRPC are thermoplastics and
thermosets. A thermoplastic resin melts or softens when heated above a specified temperature
and turns into a glassy state when cooled. In a thermosetting resin, the curing or cross-curing
process is irreversible, where the curing is commonly achieved through the application of
heat. Table 2 presents a comparison of the properties of thermoplastic and thermosetting
matrix materials. Other curing methods include photo-curing, electron beam and microwave
processing [6]. Different resin systems are used depending on the applications, where
polyesters, vinyl esters and epoxies probably account for 90% of all thermosetting resin
systems used in structural composites [3].
Type of Matrix
Tensile
Strength
(MPa)
Failure
Strain
(%)
Young’s
Modulus
(GPa)
Density
(g/m3)
Heat distortion
Temperature
(°C)
Thermoplastic
PEEK 90-170 50 3.6 1.26-1.32 150-200
Polypropylene 20-40 300 1.0-1.4 0.9 80-120
Nylon 6.6 60-70 40-80 1.4-2.8 1.14 120-150
Thermosets
Epoxy 40-80 1.0-20.0 2.0-5.0 1.1-1.4 50-200
Polyester 40-90 2.0 2.0-4.5 1.2-1.5 50-110
Table 2 Mechanical properties of different matrices [3].

10
4.1.3.1 Epoxy resin systems
With reference to Table 2, it can be seen that the epoxy resins used in composites have lower
material properties than the fibres.
Epoxy resins systems are used extensively in the automotive, electrical and appliance
applications. Epoxy resins can be cured at temperatures from 5 °C to 180 °C [3], depending
on the refractivity of the functional groups and the choice of curing agent. The cure rates can
be formulated to meet the required processing characteristics. Curing agents that are typically
used in epoxy systems are amines and anhydrides. Table 2 highlights the advantageous
properties of epoxies showing low shrinkage [3] during cure. This reduces the internal
stresses and ensures the retention of dimensional tolerance after processing. The other
advantages of epoxies include high electrical insulation, good chemical resistance, adhesive
strength, mechanical properties and pot-life [3].
4.1.4 Interface
The interface is the region between the fibres and the matrix. It is difficult to access the
interface region using analytical techniques because it is generally said to be in the region of
2-10 nm. However, the region of the interface is known to have significant bearing on the
properties of the fibre reinforced composite [7].
11
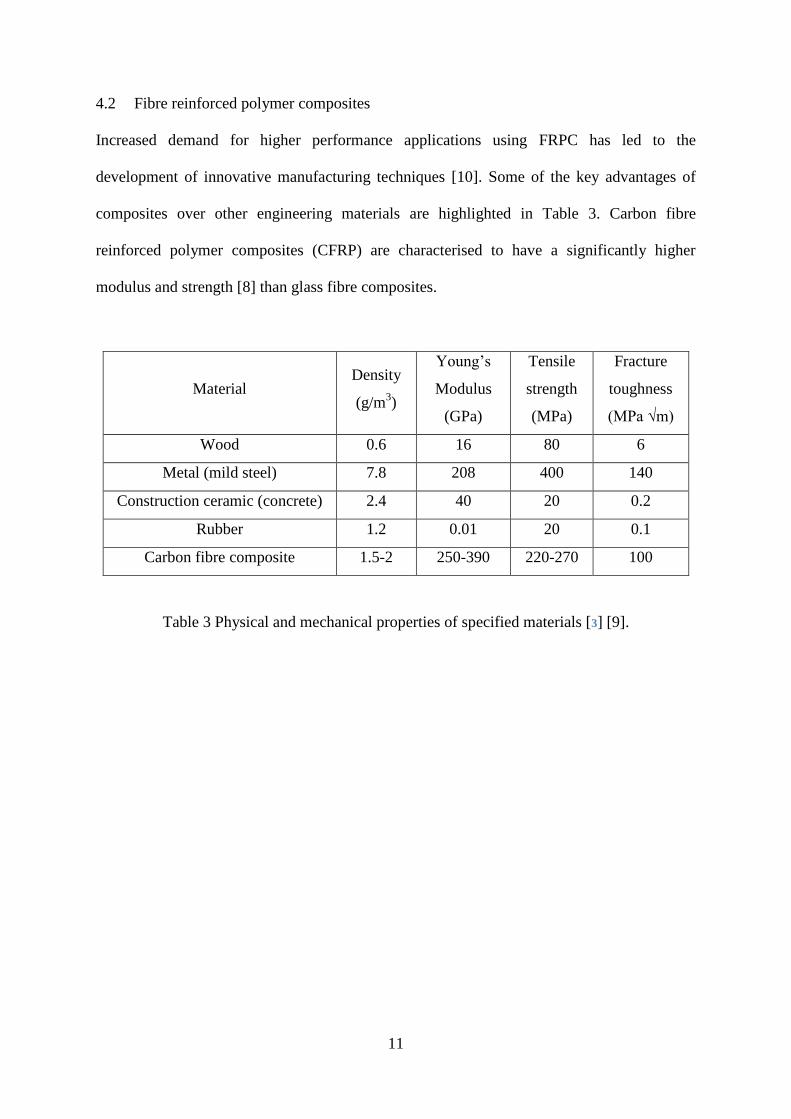
4.2 Fibre reinforced polymer composites
Increased demand for higher performance applications using FRPC has led to the
development of innovative manufacturing techniques [10]. Some of the key advantages of
composites over other engineering materials are highlighted in Table 3. Carbon fibre
reinforced polymer composites (CFRP) are characterised to have a significantly higher
modulus and strength [8] than glass fibre composites.
Material Density
(g/m3)
Young’s
Modulus
(GPa)
Tensile
strength
(MPa)
Fracture
toughness
(MPa √m)
Wood 0.6 16 80 6
Metal (mild steel) 7.8 208 400 140
Construction ceramic (concrete) 2.4 40 20 0.2
Rubber 1.2 0.01 20 0.1
Carbon fibre composite 1.5-2 250-390 220-270 100
Table 3 Physical and mechanical properties of specified materials [3] [9].

12
Depending on the component, it can be a challenge for manufacturing methods to meet the
required specifications, fibre distribution, production costs, mirco-structural quality and
surface-finish. The processing routes must be adapted in order to achieve the most desirable
physical and mechanical properties [10]. There are three common manufacturing techniques
used in producing impregnated continuous fibre composites, with many variations and
patented techniques. The following section presents a review of selected manufacturing
techniques for fibre reinforced polymer composites:
(i) Pultrusion
The process of pultrusion involves continuous pulling of fibres through a resin bath and then
into a heated mould, sees Figure 1. The increased temperature inside the mould cures the
matrix with the end product showing a constant cross-section structural shape this can be then
cut to the desired length.
Figure 1 A schematic illustration of a typical pultrusion resin-injection die impregnation [10]
13
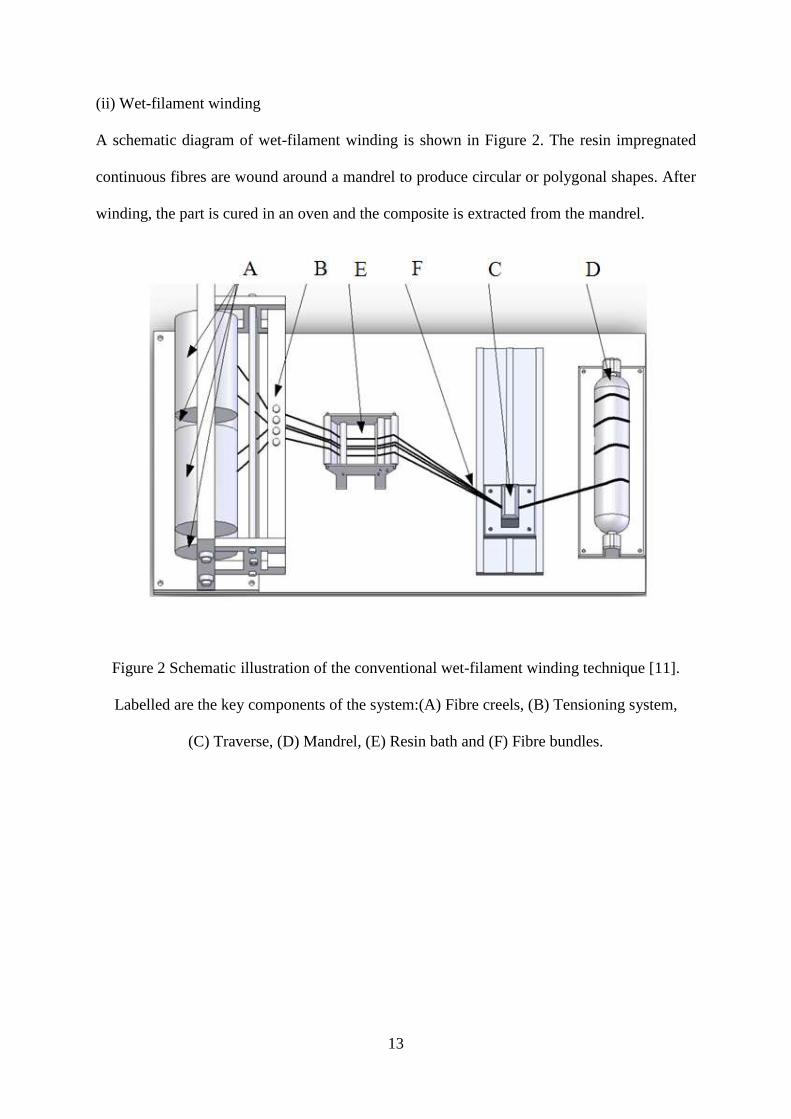
(ii) Wet-filament winding
A schematic diagram of wet-filament winding is shown in Figure 2. The resin impregnated
continuous fibres are wound around a mandrel to produce circular or polygonal shapes. After
winding, the part is cured in an oven and the composite is extracted from the mandrel.
Figure 2 Schematic illustration of the conventional wet-filament winding technique [11].
Labelled are the key components of the system:(A) Fibre creels, (B) Tensioning system,
(C) Traverse, (D) Mandrel, (E) Resin bath and (F) Fibre bundles.

14
(iii) Hand-lay-up
In this manufacturing technique, the prepreg or fabric is laid manually on a mould surface,
where fabrics are used. The resin system is applied manually and rollers are used to aid the
impregnation process. The advantage of the hand- lay-up process is that different layers of
different fibre orientations can be made to the desired part thickness and shape [12] hence
offering more isotropic properties. A schematic illustration of the reinforcing layers on a
mould with a gel coat is shown in Figure 3. After laminating the preform it is cured in an
autoclave. The schematic of the autoclave is shown in Figure 4 illustrates the set-up of parts
prior to cure using a combination of heat, pressure and vacuum. The vacuum removes air and
volatile components while the part is consolidated; heat and pressure are applied for curing.
Rollers are used to aid the impregnation of the fabrics and also to consolidate the laminated
layers.
Figure 3 A schematic illustration of the hand lay-up process [12].

15
Figure 4 A schematic illustration of a vacuum bagged part place in an autoclave for cure [12].
4.2.1 Matrix cracking
Matrix cracking is localised and generally the initial failure mode and if severe enough can
lead to delamination of the plies and eventual failure of the laminate. The energy required for
matrix cracking is relatively low, for a brittle carbon / epoxy composite the energy needed
could be as low as 0.4 J [13].
4.2.2 Fibre fracture
With reference to short-fibre composites, fibre-ends are common damage initiation sites due
to the large stress concentrations [14]. A study by Choi and Takahashi (1992) [25] found it is
more logical to consider the tensile strength to be a function of the total number of fibre ends
within a sample volume, rather than to consider it to be a function of fibre length. The
increase in strain of a composite leads to more cracks progressively forming at the ends of
any shorter and/or more misaligned fibres.
16
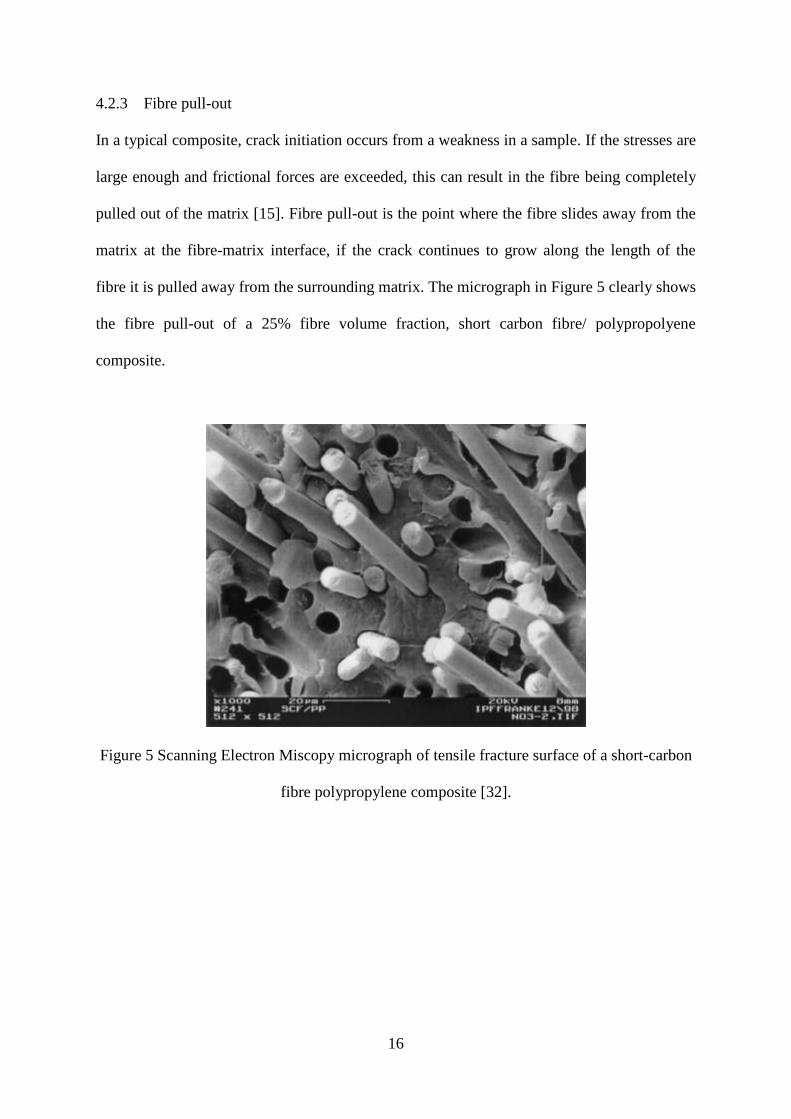
4.2.3 Fibre pull-out
In a typical composite, crack initiation occurs from a weakness in a sample. If the stresses are
large enough and frictional forces are exceeded, this can result in the fibre being completely
pulled out of the matrix [15]. Fibre pull-out is the point where the fibre slides away from the
matrix at the fibre-matrix interface, if the crack continues to grow along the length of the
fibre it is pulled away from the surrounding matrix. The micrograph in Figure 5 clearly shows
the fibre pull-out of a 25% fibre volume fraction, short carbon fibre/ polypropolyene
composite.
Figure 5 Scanning Electron Miscopy micrograph of tensile fracture surface of a short-carbon
fibre polypropylene composite [32].

17
After the crack propagates through the fibres, the energy release rate in the specimen is
higher than the fracture toughness causing an unstable ‘crack jump’, until the elastic energy
in the specimen is released to a new fibre that stops the crack. The new fibre stabilises crack
propagation, and the fracture toughness increases again. The sequence of stable vs. unstable
propagation is repeated as the crack grows. It has been shown that initially this cracking can
be accommodated by load transfer to adjacent fibres which "bridge" the cracked region. Final
failure occurs when the extent of cracking across the weakest section reaches a critical level
and the matrix can no longer support the increasing load [25]. Choi and Takahashi (1992)
further calculate the tensile failure of short-fibre composites of the stress difference between
the interior and the surface of samples. The stress values found in the interior are
considerably larger than those on the surface. The failure mechanisms reported that tensile
cracks were likely to be formed at the fibre ends of the specimen surface with the cracks
growing into the matrix.
4.2.4 Delamination
Delaminations in FRPC are commonly caused by defects introduced during manufacture or
impact damage. Dependant on the initiation point of delamination within a material there can
be two modes of delamination. If the initiation point is near to the surface of the sample, local
delamination can occur, where plies above and below the initiation point split. Global
delamination is a caused by internal delamination where plies move in the same direction, if
the composite is under compression loading this can result in the composite buckling [15].

18
4.2.5 Fatigue
Short-fibres offer a potential advantage in terms of fatigue behaviour because they are able to
retard crack propagation, by the fibre ends acting as crack arrestors or they divert the crack in
a different direction. Curtis et al., (1978) [16] used injection moulded samples of short-fibre
reinforced polyamide-6 to find the effect of fibre length on material properties and failure
characteristics. The level of reinforcement is increased by using a high fibre volume fraction.
The test specimens with longer fibres showed greater fibre alignment in the loading direction.
These factors lead to higher strength but this is limited by a reduction in failure strain, which
appears to follow an inverse relationship to any increase in fibres. Final failure of the samples
occurred from an accumulation of cracks in critical cross-sections. This ‘weak’ area of the
material showed that fibres which bridge that section are unable to continue to support the
load and fracture [16].
4.3 Short-fibre composites
The use of short-fibre composites have steadily increased, where material cost in the U.S.A
have passed $4.3 billion in 2008 [17] for applications from high-performance automotive
components to consumer goods. Short-fibre reinforced polymer composites are very
attractive over continuous fibre composites in the following areas [23]: (i) lower fabrication
costs; (ii) greater feasibility for mass production; (iii) reduced cycle times; (iv) yield
mechanical properties (such as stiffness) to continuous fibre composites; (v) simplistic
fabrication of complex parts; (vi) better scales of economy, and (vii) drapability over
complex shapes [18].

19
4.3.1 Mechanical properties
Mechanical properties of composites depend on variables such as: fibre types, fibre lengths,
orientations and architecture. Short-fibre composites are typically used for non-primary
applications due to lower mechanical properties which are achieved from these composites.
However short-fibre composites can approach levels similar to that of continuous fibre
composites if: fibre orientation and fibre length is controlled; significantly optimising these
critical factors as well as the fibre content and fibre to matrix adhesion [19].
When a load is applied to any composite, the forces at the fibre and matrix are relative to the
specified material. Equation 1 describes stresses carried by the fibre and matrix for an applied
stress to continuous fibre composites. This relationship is also known as ‘Rule of Mixtures’
[3].
fσm + (1- f) σf = σA Equation 1
where f is the fibre volume fraction, σm is the matrix stress, σf is the fibre stress, and σA is
the applied stress.
20
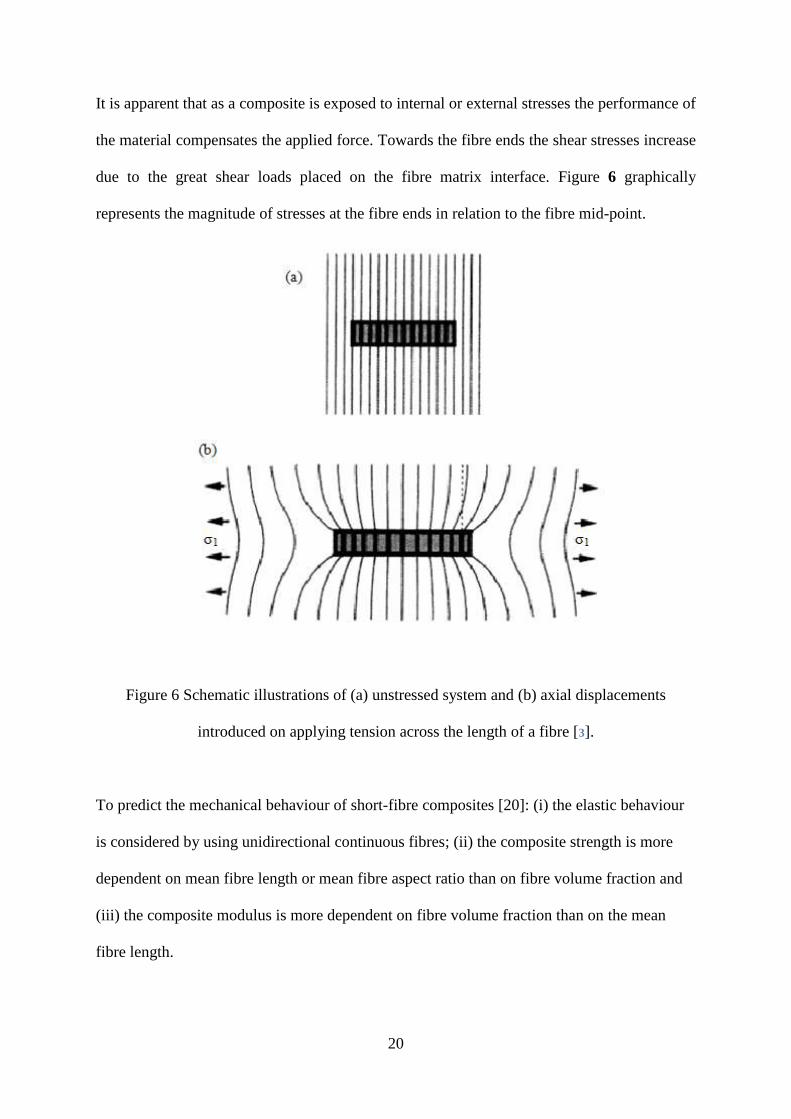
It is apparent that as a composite is exposed to internal or external stresses the performance of
the material compensates the applied force. Towards the fibre ends the shear stresses increase
due to the great shear loads placed on the fibre matrix interface. Figure 6 graphically
represents the magnitude of stresses at the fibre ends in relation to the fibre mid-point.
Figure 6 Schematic illustrations of (a) unstressed system and (b) axial displacements
introduced on applying tension across the length of a fibre [3].
To predict the mechanical behaviour of short-fibre composites [20]: (i) the elastic behaviour
is considered by using unidirectional continuous fibres; (ii) the composite strength is more
dependent on mean fibre length or mean fibre aspect ratio than on fibre volume fraction and
(iii) the composite modulus is more dependent on fibre volume fraction than on the mean
fibre length.
21
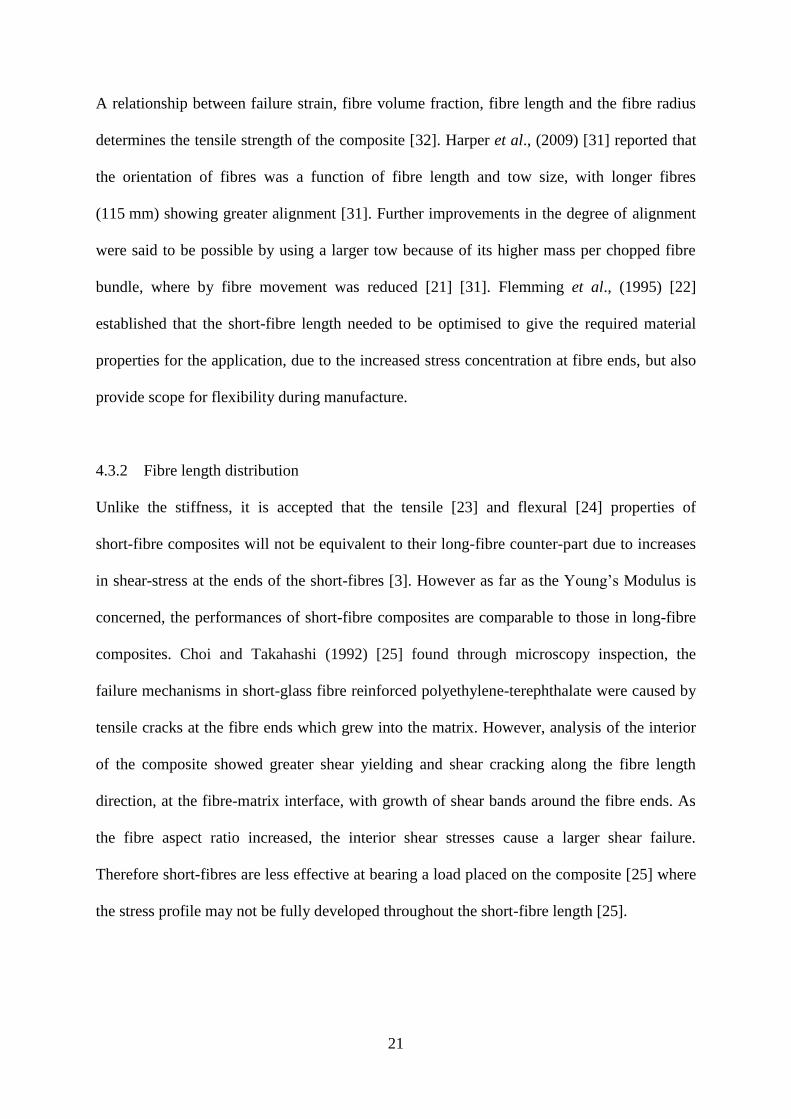
A relationship between failure strain, fibre volume fraction, fibre length and the fibre radius
determines the tensile strength of the composite [32]. Harper et al., (2009) [31] reported that
the orientation of fibres was a function of fibre length and tow size, with longer fibres
(115 mm) showing greater alignment [31]. Further improvements in the degree of alignment
were said to be possible by using a larger tow because of its higher mass per chopped fibre
bundle, where by fibre movement was reduced [21] [31]. Flemming et al., (1995) [22]
established that the short-fibre length needed to be optimised to give the required material
properties for the application, due to the increased stress concentration at fibre ends, but also
provide scope for flexibility during manufacture.
4.3.2 Fibre length distribution
Unlike the stiffness, it is accepted that the tensile [23] and flexural [24] properties of
short-fibre composites will not be equivalent to their long-fibre counter-part due to increases
in shear-stress at the ends of the short-fibres [3]. However as far as the Young’s Modulus is
concerned, the performances of short-fibre composites are comparable to those in long-fibre
composites. Choi and Takahashi (1992) [25] found through microscopy inspection, the
failure mechanisms in short-glass fibre reinforced polyethylene-terephthalate were caused by
tensile cracks at the fibre ends which grew into the matrix. However, analysis of the interior
of the composite showed greater shear yielding and shear cracking along the fibre length
direction, at the fibre-matrix interface, with growth of shear bands around the fibre ends. As
the fibre aspect ratio increased, the interior shear stresses cause a larger shear failure.
Therefore short-fibres are less effective at bearing a load placed on the composite [25] where
the stress profile may not be fully developed throughout the short-fibre length [25].

22
Short-fibre composite parts manufactured using spray lay-up, are generally cheaper and
quicker to manufacture than those containing continuous fibres, because of the
labour-intensive hand lay-up methods and production rates used to produce these composite
parts [46]. Tsuji et al., (1997) [26] investigated the drapability of uncured unidirectional
short-fibres and continuous fibres, where the drapability was defined as the tip deflections,
per minute, of a short-fibre reinforced composite cantilevered beam. The authors’ findings
indicate that uncured short-fibre composites increase the ability to be draped, so more
complex and varied shapes can be manufactured, but there is a decrease in longitudinal
modulus.
4.3.3 Fibre volume fraction
Short-fibre reinforced composites show an increase in the stiffness and strength properties
when compared to un-reinforced materials. Fu et al., (2000) [32] found that the greatest
mechanical property improvements are obtained with a fibre volume fraction of 25%, in an
aligned orientation, using fibres lengths greater than 800 µm.
The volume fraction that any strengthening effect of the fibres is observed is known as the
‘critical’ fibre volume fraction [27]. This value is used to describe the minimum volume
fraction that is necessary for the fibres to carry the applied load with a low proportion of the
stress applied to the matrix [3].
With reference to short-fibre composites, a high fibre volume fraction can have an adverse
influence the failure mode and is a key factor in determining the material
properties [28][31][32]. This problem can be overcome to some extent by increasing the fibre
length as it will reduce the number of fibre ends; a primary initiation site for failure [29].

23
4.3.4 Fibre alignment methods
Within the composite, the short-fibres can be orientated in a random or aligned fashion. It has
been reported that randomly orientated preforms offer high drapability [30] but present the
most variability in mechanical properties [31]. On the other hand, aligned fibre composites
are said to give consistently better mechanical properties [20][32][33]. Therefore, fibre
alignment is critical in order for short-fibre composites to exhibit mechanical properties that
approach those exhibited by continuous fibre composites.
In order to determine the degree of fibre alignment in a composite careful analysis with
respect to fibre position, orientation and distribution is essential. It is well-known that when
an inclined or off-axis fibre is viewed in the transverse plane, an elliptical image is seen
where the aspect ratio determines the angle, θ to the surface normal. The position of the
elliptical profile in relation to a reference axis can be used to determine the orientation of the
fibre. As seen in Figure 7, the two angles, θ and ø, specify the orientation of each fibre with
respect to the dominant y-axis. Where the z-axis for these materials is the main fibre direction
and θ is the angle between the projection of the fibre image in the x-y plane and the x axis.
These two angles; θ and ø, are all that is needed to describe the 3D special orientation of a
fibre [34].
Figure 7 Definition of the fibre angles θ and ø to the main fibre direction in the z-axis [35].
y
z
x
θ
ø

24
Figure 8 can be used to consider the elliptical shape and intersection method, to calculate the
misalignment angle ø, with respect to an aligned fibre in the vertical θ plane [35].
Micrographs of polished fibre-ends can be used to derive two-dimensional analysis to
calculate the fibre alignment [36]. A single section dimensional method may have drawbacks
if a wide orientation distribution of short-fibres is present [34]. However using the shape
intersection method (Equation 2) the fibre cross-section in Figure 8 can be used to determine
the misalignment angle ø:
ø = a cos (B/A) Equation 2
Figure 8 Schematic illustration to show off-axis and aligned fibres; (a) represents an off-axis
fibre with a misalignment angle ø, where θ is defined as the major axis; A is the major radius
and B is the minor radius of the ellipse, respectively; and (b) an aligned fibre in the θ plane
with 100% orientation at 90° to the horizontal plane.
A recent study by Harper et al., (2009) [31] investigated the levels of alignment that could be
achieved using a spray alignment technique, the mechanical properties that could be attained
from these composites was also investigated. It was reported that larger tow sizes tended to
prevent misalignment because they were less susceptible to ‘disturbances’. Smaller tow sizes
were reported to yield higher in-plane properties due to greater levels of fibre homogeneity
across the preform. This was said to reduce the magnitude of the stress raisers at the fibre
bundle ends. Thus it was claimed that a much higher ultimate strength could be
(a)
ø
A B (b)

25
achieved [31]. The authors showed that inducing fibre alignment could increase both the
tensile stiffness and tensile strength of the plaques when compared with random fibre
architectures; the tensile stiffness and strength increased by 206% and 234%, respectively.
This was apparent when there was a high concentration of aligned fibres (fibre aligned ±10˚)
in the loading direction. When compared to a continuous unidirectional composite the
maximum stiffness and strength retention obtained were 83% and 31% respectively. Aligned
short-fibre composites show similar or increased compressive mechanical properties, when
compared to continuous fibre composites, but fail to reach the same value of tensile strength
and stiffness, even at 100% orientation [31].
Although superior and more predictable properties can be achieved when using aligned
short-fibres as opposed to random short-fibres, there is a major problem with producing
composites with aligned short-fibres throughout the material and at even spacing. The
following section presents a brief review of the methods already attempted in previous
studies to align short-fibres. Current methods to align short-fibres include: hydrodynamics
[46], extrusion [37], electrostatics [38], magnetics [39], spray techniques [21], injection
moulding [40], compression moulding [41], converging flows [42], centrifugal force [43],
vibration [44] and vacuum drums [45].
4.3.4.1 Hydrodynamics
Fluid or hydrodynamic alignment techniques are used to create aligned short-fibre composite
parts. This works by suspending the fibres in a highly viscous liquid and alignment is
achieved by accelerating the mix of fibres and liquid through a converging nozzle. This
forces the fibres to follow the fluid streamlines. This technique is normally used in injection
moulding and extrusion. It was reported by Kacir et al., (1975) [42] that hydrodynamic
methods have the potential for aligning more than 90% of fibres in the range of +/-15.

26
Papathanasiou et al., (1997) [46] describe the theory behind fluid alignment. They stated that
the fibres in the fluid cause a difference in the velocity fields. The velocity on the surface of
the fibre, as it moves with the fluid, induces a mismatch and disturbs the surrounding fluid
which causes the fibres to rotate. The thinner the fibre, the smaller the velocity mismatch so
the fibre rotates slower out of the aligned orientation. A fibre with a high-aspect- ratio was
said to be slow to leave an aligned orientation but quick to realign itself once it drifted out of
alignment. Therefore fibres with a high-aspect-ratio will be easier to align in a preform,
because they spend a large amount of time aligned within the flow, where most of the fibres
align themselves along stream lines [46]. The degree of alignment is also thought to be a
function of fibre length, with shorter fibres being easier to align in the shear flow of the fluid.
Guell and Graham (1996) [47] investigated fibre alignment using hydrodynamics. A plastic
rod (0.16 cm diameter) was passed numerous times in a single direction to achieve fibre
alignment of chopped and milled carbon fibres in an epoxy resin system. They reported that
the simple motion of the rod being manoeuvred through the slurry was sufficient to induce
the fibres into an aligned orientation. Aligning the short-carbon fibres resulted in 90% higher
stiffness and an increase of 100% to tensile strength, when compared to randomly orientated
fibre composites. These results were in agreement with the predictions acquired from a
computer model developed using boundary element computational analysis [46]. In addition,
Guell and Graham [47] found the alignment of fibres had a smaller effect on the ultimate
strain than the randomly aligned fibres suggesting the aligned fibres exhibit linear
stress-strain behaviour right up to fracture. These findings showed the ‘aligned’ samples had
a higher tensile strength and a modulus whilst the ultimate strain was lower.

27
Fara and Pavan (2004) [48] studied the effects of fibre orientation on the fracture of
short-fibre composites, they found that that matrix fracture and fibre de-bonding were a result
of low values of fibre orientation while fibre breakage and fibre pull-out were observed in
highly orientated composites.
4.3.4.2 Extrusion
Calverty et al., (1997) [49] investigated the effect of using extrusion freeform as a method to
produce composite structures. The short-fibre carbon composites were manufactured using a
syringe and a hot-plate to assist in the curing. It was found that as the length of the fibres
increase from 85 µm to 220 µm, an increase in the modulus of 4.0 GPa to 5.3 GPa occurred
respectively. It reiterates the relationship that longer fibres show a significant improvement to
the mechanical properties [21] such as there is an increase of the modulus, decrease of yield
strain while no significant relationship was apparent with the yield stress.
A study by Sanomura and Kawamura (2003) [50] examined the fibre orientation distribution,
fibre length and Young’s Modulus of extruded short-fibre reinforced polypropylene where
the stiffness was predicted using the model by Cox, Fukuda and Kawada [51]. The authors
showed that more fibres could align parallel to the extrusion direction by increasing the
extrusion ratio. The orientation of extruded fibres was almost uniform throughout the section
showing that the control of fibre orientation can be easily achieved by means of ram
extrusion. The high fibre orientation caused a greater stiffness which could be improved with
increasing the extrusion ratio.
28
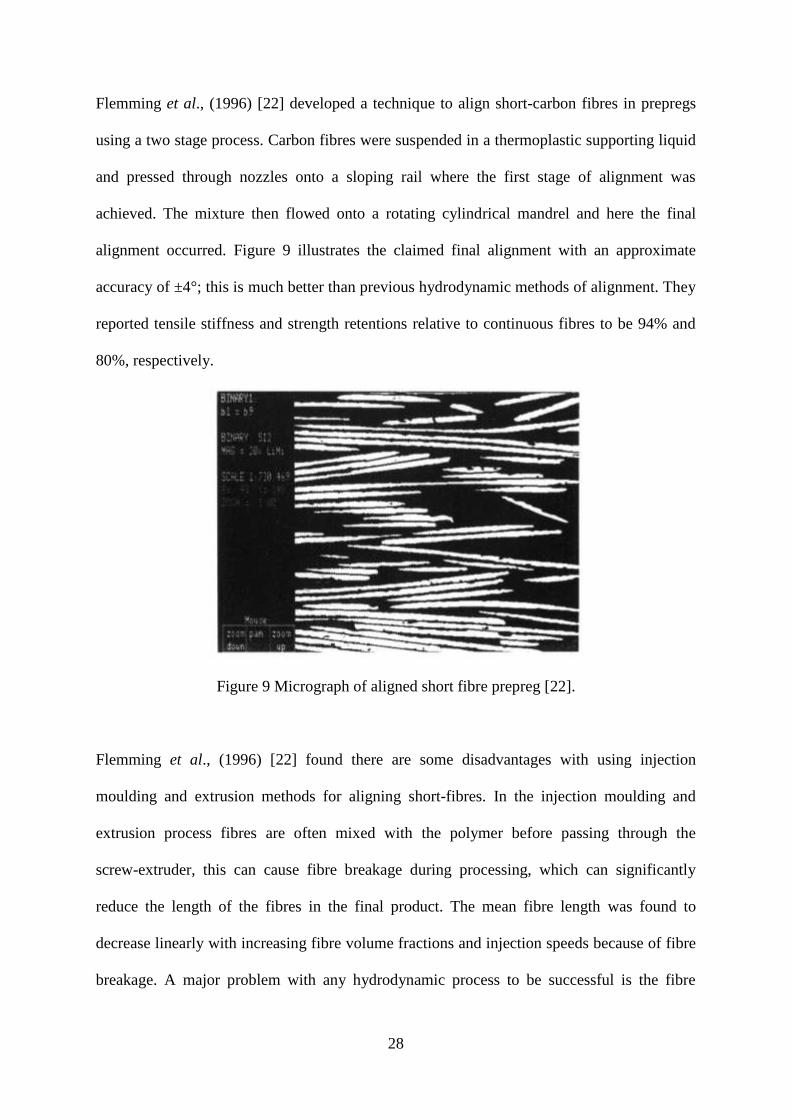
Flemming et al., (1996) [22] developed a technique to align short-carbon fibres in prepregs
using a two stage process. Carbon fibres were suspended in a thermoplastic supporting liquid
and pressed through nozzles onto a sloping rail where the first stage of alignment was
achieved. The mixture then flowed onto a rotating cylindrical mandrel and here the final
alignment occurred. Figure 9 illustrates the claimed final alignment with an approximate
accuracy of ±4°; this is much better than previous hydrodynamic methods of alignment. They
reported tensile stiffness and strength retentions relative to continuous fibres to be 94% and
80%, respectively.
Figure 9 Micrograph of aligned short fibre prepreg [22].
Flemming et al., (1996) [22] found there are some disadvantages with using injection
moulding and extrusion methods for aligning short-fibres. In the injection moulding and
extrusion process fibres are often mixed with the polymer before passing through the
screw-extruder, this can cause fibre breakage during processing, which can significantly
reduce the length of the fibres in the final product. The mean fibre length was found to
decrease linearly with increasing fibre volume fractions and injection speeds because of fibre
breakage. A major problem with any hydrodynamic process to be successful is the fibre
29
concentration must be very low and the fibres dispersed completely in the liquid to prevent
any blockages occurring at the injecting nozzle.
Peng et al., (1999) [52] used a slurry-based writing technique to produce aligned short-fibre
composites. They reported that it was possible to produce a short-fibre composite component
with a 90% degree of fibre alignment with a fibre volume fraction of 18%.
4.3.4.3 Electrostatics
Electric field-based methods rely on the fibre being conductive or this can be achieved by
applying coatings such as acidic salts. Electrodes positioned under a moving belt are used to
align the fibres in the direction of the electric field lines.
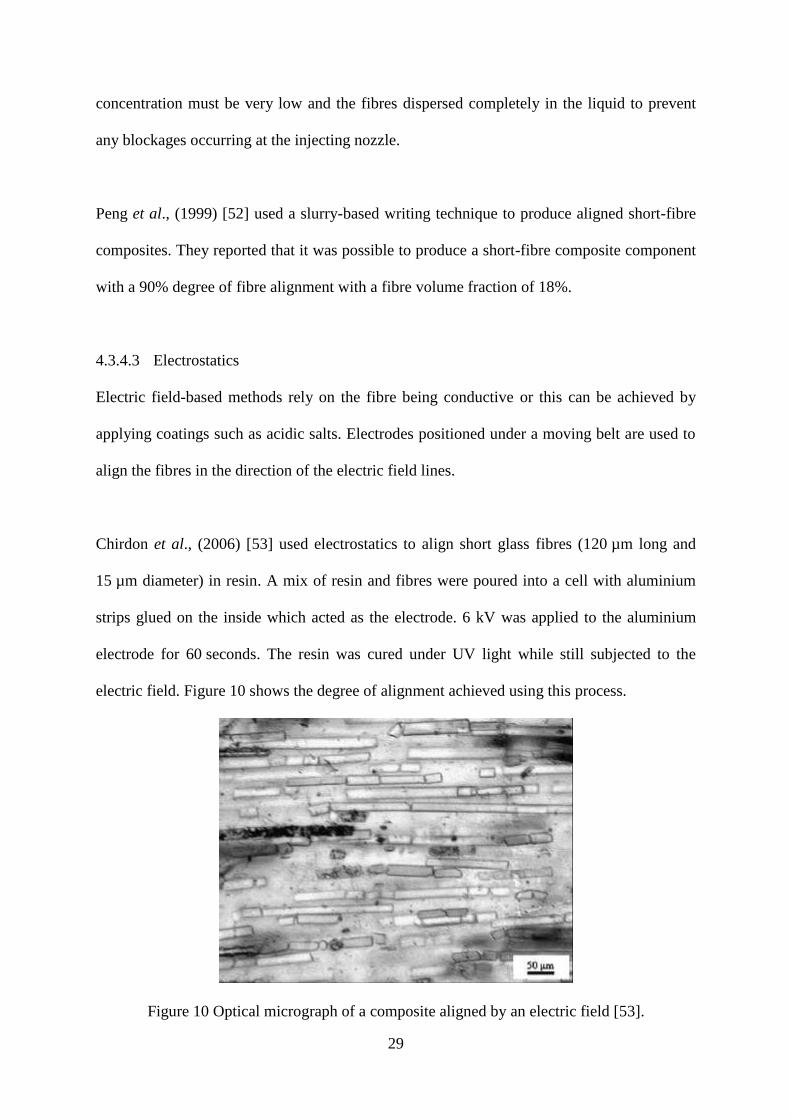
Chirdon et al., (2006) [53] used electrostatics to align short glass fibres (120 µm long and
15 µm diameter) in resin. A mix of resin and fibres were poured into a cell with aluminium
strips glued on the inside which acted as the electrode. 6 kV was applied to the aluminium
electrode for 60 seconds. The resin was cured under UV light while still subjected to the
electric field. Figure 10 shows the degree of alignment achieved using this process.
Figure 10 Optical micrograph of a composite aligned by an electric field [53].
30
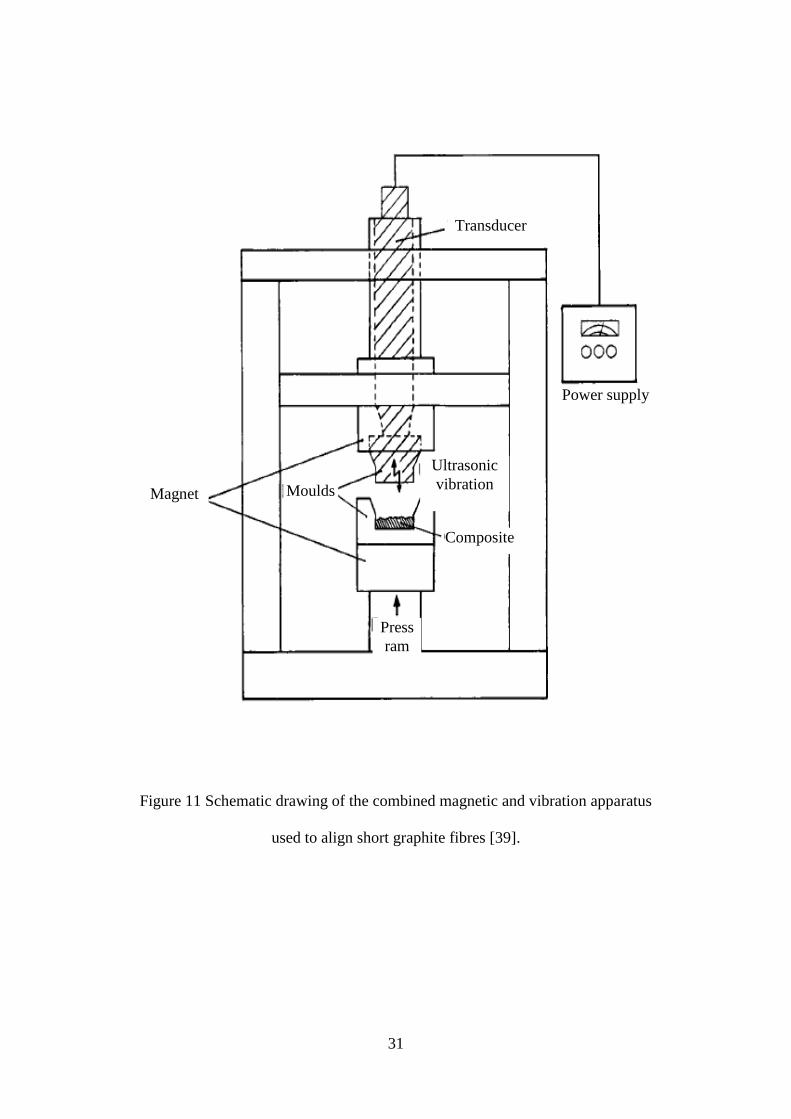
4.3.4.4 Magnetics
Yamashita et al., (1989) [39] used a magnetic field to achieve alignment of nickel coated
short-graphite fibres in an unsaturated polyester resin. In particular they determine the critical
fibre volume and looked at the effect the fibre volume fraction had on the control over the
orientation of fibres. Their findings showed that the fibre orientation could be controlled if
fibres were coated uniformly with a thin ferromagnetic material. It was demonstrated the
critical fibre volume fraction increases rapidly with a decrease in the fibre-aspect-ratio, but
once the fibre volume is too high the fibre movement becomes limited due to the interaction
of the fibres. It is important for a high strength composite that the aspect ratio of the fibres is
high. Therefore they introduced ultrasonic vibrations to the fibres with the magnetic
alignment; see Figure 11. The authors found that the fibres would detangle making alignment
much easier, so increasing the fibre volume fraction. This experiment focused on the
through-thickness alignment of particles and therefore control of fibre orientation for large
components will need further investigation.
31
Figure 11 Schematic drawing of the combined magnetic and vibration apparatus
used to align short graphite fibres [39].
Magnet Moulds
Power supply
Transducer
Press
ram
Composite
Ultrasonic
vibration
32
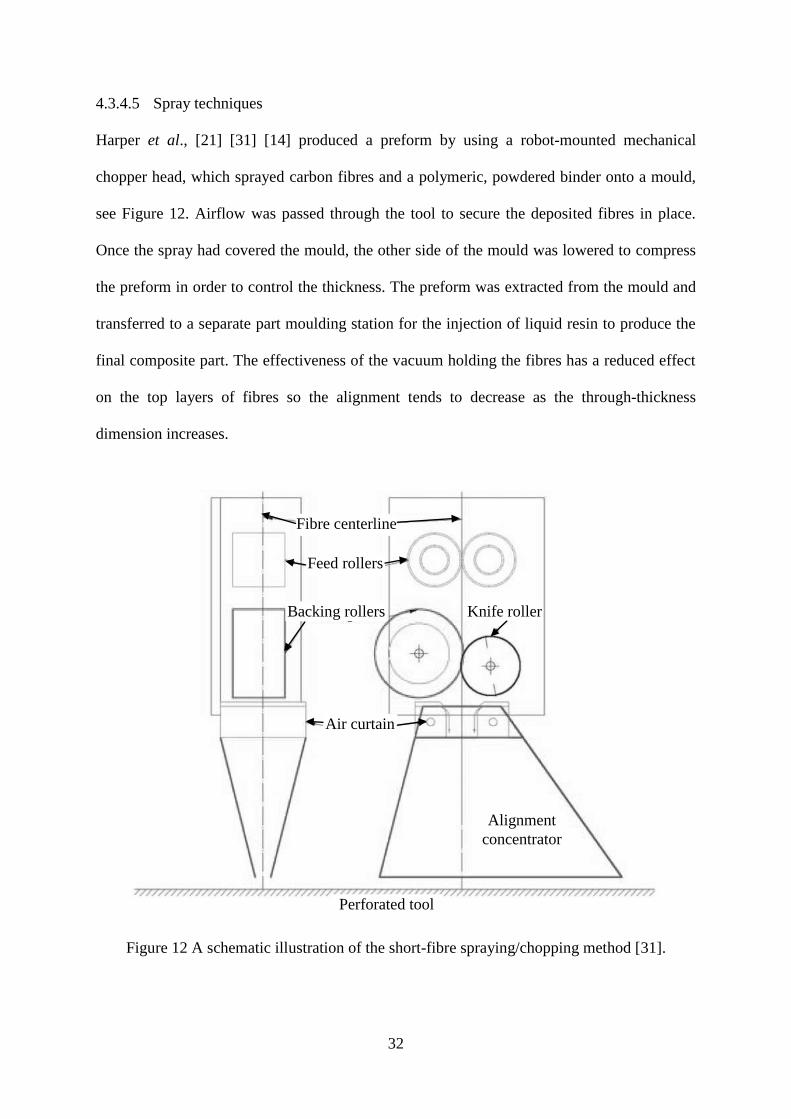
4.3.4.5 Spray techniques
Harper et al., [21] [31] [14] produced a preform by using a robot-mounted mechanical
chopper head, which sprayed carbon fibres and a polymeric, powdered binder onto a mould,
see Figure 12. Airflow was passed through the tool to secure the deposited fibres in place.
Once the spray had covered the mould, the other side of the mould was lowered to compress
the preform in order to control the thickness. The preform was extracted from the mould and
transferred to a separate part moulding station for the injection of liquid resin to produce the
final composite part. The effectiveness of the vacuum holding the fibres has a reduced effect
on the top layers of fibres so the alignment tends to decrease as the through-thickness
dimension increases.
Figure 12 A schematic illustration of the short-fibre spraying/chopping method [31].
Fibre centerline
Feed rollers
Backing rollers Knife roller
Air curtain
Alignment
concentrator
Perforated tool

33
4.3.4.5.1 Mechanical properties of aligned short-fibre composites
Over the past 40 years detailed research into the manufacture of aligned short-fibre
composites has seen huge improvements to the quality, control and versatility of such
techniques. It is clear that the methods available are effective at producing short-fibre
composites with some fibre alignment. Table 4 summarises different short-fibre alignment
techniques accompanied by their physical and mechanical properties. The comparison
between manufacturing processes shows the interaction between fibre length and fibre
material, and the impact they have on the material properties.

34
Author Year
Fibre type:
CF- Carbon
GF-Glass
Manufacturing process
Young's
Modulus
(GPa)
Tensile
strength
(GPa)
Failure
strain
(%)
Fibre volume
fraction (%)
Fibre
length
(mm)
Dodworth [54] 2009 CF 6K tow Spray deposition and
compression - 0.60 - 50 37
Harper et al., [21] 2008
CF 24K tow
Directed preforms-
spray technique
36.9 0.13 - 31.7 28.5
CF 24K tow 62.8 0.31 - 33.8 115.5
CF 6K tow 33 0.25 - 33 28.5
CF 6K tow 36.6 0.46 - 36.6 115.5
Turner et al., [55] 2007 CF Hydrodynamics 13 0.16 - 30 to 60 12
Hassan et al., [56] 2004 GF Injection moulded 1.25 0.0012 0.74 23 12
Fu et al., [32] 2000 GF Extrusion compounding
and injection moulding
8.8 0.05 1.2 25 0.15-0.3
CF 15 0.059 0.5 25 0.15-0.4
Calverty et al., [49] 1997
CF
Extrusion
4 0.07 1.8 15* 0.085
CF 5.3 0.076 1.5 15* 0.22
CF 5.9 0.062 1.1 20* 0.085
CF 7.5 0.064 0.9 20* 0.22
Guell and Graham [47] 1996 CF Hydrodyamics 5.82 0.0017 0.38 0.17 0.015
Flemming et al., [22] 1995 CF Fluid flow 10 1.1 - 50 3
*weight fraction
Table 4 A table summarising the physical and mechanical properties of short-fibre alignment techniques.
35
5 Experimental
5.1 Materials
5.1.1 Reinforcements
E-glass fibres and carbon fibres were used as the reinforcement materials in the production of
continuous fibre and short-fibre composites.
Four different fibres were used for the production of continuous fibre composites: (i) carbon
fibre T700 (Toray); (ii.) out-of-shelf-life pre-impregnated carbon fibre*; (iii) E-glass fibres
(PPG Industries) 1200 TEX**; and (iv) E-glass fibres (PPG Industries) 2400 TEX.
*Confidential
**TEX is the mass, in grams, of 1 km of fibre strand.
E-glass fibres 1200 TEX and carbon fibre T700 were the selected materials to manufacture
into short-fibre composites using the fibre chopper system.
5.1.2 Matrix
The matrix material for the composites manufactured in this study was HexPly 913, an epoxy
resin system with a low-temperature cure cycle, supplied by Hexcel. Manufacturer’s reported
that the material had a tensile yield strength of 65.5 MPa and a tensile modulus of 3.39 GPa.
36
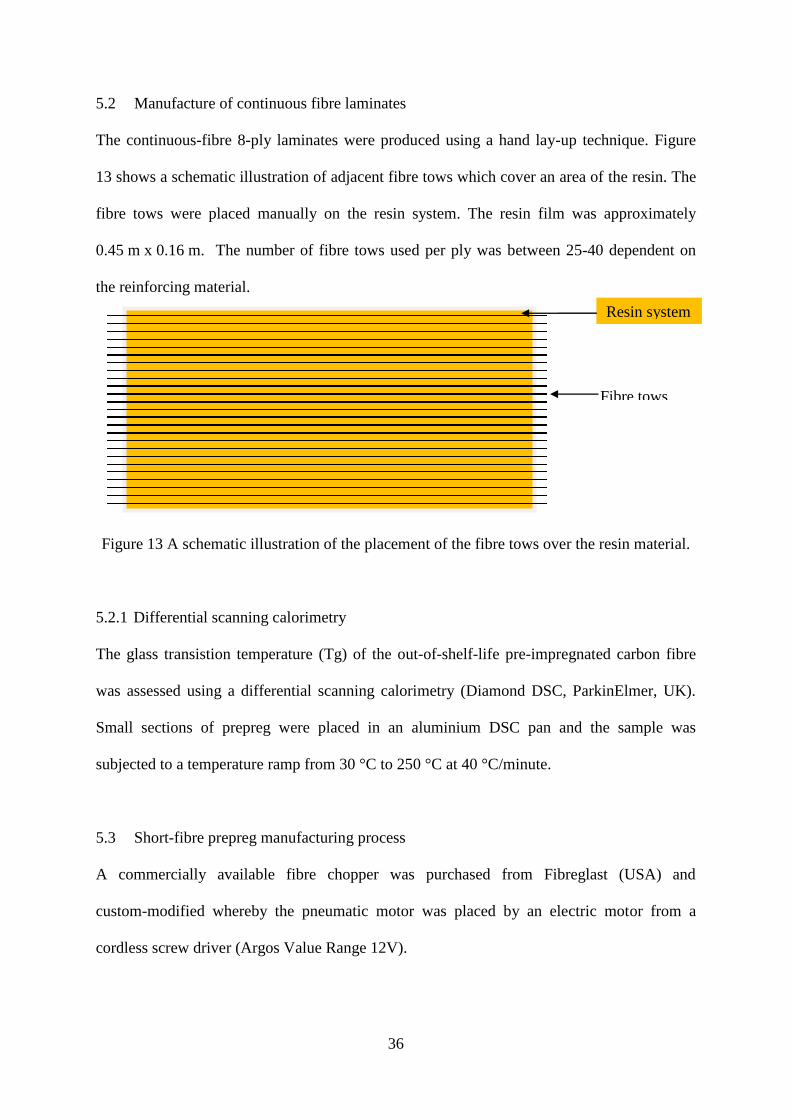
5.2 Manufacture of continuous fibre laminates
The continuous-fibre 8-ply laminates were produced using a hand lay-up technique. Figure
13 shows a schematic illustration of adjacent fibre tows which cover an area of the resin. The
fibre tows were placed manually on the resin system. The resin film was approximately
0.45 m x 0.16 m. The number of fibre tows used per ply was between 25-40 dependent on
the reinforcing material.
Figure 13 A schematic illustration of the placement of the fibre tows over the resin material.
5.2.1 Differential scanning calorimetry
The glass transistion temperature (Tg) of the out-of-shelf-life pre-impregnated carbon fibre
was assessed using a differential scanning calorimetry (Diamond DSC, ParkinElmer, UK).
Small sections of prepreg were placed in an aluminium DSC pan and the sample was
subjected to a temperature ramp from 30 °C to 250 °C at 40 °C/minute.
5.3 Short-fibre prepreg manufacturing process
A commercially available fibre chopper was purchased from Fibreglast (USA) and
custom-modified whereby the pneumatic motor was placed by an electric motor from a
cordless screw driver (Argos Value Range 12V).
Fibre tows
Resin system
37
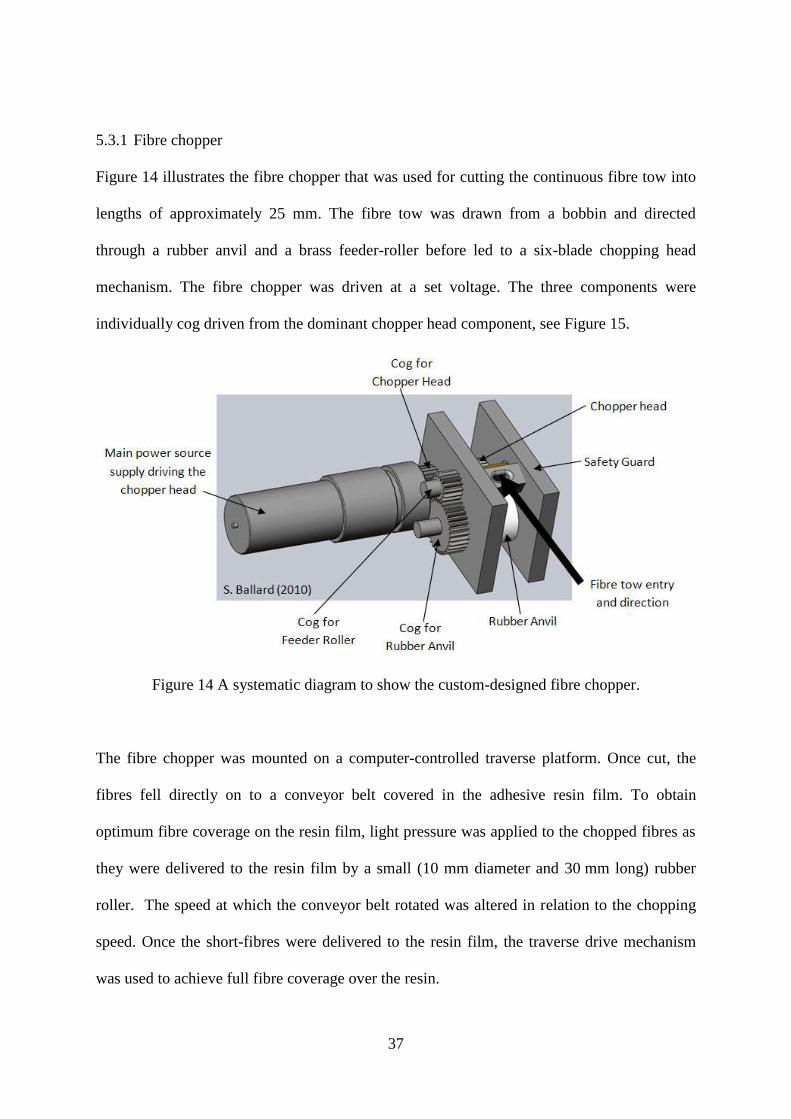
5.3.1 Fibre chopper
Figure 14 illustrates the fibre chopper that was used for cutting the continuous fibre tow into
lengths of approximately 25 mm. The fibre tow was drawn from a bobbin and directed
through a rubber anvil and a brass feeder-roller before led to a six-blade chopping head
mechanism. The fibre chopper was driven at a set voltage. The three components were
individually cog driven from the dominant chopper head component, see Figure 15.
Figure 14 A systematic diagram to show the custom-designed fibre chopper.
The fibre chopper was mounted on a computer-controlled traverse platform. Once cut, the
fibres fell directly on to a conveyor belt covered in the adhesive resin film. To obtain
optimum fibre coverage on the resin film, light pressure was applied to the chopped fibres as
they were delivered to the resin film by a small (10 mm diameter and 30 mm long) rubber
roller. The speed at which the conveyor belt rotated was altered in relation to the chopping
speed. Once the short-fibres were delivered to the resin film, the traverse drive mechanism
was used to achieve full fibre coverage over the resin.
38
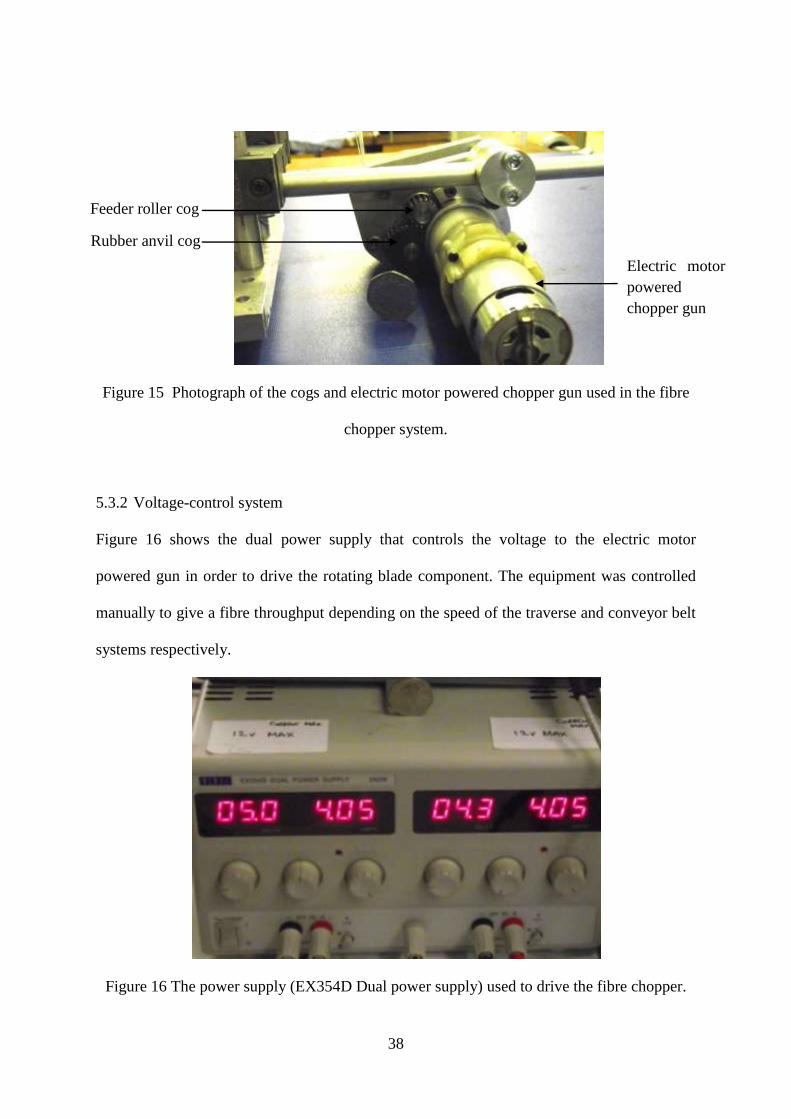
Figure 15 Photograph of the cogs and electric motor powered chopper gun used in the fibre
chopper system.
5.3.2 Voltage-control system
Figure 16 shows the dual power supply that controls the voltage to the electric motor
powered gun in order to drive the rotating blade component. The equipment was controlled
manually to give a fibre throughput depending on the speed of the traverse and conveyor belt
systems respectively.
Figure 16 The power supply (EX354D Dual power supply) used to drive the fibre chopper.
Feeder roller cog
Rubber anvil cog
Electric motor
powered
chopper gun

39
5.3.3 Conveyor belt
A 1.6 m long and 0.45 m wide polyurethane belt was purchased from Conveyor Lines Ltd.
The schematic illustration of the conveyor belt system in Figure 17 shows the basic set-up of
two Perspex rollers to aid in a uniform rotation of the belt.
Figure 17 A schematic illustration of the conveyor belt system using two rollers and a
polyurethane belt.
The conveyor belt speed was controlled using a dial setting from an EX354D Dual power
supply. This could be adjusted from 0 to 99.9 arbitrary units, where higher values increase the
speed of the belt. The static charge created by the rotation of the belt inhibited fibre
alignment; therefore the fibre chopper was earthed using appropriate materials and
connections.
Polyurethane
belt
Rollers
40
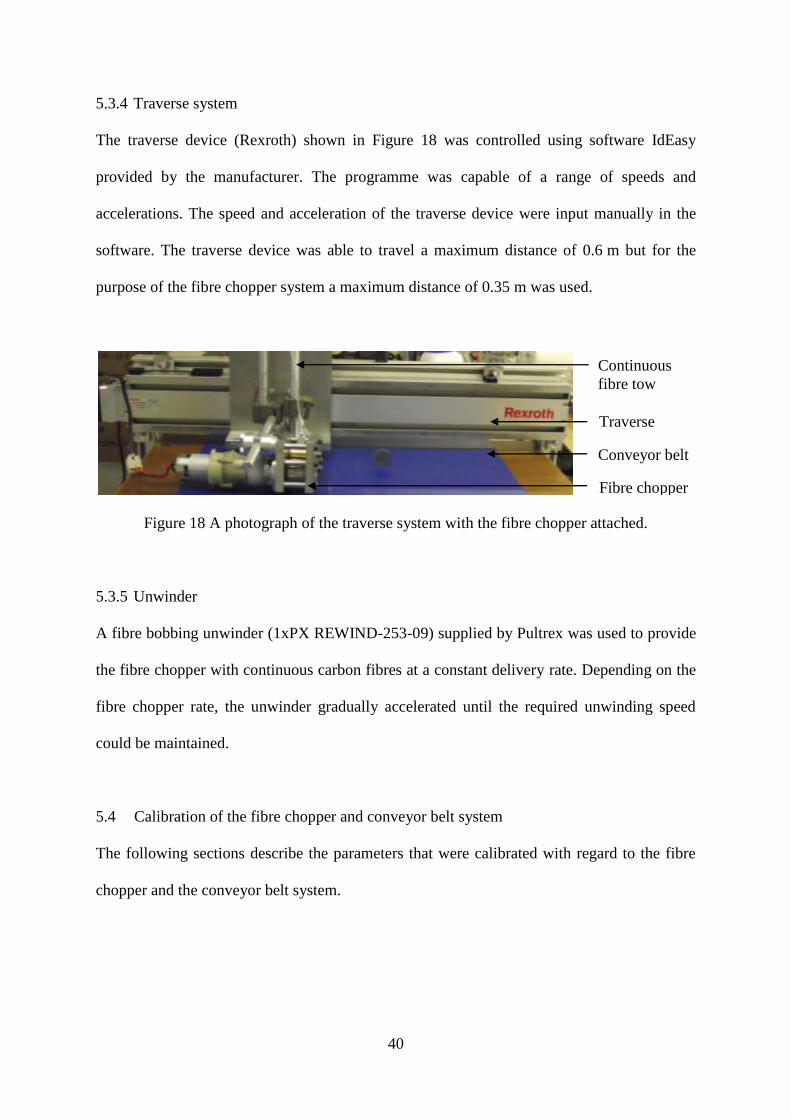
5.3.4 Traverse system
The traverse device (Rexroth) shown in Figure 18 was controlled using software IdEasy
provided by the manufacturer. The programme was capable of a range of speeds and
accelerations. The speed and acceleration of the traverse device were input manually in the
software. The traverse device was able to travel a maximum distance of 0.6 m but for the
purpose of the fibre chopper system a maximum distance of 0.35 m was used.
Figure 18 A photograph of the traverse system with the fibre chopper attached.
5.3.5 Unwinder
A fibre bobbing unwinder (1xPX REWIND-253-09) supplied by Pultrex was used to provide
the fibre chopper with continuous carbon fibres at a constant delivery rate. Depending on the
fibre chopper rate, the unwinder gradually accelerated until the required unwinding speed
could be maintained.
5.4 Calibration of the fibre chopper and conveyor belt system
The following sections describe the parameters that were calibrated with regard to the fibre
chopper and the conveyor belt system.
Traverse
Conveyor belt
Fibre chopper
Continuous
fibre tow
41
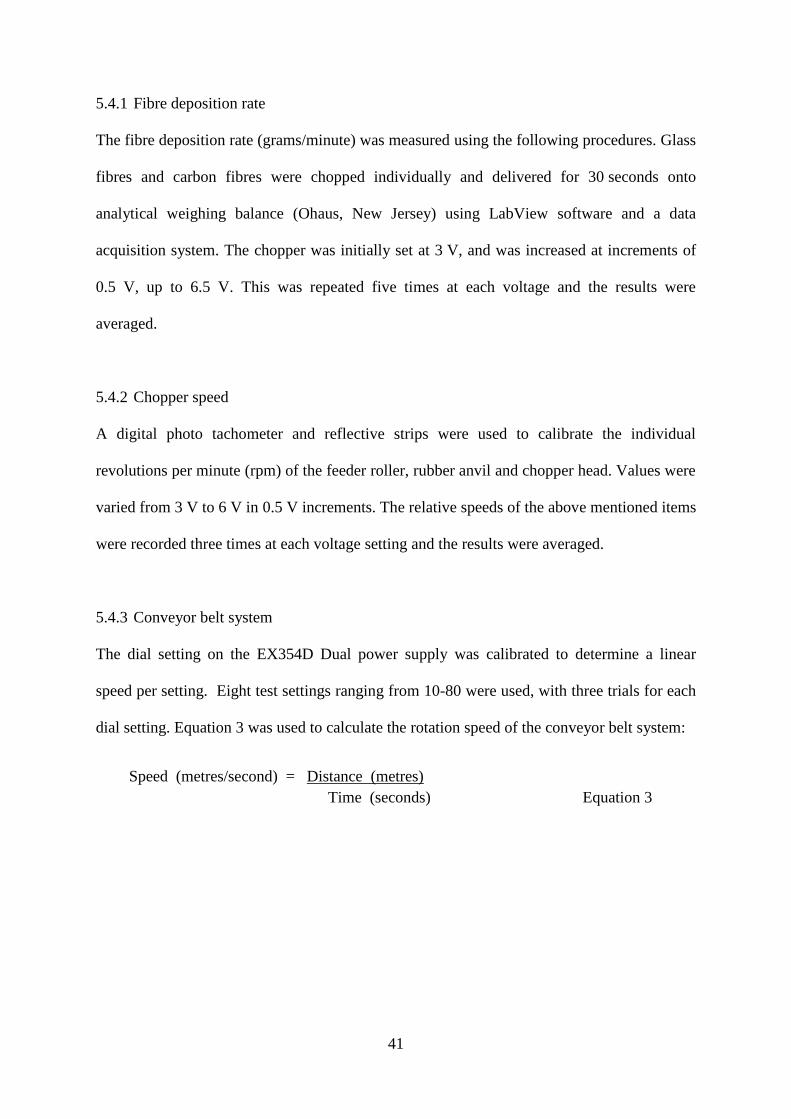
5.4.1 Fibre deposition rate
The fibre deposition rate (grams/minute) was measured using the following procedures. Glass
fibres and carbon fibres were chopped individually and delivered for 30 seconds onto
analytical weighing balance (Ohaus, New Jersey) using LabView software and a data
acquisition system. The chopper was initially set at 3 V, and was increased at increments of
0.5 V, up to 6.5 V. This was repeated five times at each voltage and the results were
averaged.
5.4.2 Chopper speed
A digital photo tachometer and reflective strips were used to calibrate the individual
revolutions per minute (rpm) of the feeder roller, rubber anvil and chopper head. Values were
varied from 3 V to 6 V in 0.5 V increments. The relative speeds of the above mentioned items
were recorded three times at each voltage setting and the results were averaged.
5.4.3 Conveyor belt system
The dial setting on the EX354D Dual power supply was calibrated to determine a linear
speed per setting. Eight test settings ranging from 10-80 were used, with three trials for each
dial setting. Equation 3 was used to calculate the rotation speed of the conveyor belt system:
Speed (metres/second) = Distance (metres)
Time (seconds) Equation 3

42
5.4.4 Traverse system
The traverse system was calibrated to determine the accuracy of the traverse speed per
setting. Seven speeds from 1 mm/sec to 30 mm/sec were used and three trials were performed
per speed. Equation 3was used to calculate the speed over a 0.1 m section of the traverse
system.
5.4.5 Angle of the chopper head
The chopper head was adjusted to identify the optimal position to achieve maximum
alignment. The angle of the chopper head varied from 0° - 40° relative to the conveyor belt
where that delivery of short-fibres occurred. Visual inspection and a digital camera
positioned 30 cm from the conveyor belt were used to analyse the trajectory of fibres.
5.5 Short-fibre prepreg production
Two carbon fibre composites and two glass fibre (prepregs) laminates were produced using
the fibre chopper. From the calibration experiments, settings were determined to achieve
optimal coverage of aligned fibres. Eight equal sections were cut (165 mm x 400 mm) from
the prepreg to make the eight plies.
43
5.6 Composite manufacture
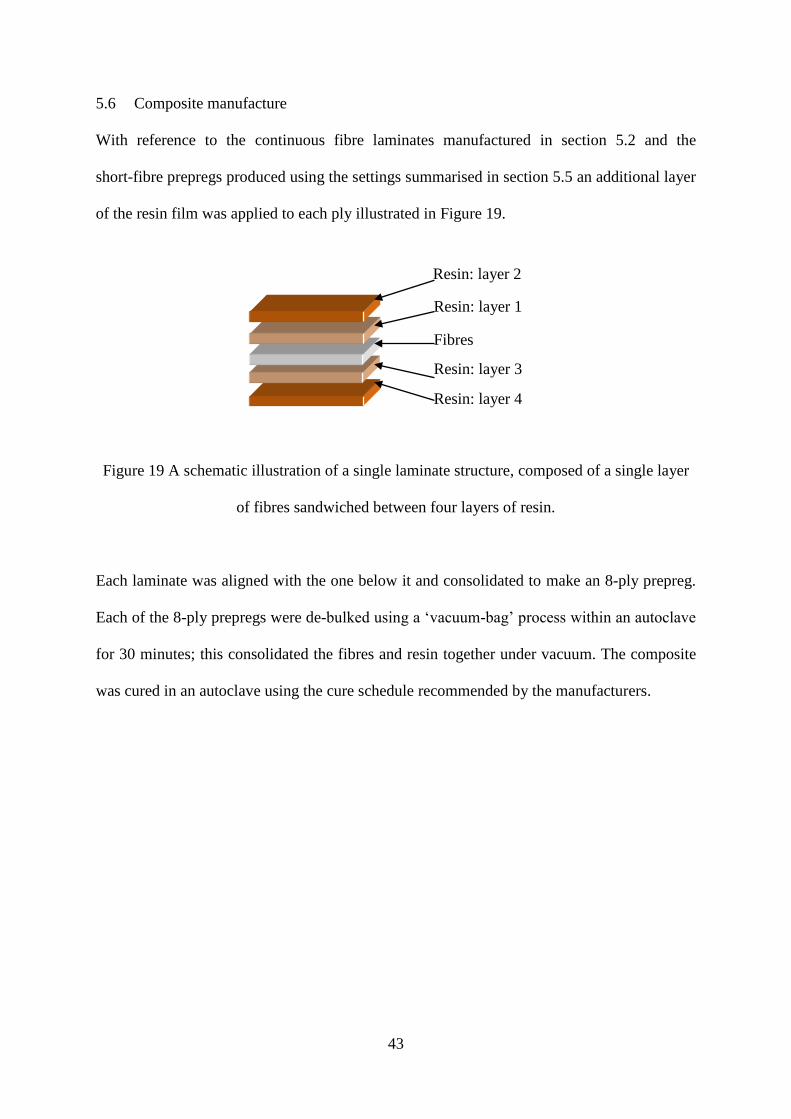
With reference to the continuous fibre laminates manufactured in section 5.2 and the
short-fibre prepregs produced using the settings summarised in section 5.5 an additional layer
of the resin film was applied to each ply illustrated in Figure 19.
Figure 19 A schematic illustration of a single laminate structure, composed of a single layer
of fibres sandwiched between four layers of resin.
Each laminate was aligned with the one below it and consolidated to make an 8-ply prepreg.
Each of the 8-ply prepregs were de-bulked using a ‘vacuum-bag’ process within an autoclave
for 30 minutes; this consolidated the fibres and resin together under vacuum. The composite
was cured in an autoclave using the cure schedule recommended by the manufacturers.
Resin: layer 2
Resin: layer 1
Fibres
Resin: layer 3
Resin: layer 4

44
5.6.1 Autoclave
The autoclave (Leeds and Bradford Boiler Company) used in the production of the
composites followed a set programme; detailed as followed in Table 5:
Table 5 A summary of the cure schedule for the production of composites.
Target
Temperature (°C)
Temperature ramp
rate (°C/min)
Duration at target
temperature (mins)
125 2.0 110
50 2.0 1
0 1.0 0
Target pressure
(bar)
Pressure ramp rate
(bar/min)
Duration at target
pressure (mins)
1.38 0.14 2
48.27 0.14 135
1 0.07 1

45
5.6.2 Short-fibre prepreg alignment
Short-carbon fibre and glass fibre prepregs (350 mm x 230 mm) manufactured using the fibre
chopper system were divided into six equal sections (100 mm x 100 mm) and individually
photographed using a digital camera. Each section was enlarged to scale where misaligned
fibre bundles were identified using visual inspection followed by a superimposed box outline.
Figure 20 illustrates the box outline method used to analyse the angle of the fibres bundles,
which were then placed in four categories: 0°>5°, 5°>10°, 10°>15° and >15°. The twelve
sections of prepreg were analysed where the weight of resin and backing paper were taken
into account before determining the total number of fibre bundles.
Figure 20 Photographs of carbon-fibre prepreg section with highlighted box outlines to
analyse fibre alignment.
46
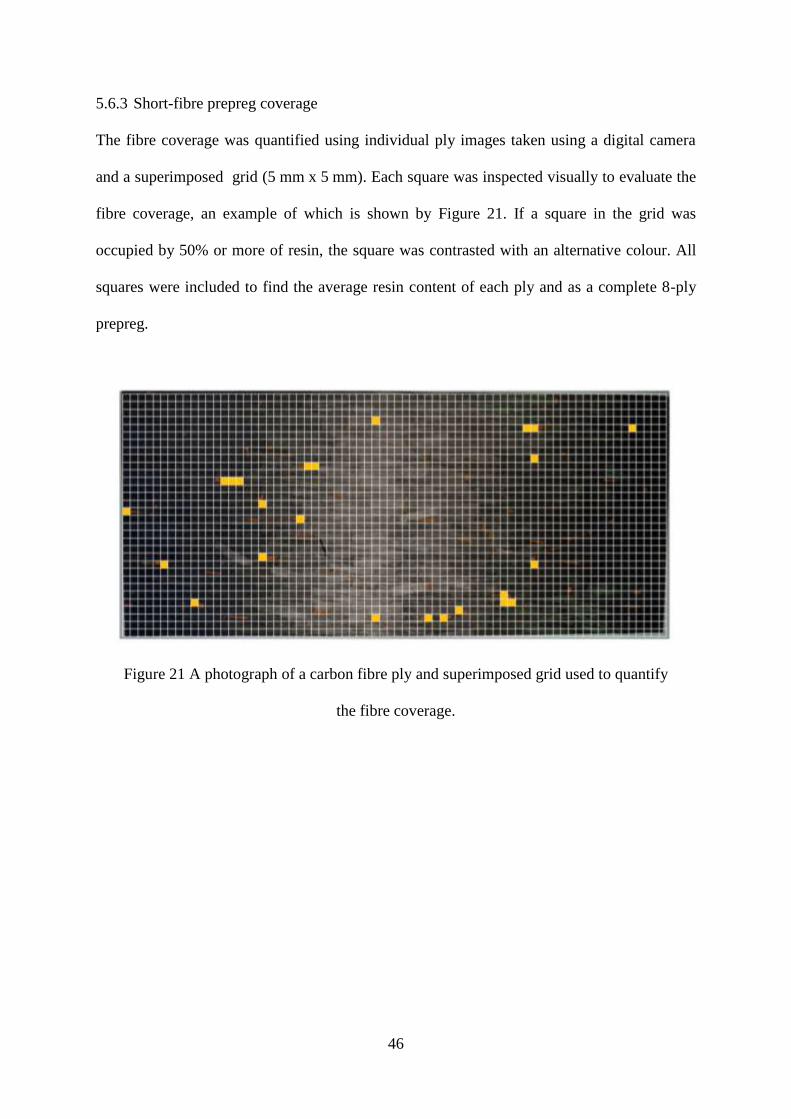
5.6.3 Short-fibre prepreg coverage
The fibre coverage was quantified using individual ply images taken using a digital camera
and a superimposed grid (5 mm x 5 mm). Each square was inspected visually to evaluate the
fibre coverage, an example of which is shown by Figure 21. If a square in the grid was
occupied by 50% or more of resin, the square was contrasted with an alternative colour. All
squares were included to find the average resin content of each ply and as a complete 8-ply
prepreg.
Figure 21 A photograph of a carbon fibre ply and superimposed grid used to quantify
the fibre coverage.
47
5.7 Quality Control
5.7.1 Macro imaging
Photographs using a digital camera and back-lighting were used to characterise continuous
fibre composites. Both glass fibre 1200 TEX and glass fibre 2400 TEX were imaged using
this procedure to detect any visual flaws or features visually.
5.7.2 C-Scan
C-scans of the continuous fibre and short-fibre composite plates were taken using software
Ultrawin. The C-scan used ultrasonic waves to determine the quality of the plate by
measuring the amplitude of the reflecting waves. Each scan was performed at a rate of
10 cm/second and optimal gate settings. Gate settings were operator dependant where a
colour intensity scale (0-100%) provided the resulting plate quality.
5.7.3 Scanning Electron Microscopy
Scanning Electron Microscopy (Joel 6060, SEM) was used to investigate the fibre-end
quality, blade quality and fractography. The settings were adjusted and controlled to provide
optimal images. The fibre samples were sputter coated with gold to prevent the accumulation
of electric charge on the specimen during inspection in the SEM.
5.7.4 Optical Microscopy
Image analysis, using a Swiss, axioskop-2 microscope, investigated the integrity of the
chopper blade, fibre alignment and fibre volume fraction. Microscope software Axiovision
4.6 was used to capture the images at appropriate magnifications.

48
5.7.4.1 Chopped fibre end -face quality, blade inspection and blade replacement
SEM was performed to inspect the quality of out-of-shelf-life carbon fibres. This study
focused on the surface-quality and fibre-ends cut using a fresh blade. Further analysis
investigated the glass fibre-ends and the effect of the cutting rate where the fibre chopper was
set between 2-8 V.
SEM images and optical microscopy compare the amount of damage to used and new
chopper blades, inspecting side and top-down profiles. To maintain a high quality of the
chopped fibre-ends the relationship between the chopper setting and blade rotation was used
to establish a criteria to replace the blade.
5.8 Test methods
The continuous-fibre and short-fibre composite plates were characterised to determine their
physical and mechanical properties; the number of samples per test and material are
summarised in Table 6.
Continuous fibre 8-ply composite Short-fibre 8-ply composite
Carbon
fibre
Out-of-shelf-
life carbon
fibre
Glass fibre
1200 TEX
Glass fibre
2400 TEX
Carbon
fibre 1
Carbon
fibre 2
Glass
fibre 1
Glass
fibre 2
Fibre
alignment 78* 78* 78* 78* 78* 78* 78* 78*
Density 5 5 5 5 5 5 5 5
Fibre
volume
fraction
30* 30* 5 5 30* 30* 5 5
Tensile 5 5 7 7 7 7 - 7
*frames used by image analysis
Table 6 A summary of the number of samples used for characterising the continuous
composites and short-fibre composites.
49
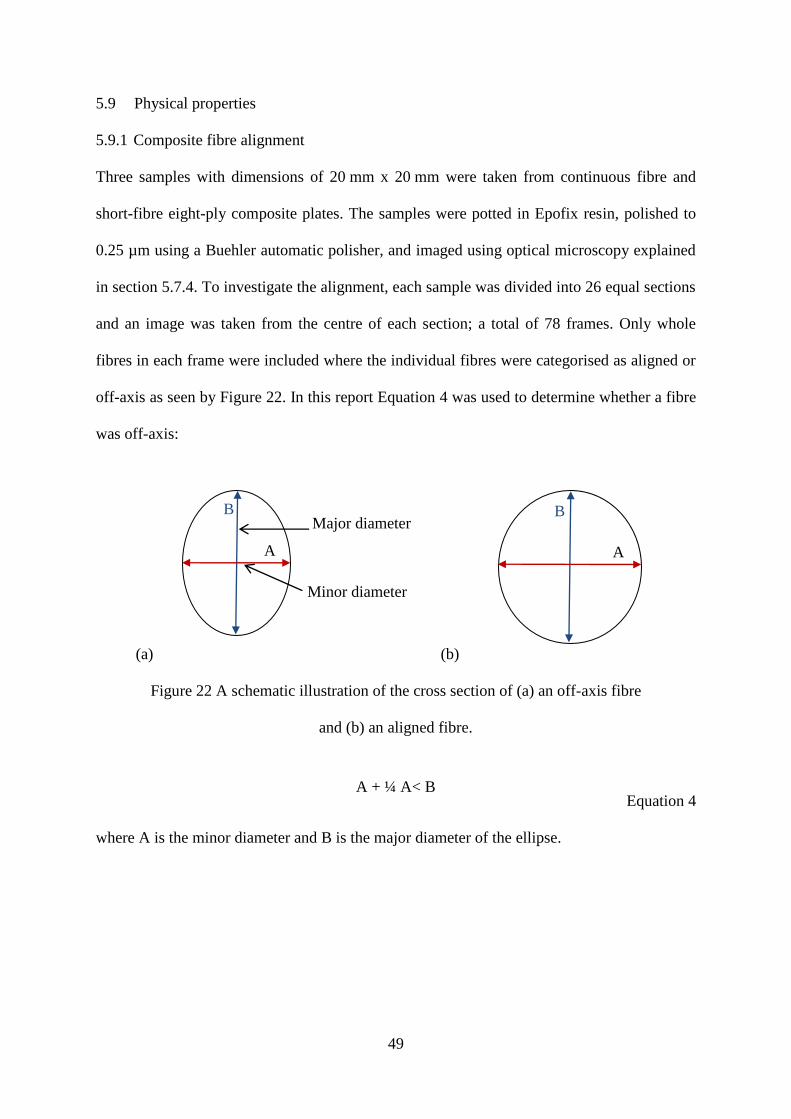
5.9 Physical properties
5.9.1 Composite fibre alignment
Three samples with dimensions of 20 mm x 20 mm were taken from continuous fibre and
short-fibre eight-ply composite plates. The samples were potted in Epofix resin, polished to
0.25 µm using a Buehler automatic polisher, and imaged using optical microscopy explained
in section 5.7.4. To investigate the alignment, each sample was divided into 26 equal sections
and an image was taken from the centre of each section; a total of 78 frames. Only whole
fibres in each frame were included where the individual fibres were categorised as aligned or
off-axis as seen by Figure 22. In this report Equation 4 was used to determine whether a fibre
was off-axis:
(a) (b)
Figure 22 A schematic illustration of the cross section of (a) an off-axis fibre
and (b) an aligned fibre.
Equation 4
where A is the minor diameter and B is the major diameter of the ellipse.
B
A
B
A
Major diameter
Minor diameter
A + ¼ A< B
50
5.9.2 Density
Density measurements of five samples (20 mm x 20 mm) were found using an analytical
weighing balance (Ohaus). Each sample was weighed in air (weight) and distilled water
(buoyancy), with reference to the water density, to find their relative density using
Equation 5:
Mass of sample in air (g) x density of test liquid = sample density (kg/m3)
Sample buoyancy (g) Equation 5
51
5.9.3 Fibre volume fraction
5.9.3.1 Glass fibre composites
Five samples of dimensions 20 mm x 20 mm were cut from the continuous fibre and
short-fibre 8-ply glass fibre composites were used to calculate the fibre volume fraction and
void content in accordance with ASTM D2584 [57] and ASTM D2734 [58] respectively.
This was calculated using the resin burn-off weighing method, where the resin of the sample
was burnt-off at 565˚C for 3 hours and left to cool in the oven overnight.
5.9.3.2 Carbon fibre composites
Optical microscopy and image analysis detailed in Section 5.7.4 were used to characterise the
fibre surface volume fraction of the continuous fibre and short-fibre carbon composites. An
automated measurement programme wizard used to determine the fibre area per frame by
selecting individual fibres. In total, 30 frames were used per material, at X50 magnification.
The colour contrast between the fibre and the matrix determined an area percentage, where
the values were averaged.
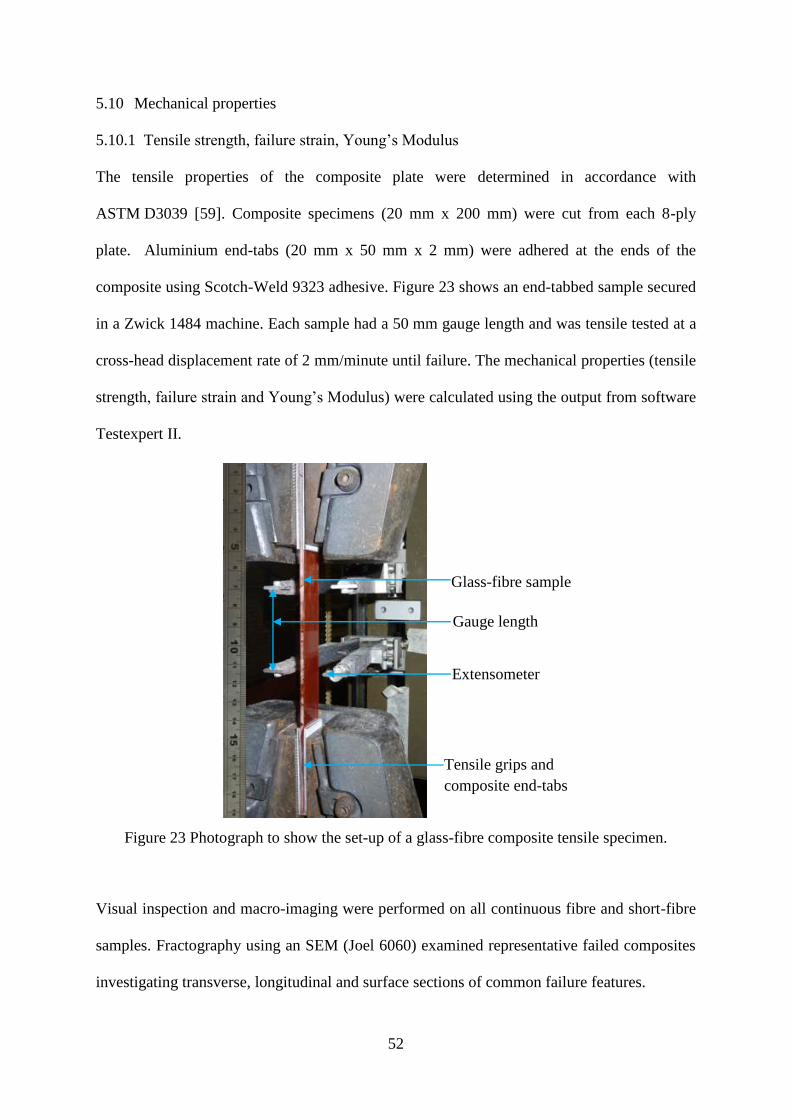
52
5.10 Mechanical properties
5.10.1 Tensile strength, failure strain, Young’s Modulus
The tensile properties of the composite plate were determined in accordance with
ASTM D3039 [59]. Composite specimens (20 mm x 200 mm) were cut from each 8-ply
plate. Aluminium end-tabs (20 mm x 50 mm x 2 mm) were adhered at the ends of the
composite using Scotch-Weld 9323 adhesive. Figure 23 shows an end-tabbed sample secured
in a Zwick 1484 machine. Each sample had a 50 mm gauge length and was tensile tested at a
cross-head displacement rate of 2 mm/minute until failure. The mechanical properties (tensile
strength, failure strain and Young’s Modulus) were calculated using the output from software
Testexpert II.
Figure 23 Photograph to show the set-up of a glass-fibre composite tensile specimen.
Visual inspection and macro-imaging were performed on all continuous fibre and short-fibre
samples. Fractography using an SEM (Joel 6060) examined representative failed composites
investigating transverse, longitudinal and surface sections of common failure features.
Extensometer
Tensile grips and
composite end-tabs
Gauge length
Glass-fibre sample
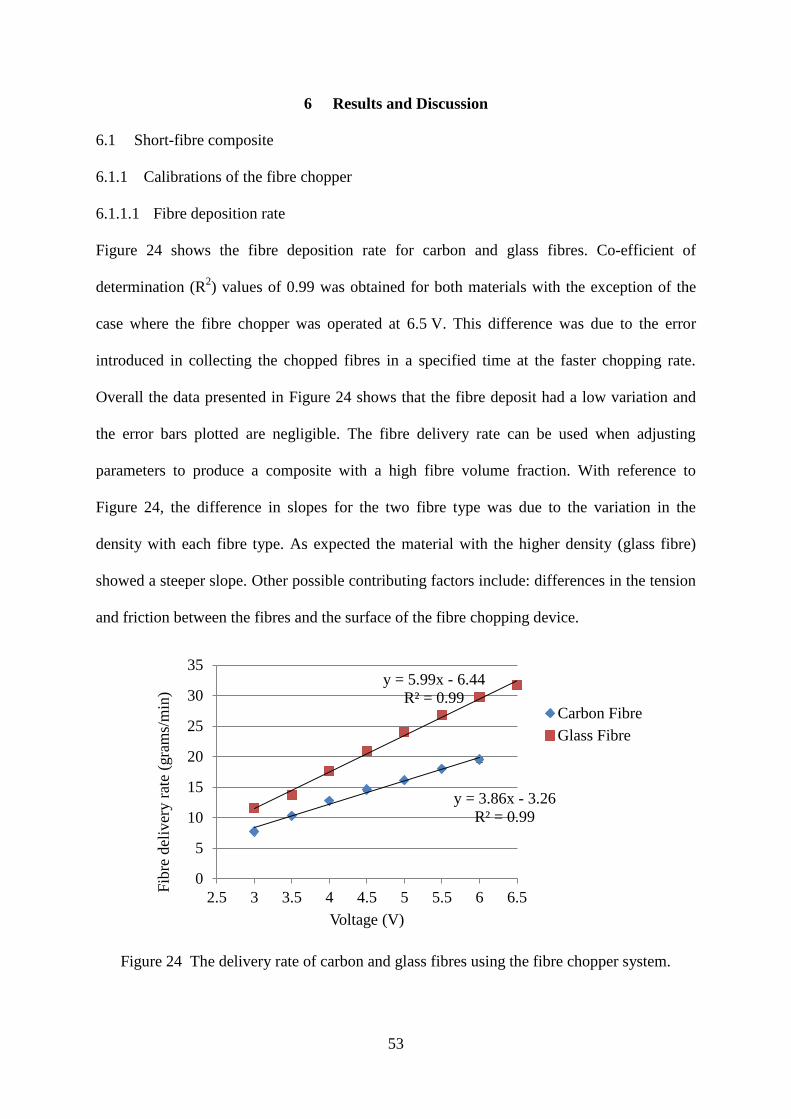
53
6 Results and Discussion
6.1 Short-fibre composite
6.1.1 Calibrations of the fibre chopper
6.1.1.1 Fibre deposition rate
Figure 24 shows the fibre deposition rate for carbon and glass fibres. Co-efficient of
determination (R2) values of 0.99 was obtained for both materials with the exception of the
case where the fibre chopper was operated at 6.5 V. This difference was due to the error
introduced in collecting the chopped fibres in a specified time at the faster chopping rate.
Overall the data presented in Figure 24 shows that the fibre deposit had a low variation and
the error bars plotted are negligible. The fibre delivery rate can be used when adjusting
parameters to produce a composite with a high fibre volume fraction. With reference to
Figure 24, the difference in slopes for the two fibre type was due to the variation in the
density with each fibre type. As expected the material with the higher density (glass fibre)
showed a steeper slope. Other possible contributing factors include: differences in the tension
and friction between the fibres and the surface of the fibre chopping device.
Figure 24 The delivery rate of carbon and glass fibres using the fibre chopper system.
y = 3.86x - 3.26
R² = 0.99
y = 5.99x - 6.44
R² = 0.99
0
5
10
15
20
25
30
35
2.5 3 3.5 4 4.5 5 5.5 6 6.5
Fib
re d
eliv
ery r
ate
(gra
ms/
min
)
Voltage (V)
Carbon Fibre
Glass Fibre

54
6.1.1.2 Chopper speed
The tachometer was used to estimate the revolutions per minute (rpm) of the feeder roller,
rubber anvil and chopper head at various applied voltages. As expected Figure 25 shows that
the rotation speeds for each rotating component increased with a higher voltage. As predicted
the smaller diameter feeder roller had a greater rpm than the rubber anvil and chopper. The
R2 value of 0.99 was observed for all of the components confirming a low error between the
rotation rate and the applied voltage. It can be seen there was a positive linear relationship
with all three components, which confirms the feed rate was effective at delivering
continuous fibres to the chopper head at a constant rate.
Figure 25 Graph showing the revolutions per minute of the feeder roller, rubber anvil and
chopper head at voltages 3 V- 6 V.
y = 65.54x - 2.05
R² = 0.99 (Feeder roller)
y = 50.75x - 53.54
R² = 0.99 (Rubber anvil)
y = 48.09x - 50.71
R² = 0.99 (Chopper)
0
50
100
150
200
250
300
350
400
450
2.5 3 3.5 4 4.5 5 5.5 6 6.5
Cog s
pee
d (
rpm
)
Voltage (V)
Feeder roller
Rubber anvil
Chopper

55
6.1.1.3 Conveyor belt
The conveyor belt calibration results presented in Figure 26 show a positive linear correlation
between the conveyor belt setting and the speed, which is expressed by the linear trend value
R2 of 0.99. The calibrated conveyor belt speed ensured control is achieved in respect to the
fibre delivery rate and length of the short-fibres.
Figure 26 The calibration of the conveyor belt setting against an average speed over three
trials.
y = 0.01x + 0.01
R² = 0.99
0
0.2
0.4
0.6
0.8
1
1.2
0 10 20 30 40 50 60 70 80 90
Aver
age
Spee
d (
m/s
)
Conveyor Belt Setting
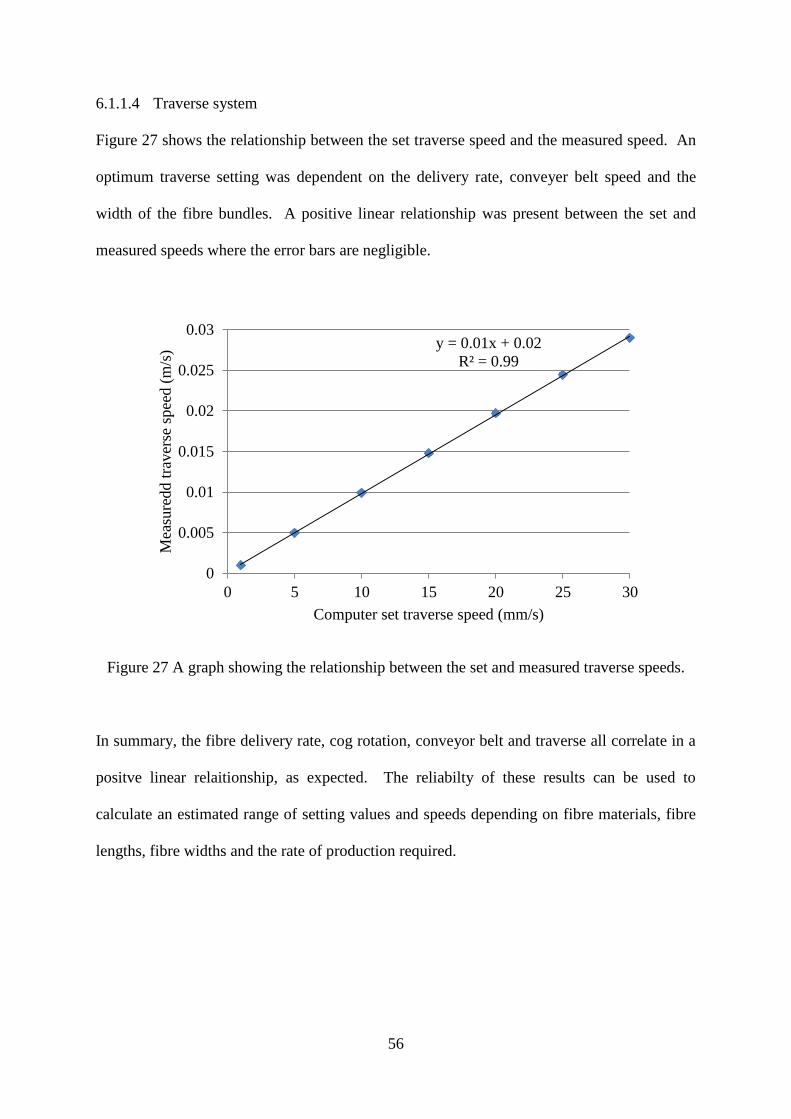
56
6.1.1.4 Traverse system
Figure 27 shows the relationship between the set traverse speed and the measured speed. An
optimum traverse setting was dependent on the delivery rate, conveyer belt speed and the
width of the fibre bundles. A positive linear relationship was present between the set and
measured speeds where the error bars are negligible.
Figure 27 A graph showing the relationship between the set and measured traverse speeds.
In summary, the fibre delivery rate, cog rotation, conveyor belt and traverse all correlate in a
positve linear relaitionship, as expected. The reliabilty of these results can be used to
calculate an estimated range of setting values and speeds depending on fibre materials, fibre
lengths, fibre widths and the rate of production required.
y = 0.01x + 0.02
R² = 0.99
0
0.005
0.01
0.015
0.02
0.025
0.03
0 5 10 15 20 25 30
Mea
sure
dd t
raver
se s
pee
d (
m/s
)
Computer set traverse speed (mm/s)

57
6.1.1.5 Angle of chopper-head
The motion of the chopper blades force the fibres to be deposited onto the belt at an angle.
Figure 28 presents the variation of carbon fibre alignment with a change in angle of the
chopper head relative to the conveyor belt. Visual inspection determined that the maximum
degree of alignment was achieved by setting the chopper head to an angle at approximately
25° for both carbon fibres and glass fibres. The adjustment of the chopper head created the
fibres to flow following a natural alignment process. Inevitably with a change in speed or
material these characteristics may alter and adjustment will need to be made accordingly.
Angle of the
fibre chopper
head
Images of chopped carbon fibre bundles delivered to the conveyor belt
0°
10°
20°
25°
30°
40°
Figure 28 Photographs of short-carbon fibres delivered to the conveyor belt at various
chopper head angles in relation to the conveyor belt.
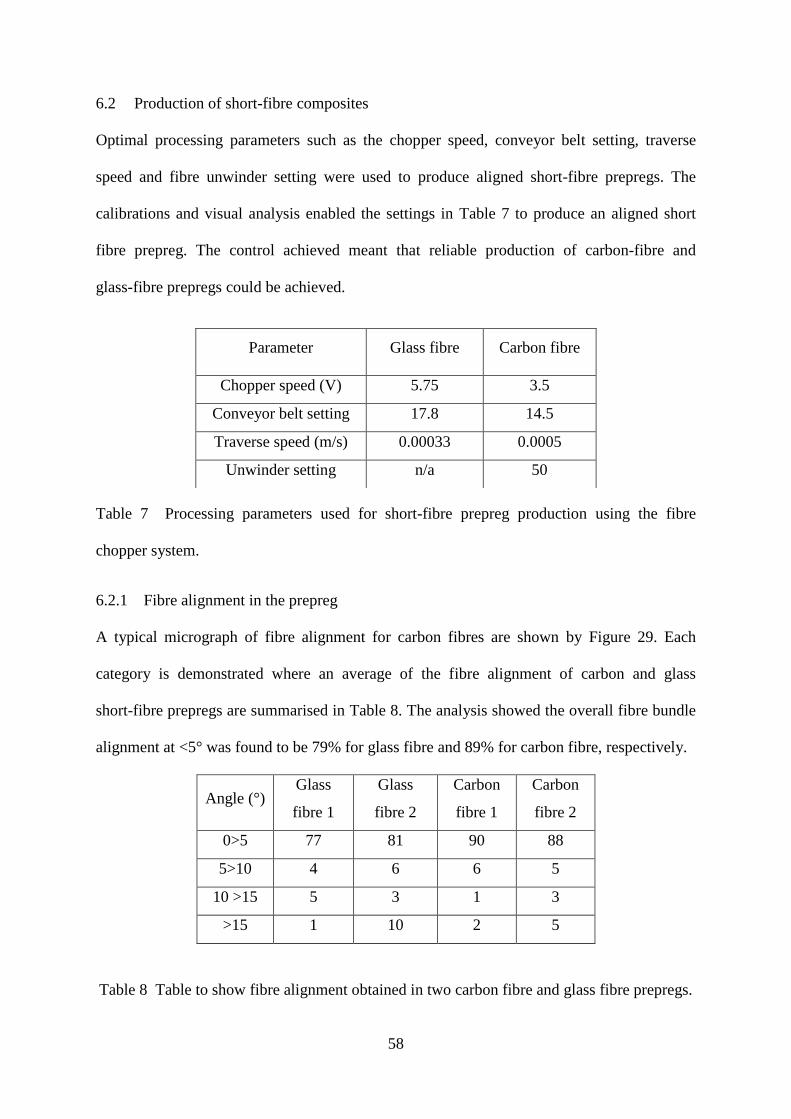
58
6.2 Production of short-fibre composites
Optimal processing parameters such as the chopper speed, conveyor belt setting, traverse
speed and fibre unwinder setting were used to produce aligned short-fibre prepregs. The
calibrations and visual analysis enabled the settings in Table 7 to produce an aligned short
fibre prepreg. The control achieved meant that reliable production of carbon-fibre and
glass-fibre prepregs could be achieved.
Table 7 Processing parameters used for short-fibre prepreg production using the fibre
chopper system.
6.2.1 Fibre alignment in the prepreg
A typical micrograph of fibre alignment for carbon fibres are shown by Figure 29. Each
category is demonstrated where an average of the fibre alignment of carbon and glass
short-fibre prepregs are summarised in Table 8. The analysis showed the overall fibre bundle
alignment at <5° was found to be 79% for glass fibre and 89% for carbon fibre, respectively.
Angle (°) Glass
fibre 1
Glass
fibre 2
Carbon
fibre 1
Carbon
fibre 2
0>5 77 81 90 88
5>10 4 6 6 5
10 >15 5 3 1 3
>15 1 10 2 5
Table 8 Table to show fibre alignment obtained in two carbon fibre and glass fibre prepregs.
Parameter Glass fibre Carbon fibre
Chopper speed (V) 5.75 3.5
Conveyor belt setting 17.8 14.5
Traverse speed (m/s) 0.00033 0.0005
Unwinder setting n/a 50
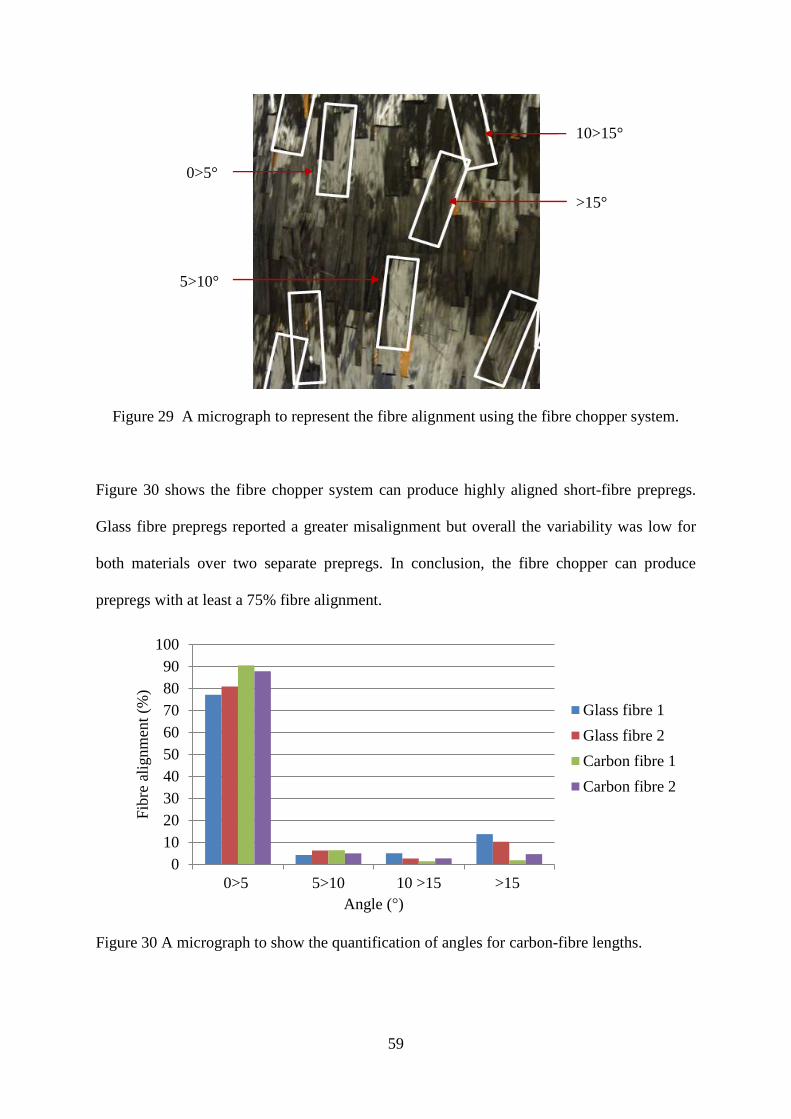
59
Figure 29 A micrograph to represent the fibre alignment using the fibre chopper system.
Figure 30 shows the fibre chopper system can produce highly aligned short-fibre prepregs.
Glass fibre prepregs reported a greater misalignment but overall the variability was low for
both materials over two separate prepregs. In conclusion, the fibre chopper can produce
prepregs with at least a 75% fibre alignment.
Figure 30 A micrograph to show the quantification of angles for carbon-fibre lengths.
0
10
20
30
40
50
60
70
80
90
100
0>5 5>10 10 >15 >15
Fib
re a
lignm
ent
(%)
Angle (°)
Glass fibre 1
Glass fibre 2
Carbon fibre 1
Carbon fibre 2
>15°
0>5°
5>10°
10>15°

60
Fibre coverage in the prepreg Table 9 shows each of the eight plies and the amount of
occupied squares of resin compared to fibres. Average prepreg fibre coverage with respect to
resin in a single ply using carbon fibre was 98.74% and 97.11% for glass fibre.
Table 9 A table summarising fibre coverage and averages for carbon and glass fibre prepregs.
Ply
Number
Carbon Fibre coverage
(%)
Glass Fibre coverage
(%)
Prepreg 1 Prepreg 2 Prepreg 1 Prepreg 2
1 98 99 98 96
2 98 99 98 96
3 99 99 98 97
4 98 99 97 97
5 99 99 97 97
6 99 99 97 97
7 99 99 97 98
8 98 99 96 97
Average 98 99 97 97
SD 0.64 0.20 0.83 0.62
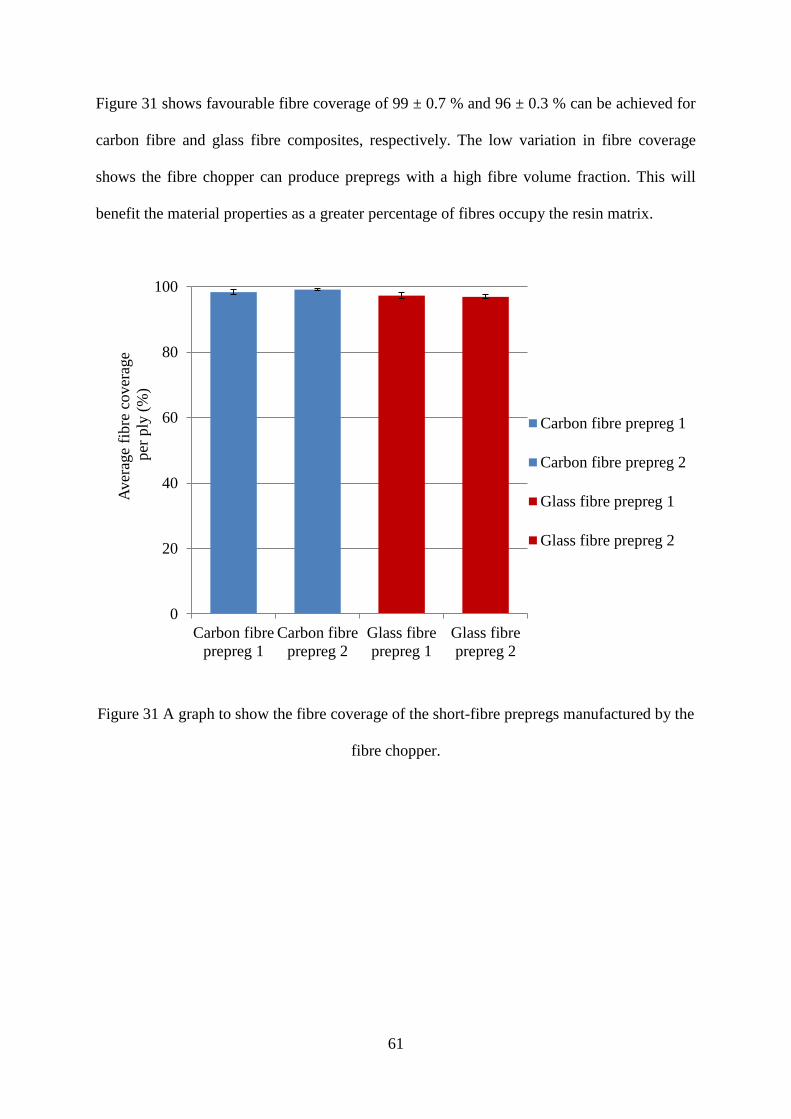
61
Figure 31 shows favourable fibre coverage of 99 ± 0.7 % and 96 ± 0.3 % can be achieved for
carbon fibre and glass fibre composites, respectively. The low variation in fibre coverage
shows the fibre chopper can produce prepregs with a high fibre volume fraction. This will
benefit the material properties as a greater percentage of fibres occupy the resin matrix.
Figure 31 A graph to show the fibre coverage of the short-fibre prepregs manufactured by the
fibre chopper.
0
20
40
60
80
100
Carbon fibre
prepreg 1
Carbon fibre
prepreg 2
Glass fibre
prepreg 1
Glass fibre
prepreg 2
Aver
age
fibre
cover
age
per
ply
(%
)
Carbon fibre prepreg 1
Carbon fibre prepreg 2
Glass fibre prepreg 1
Glass fibre prepreg 2

62
6.3 Production of continuous fibre composites
6.3.1 Differential scanning calorimetry
Figure 32 shows the glass transition temperature (Tg) of out-of-shelf-life carbon fibre to be
160°C. To ensure matrix integrity during manufacture, Hexply 913 resin remains a suitable
material due to the reduced curing temperature at 125°C.
Figure 32 Differential Scanning Calorimetry trace of the out-of-shelf-life carbon fibre,
highlighting the glass-transition temperature.

63
6.3.2 Macro imaging
Figure 33 shows back-lit images of the continuous glass fibre composite plates. Both images
show a unidirectional fibre structure with a high fibre volume fraction. The glass fibre 2400
TEX composite appeared to show ‘waves’ of fibres; these sections are likely to be caused by
a lack of matrix resin due to the larger fibre tow, so unimpregnated fibres are apparent.
(a)
(b)
Figure 33 Image of continuous 8-ply glass fibre composite (a) 1200 TEX and (b) 2400 TEX.

64
6.4 Quality control
6.4.1 C-scans
Figure 34a-c show C-scan images of the continuous fibre composites; glass fibre 1200 TEX,
glass fibre 2400 TEX and carbon fibre respectively. The left y-axis scales are the percentage
of detected ultrasonic waves within the predetermined gate setting. The x-axis and right
y-axis show the dimensions, in centimetres, of the C-scan performed. The largest black
rectangle shows the section of the composite used for mechanical testing. While the
numbered sections of the composite and the arrows indicate sections used for image analysis
and their polished faces respectively. The C-scan images use a colour scale where blue region
indicate the bottom of the C-scan tank, due to the lower reflected signal in this region. The
green areas show 100% ultrasonic wave detection (reflected signal), therefore high amplitude
of reflective waves was measured. The red regions indicate possible flaws in the composite;
these may include voids, lack of resin content, reduced fibre volume fractions, scratches or an
uneven surface quality. Both of the continuous glass fibre plates were in a post-cure state
where sample edges show a greater degree of variability.

65
(34a)
(34b)
(34c)
Figure 34 C-scan images of continuous fibre composites (a) glass fibre 1200 TEX,
(b) glass fibre 2400 TEX and (c) carbon fibre.

66
Quality control of the short-fibre composites are shown by the C-scans in Figure 35a-b. The
colour intensity scale shows that all the composite plates had minor defects where the
majority of each plate showed a high reflected signal. Therefore, the images presented show
the quality of the composite plates to be comparable to the continuous composite plates.
(35a)
(35b)
Figure 35 C-scan images of short-fibre composites manufactured using the fibre chopper
system (a) glass fibre and (b) carbon fibre.
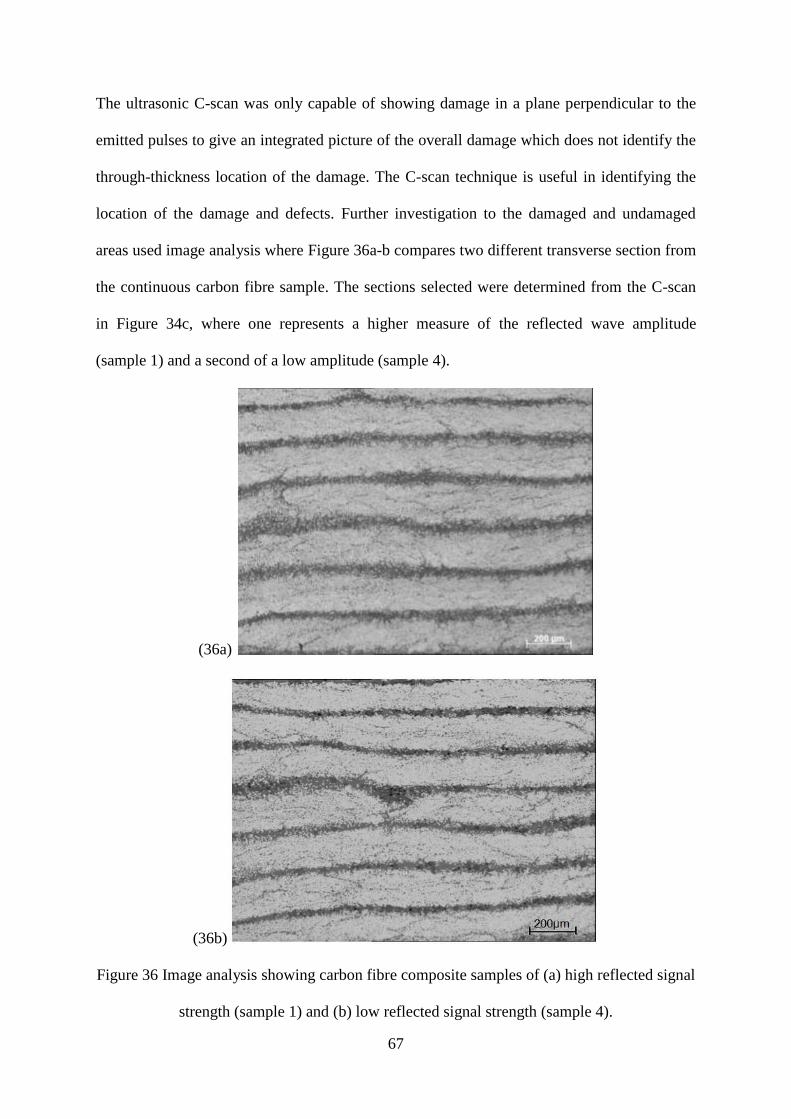
67
The ultrasonic C-scan was only capable of showing damage in a plane perpendicular to the
emitted pulses to give an integrated picture of the overall damage which does not identify the
through-thickness location of the damage. The C-scan technique is useful in identifying the
location of the damage and defects. Further investigation to the damaged and undamaged
areas used image analysis where Figure 36a-b compares two different transverse section from
the continuous carbon fibre sample. The sections selected were determined from the C-scan
in Figure 34c, where one represents a higher measure of the reflected wave amplitude
(sample 1) and a second of a low amplitude (sample 4).
(36a)
(36b)
Figure 36 Image analysis showing carbon fibre composite samples of (a) high reflected signal
strength (sample 1) and (b) low reflected signal strength (sample 4).

68
The micrograph and enlarged region shown in Figure 37 confirm the darker sections are
occupied by resin and are not voids. The difference in colour intensity of the two samples
were analysed to quantify resin content as a value where Figure 38 uses micrograph analysis
and software to quantify the resin rich areas. Increased resin content appears to correspond to
a lower reflected C-scan signal. The difference between the resin content is summarised in
Table 9. The lower detected signal strength shows a higher resin content by an average of 3%
in the small sample area compared to a high reflected signal strength. This is further justified
by the reduced wave amplitude at the edges of the composites plates, especially in the
post-cure state.
Figure 37 (a) Micrograph showing the cross-section through a continuous carbon fibre
composite, (b) magnified image showing the resin-rich region.
(37a)
(37b)

69
With reference to Figure 38a-b, image analysis was used to quantify the resin rich areas.
Where a greater resin content receives a lower reflected signal and therefore shows as red
during the C-scan.
(38a)
(38b)
Figure 38 Micrographs comparing the same cross-sectional image of (a) Continuous carbon
fibre composite and (b) computer selected regions of resin.
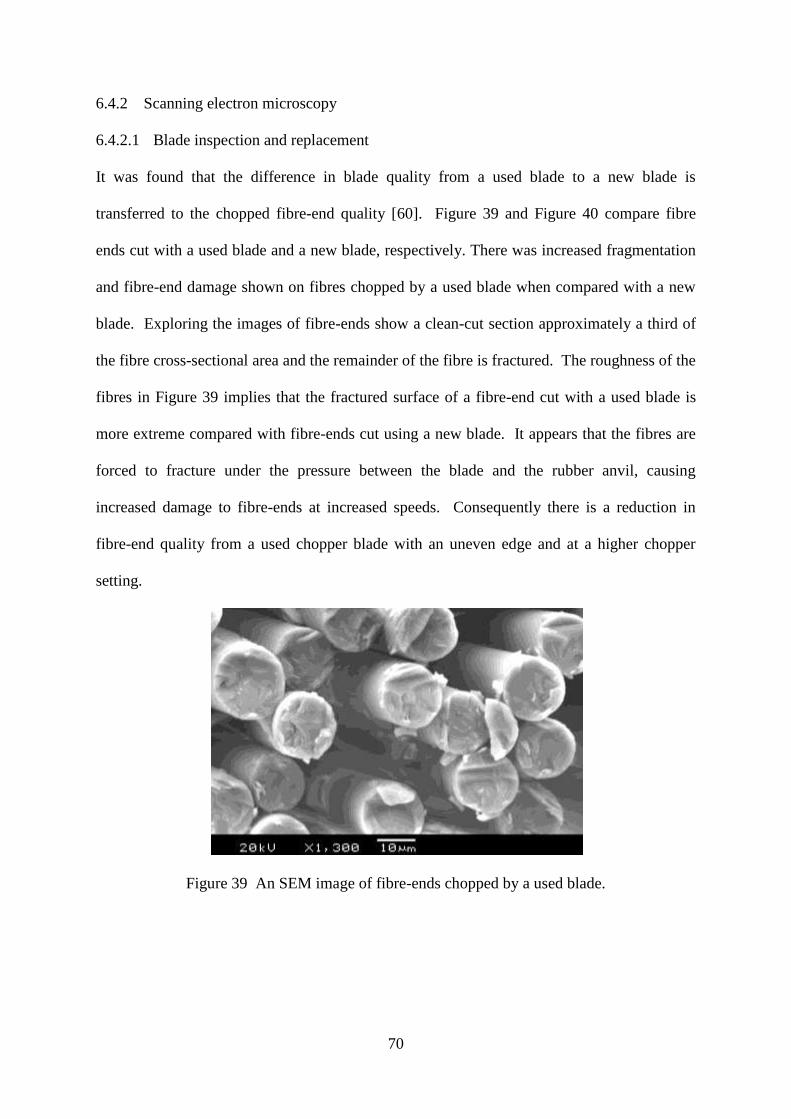
70
6.4.2 Scanning electron microscopy
6.4.2.1 Blade inspection and replacement
It was found that the difference in blade quality from a used blade to a new blade is
transferred to the chopped fibre-end quality [60]. Figure 39 and Figure 40 compare fibre
ends cut with a used blade and a new blade, respectively. There was increased fragmentation
and fibre-end damage shown on fibres chopped by a used blade when compared with a new
blade. Exploring the images of fibre-ends show a clean-cut section approximately a third of
the fibre cross-sectional area and the remainder of the fibre is fractured. The roughness of the
fibres in Figure 39 implies that the fractured surface of a fibre-end cut with a used blade is
more extreme compared with fibre-ends cut using a new blade. It appears that the fibres are
forced to fracture under the pressure between the blade and the rubber anvil, causing
increased damage to fibre-ends at increased speeds. Consequently there is a reduction in
fibre-end quality from a used chopper blade with an uneven edge and at a higher chopper
setting.
Figure 39 An SEM image of fibre-ends chopped by a used blade.
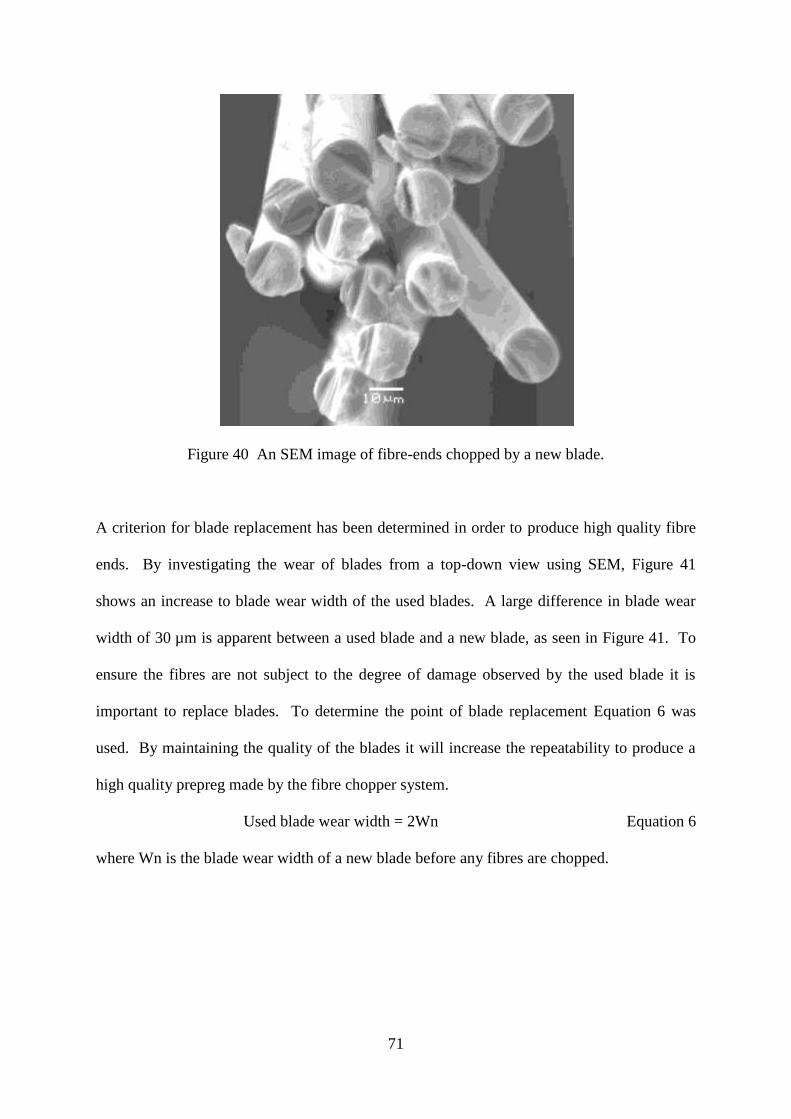
71
Figure 40 An SEM image of fibre-ends chopped by a new blade.
A criterion for blade replacement has been determined in order to produce high quality fibre
ends. By investigating the wear of blades from a top-down view using SEM, Figure 41
shows an increase to blade wear width of the used blades. A large difference in blade wear
width of 30 µm is apparent between a used blade and a new blade, as seen in Figure 41. To
ensure the fibres are not subject to the degree of damage observed by the used blade it is
important to replace blades. To determine the point of blade replacement Equation 6 was
used. By maintaining the quality of the blades it will increase the repeatability to produce a
high quality prepreg made by the fibre chopper system.
Used blade wear width = 2Wn Equation 6
where Wn is the blade wear width of a new blade before any fibres are chopped.

72
(a) (b)
Figure 41 SEM images showing the blade width of (a) a new blade and (b) a used blade.
The process of removing blades for inspection can be time consuming and problematic. The
results of the blade rpm show a positive linear correlation to the chopper setting. During the
manufacture of prepregs the voltage, number of blades and duration are all variable
depending on the material, prepreg size and fibre length. Equation 7 can be used to estimate
the life cycle of blades before replacement is advised:
d(54.819c –53.342) ≥ 9000 Equation 7
N
where d is the duration of time the chopper is used (minutes), c is the chopper setting
(voltage) and N is the number of blades in the chopper head.
6.4.2.2 Fibre-end quality
Figure 42 images the surface of the out-of-shelf-life carbon fibre using SEM. The image
shows a surround of resin around each fibre, creating a bond between the fibres and the resin
matrix.
New blade
wear width
(Wn)
Used blade
wear width
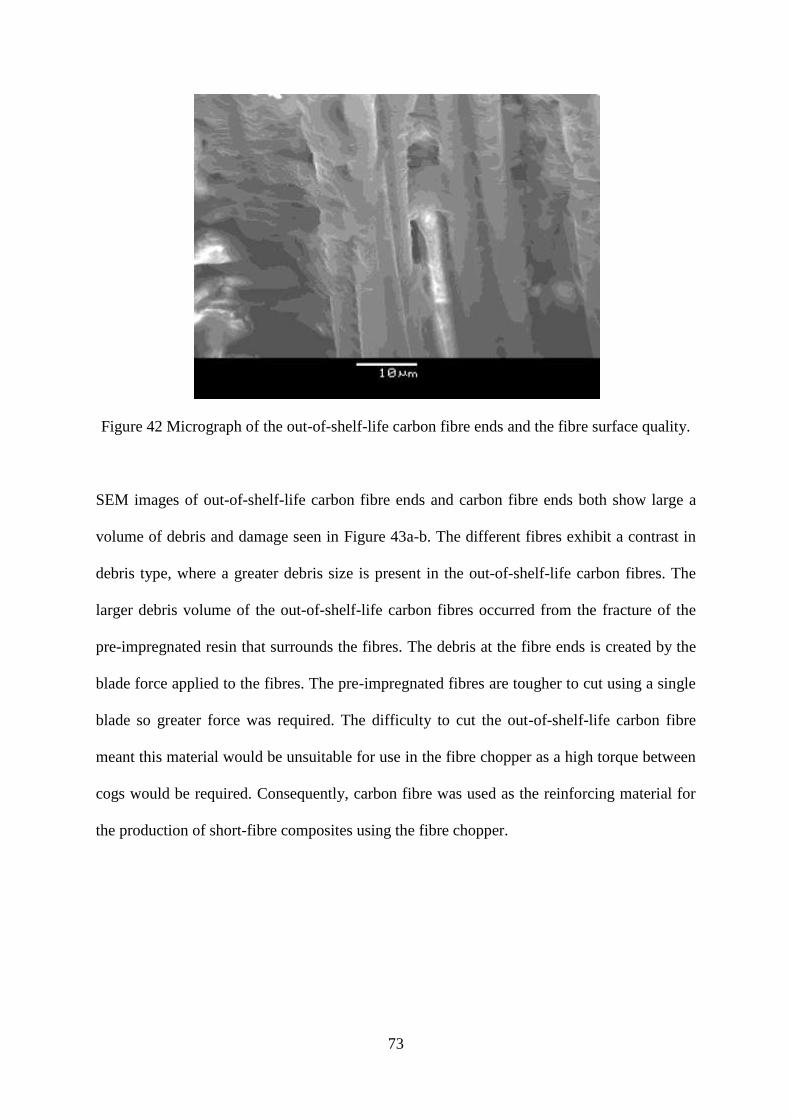
73
Figure 42 Micrograph of the out-of-shelf-life carbon fibre ends and the fibre surface quality.
SEM images of out-of-shelf-life carbon fibre ends and carbon fibre ends both show large a
volume of debris and damage seen in Figure 43a-b. The different fibres exhibit a contrast in
debris type, where a greater debris size is present in the out-of-shelf-life carbon fibres. The
larger debris volume of the out-of-shelf-life carbon fibres occurred from the fracture of the
pre-impregnated resin that surrounds the fibres. The debris at the fibre ends is created by the
blade force applied to the fibres. The pre-impregnated fibres are tougher to cut using a single
blade so greater force was required. The difficulty to cut the out-of-shelf-life carbon fibre
meant this material would be unsuitable for use in the fibre chopper as a high torque between
cogs would be required. Consequently, carbon fibre was used as the reinforcing material for
the production of short-fibre composites using the fibre chopper.
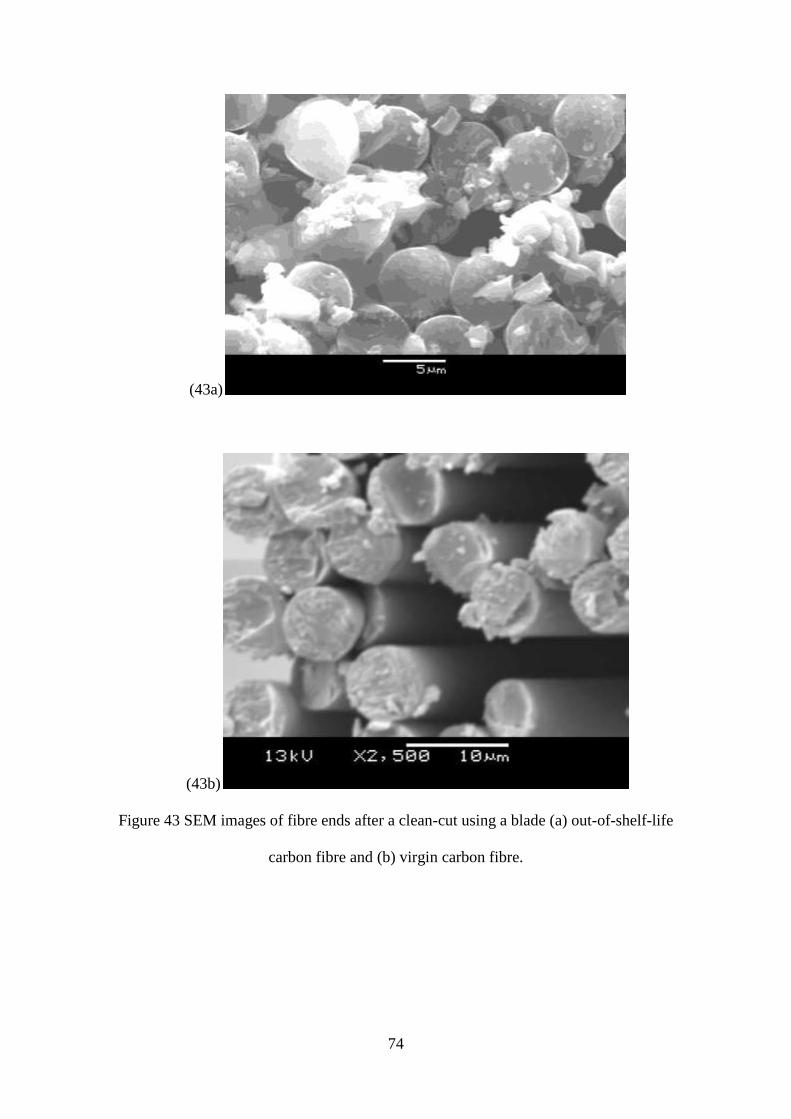
74
(43a)
(43b)
Figure 43 SEM images of fibre ends after a clean-cut using a blade (a) out-of-shelf-life
carbon fibre and (b) virgin carbon fibre.

75
6.5 Test methods
Physical and mechanical testing provides a quantitative measure for the comparison of
material properties between continuous fibre and short-fibre composites. The results of the
short-fibre composites can be compared to alternative alignment methods for short-fibres as
well as the continuous reference composites produced using the same materials and
production process. In total eight different materials in this report have been manufactured
and produced, these have been labelled as: (i) continuous glass fibre 1200 TEX, (ii)
continuous glass fibre 2400 TEX, (iii) continuous carbon fibre, (iv) continuous
out-of-shelf-life carbon fibre, (v) short-glass fibre 1, (vi) short-glass fibre 2, (vii) short-carbon
fibre 1 and (viii) short-carbon fibre 2.
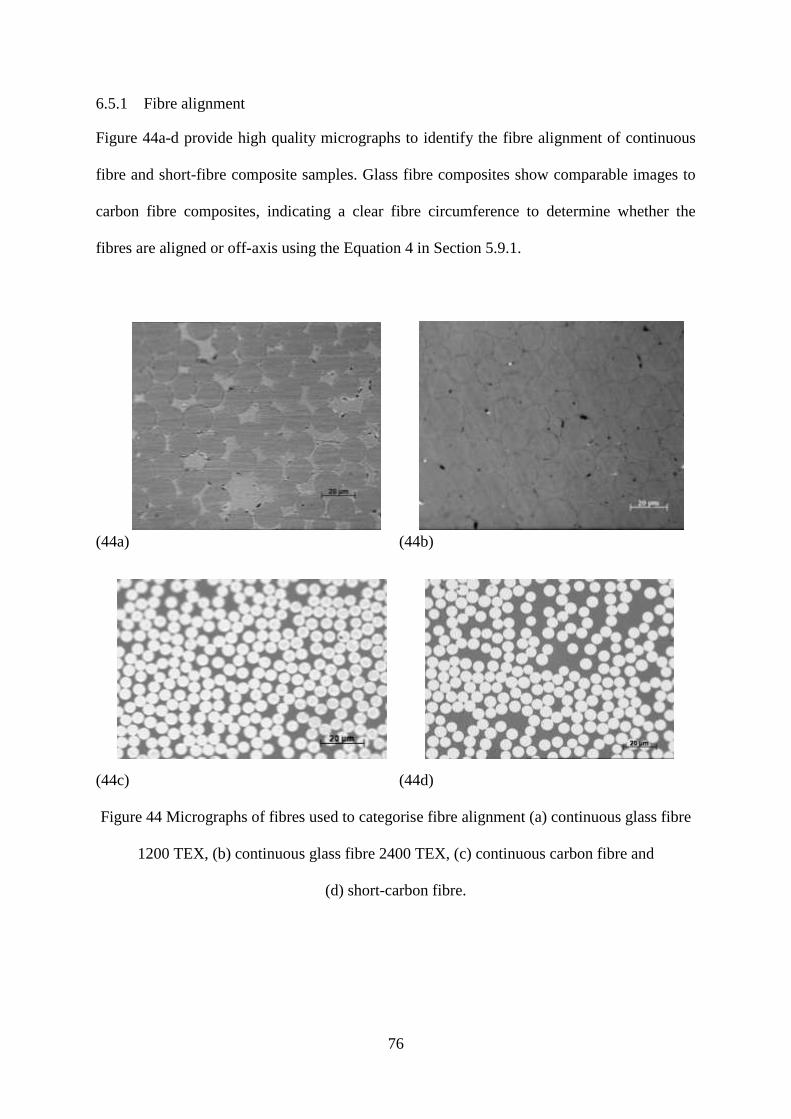
76
6.5.1 Fibre alignment
Figure 44a-d provide high quality micrographs to identify the fibre alignment of continuous
fibre and short-fibre composite samples. Glass fibre composites show comparable images to
carbon fibre composites, indicating a clear fibre circumference to determine whether the
fibres are aligned or off-axis using the Equation 4 in Section 5.9.1.
(44a) (44b)
(44c) (44d)
Figure 44 Micrographs of fibres used to categorise fibre alignment (a) continuous glass fibre
1200 TEX, (b) continuous glass fibre 2400 TEX, (c) continuous carbon fibre and
(d) short-carbon fibre.

77
Figure 45 shows a longitudinal section of a continuous carbon fibre composite. The
continuous fibre composites all showed a highly orientated composite as seen by the large
ellipse of each fibre. The variation of fibre alignment due to fibre chopper manufacture of
short-fibre composites is shown in Figure 46. In the case of the short-fibre composite there
were scattered regions of aligned and off-axis fibres. Highly aligned fibres are imaged to
show a longitudinal length of 400 µm while the greatest off-axis fibres present a longitudinal
length of nearer 25 µm. The main reasons for the change in fibre ellipse size can be related to
the processes of the fibre chopper, the hand lay-up of composite manufacture and the scale of
magnification used. At low magnifications, only a small percentage of the complete
composite is analysed making the technique dependant on the samples investigated.
Figure 45 Micrograph showing longitudinal fibre alignment sections of a continuous carbon
fibre composite.
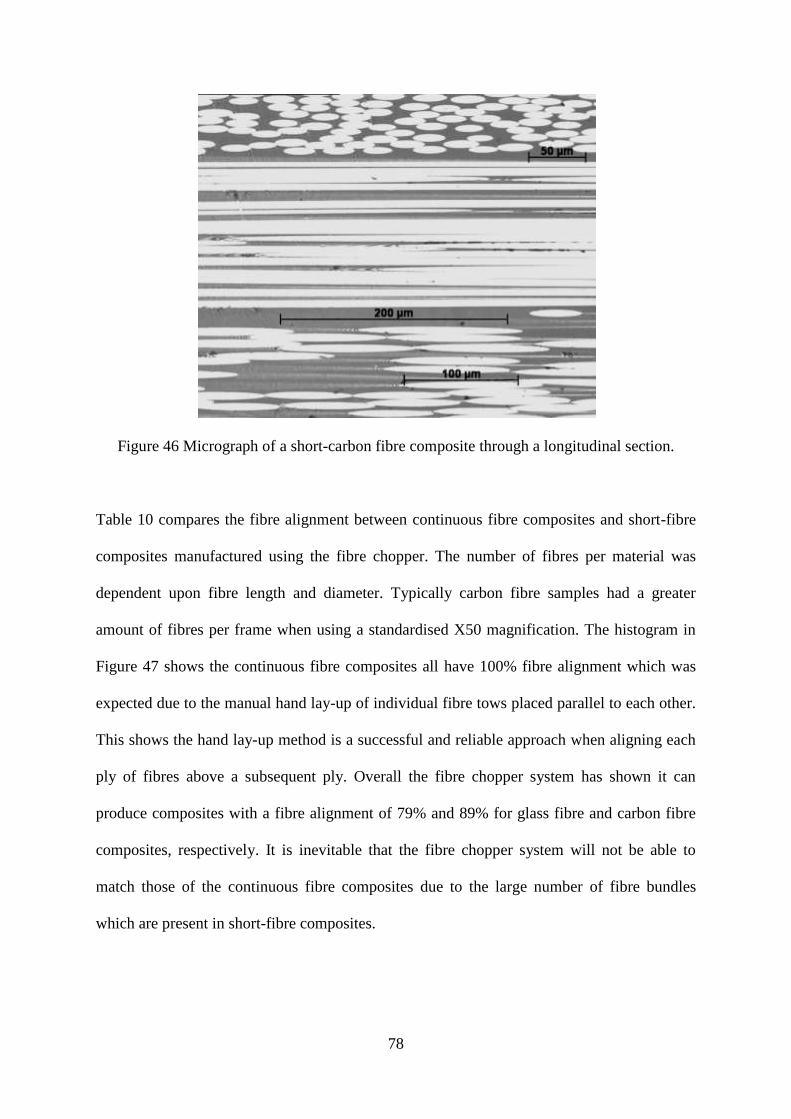
78
Figure 46 Micrograph of a short-carbon fibre composite through a longitudinal section.
Table 10 compares the fibre alignment between continuous fibre composites and short-fibre
composites manufactured using the fibre chopper. The number of fibres per material was
dependent upon fibre length and diameter. Typically carbon fibre samples had a greater
amount of fibres per frame when using a standardised X50 magnification. The histogram in
Figure 47 shows the continuous fibre composites all have 100% fibre alignment which was
expected due to the manual hand lay-up of individual fibre tows placed parallel to each other.
This shows the hand lay-up method is a successful and reliable approach when aligning each
ply of fibres above a subsequent ply. Overall the fibre chopper system has shown it can
produce composites with a fibre alignment of 79% and 89% for glass fibre and carbon fibre
composites, respectively. It is inevitable that the fibre chopper system will not be able to
match those of the continuous fibre composites due to the large number of fibre bundles
which are present in short-fibre composites.

79
Table 10 A comparison of the fibre alignment of continuous fibre and short-fibre composites
indicating the total number of fibres analysed.
Figure 47 A comparison the fibre alignment of continuous fibre composites and short-fibre
composites.
0102030405060708090
100
Gla
ss f
ibre
1200 T
EX
Gla
ss f
ibre
2400 T
EX
Car
bo
n f
ibre
Out-
of-
shel
f-li
fe c
arbon f
ibre
Gla
ss f
ibre
1
Gla
ss f
ibre
2
Car
bon f
ibre
1
Car
bon f
ibre
2
Continous fibre Short fibre
Fib
re a
lignm
ent
(%)
Continuous fibre Short fibre
Fibre
material
Glass fibre
1200 TEX
Glass fibre
2400 TEX
Carbon
fibre
Out-of-shelf
-life carbon
fibre
Glass
fibre 1
Glass
fibre 2
Carbon
fibre 1
Carbon
fibre 2
Number
of fibres
analysed
4589 3541 7882 4910 3417 3212 3761 3852
Aligned 100% 100% 100% 100% 80%
(6.79)
80%
(5.11)
89%
(8.88)
97%
(0.77)
Off-axis 0% 0% 0% 0% 20% 20% 11% 3%

80
Figure 48 shows the image analysis method used to quantity fibre alignment is in good
agreement with the prepreg fibre alignment results presented in Section 6.2.1.
Conclusions: The initial macro imaging procedure can be used as an effective technique to
determine the fibre alignment of short-fibre prepregs. Both materials showed some
discrepancies in fibre alignment when comparing the visual inspection and image analysis.
The variation is likely to be created by the magnification used in microscopy, where only a
small section is analysed, therefore the fibre alignment becomes dependent on the composite
section imaged. Overall both methods are in agreement that the fibre chopper based delivery
system produces a greater alignment for carbon than glass, both of which exceed a 60% fibre
alignment.
Figure 48 Fibre alignment prepreg techniques comparing macro imaging with microscopy.
0
10
20
30
40
50
60
70
80
90
100
Macro imaging Microscopy Macro imaging Microscopy
Aligned Off-axis
Fib
re a
lignm
ent
(%)
Fibre alignment technique
Glass fibre 1
Glass fibre 2
Carbon fibre 1
Carbon fibre 2
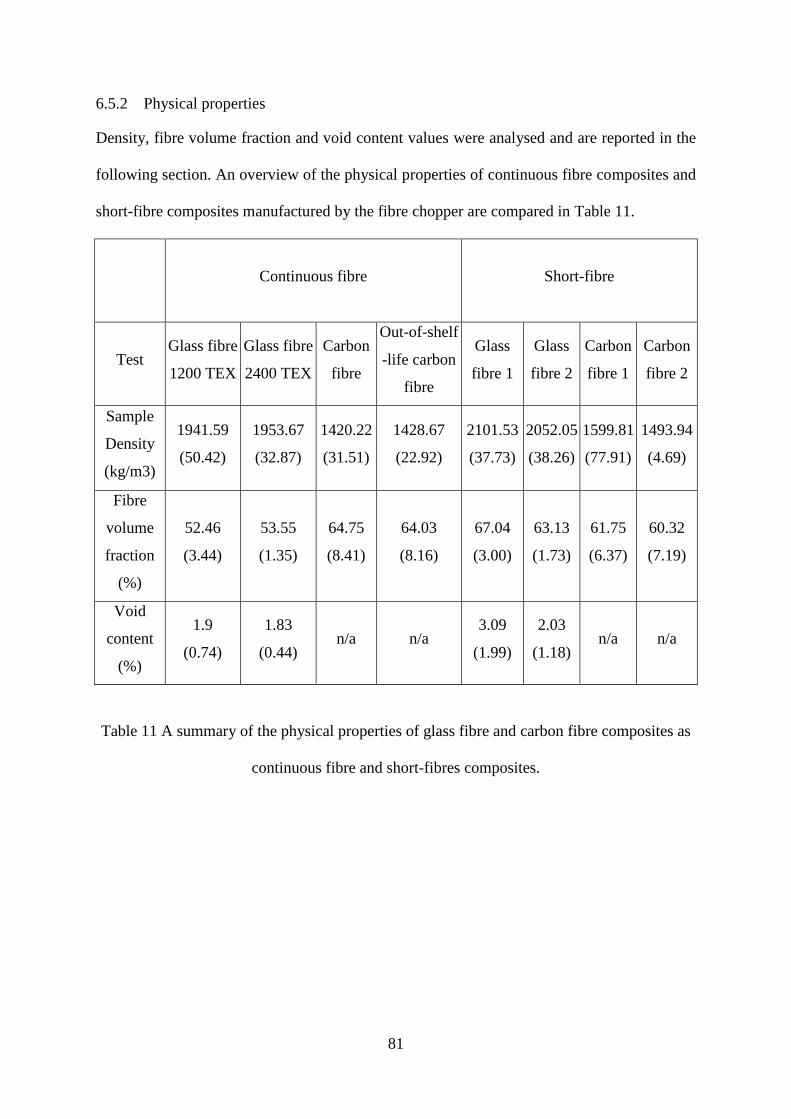
81
6.5.2 Physical properties
Density, fibre volume fraction and void content values were analysed and are reported in the
following section. An overview of the physical properties of continuous fibre composites and
short-fibre composites manufactured by the fibre chopper are compared in Table 11.
Continuous fibre Short-fibre
Test Glass fibre
1200 TEX
Glass fibre
2400 TEX
Carbon
fibre
Out-of-shelf
-life carbon
fibre
Glass
fibre 1
Glass
fibre 2
Carbon
fibre 1
Carbon
fibre 2
Sample
Density
(kg/m3)
1941.59
(50.42)
1953.67
(32.87)
1420.22
(31.51)
1428.67
(22.92)
2101.53
(37.73)
2052.05
(38.26)
1599.81
(77.91)
1493.94
(4.69)
Fibre
volume
fraction
(%)
52.46
(3.44)
53.55
(1.35)
64.75
(8.41)
64.03
(8.16)
67.04
(3.00)
63.13
(1.73)
61.75
(6.37)
60.32
(7.19)
Void
content
(%)
1.9
(0.74)
1.83
(0.44) n/a n/a
3.09
(1.99)
2.03
(1.18) n/a n/a
Table 11 A summary of the physical properties of glass fibre and carbon fibre composites as
continuous fibre and short-fibres composites.

82
6.5.2.1 Density
Figure 49 shows the density of glass and carbon fibre composites with standard error bars.
The results show that glass fibres have a higher density than the carbon fibre. This was
expected due to the higher density of glass fibre. It is seen that each material shows
comparable density values irrespective of fibre length where the error bars are negligible.
Figure 49 Density of continuous fibre and short-fibre composites.
0
500
1000
1500
2000
2500
Gla
ss-f
ibre
120
0 T
EX
Gla
ss-f
ibre
240
0 T
EX
Car
bon f
ibre
Out-
of-
shel
f-li
fe c
arbon
fibre
Gla
ss f
ibre
1
Gla
ss f
ibre
2
Car
bon f
ibre
1
Car
bon f
ibre
2Continuous fibre Short-fibre
Den
sity
(kg/m
3)
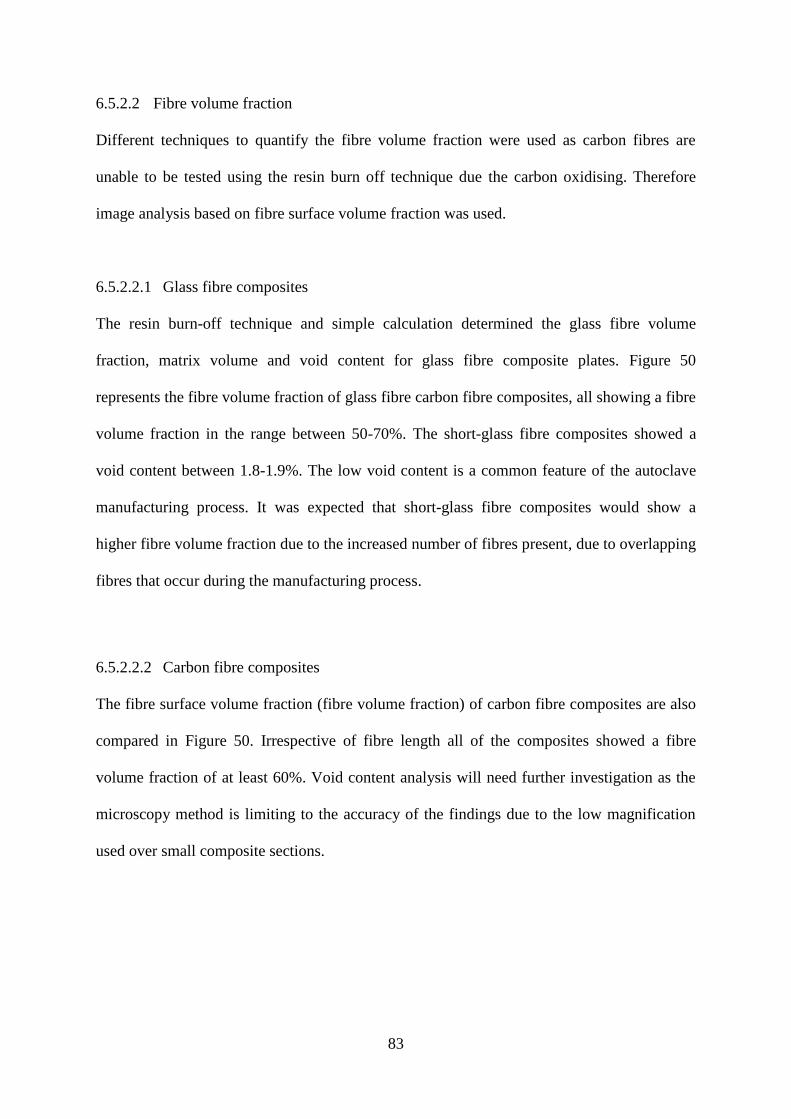
83
6.5.2.2 Fibre volume fraction
Different techniques to quantify the fibre volume fraction were used as carbon fibres are
unable to be tested using the resin burn off technique due the carbon oxidising. Therefore
image analysis based on fibre surface volume fraction was used.
6.5.2.2.1 Glass fibre composites
The resin burn-off technique and simple calculation determined the glass fibre volume
fraction, matrix volume and void content for glass fibre composite plates. Figure 50
represents the fibre volume fraction of glass fibre carbon fibre composites, all showing a fibre
volume fraction in the range between 50-70%. The short-glass fibre composites showed a
void content between 1.8-1.9%. The low void content is a common feature of the autoclave
manufacturing process. It was expected that short-glass fibre composites would show a
higher fibre volume fraction due to the increased number of fibres present, due to overlapping
fibres that occur during the manufacturing process.
6.5.2.2.2 Carbon fibre composites
The fibre surface volume fraction (fibre volume fraction) of carbon fibre composites are also
compared in Figure 50. Irrespective of fibre length all of the composites showed a fibre
volume fraction of at least 60%. Void content analysis will need further investigation as the
microscopy method is limiting to the accuracy of the findings due to the low magnification
used over small composite sections.
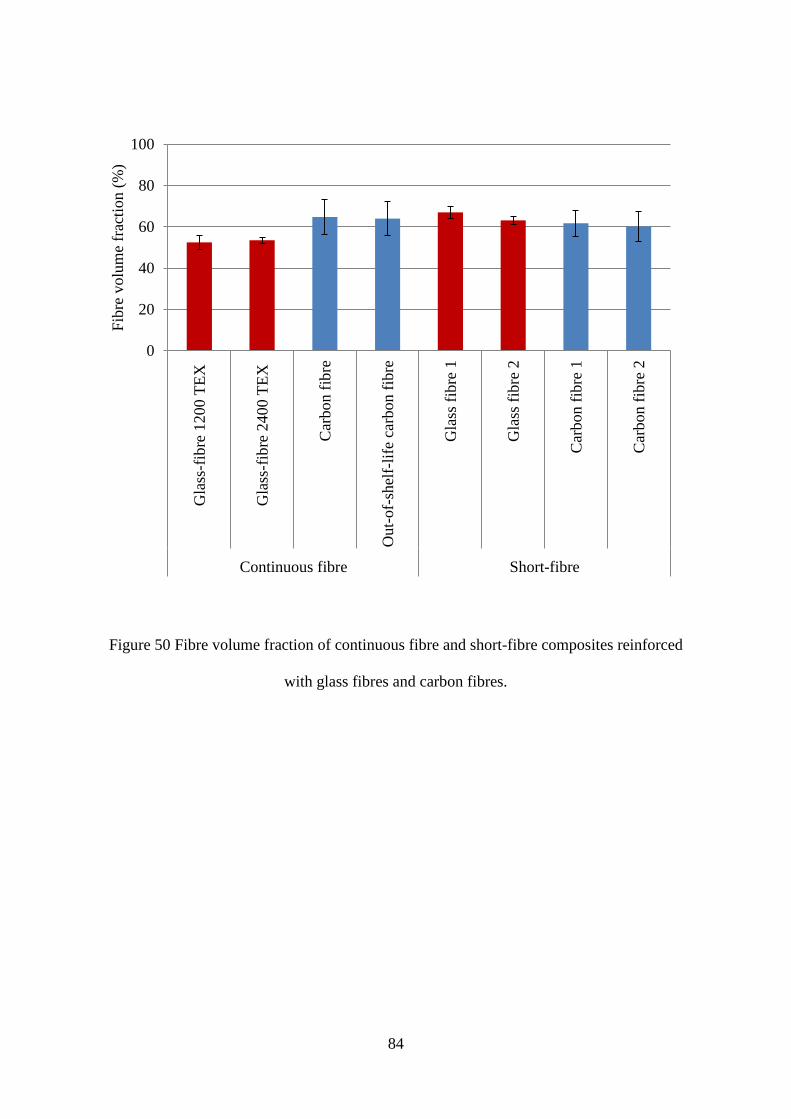
84
Figure 50 Fibre volume fraction of continuous fibre and short-fibre composites reinforced
with glass fibres and carbon fibres.
0
20
40
60
80
100
Gla
ss-f
ibre
1200 T
EX
Gla
ss-f
ibre
2400 T
EX
Car
bon f
ibre
Out-
of-
shel
f-li
fe c
arbon f
ibre
Gla
ss f
ibre
1
Gla
ss f
ibre
2
Car
bon f
ibre
1
Car
bon f
ibre
2
Continuous fibre Short-fibre
Fib
re v
olu
me
frac
tio
n (
%)
85
6.5.3 Mechanical properties
6.5.3.1 Tensile strength
Figure 51 shows the variations of the tensile strength as a function of the composite materials
for continuous fibres and short-fibres. Continuous fibre composites made by glass fibre and
carbon fibres showed enhanced tensile strength when compared to short-fibre composites, see
Table 12. Moreover, it can be seen that the strength of short-carbon fibre composites are
higher than those of short-glass fibre composites. This is because carbon fibres have a much
higher strength than glass fibres. However, the scatter of the data for short-carbon fibre
composites is larger than that for short-glass fibre composites. The reasoning for this are not
known at present.
6.5.3.2 Failure strain
The failure strains of continuous fibre composites and short-fibre composites are presented in
Figure 52. It can be seen that as the fibre length decreases in the short-fibre composites, the
composite failure strain decreases for both glass fibre composites and carbon fibre
composites. In addition, the failure strains of glass fibre composites are higher than those of
carbon fibre composites. The reduction in failure strain maybe caused by matrix cracking,
that forms at the ends of the fibres. Consequently, as the strain is increased, more cracks form
progressively at the ends of shorter fibres. Initially this cracking can be accommodated by
load transfer to adjacent fibres which “bridge” the cracked region. Final failure occurs when
the extent of cracking across the weakest section of a specimen reaches a critical level when
the surrounding fibres and matrix can no longer support the increasing load.

86
Figure 51 Tensile strength of each composite material manufactured in the study.
Figure 52 Failure strain of continuous and short-fibre composites.
0.00
0.20
0.40
0.60
0.80
1.00
1.20
1.40
Gla
ss-f
ibre
1200 T
EX
Gla
ss-f
ibre
2400 T
EX
Car
bon f
ibre
Out-
of-
shel
f-li
fe c
arbon
fibre
Gla
ss f
ibre
2
Car
bon f
ibre
1
Car
bon f
ibre
2
Continuous fibre Short-fibre
Ten
sile
Str
ength
(G
Pa)
0
1
2
3
4
Gla
ss-f
ibre
1200 T
EX
Gla
ss-f
ibre
2400 T
EX
Car
bon f
ibre
Out-
of-
shel
f-li
fe c
arbon
fibre
Gla
ss f
ibre
2
Car
bon f
ibre
1
Car
bon f
ibre
2
Continuous fibre Short-fibre
Fai
lure
Str
ain (
%)

87
6.5.3.3 Young’s Modulus
The variations of the Young’s Modulus of continuous fibre composites and short-fibre
composites as a function of fibre length are shown in Figure 53. It can be seen that the
modulus of carbon fibre composites are considerably larger. Furthermore the effect of fibre
length is insignificant to the Young’s Modulus for both carbon fibre composites and glass
fibre composites.
Figure 53 Young’s Modulus of continuous fibre and short-fibre composites.
0
10
20
30
40
50
60
70
80
90
100
Gla
ss-f
ibre
1200 T
EX
Gla
ss-f
ibre
2400 T
EX
Car
bon f
ibre
Out-
of-
shel
f-li
fe c
arbo
n f
ibre
Gla
ss f
ibre
2
Car
bon f
ibre
1
Car
bon f
ibre
2
Continuous fibre Short-fibre
Young's
Modulu
s (G
Pa)
88
Table 12 summarises the material properties of the continuous fibre and short-fibre
composites developed in this study. The resin system and manufacturing techniques were
common for all composites manufacture so direct comparison is possible. It is apparent that
the composites produced using the fibre chopper system exhibit comparable physical
properties to the continuous fibre composites.
It is accepted that the tensile properties of short-fibre composites will not be equivalent to
their long-fibre centre-point. The failure strain is closely related to the quality of the chopped
fibre-ends. As the number of fibre ends increase, the smaller the failure strain is. This is
because of the shear-stress at the ends of the short-fibres. However on inspection of the
Young’s Modulus, the performance of the short-fibre composite is comparable to that found
from the long-fibre composites.

89
Continuous fibre Short-fibre
Test Glass fibre
1200 TEX
Glass fibre
2400 TEX
Carbon
fibre
Out-of-shelf
-life carbon
fibre
Glass
fibre 1
Glass
fibre 2
Carbon
fibre 1
Carbon
fibre 2
Fibre volume
fraction
(%)
52
(3.4)
54
(1.4)
65
(8.4)
64
(8.2)
67
(3.0)
63
(1.7)
62
(6.4)
60
(7.2)
Void content
(%)
1.9
(0.7)
1.8
(0.4) n/a n/a
3.1
(2.0)
2.0
(1.2) n/a n/a
Sample
density
(kg/m3)
1942
(50.4)
1954
(32.9)
1420
(31.5)
1429
(22.9)
2102
(37.7)
2052
(38.3)
1600
(77.9)
1494
(4.7)
Tensile
strength
(GPa)
0.9
(0.1)
1.0
(0.1)
1.0
(0.2)
1.0
(0.3)
-
0.5
(0.1)
0.7
(0.2)
0.6
(0.1)
Failure strain
(%)
2.9
(0.6)
2.5
(0.2)
1.4
(0.2)
1.6
(0.3) -
1.6
(0.1)
0.9
(0.2)
0.8
(0.1)
Young's
modulus
(GPa)
39
(2.7)
44
(4.0)
69
(5.5)
81
(8.0) -
33
(2.0)
83
(2.1)
84
(6.3)
Table 12 A summary table of the physical and mechanical properties, comparing continuous
fibre and short-fibre composites.

90
6.6 Failure analysis
6.6.1 Visual inspection
Table 13 compares the failure type, failure area and failure loaction of both continuous and
short-fibre glass-fibre and carbon-fibre samples manufactured during the project. Visual
inspection showed the continuous samples have brittle fracture laterally, splitting through the
sample within the gauge length, inside the grip and at the end of the end-tab region. The
failure occurs at vaious locations as the spilt failure type is difficult to locate specific failure
regions. The short-fibre composites failed by splitting and in some instantance at an angle.
This indicates that fibre delamination may be influenced by mis-alignment of fibres within
the sample. Therefore it reiterates the importance to produce an alignment composite in
order to increase the mechanical properties and reduce the probability of failure. All of the
short-fibre composite samples failed in gauge area in the middle of the samples.
Table 13 Common tensile failure type, area and location of the different composite materials
tested.
Material Failure
Type Area Location
Continuous fibre composites
1200 TEX glass fibre Splitting End-tab and gauge length Middle
2400 TEX glass fibre Splitting Gauge length Middle
Carbon fibre Lateral and splitting Gauge length Various
Out-of-shelf-life carbon
fibre Splitting
Gauge length and inside
grip Various
Short-fibre composites
Glass fibre 2 Splitting and angled Gauge length Middle
Carbon fibre 1 Splitting and angled Gauge length Middle
Carbon fibre 2 Splitting and angled Gauge length Middle

91
6.6.2 Fractography (SEM)
The micrographs presented in this section represent typical failure modes that were observed
in the various samples when tested. The SEM micrographs of the fracture surfaces of
short-fibre carbon fibre composites and continuous carbon fibre composites are shown,
respectively, in Figure 54 to Figure 57.
Figure 54 represents a continuous carbon fibre composite that was tested to tensile failure
where transverse and longitudinal failure had occurred. Micrographs of the longitudinal
failure are shown in Figure 54a where fibres show a ‘clean’ surface. The matrix damage is
more extensive for the continuous fibre composites where greater amounts of debris and
transverse cracking have occurred from the delamination.
Figure 54b represents a micrograph of a transverse fracture of the above mentioned
carbon-fibre sample. Within the micrograph numerous locations of fibre pull-out are
observed. This is due to the increase in load that is placed on the sample before a brittle
failure in the transverse direction. Fibre-matrix de-bonding has also been reported where the
adhesion between the interfaces of the two materials is unable to maintain adhesion.
The brittle fracture of the matrix was observed in both short-fibre composites and continuous
fibre composites which were consistent with the brittle nature of the tensile stress-strain
curves for the two types of composites. It can be seen from the micrographs that most fibres
are pulled out from the matrix during failure.
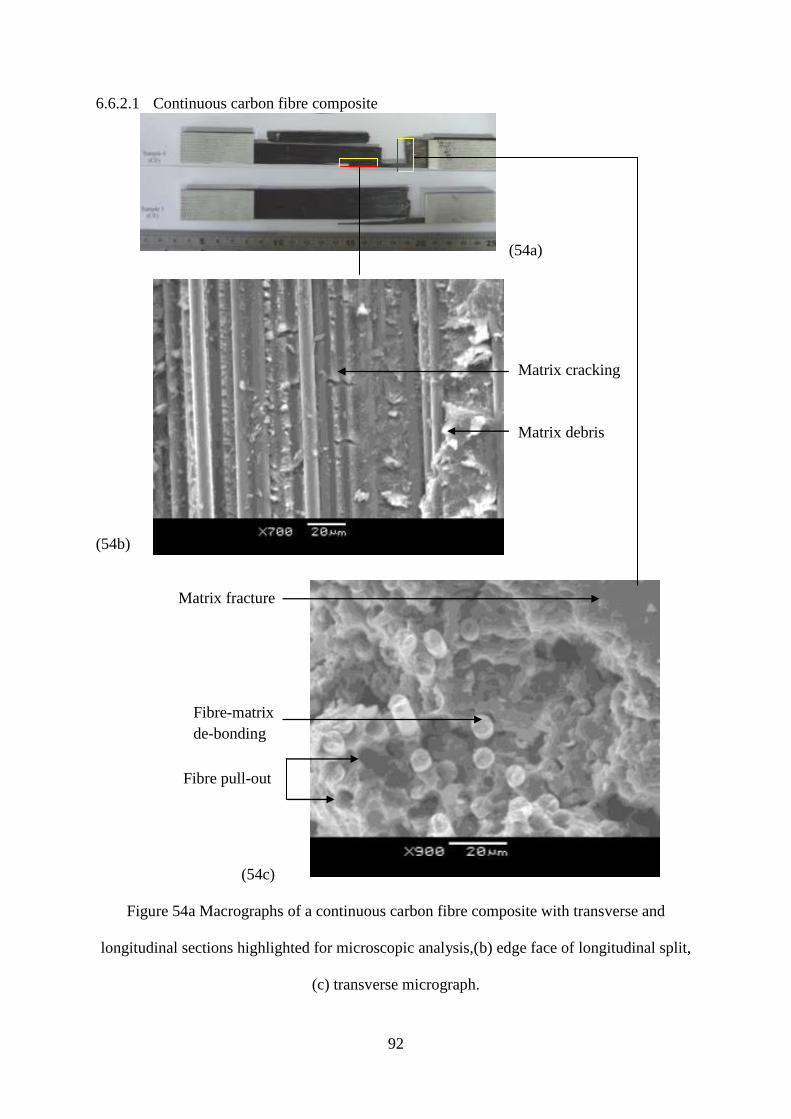
92
6.6.2.1 Continuous carbon fibre composite
(54a)
(54b)
(54c)
Figure 54a Macrographs of a continuous carbon fibre composite with transverse and
longitudinal sections highlighted for microscopic analysis,(b) edge face of longitudinal split,
(c) transverse micrograph.
Matrix debris
Matrix cracking
Matrix fracture
Fibre pull-out
Fibre-matrix
de-bonding

93
6.6.2.2 Short-carbon fibre composite
(55a)
(2b)
(55b) (55c)
(55d)
Figure 55a Micrograph of a failed short carbon fibre samples (b) transverse view,
(c) transverse view of laminate and (d) fibre ends at transverse failure.
Matrix plastic deformation
Fibre pull-out
Matrix damage
‘Clean’ fibre fracture
See Figure 56
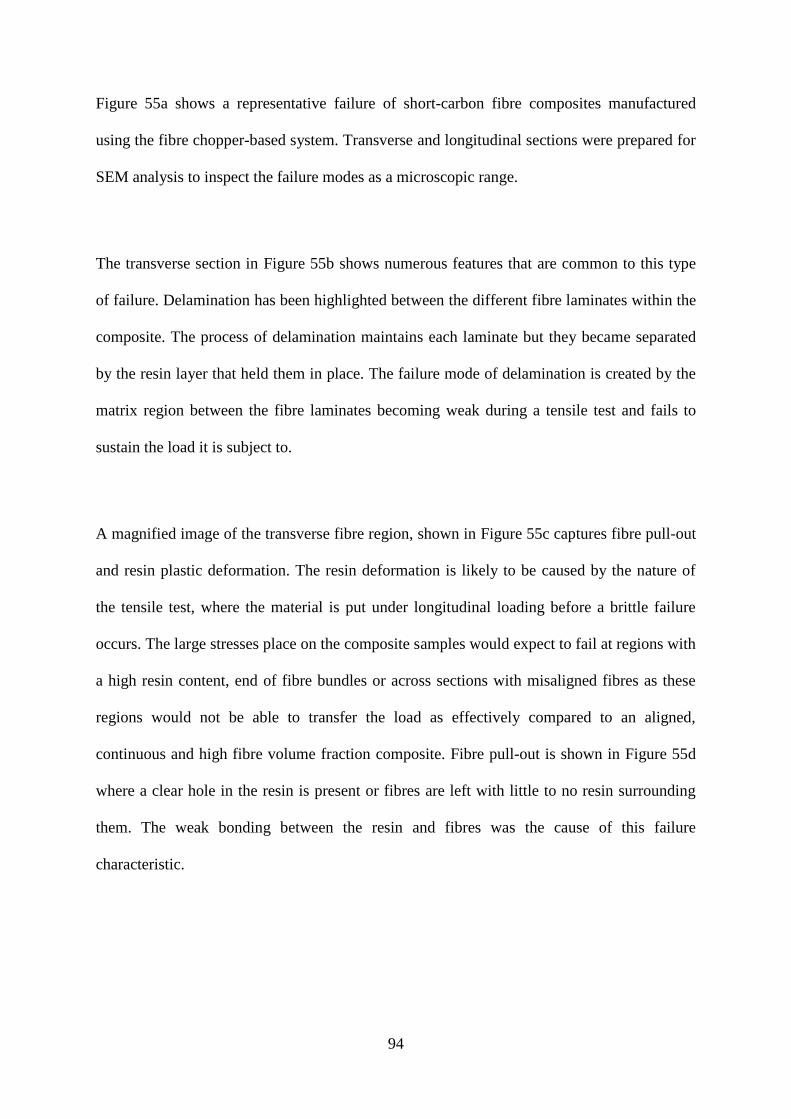
94
Figure 55a shows a representative failure of short-carbon fibre composites manufactured
using the fibre chopper-based system. Transverse and longitudinal sections were prepared for
SEM analysis to inspect the failure modes as a microscopic range.
The transverse section in Figure 55b shows numerous features that are common to this type
of failure. Delamination has been highlighted between the different fibre laminates within the
composite. The process of delamination maintains each laminate but they became separated
by the resin layer that held them in place. The failure mode of delamination is created by the
matrix region between the fibre laminates becoming weak during a tensile test and fails to
sustain the load it is subject to.
A magnified image of the transverse fibre region, shown in Figure 55c captures fibre pull-out
and resin plastic deformation. The resin deformation is likely to be caused by the nature of
the tensile test, where the material is put under longitudinal loading before a brittle failure
occurs. The large stresses place on the composite samples would expect to fail at regions with
a high resin content, end of fibre bundles or across sections with misaligned fibres as these
regions would not be able to transfer the load as effectively compared to an aligned,
continuous and high fibre volume fraction composite. Fibre pull-out is shown in Figure 55d
where a clear hole in the resin is present or fibres are left with little to no resin surrounding
them. The weak bonding between the resin and fibres was the cause of this failure
characteristic.
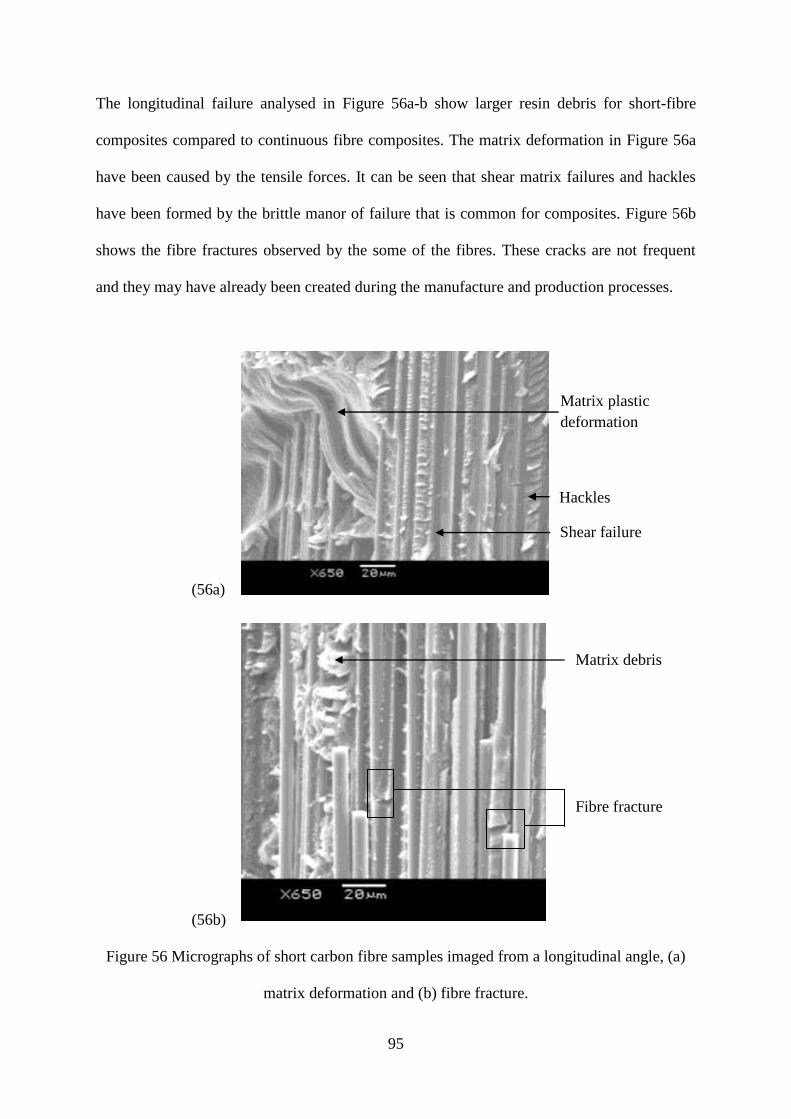
95
The longitudinal failure analysed in Figure 56a-b show larger resin debris for short-fibre
composites compared to continuous fibre composites. The matrix deformation in Figure 56a
have been caused by the tensile forces. It can be seen that shear matrix failures and hackles
have been formed by the brittle manor of failure that is common for composites. Figure 56b
shows the fibre fractures observed by the some of the fibres. These cracks are not frequent
and they may have already been created during the manufacture and production processes.
(56a)
(56b)
Figure 56 Micrographs of short carbon fibre samples imaged from a longitudinal angle, (a)
matrix deformation and (b) fibre fracture.
Matrix plastic
deformation
Hackles
Shear failure
Matrix debris
Fibre fracture
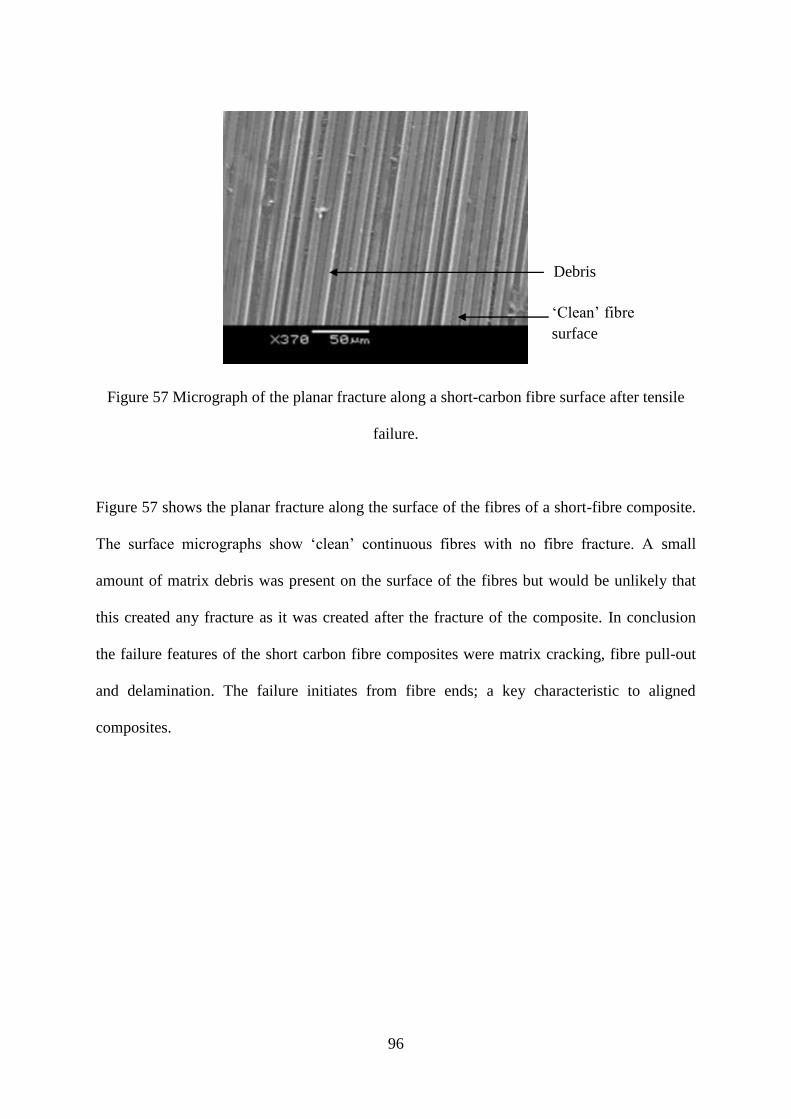
96
Figure 57 Micrograph of the planar fracture along a short-carbon fibre surface after tensile
failure.
Figure 57 shows the planar fracture along the surface of the fibres of a short-fibre composite.
The surface micrographs show ‘clean’ continuous fibres with no fibre fracture. A small
amount of matrix debris was present on the surface of the fibres but would be unlikely that
this created any fracture as it was created after the fracture of the composite. In conclusion
the failure features of the short carbon fibre composites were matrix cracking, fibre pull-out
and delamination. The failure initiates from fibre ends; a key characteristic to aligned
composites.
Debris
‘Clean’ fibre
surface
97
7 Conclusions
The study developed a novel method for manufacturing aligned short-fibre prepregs. The
fibre chopper technique possesses numerous factors that influence the quality and control of
the fibre delivery, orientation and content. Ensuring the greatest control and achieving a
compromise between the parameters ensures the composite quality is maintained.
Additionally it is apparent by using simple visual analysis methods the fibre chopper can
produce glass fibre and carbon fibre prepregs with desirable fibre volume fractions and a
fibre alignment of at least 70%.
Based on the findings, control of the parameters is critical to the production of composites
with the desired properties. In this report, the quality of the fibre chopper blades were
investigated, concluding a used blade causes more debris and damage to the fibre end.
Determining regular blade replacement is critical to sustain overall material properties. To
ensure the quality of the fibre end is at a most desirable state, a logically approach has been
stated to find a balance between blade wear and the point of blade replacement.
The eight-ply short-fibre composites boast comparable physical properties to their
unidirectional continuous fibre composite counter-parts. Experimentally determined
mechanical properties also compare favourably to alternative short-fibre alignment methods
stated in the literature. This suggests that the technique developed in this study is suitable for
producing an aligned short-fibre composite.
It was found that the dominate fracture features of the short-fibre composites include fibre
pull-out, ply delamination and matrix cracking; common observations in fractured tensile
samples with aligned fibres.
Overall the fibre chopper-based delivery system has demonstrated a successful approach to
recycling waste continuous fibres. The novel technique has shown that highly aligned short
glass fibre and short carbon fibres prepregs and composites can be manufactured.

98
8 Future Work
The method described in the current report, produces aligned and reproducible prepregs, but
it will be important to deliver good quality prepregs. Future work to follow on from this
report should be aimed at controlling the following areas to improve the current process: (i)
the prepreg hand-lay-up technique; (ii) chopper head set-up of the feeder roller, rubber anvil
and chopper-head; (iii) fibre delivery rate; and (iv) uniform fibre application on the resin
film.
This system also lends itself to investigations to expand on the current technique and
introduce new parameters into the system: (i) the influence of longer length fibres, (ii) the
increase in rate of prepreg production, (iii) build up hybrid composites containing glass fibre
and carbon fibres and (iv) develop the short-fibre composites to integrate small diameter
optical fibres to enable damage detection.
Overall it is critical that the purpose of any future experimental methods should aim to: (a)
improve on the manufacturing performance in terms of efficiency, (b) maintain or improve on
the current prepreg quality and (c) successfully recycle waste continuous fibres using the
fibre chopper system.

99
9 Appendices
9.1 Recycling
The implementation of European legislation in the composite industry requires that 85% of
composite waste must be recycled and reused by 2015 [1]. The increasing pressure from the
EU landfill directive [61] and UK landfill tax [62] encourage a diversion from landfill.
Landfill is traditionally one of the largest forms of waste disposal for FRPC. With taxes rising
by 33% to £32 per tonne for 2008 and increasing £8 per year until 2010 as well as EU
directives for disposal of waste [62] landfill costs are rapidly on the increase. Consequently
there is an urgent need to develop techniques to reuse, recycle or redevelop preforms and
composites. This will reduce the current disposal rate of preforms and composites, as 95%
were buried in landfill sites in the UK [1], while alternative routes such as reuse and
mechanical recycling account for the remainder [63].
The volume of waste produced by the whole composite market was estimated to the
156,000 tonnes in 2000, with approximately 70% from end-of-life waste and the remaining
30% from production; with projections doubling by 2015 [64].
Environmental factors are one of the more critical factors affecting the composite industry,
due to the lack of clear recycling routes available. To make recycling procedures as easy and
cost effective as possible, composite waste needs to be recovered in as clean and pure a
condition as is feasible. However this can be difficult to achieve from the adhesion of fibres
to resin. The process to clean and label materials can be a costly and labour intensive
procedure where the effects can also lead to contamination. The safe and green disposal of
composites is an increasing concern to many of the composite producers and users when
products begin to reach their service end of life.
100
Current production of carbon fibre tow is at a global rate of 27,000 tonnes each year, as well
as costing upwards of £10,000 per tonne if new [65] so recyclability of carbon fibre tows and
composites is an advantage. Key factors which are limiting recycling process methods are
techniques to remove the epoxy resin whilst maintaining the fibre quality and properties. A
method such as pyrolysis, thermally degrades the epoxy resin by a reduction reaction, that is
now used by Recycled Carbon Fibre (UK). Chemical removal of the epoxy matrix is also
being investigated (University of Nottingham) which uses a solvent to effectively strip the
fibres but maintain the strength and stiffness they originally had [65]. Typical applications
that will benefit from recycling carbon fibre could be for light weight body panels, chassis etc
in the automotive sector as well as marine, aerospace and other industries [65].
A report from Lucintel (Dallas Texas) [17] has stated that the demand for short-fibre
thermoplastic composites has steadily increased, passing $4.3 billion in 2008. Glass fibre
usage has reached the regional of 2.3 million tonnes worldwide per year [66] with the UK
producing 240,000 tonnes of composite products in 2000 [31]. With production values
increasing each year and the EU legislation to reduce the amount of composite waste in
landfill recycling techniques are necessary. These changes over time have lead to increased
demand to improve recyclability of waste fibres which has introduced many techniques that
fabricate aligned short-fibre thermosetting composites.

101
Recycling techniques of composite waste can be grouped into four main categories [67]:
Primary recycling – conversion of waste into material having properties which are
equivalent to the original material.
Secondary recycling – conversion of waste to material which has inferior properties to
the original material.
Tertiary recycling – conversion of waste into chemicals and fuel.
Quaternary recycling – conversion of waste into energy by incineration.
The most attractive recycling option is to recycle waste into material with equivalent
properties that are comparable to the original material. Successful composite recycling
requires incentives, infrastructure, recycling techniques and market commitment [67].
Current preform recycling efforts are dominated through two main techniques:
(i) comminution techniques where preforms are ground, chipped, or flaked into a powder size
that can be used as a filler material for polymer processing; and (ii) thermal techniques which
can recover fibres to be then chopped into short-fibres to produce sheet-moulded compounds
(SMC) or dough-moulded composites (DMC). Thermal techniques can also recover energy
and chemical compounds from the polymer materials.

102
10 References
1 GPRMC. EU Waste legislation becoming more severe, Press release 2001
<www.gprmc.be/PressReleases.htm> viewed 20/1/11.
2 Cantwell, W.J., Morton, J. The impact resistance of composite materials: A review. Journal
of Composites 1991: 22:347-362.
3 Hull, D., Clyne, T.W. An introduction to composite materials. Cambridge University press,
1992 Ed 2.
4 Nam-Jeong, L., Jang, J. The effect of fibre-content gradient on the mechanical properties of
glass-fibre-mat/polypropylene composites. Composites Science and Technology
2000:60:209-217.
5 Stewart, R. Carbon fibre composites poised for dramatic growth.
<http://www.reinforcedplastics.com/view/1464/carbon-fibre-composites-poised-for-dramatic-
growth/> viewed 12.4.11.
6 Tarr. A. Polymer basic. Basic principles of materials 2007.
<http://www.ami.ac.uk/courses/topics/0209_pme/index.html> viewed 10.11.11.
7 Piggot. M. R. Load bearing fibre composites. Kluwer. 2002:2:251-253.
8 Bora, M.O., Coban, O., Sinmazcelik, T., Gunay, V. Effect of Fiber Orientation on Scratch
Resistance in Unidirectional Carbon-Fiber-Reinforced Polymer Matrix Composites. Journal
of Reinforced Plastics and Composites 2010:29:1476 – 1490.
9 Wong, D.W.Y., Lin, L., McGrail, P.T., Peijs,
T., Hogg, P.J. Improved fracture toughness of
carbon fibre/epoxy composite laminates using dissolvable thermoplastic fibres. Composites
Part A: Applied Science and Manufacturing 2010:41:759-767.
10 Composites-by-design. bridging the gap between art & technology with carbon fibre.
Composite Processes. The Manufacturing Process. Rendering courtesy Verisurf Software
<http://composites-by-design.com/?page_id=61> viewed 03.05.11.
11 Pandita, S.. Smith, C.. S-Gale, N., Paget, M., Allen, J.M., Fernando, G.F. “Clean” Filament
Winding: A New Manufacturing Process’ 2007.

103
12 Starr, T.F. Pultrusion for engineers. Woodhead publishing Ltd. Pg 24-26.
13 Cantwell, W. J, Morton, J. Detection of Impact Damage in CFRP Laminates. Composite
Structures 1985:3:241-257.
14 Harper, L.T., Turner, T.A., Martin, J.R.B., Warrior, N.A. Fiber Alignment in Directed
Carbon Fiber Preforms - Mechanical Property Prediction. Journal of Composite Materials
2010:44:931-951.
15 Short, G.J., Guild, F.J., Pavier, M.J. Delaminations in flat and curved composite laminates
subjected to compressive load. Composite Structures 2002:58:249–258.
16 Curtis, P.T., Bader, M.G., Bailey, J.E. The stiffness and strength of a polyamide
thermoplastic reinforced with glass and carbon fibres. Journal of Materials Science
1978:1:377-390.
17 Lucintel. Six short-fiber thermoplastics suppliers are analyzed, with SABIC and DuPont
identified as market leaders. Composites World
<http://www.compositesworld.com/news/lucintel-report-assesses-short-fiber-thermoplastics-
market > 2009 viewed 11.01.11.
18 Milewski, J.V. “Short Fiber Reinforcement: Where the Action is Plastics Compounding.
1979:17-37.
19 Taib, R.M. Cellulose fiber-reinforced thermoplastic composites: processing and products
characteristics. Thesis. Virginia Tech, Blacksburg 1998:123.
20 Mouhmid, B., Imad, A., Benseddiq, N., Benmedakhène, S., Maazouz, A. A study of the
mechanical behaviour of glass fibre reinforced polyamide 6, 6: Experimental investigation.
Polymer testing 2006:25:544-552.
21
Harper, L.T., Turner, T.A., Martin, J.R.B., Warrior, N.A. Fiber Alignment in Directed
Carbon Fiber Preforms - A Feasibility Study. Journal of Composite Materials. Published
online 15.10.08.
104
22
Flemming, T., Kress, G., Flemming, M. A new aligned short-carbon-fiber-reinforced
thermoplastic prepreg. Journal of Advanced Composite Materials 1995:5:151-159.
23 Fu, S.Y., Lauke, B.. Effects of fiber length and fiber orientation distributions on the tensile
strength of short-fiber-reinforced polymers. Composite Science Technology
1996:56:1179-1190.
24 Thomason, J. The influence of fibre length and concentration on the properties of glass
fibre reinforced polypropylene: 5. Injection moulded long and short fibre polypropylene.
Composite.Part A 2002:33:1641-1652.
25 Choi, N. S., Takahashi, K. Stress fields on and beneath the surface of short-fibre-reinforced
composites and their failure mechanisms. Composites Science and Technology
1992:43:237-244.
26 Tsuji, N., Springer, G,S., Hegedus, I. The Drapability of Aligned Discontinuous Fiber
Composites. Journal of Composite Materials 1997:31:428-465.
27 Bowen, C.R., Dent. A.C., Nelson, L. J., Stevens, R., Cain, M.G., Stewart. M. Failure and
volume fraction dependent mechanical properties of composite sensors and actuators. Journal
of Mechanical Engineering Science 2006:220:1655-1663.
28
Epaarachchi, J., Ku, H., Gohel, K. A simplified empirical model for prediction of
mechanical properties of random short fiber/vinylester composites. Journal of Composite
Materials 2010:44:779-788.
29 MacLaughlin, T. F., Barker, R. M. Effect of modulus ratio on stress near a discontinuous
fibre. Experimental Mechanics 1972:12:178.
30 Tucker, C.L., Liang, E. Stiffness prediction for unidirectional short-fiber composites:
review and evaluation. Composite Science and Technology 1999:59:655-671.
31 Harper, L.T., Turner, T.A., Martin, J.R.B., Warrior, N.A. Fiber alignment in directed
carbon fibre performs – a feasibility study. Journal of Composite Materials 2009:43:57-74.
105
32
Fu, S.-Y, Lauke, B, Mäder, E, Yue, C.-Y, Hu, X. Tensile properties of short-glass-fiber and
short-carbon-fiber-reinforced polypropylene composites. Composites Part A: Applied science
and Manufacturing 2000:31:1117-1125.
33 Price, C.D., Hine, P.J., Whiteside, B., Cunha, A.M., Ward, I.M. Modelling the elastic and
thermoelastic properties of short-fibre composites with anisotropic phases. Composites
Science and Technology 2005:66:69-79.
34 Hine, P. J., Duckett, R.A., Davidson, N., Clarke, A.R. Modelling of the elastic properties of
fibre reinforced composites. I: orientation measurement. Composites Science and Technology
1992:47:65-73.
35 Zak, G., Haberer, M., Park, C. B., Benhabib, B. Mechanical properties of short-fibre
layered composites: Prediction and experiment. Rapid Prototyping Journal 1999:6:107-118.
36 Sirkis, J. S., Lo, Y. L., Nielsen, P. L. Phase-strain model for polarimetric strain sensors
based on fictitious residual strains. Journal of Intelligent Material Systems and Structures
1994:5:494-500.
37 Charrier, J. M., Ciplijauskas, R.V., Doshi, S. R., Hamel, F.A. ANTEC 1986:939-943.
38 Itoh, T., Hirai, H., Isomura, R. Journal of Japan Institute of Light Metals 1998:38:620-625.
39 Yamashita, S., Hatta, H., Sugano, T., Murayama, K. Fiber orientation control of short-fibre
composites: experiment. Journal of Composite Materials 1989:23:32-41.
40 Bozarth, M. J., Gillespie Jr, J.W., McCullough, R,L. ANTEC 1986:568-572.
41 Jackson, W. C, Advani, S.G, Tucker, C.L. Predicting the orientation of short fibers in thin
compression mouldings. Journal of Composite Materials 1986:20:539-557.
42 Kacir, L., Narkis, M., Ishai, O. Oriented short glass-fiber composites: Preparation and
statistical analysis of aligned fiber mats. Polymer Engineering Science 1975:15:525-537.

106
43
Edwards, H., Evans, N.P. Advances in Composite Materials; proceeding of the third
international conference on composite materials 1980:2:1620-1635.
44 Hannant, D.J., Spring, N. Magazine of Concrete Research 1974:26:47-48.
45 Richter, H. Advances in Composite Materials; proceedings of the third international
conference on composite materials 1980:1:387-398.
46 Papathanasiou, T.D., Guell, D.C. Flow induced alignment in composite materials.
Woodhead publishing 1997.
47 Guell, D. C., Graham, A.L. Improved mechanical properties in hydrodynamically aligned,
short-fibre composite materials. Journal of Composite Materials 1996:30:2-12.
48 Fara, S., Pavan, A. Fibre orientation effects on the fracture of short fibre polymer
composites: on the existence of a critical fibre orientation on varying internal material
variables. Journal of Materials Science 2004:10:3619-3628.
49 Calverty, P., Lin, T.L., Martin, H. Extrusion freeform fabrication of chopped-fibre
reinforced composites. High Performance Polymers 1997:9:449-456.
50 Sanomura, Y., Kawamura, M. Fiber orientation control of short-fiber reinforced
thermoplastics by ram extrusion. Polymer Composites 2003:24:587-596.
51 Sanomura, Y., Hayakawa, K., Mizuno, M., Kawamura,M. Effects of process conditions on
Young's modulus and strength of extrudate in short-fiber-reinforced polypropylene. Polymer
Composites 2007:28:29-35.
52 Peng, J., Lin, L.T., Calvert, P. Orientation effects in freeformed short-fiber composites.
Composites Part A: Applied Science and Manufacturing 1999:30:133-138.
53 Chirdon, W. M., O’Brien, W. J., Robertson, R. E. Fraunhofer diffraction of
short-fiber-reinforced composites aligned by an electric field. Electrostatics. Dental Materials
2006:22:107-11.
107
54
Dodworth, A. Bentley motors develops unique directional carbon fibre preforming process
for chassis rails. SPE Automotive Composites Conference & Exhibition 2009.
55
Turner, T.A., Warrior, N.A., Pickering, S. High performance composite materials from
recycled carbon fibre. National composite network 2007.
<http://ncn-uk.co.uk/DesktopModules/ViewDocument.aspx?DocumentID=691> viewed
24.06.11.
56
Hassan, A., Yahya, R., Yahaya, A.H., Tahir, A.R. M., Hornsby, P. R. Tensile, impact and
fiber length properties of injection-molded short and long glass fiber-reinforced
polyamide 6,6 composites. Journal of Reinforced Plastics and Composites 2004:23:969-986.
57
ASTM D2584 (2002).
58
ASTM D2734 (2003).
59
ASTM D3039 (2008).
60
Jameson, N.L. Production and evaluation of aligned short-fibre composites. Final Year
Project. University of Birmingham. 2010.
61
Waste: Commission calls time on sub-standard landfills in the EU. 1999
<http://europa.eu/rapid/pressReleasesAction.do?reference=IP/09/1154&format=HTML&age
d=0&language=EN&guiLanguage=en> viewed 27.02.11.
62 Landfill tax 2010
<http://archive.defra.gov.uk/environment/waste/topics/index.htm#landfill> viewed 31.05.11.
63 GPRMC JEC- Press release: the green FRP label 2003
<http://www.gprmc.be/PressRelease.htm> viewed 19.1.10.
64 Harbers, F. Green recycling label- The step towards closing the loop, 3
rd automotive
seminar France 2002.
65 Marsh, G. Recycling carbon fibre composites. Reinforced Plastics.com 22.04.09.
66 NNFCC 2007 <http://www.nnfcc.co.uk/metadot/index.pl?id=2718> viewed 25.0411.

108
67 Halliwell,S. End of life options for composite waste. Recycle, reuse or dispose? National
composite network best practice guide 2006 <http:/ww.netcomposites.com/> viewed
31.05.11.