production of activated carbon from sludge and herb ...€¦ · production of activated carbon from...
TRANSCRIPT

PEER-REVIEWED ARTICLE bioresources.com
Yu et al. (2019). “Activated carbon from sludge,” BioResources 14(1), 1333-1346. 1333
Production of Activated Carbon From Sludge and Herb Residue of Traditional Chinese Medicine Industry and Its Application for Methylene Blue Removal
Zhenwei Yu,a Qi Gao,b Yue Zhang,a Dandan Wang,b Innocent Nyalala,a and
Kunjie Chen a,*
Sludge-based activated carbon (SAC) was prepared with sewage sludge and Chinese medicine herbal residues (CMHR’s). An orthogonal experimental design method was used to determine the optimum preparation conditions. The effects of the impregnation ratio, activation temperature, activation time, and addition ratio of CMHR’s on the iodine value and Brunauer-Emmett-Teller surface area of activated carbon were studied. X-ray diffraction, Fourier-transform infrared spectrometer, and scanning electron microscopy were used to characterize the prepared SAC. The results showed that the optimal process conditions for preparing the SAC were as follows: an impregnation ratio of 1:4, an activation time of 30 min, an activation temperature of 700 °C, and an addition ratio of CMHR’s of 40%. The adsorption balance of the methylene blue dye was examined at room temperature. Adsorption isotherms were obtained by fitting the data using the Langmuir and Freundlich models, which showed that methylene blue adsorption was most suitable for the Langmuir equation. The results demonstrated that SAC prepared from SS and CMHR’s from a Chinese medicine factory could effectively expel dyes from wastewater.
Keywords: Format; Chinese medicine herbal residues; Sewage sludge; Activated carbon; Characterization
Contact information: a: College of Engineering, Nanjing Agricultural University, 40 Dianjiangtai Road,
Nanjing, Jiangsu 210031, China; b: SPH Xing Ling Sci. & Tech. Pharmaceutical Co., Ltd., 3500
Huqingping Road, Shanghai 201703, China; *Corresponding author: [email protected]
INTRODUCTION
Sewage sludge (SS) is an inevitable by-product of the sewage treatment process.
Its production has been sharply increasing with the development of urbanization and
industrialization (Smith et al. 2009). Meanwhile, SS is a type of colloidal sediment that
contains harmful pollutants, including heavy metals, pathogens, and microorganisms.
Nevertheless, the composition of SS may vary remarkably depending on the different raw
materials and process. Textile sludge is one such example of this; it contains many
chemical nutrients, heavy metals, and aromatic dyes (Sud et al. 2008). The main ingredient
of sludge that is produced from paper mills is lignocellulose. Without proper disposal
methods, SS can cause heavy environmental pollution. Many of the traditional methods,
such as landfill, anaerobic fermentation, incineration, and so forth, used to treat SS can
achieve specific and straightforward processing needs. However, these methods have
drawbacks, such as waste of resources and environmental pollution. Therefore, it is
important to find an effective and novel treatment method for the utilization of sludge (Devi
and Saroha 2017).

PEER-REVIEWED ARTICLE bioresources.com
Yu et al. (2019). “Activated carbon from sludge,” BioResources 14(1), 1333-1346. 1334
Chinese medicinal herbal residues (CMHRs) are the rejected materials formed from
the production of Chinese medicinal herbs (CMHs). These residues, along with Chinese
patent medicine and light chemical products of CMH, mainly result from the bulk
production of drug substances in pharmaceutical factories and drugstores (Gao et al. 2012).
The CMHRs are abundant in organic substances. In China, more than 30 million tons of
CMHRs are annually produced (Guo et al. 2013). Currently, the disposal methods of
CMHRs are handled mainly through stacking, incinerating, and landfilling, which not only
occupy a remarkable amount of land but also result in severe pollution of the environment
and a colossal waste of resources. Thus, research into the recycling of CMHRs is important
to improve the utilization of CMHRs, reduce resource waste, and promote the virtuous
cycle of the Chinese medicinal herbal industry (Li et al. 2018).
Activated carbon (AC), a type of inert porous support material, is widely used for
air purification and wastewater disposal due to its ability to distribute chemicals on sizeable
hydrophobic interior surfaces (Luo et al. 2016). The frequently-used production methods
involve physical activation and chemical activation. The advantages of chemical
activation, which is more famous for combining carbonization and activation, include
lower operating temperatures, high yields, more natural classification of the activating
reagent, and a higher surface area (Liu and Zhao 2012). It is worth mentioning that Kemmer
et al. (1971) first proposed the idea that sludge can be used for the preparation of AC.
However, the Brunauer-Emmett-Teller (BET) surface area of the prepared AC is so low
that the prepared AC made from SS is rarely used in industrial production. Some
carbonaceous substances have been added to the sludge to enhance the quality of AC. Tay
et al. (2001) mixed coconut shell with the sludge, and the BET surface area of the finished
product remarkably increased (Mahapatra et al. 2012). There is no doubt that adding
measureable materials in sludge can improve the performance of AC. In addition, the
resources of waste and sludge have been utilized. However, in the study of the preparation
of sludge-based activated carbon, research has not been conducted on the use of traditional
Chinese medicine pharmaceutical sludge and traditional Chinese medicine residue as raw
materials.
In this study, AC was prepared via the chemical activation of SS and medicinal
residue taken from a traditional Chinese medicine factory, using phosphoric acid. The
effects of activation temperature, activation time, impregnation ratio, and the addition of
medicinal residue on the performance and the yield of AC were studied. The BET surface
area and iodine adsorption value of AC were used as evaluation indexes for analysis, and
the best preparation technology was determined. Scanning electron microscopy (SEM),
Fourier transform infrared spectroscopy (FTIR), and X-ray diffraction (XRD) were used
to characterize the final production. Adsorption isotherms were determined by an
adsorption equilibrium experiment for methylene blue.
EXPERIMENTAL
Materials The SS used in this study came from the wastewater treatment plant of Shanghai
Apricot Science and Technology Pharmaceutical Co., Ltd. (Shanghai, China). The sewage
treatment system used an activated sludge system for secondary processing. The sludge
treatment was carried out using anaerobic digestion and a belt filter press, and the initial
moisture content of the sludge was 81.6%. The CMHRs were derived from dried ginkgo

PEER-REVIEWED ARTICLE bioresources.com
Yu et al. (2019). “Activated carbon from sludge,” BioResources 14(1), 1333-1346. 1335
leaves that were soaked in 60% ethanol solution and then continuously steam-ventilated.
After 6 h, the mixture was filtered and rinsed to obtain the sediments. All of the reagents
used in this experiment were analytical reagents. Meanwhile, distilled water was used to
prepare the solution. The SS and CMHRs characterization results of proximate and
ultimate analysis are shown in Table 1.
Table 1. The SS and CMHRs Characterization of Proximate and Ultimate Analysis
Sample Proximate analysis/ % Ultimate analysis/ %
Vd FC Ad Md C H O N S
SS 52.84 15.68 25.16 6.32 24.23 4.25 21.53 2.41 2.47
CMHR 72.59 14.65 8.23 4.53 53.72 7.74 33.68 1.25 0.36
SS = sewage sludge; CMHR = Chinese medicine herbal residues
Preparation of AC
The sludge was oven-dried at 110 ℃ until its weight was constant. After being
cooled, it was crushed to a diameter of < 200 μm. The CMHRs were dried for 24 h in the
oven at 80 ℃ and then crushed to a diameter of < 200 μm after cooling. The above two
samples were wholly mixed in a specified proportion to generate the precursors for
preparation. A certain proportion of phosphoric acid solution was added (the mass fraction
was 0.5), the samples were stirred, and then impregnated at room temperature for 24 h. The
samples were then placed in an oven at 110 ℃ for 12 h. The dried samples were then placed
into a tube furnace, with the heating rate set at 10 ℃/min, and the activation temperature
and activation time were adjusted according to the experimental needs. Both the heating
and cooling processes required a nitrogen inlet, and the nitrogen flow rate was 60 mL/min
until the tube furnace cooled down. The finished products were crushed, moderate
hydrochloric acid solution (0.1 mol/L) was added, and the samples were shaken and
washed with a shaker. After 12 h, the sludge was washed with warm distilled water until a
neutral pH was obtained. The final product was obtained after drying to constant weight at
110 ℃, ground to 200-mesh sized particles, and stored in desiccators for adsorption
experiments and characterization.
Methods Characterization of AC
The specific surface area and pore volume tests were performed based on the
measurements on the pore size of the obtained AC. The texture characteristics of the
biochar derived from the sludge were analyzed at 77 K using a surface area and porosity
analyzer (Tristar II 3020, Micromeritics, Shanghai, China). Nitrogen adsorption isotherms
were used to calculate the surface area, pore volume, and average pore size. The multi-
point Brunauer-Emmett-Teller method was used to calculate the surface area (Zhang and
Luo, 2018). The iodine number is a technique that is used to determine the adsorption
capacity of AC. The iodine value indicates the porosity of the AC, and it is defined as 1 g
of carbon-adsorbed iodine at the mg level. The iodine value, with reasonable accuracy, can
be used as an approximation of the surface area and microporosity of AC. It is a measure
of the level of activity (a higher number resulted in higher activation).
An XRD analysis was used to determine the presence of inorganic components in
AC. The X-ray diffractometer model used in this experiment was the XRD-6100
(Shimadzu, Tokyo, Japan). A FTIR analysis was used to study the functional groups on the

PEER-REVIEWED ARTICLE bioresources.com
Yu et al. (2019). “Activated carbon from sludge,” BioResources 14(1), 1333-1346. 1336
surface of the material. The model of the spectrometer used in this paper was the Nicolet
iN10 (Thermo Scientific, Nanjing, China) with a resolution of 4 cm-1 and an acquisition
rate of 20 min-1. Spectra were obtained in the range of 4000 cm-1 to 400 cm-1. The SEM
analysis was used to investigate the surface morphology and pore structure of the material
(Kacan and Kutahyali 2012). The model of the device was a Shimadzu SS 550 (Shimadzu,
Tokyo, Japan).
Adsorption isotherm
A total of 0.2 g of prepared AC was inserted into a dry 150-mL Erlenmeyer flask
and 50 mL of an absolute concentration of methylene blue solution was added. The initial
concentrations of the methylene blue solutions in Erlenmeyer flasks A, B, C, D, E, and F
were 50 mg/L, 100 mg/L, 200 mg/L, 300 mg/L, 400 mg/L, and 500 mg/L, respectively,
without adjusting the pH of the solution. Glass stoppers were used to cover the flasks before
they were placed in a constant temperature oscillator (temperature set to 30 °C, with an
oscillation frequency of 150 rpm) for 12 h until it reached equilibrium. The sample was
separated from the solution via filtration through a 0.45-μm filter. The filtrate was then
placed in a cuvette with a light path of 1 cm. The concentration of the filtrate was measured
using an ultraviolet (UV) spectrophotometer with a wavelength of 665 nm (UV-Vis-2800,
Unico, Shanghai, China). Each experiment was repeated under the same conditions. The
adsorption capacity qe (mg/g) of MB adsorbed at equilibrium was determined from Eq. 1,
w
VCCq e
e
0
(1)
where C0 and Ce (mg/L) are the liquid-phase concentrations of the dye initially and at
equilibrium, respectively, V (L) is the volume of the solution, and w (g) is the mass of
adsorbent used.
Adsorption kinetics
Add 3 g/L of prepared AC to 150 mg/L MB solution at room temperature, and shake
them at 30, 60, 90, 120, 150, 180, 210, 240, 270, 300, 330, 390, 450, and 510 min,
respectively, on the shaker, then filter them after shaking.
Experimental Design By checking the relevant literature, it can be seen that the activation time, activation
temperature, impregnation ratio, and addition ratio of CMHRs have specific effects on the
pore structure and adsorption characteristics of the prepared AC during the preparation of
sludge-based AC by phosphoric acid activation (Zhao and Zhou 2016). Therefore, the
orthogonal test design method was used in this study to determine the influence level of
various relevant factors in the preparation process of the sludge-based AC on the
performance of the prepared AC, as well as to determine the best preparation process. The
orthogonal experimental design method, a design method commonly used for multi-factor
and multi-level tests, can perform a statistical analysis on the test results of a few
experimental programs and obtain the optimal test plan and the impact of various factors
on the evaluation index (Li et al. 2016). Based on previous research results and relevant
data, this study used the iodine value and BET specific surface area as evaluation indicators
to determine the four-factor three-level orthogonal test L9 (34). The factors and levels of
the orthogonal test are shown in Table 2.

PEER-REVIEWED ARTICLE bioresources.com
Yu et al. (2019). “Activated carbon from sludge,” BioResources 14(1), 1333-1346. 1337
Table 2. Factors and Levels of the Orthogonal Experiment
Level Factor
Impregnation Ratio (mL/g)
Activation Time (min)
Activation Temperature (°C)
Addition Ratio of Dregs (%)
1 1:2 30 500 20
2 1:3 60 600 30
3 1:4 90 700 40
RESULTS AND DISCUSSION
Results of Experimental Design Table 3. Results of the Orthogonal Experiment
No.
A B C D Iodine Value (mg/g)
BET Specific Surface
Area (m2/g)
Impregnation Ratio (mL/g)
Activation Time (min)
Activation Temperature
(°C)
Addition Ratio of
Dregs (%)
1 1:2 90 500 20 502.96 894
2 1:4 60 600 30 518.52 764
3 1:4 90 700 40 696.31 957
4 1:3 30 600 40 674.85 881
5 1:2 60 500 40 526.54 808
6 1:4 30 500 20 678.19 921
7 1:3 60 700 20 534.08 876
8 1:2 30 700 30 565.12 842
9 1:3 90 500 30 508.57 754
Table 3 shows the header design and experimental results. The data in Table 3 was
subjected to orthogonal analysis, and the results are shown in Table 4. The higher the range
value, the more significant the influence of the factor on the index (Kacan 2016).
Table 4. Analysis of the Results of the Orthogonal Experiment
Evaluation Index
Analysis Item A B C D
Impregnation Ratio
Activation Time
Activation Temperature
Addition Ratio of Dregs
Iodine Value (mg/g)
k1 531.54 639.39 571.1 571.74
k2 572.5 526.38 565.44 530.74
k3 631.01 569.28 598.50 632.57
R 99.47 113.01 33.06 101.83
BET Specific Surface Area
(m2/g)
k1 848 881.33 827.67 897
k2 837 816 846.33 786.67
k3 880.67 868.33 891.67 882
R 43.67 65.33 64 110.33
Note: Ki in the table is the sum of the index values for each factor at the same level; k i is the average of the index values for each factor at the same level; R is the range value, which is the difference between the maximum and minimum values of ki

PEER-REVIEWED ARTICLE bioresources.com
Yu et al. (2019). “Activated carbon from sludge,” BioResources 14(1), 1333-1346. 1338
When the iodine value was used as an evaluation index, the primary and secondary
factors were as follows: activation time (B) > addition ratio of CMHRs (D) > impregnation
ratio (A) > activation temperature (C). A comparison of various factors showed that the
optimal combination was A3B1C3D3 when iodine value was used as the evaluation index.
When the BET surface area was used as an evaluation index, the primary and
secondary factors were as follows: addition ratio of CMHRs (D) > activation time (B) >
activation temperature (C) > impregnation ratio (A). A comparison of the various factors
showed that the optimal combination was A3B1C3D1 when the BET surface area was used
as the evaluation index.
In the experiment that used traditional Chinese medicine dregs to prepare sludge-
based activated carbon, and influencing degrees of different factors varied with respect to
each specific indicator. This was because the two methods differed in the measurement.
The iodine adsorption value is mainly used to characterize the microporous structure of the
AC, which is only a part of the specific surface. It is mainly used to indicate the adsorption
capacity of AC for small molecules. However, the BET surface area is the sum of the total
external surface of all particles, and it reflected the adsorption capacity of AC. Therefore,
the comprehensive balance method was used to determine the optimal program. For factors
A, B, and C, the optimal combination was A3B1C3. Factor D was the most critical factor
affecting the iodine value and should be given priority when determining the optimal level.
For iodine value, k3 was 10.64% higher than k1, and the difference was obvious. However,
for BET surface area, k1 was only 1.67% higher than k3, and the gap between these two
was small. Considering the above, it would be better to choose D3. In summary, under the
experimental conditions, the optimal process was as follows: impregnation ratio of 1:4,
activation time of 30 min, activation temperature of 700 ℃, and the addition ratio of
CMHRs of 40%.
The above optimal solution was obtained by orthogonal experimental results, but it
requires further verification to determine whether it is the optimal process condition. The
sludge-based AC prepared by the above-described optimal plan was marked as SAC. The
iodine value and BET surface area were 738.47 mg/g and 972 m2/g, respectively. These
results showed that an orthogonal experiment could optimize the preparation process of
AC.
Characterization of AC XRD analysis
The X-ray diffraction patterns of SS and SAC are shown in Fig. 1. There were two
diffraction peaks of SS and SAC at approximately 2θ = 22° to 25° and 42° to 45°, which
corresponded to the diffraction characteristic peaks of the carbon material (002) and the
graphite surface (100), respectively (Mahapatra et al. 2012). The peaks showed that
disordered graphite crystallites existed in both the SS and SAC. Compared with SS, the
(002) peak of SAC was slightly shifted to the right, and the diffraction angle is increased
by 2.188°. The interlayer spacing distance of SS and SAC could be calculated by Bragg's
Law, which were 0.443, 0.365 nm, respectively. Therefore, the interfacial spacing d002 of
the SAC was reduced, and the degree of graphitization was enhanced. The intensity of the
(100) diffraction peak of SAC was remarkably reduced because the activation process
caused the structure of the graphite crystal to be destroyed and resulted in a predominantly
disordered thin carbon sheet. At the same time, lower crystallite strength corresponded with
higher orientation freedom of the graphite crystallites, which in turn resulted in more pores
between the crystallites and higher activity of the AC. This caused a larger specific surface

PEER-REVIEWED ARTICLE bioresources.com
Yu et al. (2019). “Activated carbon from sludge,” BioResources 14(1), 1333-1346. 1339
area and a more porous structure that allowed the AC to have a better adsorption property
(Liu et al. 2014).
20 40 60 80
-100
0
100
200
300
400
500
600
700
800
900
1000
1100
1200
(002)
Inte
nsit
y (
a.u
.)
2(º)
SAC
SS
(100)
Fig. 1. XRD spectra of produced activated carbons and raw material
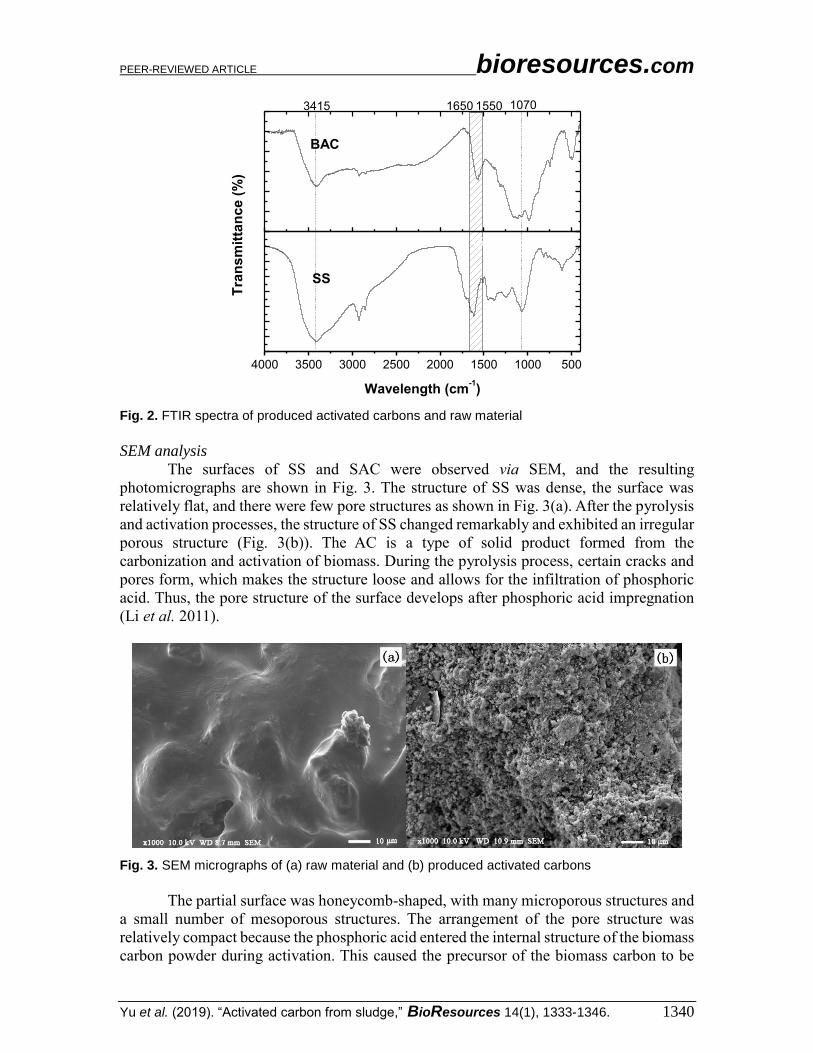
FTIR analysis
FTIR spectra were used to analyze the chemical structure and the change in
functional groups of the samples (Puziy et al. 2003). Figure 2 shows a noticeable difference
in the FTIR spectra between the SS and SAC. Compared with the SS, the number of
absorption peaks in the SAC spectra was remarkably reduced. This was because some
substances in the SS were decomposed and volatilized during the activation process. From
previous studies, the broad and strong peak from 2500 to 3600 cm-1 found in SS clearly
indicates the -COOH group. There is a deep broad absorption peak of around 3500 cm-1 to
3200 cm-1, which corresponds to the stretching vibration peak of the amino group (Sartova
et al. 2018), and it can superimpose the stretching vibration peaks of the hydroxyl groups
at 3500 cm-1 to 3300 cm-1. It can also be seen in Fig. 4 that SS and SAC had broad and
robust absorption peaks near 3415 cm-1, which corresponded to the vibration peaks of -OH
and -NH. The stretching vibration peaks of methyl (CH3) and methylene (CH2) located at
2920 cm-1 and 2850 cm-1 correspond to the aliphatic hydrocarbons in SS (Pallarés et al.
2018). In the SAC spectrum, the intensity of two peaks was remarkably weakened, which
indicated that the aliphatic hydrocarbons in SS were decomposed during the preparation
process of AC. Between 1650 cm-1 to 1550 cm-1, both the SS and SAC had broad absorption
peaks that corresponded to C=O bonds. This indicated that both sample surfaces contained
functional groups such as aldehydes, ketones, or carboxylic acids. However, the
transmittance of SAC decreased and shifted slightly to the right. The spectrum of SS
showed a broad peak at 1070 cm-1, which was caused by the stretching vibration of the C-
O-C bond in the ether substance and completely disappeared after activation. The peaks at
670 cm-1, 610 cm-1, and 490 cm-1 may be associated with conjugated C=C and C=N
functional groups. In summary, the surface of the SAC contained functional groups, such
as hydroxyl, aldehyde, aliphatic, and carboxylic acid groups, which can remove organic
pollutants through complexation reactions or ion exchange reactions with organic
substances.
PEER-REVIEWED ARTICLE bioresources.com
Yu et al. (2019). “Activated carbon from sludge,” BioResources 14(1), 1333-1346. 1340
Fig. 2. FTIR spectra of produced activated carbons and raw material
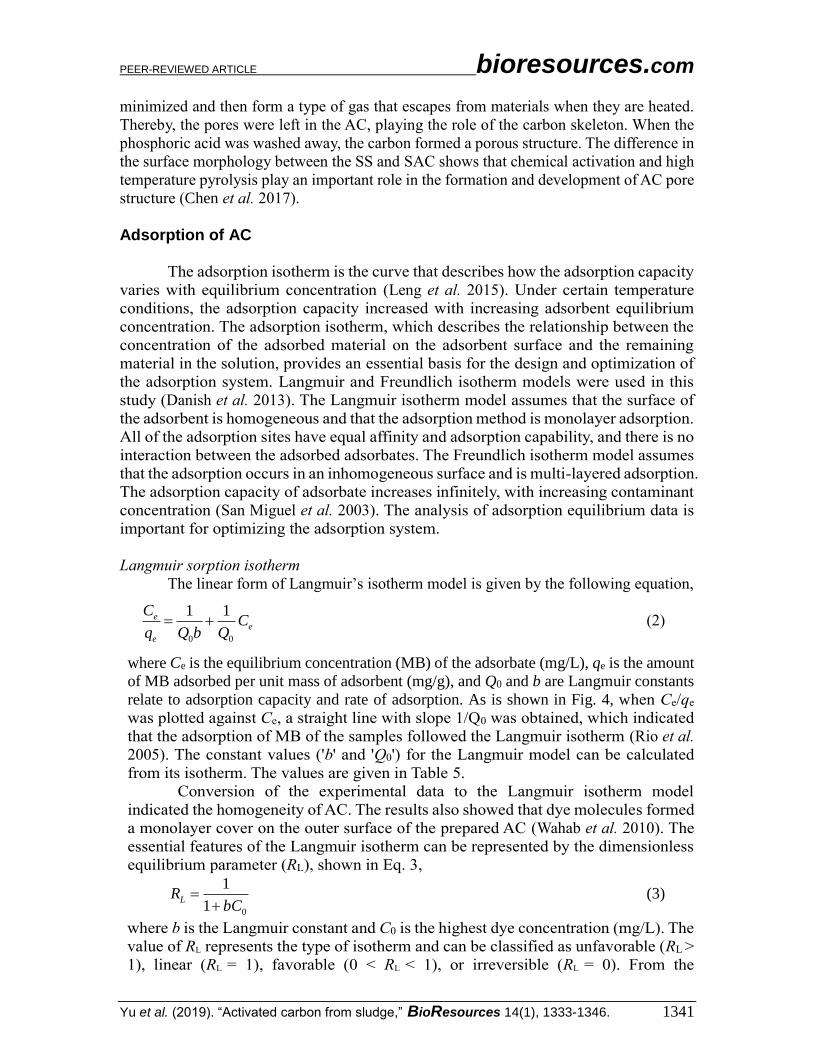
SEM analysis
The surfaces of SS and SAC were observed via SEM, and the resulting
photomicrographs are shown in Fig. 3. The structure of SS was dense, the surface was
relatively flat, and there were few pore structures as shown in Fig. 3(a). After the pyrolysis
and activation processes, the structure of SS changed remarkably and exhibited an irregular
porous structure (Fig. 3(b)). The AC is a type of solid product formed from the
carbonization and activation of biomass. During the pyrolysis process, certain cracks and
pores form, which makes the structure loose and allows for the infiltration of phosphoric
acid. Thus, the pore structure of the surface develops after phosphoric acid impregnation
(Li et al. 2011).
Fig. 3. SEM micrographs of (a) raw material and (b) produced activated carbons
The partial surface was honeycomb-shaped, with many microporous structures and
a small number of mesoporous structures. The arrangement of the pore structure was
relatively compact because the phosphoric acid entered the internal structure of the biomass
carbon powder during activation. This caused the precursor of the biomass carbon to be
4000 3500 3000 2500 2000 1500 1000 50050
60
70
80
90
100
110
4000 3500 3000 2500 2000 1500 1000 500
30
40
50
60
70
80
90
100
110
107015501650
BAC
3415
Tra
ns
mit
tan
ce (
%)
Wavelength (cm-1)
SS
PEER-REVIEWED ARTICLE bioresources.com
Yu et al. (2019). “Activated carbon from sludge,” BioResources 14(1), 1333-1346. 1341
minimized and then form a type of gas that escapes from materials when they are heated.
Thereby, the pores were left in the AC, playing the role of the carbon skeleton. When the
phosphoric acid was washed away, the carbon formed a porous structure. The difference in
the surface morphology between the SS and SAC shows that chemical activation and high
temperature pyrolysis play an important role in the formation and development of AC pore
structure (Chen et al. 2017).
Adsorption of AC
The adsorption isotherm is the curve that describes how the adsorption capacity
varies with equilibrium concentration (Leng et al. 2015). Under certain temperature
conditions, the adsorption capacity increased with increasing adsorbent equilibrium
concentration. The adsorption isotherm, which describes the relationship between the
concentration of the adsorbed material on the adsorbent surface and the remaining
material in the solution, provides an essential basis for the design and optimization of
the adsorption system. Langmuir and Freundlich isotherm models were used in this
study (Danish et al. 2013). The Langmuir isotherm model assumes that the surface of
the adsorbent is homogeneous and that the adsorption method is monolayer adsorption.
All of the adsorption sites have equal affinity and adsorption capability, and there is no
interaction between the adsorbed adsorbates. The Freundlich isotherm model assumes
that the adsorption occurs in an inhomogeneous surface and is multi-layered adsorption.
The adsorption capacity of adsorbate increases infinitely, with increasing contaminant
concentration (San Miguel et al. 2003). The analysis of adsorption equilibrium data is
important for optimizing the adsorption system.
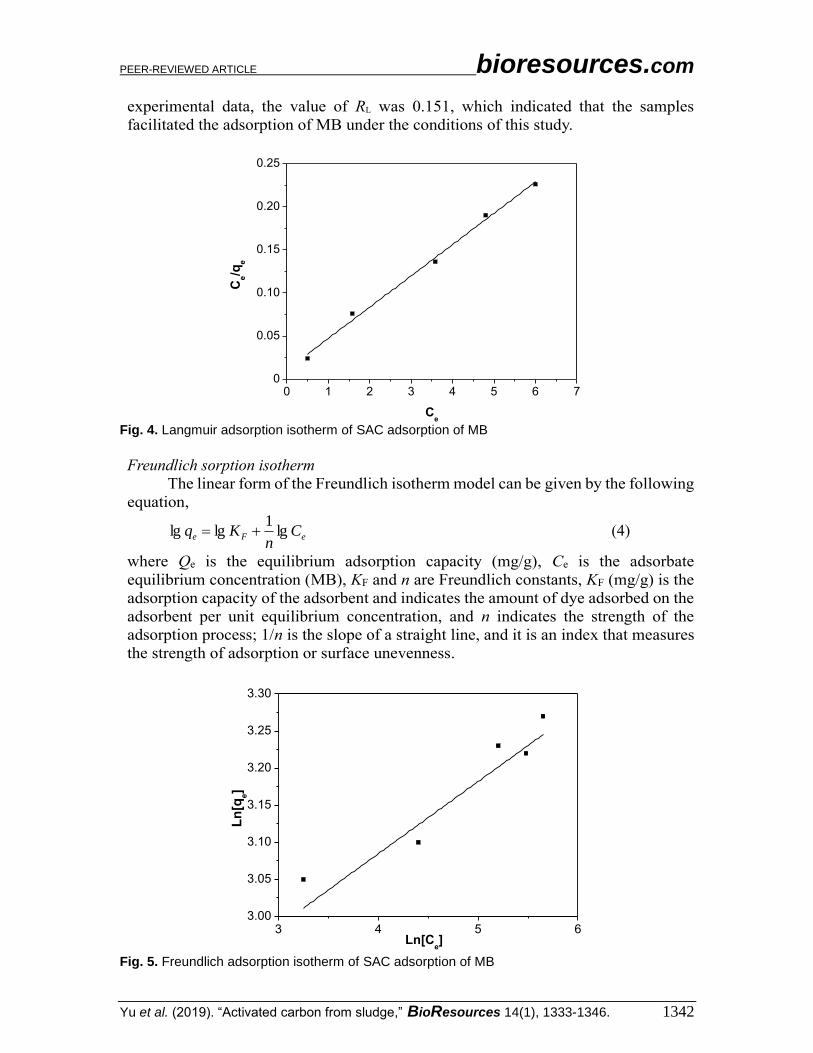
Langmuir sorption isotherm
The linear form of Langmuir’s isotherm model is given by the following equation,
0 0
1 1ee
e
CC
q Q b Q (2)
where Ce is the equilibrium concentration (MB) of the adsorbate (mg/L), qe is the amount
of MB adsorbed per unit mass of adsorbent (mg/g), and Q0 and b are Langmuir constants
relate to adsorption capacity and rate of adsorption. As is shown in Fig. 4, when Ce/qe
was plotted against Ce, a straight line with slope 1/Q0 was obtained, which indicated
that the adsorption of MB of the samples followed the Langmuir isotherm (Rio et al.
2005). The constant values ('b' and 'Q0') for the Langmuir model can be calculated
from its isotherm. The values are given in Table 5.
Conversion of the experimental data to the Langmuir isotherm model
indicated the homogeneity of AC. The results also showed that dye molecules formed
a monolayer cover on the outer surface of the prepared AC (Wahab et al. 2010). The
essential features of the Langmuir isotherm can be represented by the dimensionless
equilibrium parameter (RL), shown in Eq. 3,
0
1
1LR
bC
(3)
where b is the Langmuir constant and C0 is the highest dye concentration (mg/L). The
value of RL represents the type of isotherm and can be classified as unfavorable (RL >
1), linear (RL = 1), favorable (0 < RL < 1), or irreversible (RL = 0). From the
PEER-REVIEWED ARTICLE bioresources.com
Yu et al. (2019). “Activated carbon from sludge,” BioResources 14(1), 1333-1346. 1342
experimental data, the value of RL was 0.151, which indicated that the samples
facilitated the adsorption of MB under the conditions of this study.
Fig. 4. Langmuir adsorption isotherm of SAC adsorption of MB
Freundlich sorption isotherm
The linear form of the Freundlich isotherm model can be given by the following
equation,
eFe Cn
Kq lg1
lglg
(4)
where Qe is the equilibrium adsorption capacity (mg/g), Ce is the adsorbate
equilibrium concentration (MB), KF and n are Freundlich constants, KF (mg/g) is the
adsorption capacity of the adsorbent and indicates the amount of dye adsorbed on the
adsorbent per unit equilibrium concentration, and n indicates the strength of the
adsorption process; 1/n is the slope of a straight line, and it is an index that measures
the strength of adsorption or surface unevenness.
Fig. 5. Freundlich adsorption isotherm of SAC adsorption of MB
0 1 2 3 4 5 6 70
0.05
0.10
0.15
0.20
0.25
Ce/q
e
Ce
3 4 5 63.00
3.05
3.10
3.15
3.20
3.25
3.30
Ln
[qe]
Ln[Ce]

PEER-REVIEWED ARTICLE bioresources.com
Yu et al. (2019). “Activated carbon from sludge,” BioResources 14(1), 1333-1346. 1343
When the value of 1/n is < 1, it indicates a standard Freundlich isotherm.
However, when the value of 1/n is > 1, it means that the adsorption is synergistic (Xiao
et al. 2014). As shown in Fig. 5, the straight line of l g of qe to l g of Ce obtained in
experimental data had a slope of 1/n, which indicated that the adsorption of MB
conformed to the Freundlich isotherm.
Therefore, the Freundlich constants (KF and n) can be obtained from the
experimental data. The parameter values and associated correlation coefficients of two
isotherms are listed in Table 5. The value of R2, measuring the overall fitting degree of
the regression equation, expresses the overall relationship between the dependent
variables and all independent variables. The maximum value of R2 is 1. A value of R2
closer to 1 indicates a better fitting degree of the regression line to the observations
(Mahapatra et al. 2012). The value of the correlation coefficient indicated that the
Langmuir model (R2 = 0.993) produced a better fit than the Freundlich model (R2 = 0.718).
Table 5. Langmuir and Freundlich Sorption Isotherm at MB at 30 °C
Sample Langmuir Sorption Isotherm Freundlich Sorption Isotherm
Q0 (mg/g) b (L/mg) R2 RL 1/n KF (mg/g) R2
SAC 26.99 0.208 0.993 0.151 0.0935 17.35 0.718
Adsorption kinetics
The Lagergren pseudo-first-order kinetic equation and the pseudo-second-order
kinetic equation can be given by the following equation,
1lnln tKQQQ ete (5)
eet QtQKQt 2
21 (6)
where Qe is the adsorption amount at adsorption equilibrium state (mg/g); Qt is the
adsorption amount at time t (mg/g); K1 is the pseudo-first-order rate constant (min-1); and
K2 is the pseudo-second-order rate constant (min-1).
0 60 120 180 240 300 360 420 480 540
-1
0
1
2
3
The pseudo-first-order kinetic model
ln(q
e-qt)
(m
g/g
)
Time (min)
5
10
15
20
t/q
e (
minm
g/g
)
The pseudo-second-order kinetic model
Fig. 6 Fit line of kinetic equation

PEER-REVIEWED ARTICLE bioresources.com
Yu et al. (2019). “Activated carbon from sludge,” BioResources 14(1), 1333-1346. 1344
The pseudo-first-order kinetic model and the pseudo-second-order kinetic model
were used to simulate the adsorption process that SAC adsorb MC, and the fitting curve
was obtained as shown in Fig. 6 The kinetic parameters, obtained using slope and intercept
calculations, are shown in Table 6.
It can be seen from Table 6 that the two kinetic equations resulted in high fitting
degree to the adsorption process of this experiment, and both can describe the kinetics of
SAC adsorption on MB. The pseudo-second-order kinetic equation achieved a better fitting
effect on the adsorption of methylene blue (R2=0.985). In summary, the Lagergren pseudo-
second-order kinetic equation can more closely describe the kinetic process of SAC on
MB.
Table 6. Fitting Parameters of Kinetic Equations
C0 (mg/L) Pseudo-first-order kinetic model Pseudo-second-order kinetic model
qe (mg/g) K1 R2 qe (mg/g) K2 R2
150 28.37 0.00879 0.969 29.52 0.03344 0.985
CONCLUSIONS
1. The results of this study showed that it is feasible to prepare AC using SS and CMHRs
from Chinese medicine factories through phosphoric acid activation. Orthogonal
experiments evaluated the effects of the immersion ratio, activation temperature,
activation time, and the addition ratio of dregs on the iodine value and BET surface
area of SAC.
2. The optimal conditions for preparing SAC were as follows: impregnation ratio of 1:4,
activation time of 30 min, activation temperature of 700 °C, and the addition ratio of
dregs of 40%. The iodine value and BET surface area of prepared SAC obtained under
these conditions were 738 mg/g and 972 m2/g, respectively.
3. The data showed that methylene blue adsorption was most suitable for the Langmuir
equation. The research has shown that the prepared sludge-based AC can be effectively
used for the decolorization of dye wastewater, which can reduce the treatment burden
of SS and CMHRs.
ACKNOWLEDGMENTS
The authors wish to acknowledge the financial support from Nanjing Agricultural
University.
REFERENCES CITED
Chen, J., Zhang, L., Yang, G., Wang, Q., Li, R., Lucia, L. A. (2017). "Preparation and
Characterization of activated carbon from hydrochar by phosphoric acid activation
and its adsorption performance in prehydrolysis liquor," BioResources 12(3), 5928-

PEER-REVIEWED ARTICLE bioresources.com
Yu et al. (2019). “Activated carbon from sludge,” BioResources 14(1), 1333-1346. 1345
5941. DOI:10.15376/biores.12.3.5928-5941
Danish, M., Hashim, R., Ibrahim, M. N. M., and Sulaiman, O. (2013). "Characterization
of physically activated Acacia mangium wood-based carbon for the removal of
methyl orange dye," BioResources 8(3), 4323-4339. DOI: 10.15376/biores.8.3.4323-
4339
Devi, P., and Saroha, A. K. (2017). "Utilization of sludge based adsorbents for the
removal of various pollutants: A review," Science of The Total Environment 578, 16-
33. DOI:10.1016/j.scitotenv.2016.10.220
Gao, H. W., Ma, D. D., and Xu, G. (2012). "Medicinal plant acid-treatment for a healthier
herb tea and recycling of the spent herb residue," RSC Advances 2(14), 5983-5989.
DOI: 10.1039/C2RA20429K
Guo, F., Dong, Y., Dong, L., and Jing, Y. (2013). "An innovative example of herb
residues recycling by gasification in a fluidized bed," Waste Management 33(4), 825-
832. DOI: 10.1016/j.wasman.2012.12.009
Kacan, E., and Kutähyali, C. (2012). "Adsorption of strontium from aqueous solution
using activated carbon produced from textile sewage sludges," Journal of Analytical
and Applied Pyrolysis 97, 149-157. DOI: 10.1016/j.jaap.2012.06.006
Kacan, E. (2016). "Optimum BET surface areas for activated carbon produced from
textile sewage sludges and its application as dye removal," Journal of Environmental
Management 166, 116-123. DOI: 10.1016/j.jenvman.2015.09.044
Kemmer, F. N., Robertson, S. R., and Mattix, R. D. (1971). “Sewage treatment process,”
US Patent Office, Patent No. 3619420
Leng, L., Yuan, X., Zeng, G., Shao, J., Chen, X., Wu, Z., Wang, H., and Peng, X. (2015).
"Surface characterization of rice husk bio-char produced by liquefaction and
application for cationic dye (Malachite green) adsorption," Fuel 155, 77-85. DOI:
10.1016/j.fuel.2015.04.019
Li, H., Li, X., Liu, L., Li, K., Wang, X., and Li, H. (2016). "Experimental study of
microwave-assisted pyrolysis of rice straw for hydrogen production," International
Journal of Hydrogen Energy 41(4), 2263-2267. DOI: 10.1016/j.ijhydene.2015.11.137
Li, T., Guo, F., Li, X., Liu, Y., Peng, K., Jiang, X., and Guo, C. (2018). "Characterization
of herb residue and high ash-containing paper sludge blends from fixed bed
pyrolysis," Waste Management 76, 544-554. DOI: 10.1016/j.wasman.2018.04.002
Li, W. H., Yue, Q. Y., Gao, B. Y., Wang, X. J., Qi, Y. F., Zhao, Y. Q., and Li, Y. J. (2011).
"Preparation of sludge-based activated carbon made from paper mill sewage sludge
by steam activation for dye wastewater treatment," Desalination 278(1-3), 179-185.
DOI: 10.1016/j.desal.2011.05.020
Liu, B. S., Wang, W. S., Wang, N., and Au, C. T. (2014). "Preparation of activated carbon
with high surface area for high-capacity methane storage," Journal of Energy
Chemistry 23(5), 662-668. DOI: 10.1016/S2095-4956(14)60198-4
Luo, Y., Street, J., Steele, P., Entsminger, E., and Guda, V. (2016). "Activated carbon
derived from pyrolyzed pinewood char using elevated temperature, KOH, H3PO4, and
H2O2," BioResources 11(4), 10433-10447.
Mahapatra, K., Ramteke, D. S., and Paliwal, L. J. (2012). "Production of activated carbon
from sludge of food processing industry under controlled pyrolysis and its application
for methylene blue removal," Journal of Analytical and Applied Pyrolysis 95, 79-86.
DOI: 10.1016/j.jaap.2012.01.009
Pallarés, J., González-Cencerrado, A., and Arauzo, I. (2018). "Production and
characterization of activated carbon from barley straw by physical activation with

PEER-REVIEWED ARTICLE bioresources.com
Yu et al. (2019). “Activated carbon from sludge,” BioResources 14(1), 1333-1346. 1346
carbon dioxide and steam," Biomass and Bioenergy 115, 64-73. DOI:
10.1016/j.biombioe.2018.04.015
Puziy, A. M., Poddubnaya, O. I., Martínez-Alonso, A., Suárez-García, F., and Tascón, J.
M. D. (2003). "Synthetic carbons activated with phosphoric acid III. Carbons
prepared in air," Carbon 41(6), 1181-1191. DOI: 10.1016/S0008-6223(03)00031-9
Rio, S., Faur-Brasquet, C., Le Coq, L., Courcoux, P., and Le Cloirec, P. (2005).
"Experimental design methodology for the preparation of carbonaceous sorbents from
sewage sludge by chemical activation--Application to air and water treatments,"
Chemosphere 58(4), 423-437. DOI: 10.1016/j.chemosphere.2004.06.003
San Miguel, G., Fowler, G. D., and Sollars, C. J. (2003). "A study of the characteristics of
activated carbons produced by steam and carbon dioxide activation of waste tyre
rubber," Carbon 41(5), 1009-1016. DOI: 10.1016/S0008-6223(02)00449-9
Sartova, K., Omurzak, E., Kambarova, G., Dzhumaev, I., Borkoev, B., and Abdullaeva, Z.
(2018). "Activated carbon obtained from the cotton processing wastes," Diamond and
Related Materials 91, 90-97. DOI:10.1016/j.diamond.2018.11.011
Sud, D., Mahajan, G., and Kaur, M. P. (2008). "Agricultural waste material as potential
adsorbent for sequestering heavy metal ions from aqueous solutions - A review,"
Bioresource Technology 99(14), 6017-6027. DOI: 10.1016/j.biortech.2007.11.064
Tay, J. H., Chen, X. G., Jeyaseelan, S., and Graham, N. (2001). “A comparative study of
anaerobically digested and undigested sewage sludges in preparation of activated
carbons,” Chemosphere 44(1), 53-57. DOI: 10.1016/s0045-6535(00)00384-2
Wahab, M. A., Jellali, S., and Jedidi, N. (2010). "Ammonium biosorption onto sawdust:
FTIR analysis, kinetics and adsorption isotherms modeling," Bioresource Technology
101(14), 5070-5075. DOI: 10.1016/j.biortech.2010.01.121
Xiao, X., Chen, B., and Zhu, L. (2014). "Transformation, morphology, and dissolution of
silicon and carbon in rice straw-derived biochars under different pyrolytic
temperatures," Environmental Science Technology 48(6), 3411-3419. DOI:
10.1021/es405676h
Zhang, D., and Luo, R. (2018). "Modifying the BET model for accurately determining
specific surface area and surface energy components of aggregates," Construction and
Building Materials, 175, 653–663. DOI: 10.1016/j.conbuildmat.2018.04.215
Zhao, S., and Zhou, T. (2016). "Biosorption of methylene blue from wastewater by an
extraction residue of Salvia miltiorrhiza Bge," Bioresource Technology 219, 330-337.
DOI: 10.1016/j.biortech.2016.07.121
Article submitted: September 19, 2018; Peer review completed: November 26, 2018;
Revised version received: December 2, 2018; Accepted: December 15, 2018; Published:
January 7, 2019.
DOI: 10.15376/biores.14.1.1333-1346