production fragmentation, foreign trade and structural
TRANSCRIPT

Production fragmentation, foreign trade and structural complexity: a comparative analysis of Brazil and Mexico1
Kaio Glauber Vital da Costa, Marta Reis Castilho and Martín Puchet Anyul
1 The authors gratefully acknowledge comments made by an anonymous contributor to Cepal Review, which greatly enhanced this version of the article. The underlying research was part-funded by Coordenação de Aperfeiçoamento de Pessoal de Nível Superior (CAPES), an agency of the Brazilian Ministry of Education (MEC), through its National Post-Doctoral Programme (PNPD), of which Kaio Costa was a scholarship holder; and by the Visiting Professor Abroad Programme (PVEx), which financed Marta Castilho’s stay at Universidad Complutense de Madrid during the 2018/19 academic year.
Abstract
Starting in the 1980s, Brazil and Mexico adopted diverging trade and production strategies, which had significant effects on their respective production and trade structures. This study investigates how the two countries’ different patterns of trade specialization affected the complexity of their respective production structures between 1995 and 2011. Although the foreign trade profiles of Brazil and Mexico differ mainly in their export structures, the processes of trade liberalization and integration into global value chains made the network of interrelationships between the different sectors less complex. Since these are Latin America’s two largest economies, a reduction in the complexity of their production structures not only has repercussions on the dynamics of their respective national economies, but also affects those of other countries in the region.
Keywords
Economic development, development strategies, foreign trade, trade policy, specialization of production, productivity, exports, imports, comparative analysis, Brazil, Mexico
JEL classification
F1, 014, C67, F14, 054
Author
Kaio Glauber Vital da Costa is Assistant Professor and research fellow at the Industry and Competitiveness Group of the Economics Institute of the Federal University of Rio de Janeiro. Email: [email protected].
Marta Reis Castilho is Associate Professor and Coordinator of the Industry and Competitiveness Group of the Institute of Economics of the Federal University of Rio de Janeiro. Email: [email protected].
Martín Puchet Anyul is Professor of Quantitative Methods at the Faculty of Economics, Autonomous National University of Mexico (UNAM). Email: [email protected].

134 CEPAL Review N° 133 • April 2021
Production fragmentation, foreign trade and structural complexity: a comparative analysis of Brazil and Mexico
I. Introduction
Sustained economic growth requires the production structure to evolve consistently with trends in domestic demand and developments in international trade. This means that a country’s production structure must have the capacity to adapt to the changes occurring both at home and abroad (Chenery, 1980). Over the past two decades, the production structures and international trade profiles of Brazil and Mexico, Latin America’s two largest economies, have undergone profound changes. These directly affected the organization and intensity of intersectoral linkages, such that both countries’ production structures lost structural complexity from the mid-1990s onwards (Coutinho, 1997; Britto, 2002; Moreno-Brid and Ros, 2009).
Since the 1980s, the exhaustion of the import substitution industrialization model, which was founded on domestic market growth, has led the Latin American economies to seek new profiles of production and foreign trade specialization. As a result, two major specialization models have consolidated. The first has its epicentre in the Southern Cone, with countries (such as Brazil) specializing predominantly in commodity-processing industries, which are also capital-intensive sectors. The second is represented by Mexico and other Central American countries, which have an alternative specialization model, based on the electronics, automotive and textile industries, mainly serving the United States market (Katz, 2000).
Despite their different specialization profiles, the foreign trade of Latin America’s two largest economies displays a number of similarities. Both Brazil and Mexico are increasingly dependent on imported intermediate inputs, while their exports have relatively little capacity to generate employment and income (Ruiz-Nápoles, 2004; Fujii and Cervantes, 2013; Kupfer and others, 2013). The large increase in imported inputs in the 1990s and throughout the 2000 decade can be explained by trade liberalization processes, in conjunction with a persistent appreciation of the exchange rate and the microeconomic strategies pursued by transnational corporations when deciding where to locate their industrial plants.
The fragmentation of production and the resulting formation of global value chains appear to have exacerbated both countries’ trade specialization patterns. Despite their different positions in global value chains and different levels of participation (Hermida, 2016; Boddin, 2016), the way they have each entered these chains has failed to alter their foreign trade patterns (Medeiros and Trebat, 2017). The traditional export sectors —commodity-based (capital-intensive) in Brazil and maquila (labour-intensive) in Mexico— have reinforced the contribution made to their total exports and trade balance by their respective dominant sectors. At the same time, sectors with a higher technological content have run increasing deficits and become dependent on imported intermediate inputs (Katz, 2000).
Since the mid-1980s, the emergence of global and regional production and value chains has dramatically altered the organization of the global production of goods and services (Baldwin, 2011), with further reaching and longer lasting effects on international trade and investment patterns. The international division of production has long been part of international trade, as countries import manufactured goods to incorporate into their exports (Athukorala and Menon, 2010). However, the fall in transport and communication costs, in conjunction with the rapid spread of technological progress (which has generated more shared and flexible production processes) and the lowering of economic and political barriers to trade have provided additional opportunities for production to become more internationally fragmented. The change in the governance of industrial enterprises from the 1980s onwards, which involved their financialization, “encouraged” this movement by viewing it as a way to reduce costs and thereby increase profits and dividends (Sarti and Hiratuka, 2018).
In this context, greater fragmentation of production, with developing countries becoming increasingly involved, has redefined the international division of labour, which is changing the geography of production, as certain industries move their operations offshore. This process is driven mainly by two factors: (i) trade liberalization policies, including the signing of regional agreements; and (ii) advances in

135CEPAL Review N° 133 • April 2021
Kaio Glauber Vital da Costa, Marta Reis Castilho and Martín Puchet Anyul
information and communication technologies. The first factor resulted in the reduction of tariffs and the lowering of barriers to foreign direct investment (FDI). The second reduced transport costs and made it less expensive to coordinate and monitor activities within transnational corporations. As a result, those corporations started to refocus their industrial location strategies according to the characteristics of each region or country, such as labour costs, the size of the domestic market or regulatory and institutional conditions. The reduction in the costs of locating abroad, due to the internationalization of production, has led transnational firms to move some plants from highly developed countries to developing ones where production costs are lower.
This article aims to analyse the complexity of production structures in Brazil and Mexico in a context of fragmented production processes. In this study, a more complex structure means greater interdependence between sectors and, hence, greater circularity in the flows of goods and services in the economies in question. The use of a structural complexity indicator spanning the entire network of direct and indirect interrelationships between sectors affords a better understanding of the production structures of Latin America’s two largest economies. As comparative studies of the Brazilian and Mexican economies are few, this analysis also contributes to comparative research on the two economies.
The article is divided into three sections, in addition to this introduction. Section II develops the concepts involved in the fragmentation of production and in structural complexity. Section III presents the results.
II. Fragmentation of production and structural complexity: literature review and conceptual issues
The trade liberalization processes that Brazil and Mexico embarked upon in the 1980s and 1990s gave rise to two distinct patterns of trade specialization. Brazil and the other South American countries are specialized in exporting commodity-based products; in contrast, Mexico has an export profile centred on industrial maquilas destined largely for the United States (Katz, 2000). In addition to its effect on exports, trade liberalization triggered industrial restructuring processes in both countries, which resulted in nearly all sectors becoming increasingly reliant on imported intermediate inputs. The increase in imported parts, pieces and components reflects defensive strategies deployed by domestic firms to counter foreign competition, and the use of the foreign supplier network by transnational corporations (Britto, 2002; Kupfer, 2005; Fujii and Cervantes, 2013).
The likely consequence of increased reliance on imported inputs is a steady weakening of the production structure, with links in several production chains being lost, and a reduction in the density of the matrix of industrial interrelationships. If this matrix is envisioned as a network of exchanges between n sectors, in which the sectors (vertices) are interconnected by arcs (flows of goods and services), the reduced density can be understood as the disappearance of several of these arcs or flows. In this analogy with graph theory, when an economy becomes more complex, in the sense that each sector’s production relies increasingly on inputs supplied by other sectors, intermediate demand grows as a proportion of total output; and the probability of finding trajectories or paths that collapse in the circuits also grows. In other words, the weakening of the production structure is associated with less interdependence between sectors.
As noted by Romero, Dietzenbacher and Hewings (2009), two cases need to be considered when analysing the effects of the spatial fragmentation of production, since some areas (regions or countries) may lose certain stages, tasks, activities or links that make up the production process, while

136 CEPAL Review N° 133 • April 2021
Production fragmentation, foreign trade and structural complexity: a comparative analysis of Brazil and Mexico
others may attract them. In countries that lose these stages, fragmentation could make their production systems less complex, as a few, or maybe several, domestic linkages are transferred to other countries. The consequences of this fragmentation in countries with relatively advanced levels of industrialization could be significant and possibly lead to a “hollowing out” process (Hewings and others, 1998; Guo, Hewings and Sonis, 2005). Fragmentation makes these countries rely increasingly on inputs imported from the rest of the world.
In contrast, in the countries that gain these production stages, production fragmentation could increase structural complexity. For this to happen, however, fragmentation would need to be accompanied by the creation of linkages between newly established firms, usually transnational corporations, and domestic ones. In an extreme case of “enclave sectors”, where the intermediate demand generated by the new firms is mainly for imported inputs, thus generating few linkages with the domestic economy, the hypothesis that fragmentation could increase structural complexity may not valid. Enclave sectors operate in developing countries for the purpose of undertaking specific, highly technology-intensive, phases of production processes. The necessary intermediate inputs are purchased abroad, and the output is used in a succession of manufacturing activities in plants located in other countries.
1. Structural complexity as a specific feature of interindustry linkage
A modern economy is characterized by a network of intrinsically interconnected sectors or production units, which are increasingly dependent on intermediate inputs supplied by various sectors of the economy. The complexity of an economy will be considered conceptually as the result of a “process of development that extends the multiplicity of economic interactions within the economic system” (Sonis and Hewings, 1998). This perspective is closely related to the analyses performed by structuralist authors such as Albert Hirschman, Hollis Chenery, Celso Furtado and Arthur Lewis, among others. For these authors, a country’s development process can be characterized by the increase in interactions that take place between an economy’s sectors of production. In other words, economic development is seen as accompanied by an intensification of interactions between productive sectors, and not just by the allocation of resources among them.
Complexity is a multidimensional phenomenon for which there are several approaches and multiple definitions, which will not be discussed in detail in this section (Adami, 2002). The notion of complexity, which originated in physics and biology, has been extended to the analysis of social and economic systems (Arthur, 1999; Rosser, 1999; Durlauf, 2005). As Fontana (2008) notes, the complexity perspective applied to economics implies a perception of the nature of economic phenomena that is radically different from the dominant view of orthodox or conventional economics. This is because a complex system is characterized by the presence of a large number of heterogeneous agents interacting with each other, the absence of a global controller, adaptation through learning and evolution, and the importance of disequilibrium analysis. Moreover, according to Sonis and Hewings (1998), although the notion of complexity may have emerged from the analysis of non-linear dynamics in natural science, the concept can provide a useful conceptual framework for analysing aspects of the countries’ economic development, even in the case of economic analyses involving systems of linear equations, as in the input-output approach.
Simon’s (1962) definition of a complex system is shared by several authors who analyse the complexity of economies. He defines a complex system as one consisting of a large number of parts that interact in a non-simple way. In such systems, the whole is more than the sum of the parts in the sense that, given the properties of the parts and the laws governing their interactions, it is not a trivial matter to infer the properties of the whole structure. In the approach developed by Simon (1962), a complex

137CEPAL Review N° 133 • April 2021
Kaio Glauber Vital da Costa, Marta Reis Castilho and Martín Puchet Anyul
system consists of subsystems which themselves have their own systems, and so on successively. This means that complexity is also characterized by hierarchies between subsystems, as different subsystems affect the overall dynamics of the system in different ways. In the analysis of complexity as applied to the economy, these characteristics are of fundamental importance.
The indicators listed in table 1 show how the phenomenon of a country’s structural or economic complexity is approached using different methodologies. The interdependence or connectivity between the various sectors of production is a crucial feature of economic analysis. Various proposals have been made for measuring this, starting with the classical measures of direct interdependence developed by Chenery and Watanabe (1958) and the measures of total linkages (forward and backward) developed by Hirschman (1961) and Rasmussen (1957). Contributions that are particularly useful for studying complexity in a structure include those that provide summary or “holistic” measures that capture the multiplicity of connections or interdependencies between sectors in a single number. These facilitate historical and international (or interregional) comparisons of different economies’ production structures.
Table 1 Indicators of complexity
Peacock and Dosser (1957)
Chenery and Watanabe (1958)''i xi Ax
Rasmussen (1957) and Hirschman (1961) 'i I A in � �R W1 1
Yan and Ames (1965)
,n
i j
100
0
1
ijYA2 /
Lantner (1972 and 1974)D
D�R W1
Robinson and Markandya (1973)T if A
if Aij
ij
j ij !� �G 0
00
t
Finn (1976) and Ulanowicz (1983)''i yi Xi
Jensen and West (1980) 'i Ain1
Dietzenbacher (1992) λ=dominant eigenvalueRomero, Dietzenbacher and Hewings (2009) L L �R W1
Amaral, Dias and Lopes (2007) G A H A G L H LR R R RW W W We
Hausmann and others (2014), pp
N0 1
p==
/ (diversification) and
, pc
N0 1
c��/ (ubiquity)
Source: Prepared by the authors, on the basis of J. Amaral, J. Dias and J. Lopes, “Complexity as interdependence in input–output systems”, Environment and Planning A: Economy and Space, vol. 39, No. 7, 2007.
where:
A: technical coefficients matrix
x: production vector
i: sum vector
n: number of sectors
I: identity matrix
K: boolean matrix
∆: determinant of matrix (I-A)

138 CEPAL Review N° 133 • April 2021
Production fragmentation, foreign trade and structural complexity: a comparative analysis of Brazil and Mexico
ijYA0 : order matrix
λ: dominant eigenvalue of matrix A
y: final demand
L: Leontief inverse matrix
Tij: transactions rounds matrix
One of the first examples is the percentage of non-zero technical coefficients, developed by Peacock and Dosser (1957). The interdependency indices of Yan and Ames (1965) and the transaction rounds matrix of Robinson and Markandya (1973) are more elaborate attempts to quantify interdependency in this way. As a measure of connectivity, Jensen and West (1980) suggested the mean sums of rows or columns of the technical coefficient matrix, A. Building on these initial studies, a number of authors (Finn, 1976; Ulanowicz, 1983) constructed other indicators to analyse ecological systems, which were later applied to economic analysis. Subsequently, Basu and Johnson (1996) proposed a new measure based on directed graph theory and structural path analysis using input-output tables; and Sonis and Hewings (1998) used a similar method. Lastly, Romero, Dietzenbacher and Hewings (2009) developed an indicator of the structural complexity of economies, based on the mean-length-of-propagation method, which seeks to measure the length of the sectors’ production chain or their distance from final demand.
More recent studies have put structural change back at the centre for understanding a country’s economic development (Hausmann and Hidalgo, 2011). Differences in the capacity of countries to upgrade their production structure and diversify their exports into more complex products seem to help explain differences in their development levels (McMillan and Rodrik, 2011).2 According to Hausmann and Hidalgo (2011), a country’s economic growth capacity reflects the diversity of its capacities, since different types of capacities are needed to move towards new higher-productivity activities. A well-established empirical result is that countries specializing in more sophisticated products grow faster (Rodrik, 2006; Hausmann, Hwang and Rodrik, 2007).
The product space methodology developed by Hidalgo and others (2007) studies changes in the countries’ historical position within the evolving product space, which represents the distances between the structures of international trade flows for all products. The historical positioning of countries in this product space uses specific indices of revealed comparative advantages. The authors insert these indices into a theoretical argument based on the notion of country capacity: the complexity of the national production structure determines a country’s potential to further its own development. However, the indicators they use are based on the characteristics of the countries’ exports, which may be inappropriate or inaccurate in the case of countries whose export structures differ greatly from their production structure.3 4
Recently, Lantner and Carluer (2004) and Lantner and Lebert (2013 and 2015) took a different path, using the properties of Leontief matrix determinants to develop a “summary” measure of interdependence, based on the work of Wong (1954) and Bott and Mayberry (1954). Within this approach to analysing the economic and structural complexity of the countries, Wong (1954) suggests that the determinant of the technical coefficients matrix, ∆=(I − A), is a relative measure of the net volume of production and the complexity of the production system. The approach proposed by Lantner (1972 and 1974) also
2 The role of capacities as a precondition for long-term growth is central to the work of Hirschman (1958), Lewis (2006), Rostow (1959) and Kaldor (1967). These authors described economic development essentially as a process of structural transformation and productivity growth, driven by the progressive strengthening of productive capacities.
3 Hausmann and others (2014) propose to evaluate economic sophistication through two characteristics of exports: the ubiquity (or exclusivity) of the products exported by a country and the diversity of the products exported.
4 In a study of the Brazilian economy in the 2000 decade, Torracca (2017) shows how export and production structures can differ, particularly in economies that are natural-resource rich and display relatively advanced structural complexity.

139CEPAL Review N° 133 • April 2021
Kaio Glauber Vital da Costa, Marta Reis Castilho and Martín Puchet Anyul
starts by interpreting the determinants of the (I − A) matrix, but is based on the theorems put forward by Bott and Mayberry (1954). Drawing on the study of the determinants of the matrix of interindustry or commercial relations, Lantner (1972 and 1974), Gazon and Nihon (1976) and Lantner and Lebert (2013 and 2015) develop the concept of structural circularity. The structural circularity index is used to measure the degree of interdependence of a set of industries in an economic system, or of a group of countries and regions in international trade.
From a quantitative standpoint, the determinant has the advantage of being a synthetic indicator that demonstrates the internal organization of the structure of sectors of production, or of the trade links between regions or countries; in other words the position and intensity of the connections between the sectors or countries. Qualitatively, the determinant makes it possible to interpret the complexity of production structures as a result of a gradual expansion of the network of hierarchical interdependencies between the different sectors of the economy. It is also possible to perform a structural decomposition analysis by calculating the determinants, in order to calculate the economies’ rates of interdependence, dependency and autarchy.
The circularity or structural complexity index is defined formally as ice �D
D�R W1. The structural
complexity index is an indicator of the number of feedback loops that exist between the different sectors of an economy. The presence of such loops indicates that the relationships between the productive sectors are dense and that the sectors are mutually integrated. The production structure becomes more complex and more highly developed as the number of feedback loops increases in relation to all the loops linking all the sectors (Puchet, 1996).
When a production structure becomes more complex, in the sense that each sector depends increasingly on the other sectors to supply inputs for its own production, then intermediate demand increases as a proportion of total output, and feedback effects between sectors proliferate. According to Aroche Reyes (1993), the structural complexity index does not depend on the size of the technical coefficients, but on the complexity of the production structure —as defined by the presence of feedback loops between the sectors, or the degree of integration between them. The structural complexity index is constructed from the matrix of exchanges between an economy’s sectors of production. This approach affords a better understanding of the degree of interdependence that exists between the sectors of an economy, or of their structural complexity, since it sheds light on the level of interaction present in the production structure.
III. Entry into global value chains and evolution of the structural complexity of the Brazilian and Mexican economies between 1995 and 2011
Throughout the 1990s, the trade profile and participation of the Latin American countries, mainly Brazil and Mexico, developed against a backdrop of growing geographical dispersion of production. An initial observation is that Mexico applied wider ranging and faster measures in its economic liberalization process, than Brazil. This is not only because their implementation began in 1986, when Mexico joined the General Agreement on Tariffs and Trade (GATT), but also because of the speed and intensity with which both tariffs and non-tariff protection measures were lowered —a trend that was reinforced by the signing of the North American Free Trade Agreement (NAFTA) in 1994.
Although occurring at different times, the period following trade liberalization and entry into global value chains is characterized by a strong positive relationship between the rate of growth of gross domestic product (GDP) and import growth in the two countries. In 2004–2010, which corresponds to

140 CEPAL Review N° 133 • April 2021
Production fragmentation, foreign trade and structural complexity: a comparative analysis of Brazil and Mexico
the commodity boom period, Brazil experienced an import surge. Figure 1 shows a large concentration of points precisely between these two years. One of the factors noted was the persistent appreciation of the real exchange rate from 2003 onwards, as part of the macroeconomic policy implemented to control inflation and raise workers’ real wages.
Figure 1 Brazil: annual growth of gross domestic product (GDP) and imports, 1996–2011
(Percentages)
1996
1997
1998
1999
2000
2001
2002
2003
2004
2005
2006
2007
2008
2009
2010
2011
-2
-1
0
1
2
3
4
5
6
7
8
-30 -20 -10 0 10 20 30 40 50Import growth
GDP
gro
wth
Source: Prepared by the authors, on the basis of European Commission (EC), World Input-Output Database, 2013 [online] http://www.wiod.org/home, and Economic Commission for Latin America and the Caribbean (ECLAC), CEPALSTAT, 2020 [online database] https://estadisticas.cepal.org/cepalstat/portada.html?idioma=english.
It can be seen that the trade liberalization process, which began in the late 1980s and deepened throughout the 1990s, served to make the Brazilian economy structurally dependent on imports —structurally dependent because the inputs imported in the cyclical upswings of the Brazilian economy tend increasingly to close the intermediate demand circuits of the different sectors of the national economy. The result of this greater dependency would be a further weakening of the production structure, in the sense that intersectoral linkage effects would tend to diminish.
Mexico displays a quite similar pattern to that of Brazil, with a strong relations between GDP and import growth rates (see figure 2). However, unlike Brazil, the points are more widely dispersed over time. The signing of NAFTA in 1994 and the appreciation of the real exchange rate in 1995 (López, 1998) combined to deepen a historically well-established dependency on imports, sourced in particular from the United States. For authors such as López (1998) and Ros (2015), the weak growth of the Mexican economy in the period reviewed is associated with a rise in the import coefficient. This would have caused demand to leak out of the domestic market and thereby dampen the autonomous expenditure multiplier.
According to Moreno-Brid and Ros (2009), Mexico’s foreign trade was one of the fastest-growing in the region and also globally, particularly in the 1990s. This growth was seen in exports, but also in the weight of imported components and inputs, which outpaced export growth. As a result, the country had trade surpluses with the NAFTA countries, but growing deficits with other countries, mainly those in Asia. The overall effect was the emergence of persistent current account deficits and additional pressures on the balance of payments (Moreno-Brid and Ros, 2009).

141CEPAL Review N° 133 • April 2021
Kaio Glauber Vital da Costa, Marta Reis Castilho and Martín Puchet Anyul
Figure 2 Mexico: annual growth of gross domestic product (GDP) and imports, 1996–2011
(Percentages)
1996
1997
1998
1999
2000
20012002
2003
2004
2005
2006
2007
2008
2009
2010
2011
-6
-4
-2
0
2
4
6
8
-40 -30 -20 -10 0 10 20 30 40Import growth
GDP
gro
wth
Source: Prepared by the authors, on the basis of European Commission (EC), World Input-Output Database, 2013 [online] http://www.wiod.org/home, and Economic Commission for Latin America and the Caribbean (ECLAC), CEPALSTAT, 2020 [online database] https://estadisticas.cepal.org/cepalstat/portada.html?idioma=english.
An analysis of Brazil’s export and import patterns reveals that, while imports are more diversified, its exports have become increasingly concentrated in a small group of sectors. A synthetic way to analyse the evolution of these two patterns is by calculating each sector’s contribution to the growth of total imports and exports.5 Table 2 shows that roughly 45% of the growth in exports was generated in just three sectors: food, beverages and tobacco (18%), plant extraction (15%) and agriculture, hunting, forestry and fishing (12%). In contrast, imports are more widely dispersed across sectors. This indicates that import penetration in the Brazilian economy has been more widespread since the trade liberalization process in 1994 and throughout the period of integration into global value chains in the 2000s.
Table 2 Brazil: main sectors contributing to the growth of total imports and exports, 1995–2011
(Percentages)
Imports Exports
Transport equipment 9 Food, beverages and tobacco 18
Coke, refined petroleum and nuclear fuel 8 Plant extraction 15
Chemicals and chemical products 7 Agriculture, hunting, forestry and fishing 12
Plant extraction 6 Transport equipment 8
Electrical and optical equipment 6 Basic metals and fabricated metal 7
Agriculture, hunting, forestry and fishing 6 Chemicals and chemical products 5
Construction 5 Coke, refined petroleum and nuclear fuel 4
Basic metals and fabricated metal 5 Hotels and restaurants 3
Food, beverages and tobacco 4 Pulp, paper, printing and publishing 2
Machinery n.e.c. 3 Land transport 2
Source: Prepared by the authors, on the basis of European Commission (EC), World Input-Output Database, 2013 [online] http://www.wiod.org/home.
5 According to Britto (2002), the sectoral contribution is calculated as follows: * 100m m
m mt t
i i
2011 1995
2011 1995
−
−S
R
X
W .

142 CEPAL Review N° 133 • April 2021
Production fragmentation, foreign trade and structural complexity: a comparative analysis of Brazil and Mexico
Imports achieved greater penetration even in the agriculture and construction sectors (where production chains are vertically integrated). Also notable is the role played seven sectors as major contributors to both import and export growth. While these results suggest a relative increase in intrasectoral trade; they also reveal the existence of trade imbalances in certain sectors, such as transport equipment, coke and refined petroleum, and chemicals and chemical products.
In the Mexican economy, sector contributions to both exports and imports are more highly concentrated. The largest sector contributions to import growth were electrical and optical equipment (21%), transport equipment (14%) and construction (9%); while the largest contributions to the growth of exports were also in transport equipment (25%), electrical and optical equipment (21%) and plant extraction (18%) (see table 3). These results show that, unlike the Brazilian case, Mexico’s foreign trade profile is highly complementary, in the sense that it is based on exports and imports in the same sectors.
Table 3 Mexico: main sectors contributing to the variation in total imports and exports, 1995–2011
(Percentages)
Imports Exports
Electrical and optical equipment 21 Transport equipment 25
Transport equipment 14 Electrical and optical equipment 21
Construction 9 Plant extraction 18
Basic metals and fabricated metal 7 Machinery n.e.c. 3
Land transport 4 Food, beverages and tobacco 3
Electricity, gas and water 4 Wholesale trade 3
Agriculture, hunting, forestry and fishing 3 Chemicals and chemical products 3
Plant extraction 3 Retail trade 2
Sale, maintenance and repair of motor vehicles 3 Other manufactures 2
Retail trade 2 Coke, refined petroleum and nuclear fuel 2
Source: Prepared by the authors, on the basis of European Commission (EC), World Input-Output Database, 2013 [online] http://www.wiod.org/home.
The way the foreign trade profiles of Brazil and Mexico have changed show how the two countries adopted different external integration strategies, both throughout the 1990s and in the 2000 decade. As Katz (2000) notes, these different patterns of external integration started to emerge as early as the 1980s, when both countries abandoned import substitution industrialization and adopted different development strategies, emphasizing trade liberalization through tariff and non-tariff reductions (Ros, 1994; Kume, 1996).
The industrial restructuring that followed trade liberalization in Brazil and Mexico between the 1980s and 1990s introduced a major structural component in imports, reinforcing the patterns of trade specialization and the production structures that had formed in the import substitution industrialization period (Coutinho, 1997; Ros, 2015). According to Coutinho (1997), Britto (2002) and Moreno-Brid and Ros (2009), this structural nature of imports of intermediate inputs reflects a progressive weakening of production structures. This took various forms, including a reduction in the value added of industrial chains, foreign suppliers replacing domestic supply, and the substitution of imported inputs for domestic production.

143CEPAL Review N° 133 • April 2021
Kaio Glauber Vital da Costa, Marta Reis Castilho and Martín Puchet Anyul
Tables 4 and 5 show the 10 leading intermediate inputs imported and exported by Brazil and Mexico, respectively, between 1994 and 2014.6 In the Brazilian economy, the range of intermediate inputs that are both imported and exported simultaneously has expanded. In 1994, only two intermediate inputs were both exported and imported. They correspond to codes 78433 and 78439 of the Standard International Trade Classification, Rev. 3 and belong to the Parts and accessories of motor vehicles category. In 2014, seven of the 10 leading intermediate inputs were both exported and imported, namely: 71491, 78439, 7478, 79295, 78432, 78434 and 78435. The data show that the categories corresponding to Parts and accessories of motor vehicles, Power-generating machinery and equipment and General industrial machinery represent a large share of Brazil’s foreign trade in intermediate inputs. It is interesting to note that the electronic devices and equipment category accounts for a large share of imports, but not exports, making Brazil a net importer in this input category.
Table 4 Brazil: top ten intermediate inputs exported and imported, 1994 and 2014
(Percentages of total intermediate inputs)
Codes of the Standard International Trade Classification, Revision 3 1994 Codes of the Standard International
Trade Classification, Revision 3 2014
Exports
78439 - Parts and accessories of motor vehicles 16 71491 - Power-generating machinery and equipment 15
7611 - Telecommunication apparatus and equipment 7 78439 - Parts and accessories of motor vehicles 11
71391 - Power-generating machinery and equipment 7 7478 - General industrial machinery 5
71323 - Power-generating machinery and equipment 4 79295 - Other transport equipment 5
78434 - Parts and accessories of motor vehicles 4 71322 - Power-generating machinery and equipment 4
78433 - Parts and accessories of motor vehicles 4 71391 - Power-generating machinery and equipment 4
78425 - Parts and accessories of motor vehicles 4 78432 - Other transport equipment 4
78435 - Parts and accessories of motor vehicles 3 7169 - Power-generating machinery and equipment 4
79295 - Other transport equipment 3 78434 - Parts and accessories of motor vehicles 3
71481 - Power-generating machinery and equipment 2 78435 - Parts and accessories of motor vehicles 3
Imports
78434 - Parts and accessories of motor vehicles 7 76493 - Telecommunication apparatus and equipment 9
7128 - Power-generating machinery and equipment 7 78439 - Parts and accessories of motor vehicles 7
78439 - Parts and accessories of motor vehicles 6 75997 - Office machines and automatic data processing machines
6
77641 - Electrical machinery and equipment 5 78434 - Parts and accessories of motor vehicles 6
76499 - Telecommunication apparatus and equipment 4 71491 - Telecommunication apparatus and equipment 5
76493 - Telecommunication apparatus and equipment 4 78432 - Parts and accessories of motor vehicles 4
75997 - Office machines and automatic data processing machines
4 79295 - Other transport equipment 3
77258 - Electrical machinery and equipment 4 78435 - Parts and accessories of motor vehicles 2
77611 - Electrical machinery and equipment 3 7478 - General industrial machinery 2
77643 - Electrical machinery and equipment 2 7484 - General industrial machinery 2
Source: Prepared by the authors, on the basis of United Nations, UN Comtrade - International Trade Statistics Database, 2017 [online] https://comtrade.un.org/.
Note: To highlight the product groups of the inputs, the descriptions of the product classifications are those given at the three-digit level, which are more general than those given for the five-digit classification of the main imported and exported inputs.
6 The fact that the data of the World Input-Output Database (WIOD) matrices are aggregated at a 35-sector level, makes it impossible to investigate the trend of the intermediate inputs exported and imported by Brazil and Mexico in greater detail. This problem was solved by using Standard International Trade Classification Rev3 [online] https://unstats.un.org/unsd/tradekb/Knowledgebase/50085/Standard-International-Trade-Classification-Revision-3, specifically the parts, pieces and components included in chapters 7 (Machinery and transport equipment) and 8 (Miscellaneous manufactured articles) at the four- and five-digit levels. For a complete list of intermediate inputs with their respective SICT Rev3 codes, see Athukorala and Menon (2010).
144 CEPAL Review N° 133 • April 2021
Production fragmentation, foreign trade and structural complexity: a comparative analysis of Brazil and Mexico
Four of the seven intermediate inputs that were simultaneously exported and imported in 2014 belong to the Parts and accessories of motor vehicles category. These are: Other parts and accessories of bodies (78432), Gearboxes (78434), Drive axles (78435) and Other parts and accessories (78439). This pattern of foreign trade in intermediate inputs reveals the existence of a large component of intraindustry trade, and also that Brazil’s integration into the most dynamic stages of global value chains occurred predominantly through the Parts and accessories of motor vehicles category.7 As Souza and Castilho (2016) note, much of this trade takes place between the countries of the Southern Common Market (MERCOSUR) and with the United States.
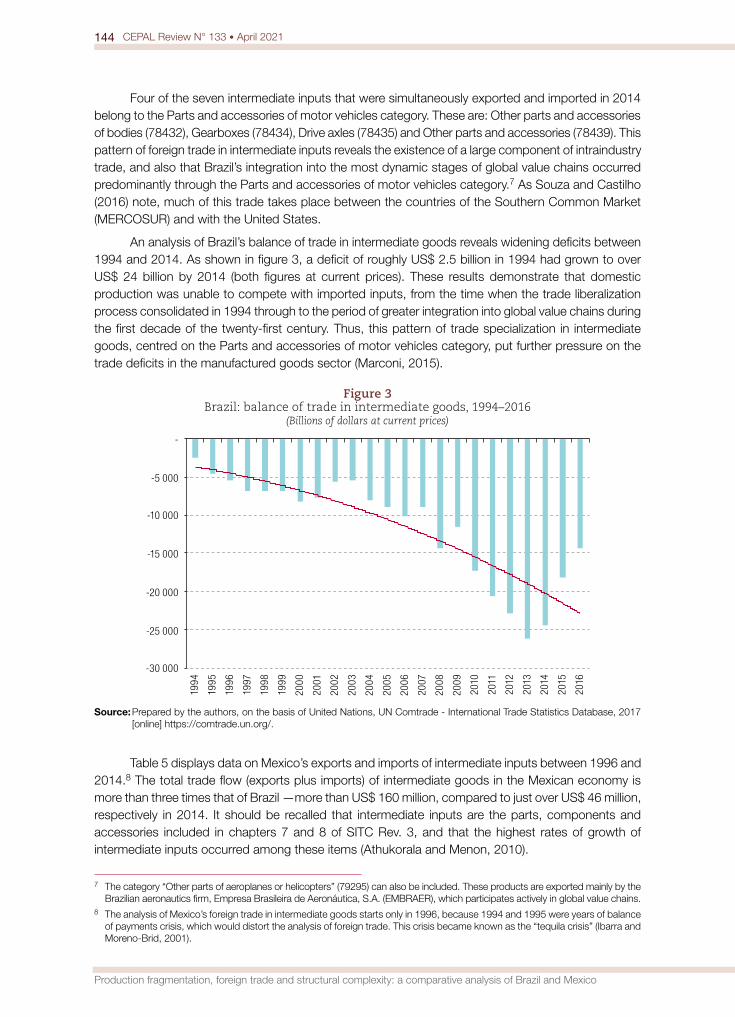
An analysis of Brazil’s balance of trade in intermediate goods reveals widening deficits between 1994 and 2014. As shown in figure 3, a deficit of roughly US$ 2.5 billion in 1994 had grown to over US$ 24 billion by 2014 (both figures at current prices). These results demonstrate that domestic production was unable to compete with imported inputs, from the time when the trade liberalization process consolidated in 1994 through to the period of greater integration into global value chains during the first decade of the twenty-first century. Thus, this pattern of trade specialization in intermediate goods, centred on the Parts and accessories of motor vehicles category, put further pressure on the trade deficits in the manufactured goods sector (Marconi, 2015).
Figure 3 Brazil: balance of trade in intermediate goods, 1994–2016
(Billions of dollars at current prices)
-30 000
-25 000
-20 000
-15 000
-10 000
-5 000
-
1994
1995
1996
1997
1998
1999
2000
2001
2002
2003
2004
2005
2006
2007
2008
2009
2010
2011
2012
2013
2014
2015
2016
Source: Prepared by the authors, on the basis of United Nations, UN Comtrade - International Trade Statistics Database, 2017 [online] https://comtrade.un.org/.
Table 5 displays data on Mexico’s exports and imports of intermediate inputs between 1996 and 2014.8 The total trade flow (exports plus imports) of intermediate goods in the Mexican economy is more than three times that of Brazil —more than US$ 160 million, compared to just over US$ 46 million, respectively in 2014. It should be recalled that intermediate inputs are the parts, components and accessories included in chapters 7 and 8 of SITC Rev. 3, and that the highest rates of growth of intermediate inputs occurred among these items (Athukorala and Menon, 2010).
7 The category “Other parts of aeroplanes or helicopters” (79295) can also be included. These products are exported mainly by the Brazilian aeronautics firm, Empresa Brasileira de Aeronáutica, S.A. (EMBRAER), which participates actively in global value chains.
8 The analysis of Mexico’s foreign trade in intermediate goods starts only in 1996, because 1994 and 1995 were years of balance of payments crisis, which would distort the analysis of foreign trade. This crisis became known as the “tequila crisis” (Ibarra and Moreno-Brid, 2001).

145CEPAL Review N° 133 • April 2021
Kaio Glauber Vital da Costa, Marta Reis Castilho and Martín Puchet Anyul
Table 5 Mexico: top ten intermediate inputs exported and imported, 1994 and 2014
(Percentages of total intermediate inputs)
Codes of the Standard International Trade Classification, Revision 3 1996 Codes of the Standard International
Trade Classification, Revision 3 2014
Exports
7611 - Telecommunication apparatus and equipment 21 7611 - Telecommunication apparatus and equipment 21
71322 - Power-generating machinery and equipment 14 77313 - Electrical machinery and equipment 9
76493 - Telecommunication apparatus and equipment 9 82119 - Furniture and parts thereof 7
77641 - Electrical machinery and equipment 6 78432 - Parts and accessories of motor vehicles 6
78439 - Parts and accessories of motor vehicles 5 77261 - Electrical machinery and equipment 5
77259 - Electrical machinery and equipment 4 71322 - Power-generating machinery and equipment 4
77255 - Electrical machinery and equipment 3 78435 - Parts and accessories of motor vehicles 4
74159 - General industrial machinery 3 71391 - Power-generating machinery and equipment 4
77812 - Electrical machinery and equipment 2 78434 - Parts and accessories of motor vehicles 3
71392 - Power-generating machinery and equipment 2 78433 - Parts and accessories of motor vehicles 2
Imports
78432 - Parts and accessories of motor vehicles 8 78439 - Parts and accessories of motor vehicles 11
77611 - Electrical machinery and equipment 8 75997 - Office machines and automatic data-processing machines
7
77645 - Electrical machinery and equipment 7 78432 - Parts and accessories of motor vehicles 6
77259 - Electrical machinery and equipment 5 71323 - Power-generating machinery and equipment 5
7722 - Electrical machinery and equipment 5 78434 - Parts and accessories of motor vehicles 5
77643 - Electrical machinery and equipment 4 77282 - Electrical machinery and equipment 4
71391 - Power-generating machinery and equipment 4 77259 - Electrical machinery and equipment 4
76493 - Telecommunication apparatus and equipment 4 7611 - Telecommunication apparatus and equipment 3
75997 - Office machines and automatic data-processing machines
3 71391 - Power-generating machinery and equipment 3
78435 - Parts and accessories of motor vehicles 3 78435 - Parts and accessories of motor vehicles 3
Source: Prepared by the authors, on the basis of United Nations, UN Comtrade - International Trade Statistics Database, 2017 [online] https://comtrade.un.org/.
Note: To highlight the product groups of the inputs, the descriptions of the product classifications are those given at the three-digit level, which are more general than those given for the five-digit classification of the main imported and exported inputs.
Table 5 further shows that Mexico’s imports and exports of intermediate inputs are both concentrated in fewer products than those of Brazil. In the case of exports, the largest share corresponds to Telecommunications apparatus and equipment (7611), which accounted for 21% of total exports of intermediate inputs. The share of exports of Power-generating machinery and equipment fell by 10% between 1996 and 2014. The largest increase was recorded in the Parts and accessories of motor vehicles category, which had a 5% share in 1996 and was based on exports of Other parts and accessories (78439). In 2014, exports of Parts and accessories of motor vehicles accounted for 15%, given the increases in export shares of Other body parts and accessories (78432), Brakes and parts thereof (78433), Gearboxes (78434) and Drive axles (78435). The Other vehicle parts and accessories segment accounted for a 12% share in 2013, indicating a sharp increase in its exports by 2014. Thus, unlike Brazil, where the Parts and accessories of motor vehicles category saw its share decline, Mexico’s foreign trade in intermediate inputs started to depend increasingly on the dynamics of these five product groups.

146 CEPAL Review N° 133 • April 2021
Production fragmentation, foreign trade and structural complexity: a comparative analysis of Brazil and Mexico
The sudden process of deregulation and the rapid elimination of tariff and non-tariff barriers to trade, which characterized the economic development strategy adopted by Mexico in the 1980s, led to an abrupt change in its trade pattern. The new foreign trade profile, based on exports and imports of inputs in the form of parts, pieces and components of the transport equipment and electrical and optical equipment sectors, fuelled the country’s trade deficits throughout the 1990s. Another worrying feature of this pattern of foreign trade is the increase in the import content of intermediate inputs in Mexican exports (Fujii and Cervantes, 2013), which tends to put further pressure on the economy’s balance of payments.
Figure 4 shows that, after NAFTA was signed in 1994, Mexico’s balance of trade in intermediate goods started to deteriorate. According to Moreno-Brid and Ros (2009), Mexico’s participation in NAFTA had apparently contradictory effects on its trade balance: while the surplus with its NAFTA trading partners grew, its trade balance with Asian countries, particularly China, deteriorated. The overall and sectoral result for intermediate goods saw the emergence of trade deficits. Since mid-2000s, these deficits in intermediate goods trade have been partly reversed by an increase in trade surpluses with the United States, which have more than offset the widening deficits with China.
Figure 4 Mexico: balance of trade in intermediate goods, 1994–2016
(Billions of dollars at current prices)
-25 000
-20 000
-15 000
-10 000
-5 000
-
5 000
1994
1995
1996
1997
1998
1999
2000
2001
2002
2003
2004
2005
2006
2007
2008
2009
2010
2011
2012
2013
2014
2015
2016
Source: Prepared by the authors, on the basis of United Nations, UN Comtrade - International Trade Statistics Database, 2017 [online] https://comtrade.un.org/.
It is with these different foreign trade profiles that Brazil and Mexico participate at quite different levels in global value chains. Medeiros and Trebat (2017) describe these different patterns of participation in global value chains among peripheral countries as highly asymmetric. The asymmetry arises from the growing concentration and centralization of power over the value created in global value chains, in which countries such as Brazil and Mexico participate in different stages of the production processes. The asymmetry is even greater in terms of the capacity of peripheral countries to appropriate the value created in those chains.
The hierarchical nature of the new international division of labour promotes fierce competition in production stages that have less capacity to generate value added, such as raw materials processing (Brazil). These generate lower wages for workers and smaller profit margins for firms. At the top of the hierarchy there is another pattern of competition, centred on the capacity to direct the flows of goods and services and innovation; and it is characterized by higher wages and higher profit margins for workers and firms, respectively (Medeiros and Trebat, 2017).

147CEPAL Review N° 133 • April 2021
Kaio Glauber Vital da Costa, Marta Reis Castilho and Martín Puchet Anyul
Table 6 shows that the foreign content of Brazilian and Mexican exports generally increased between 1995 and 2011. In Brazil, the value added content of exports increased by 3 percentage points, from 7.8% to 10.8%. According to the studies by Hermida (2016), Côrrea (2016) and Castilho, Torracca and Freitas (2019), this Brazilian share is relatively small compared to that of developed and peripheral countries. Although this percentage still shows the country’s scant participation in global value chains, there is significant growth in the shares of certain sectors. These are concentrated sectorally in automotive vehicle manufacturing (7.2%), rubber and plastics (6.7%), machinery and electrical equipment (6.6%), other transport equipment (6.5%) and electrical and optical equipment (6.5%). As a result, the share of imported value added in domestic manufacturing exports increased by 4.2% between 1995 and 2011.
Table 6 Brazil and Mexico: foreign value added contained in exports, 1995 and 2011
(Percentages of total exports)
SectorsBrazil Mexico
1995 2011 (percentages) 1995 2011 (percentages)
Total 7.8 10.8 3.0 27.3 31.7 4.4
Agriculture, hunting, forestry and fishing 4.9 9.5 4.6 5.3 10.7 5.4
Extractive industries and mining 10.1 9.9 -0.2 3.3 4.3 1.0
Total manufacturing 10.1 14.3 4.2 38.6 43.5 4.9
Food, beverages and tobacco 7.4 9.8 2.4 15.0 16.8 1.8
Textiles and textile products 6.0 8.9 2.9 31.6 37.5 5.9
Wood and products of wood and cork 5.2 9.2 4.0 10.1 18.2 8.0
Pulp, paper, articles of paper, printing and publishing 7.8 9.6 1.8 21.9 31.6 9.7
Coke, refined petroleum and nuclear fuel 18.2 21.4 3.2 6.2 25.5 19.3
Rubber and plastics 10.7 17.4 6.7 25.6 40.0 14.4
Other non-metallic minerals 9.3 12.3 3.0 13.6 18.6 5.0
Basic metals 13.6 15.8 2.2 20.6 16.6 -4.0
Fabricated metal 9.7 13.1 3.4 41.0 45.8 4.8
Other manufactures; recyclable articles 5.2 8.5 3.3 38.9 48.6 9.6
Machinery and equipment 10.6 16.2 5.6 32.5 37.2 4.8
Chemical products 11.4 15.8 4.5 14.8 26.3 11.5
Electrical machines and appliances 13.3 19.9 6.6 54.8 58.3 3.5
Manufacture of motor vehicles, trailers and semi-trailers 12.7 19.9 7.2 40.8 49.6 8.8
Other transport equipment 12.0 18.5 6.5 24.5 33.2 8.7
Electrical and optical equipment 17.6 24.1 6.5 62.0 64.1 2.1
Electricity, gas and water 2.1 5.9 3.8 7.6 15.3 7.8
Construction 6.3 8.9 2.6 11.3 11.3 0.0
Wholesale and retail trade; repairs 1.0 3.2 2.3 4.9 4.3 -0.6
Hotels and restaurants 4.1 6.2 2.2 3.5 4.0 0.5
Transport and storage 6.0 10.0 4.1 5.6 8.6 3.0
Postal and telecommunications services 5.2 5.9 0.8 7.0 12.2 5.2
Financial intermediation 1.9 3.3 1.4 2.2 3.5 1.3
Real estate activities 0.5 0.7 0.3 1.4 1.0 -0.4
Rental of machinery and equipment 6.8 7.5 0.8 4.7 5.6 0.9
Information technology and related activities 2.9 7.0 4.0 3.4 2.8 -0.6
Research and development and other business activities 3.7 4.8 1.1 5.0 3.2 -1.9

148 CEPAL Review N° 133 • April 2021
Production fragmentation, foreign trade and structural complexity: a comparative analysis of Brazil and Mexico
SectorsBrazil Mexico
1995 2011 (percentages) 1995 2011 (percentages)
Public administration and defence; compulsory social security 3.0 4.2 1.2 1.5 1.4 -0.1
Education 2.6 3.3 0.7 4.8 4.7 -0.1
Health and social work 5.1 6.8 1.7 5.9 5.4 -0.5
Other community, social and personal service activities 5.6 6.5 0.9 35.0 37.0 2.1
Source: Prepared by the authors, on the basis of European Commission (EC), World Input-Output Database, 2013 [online] http://www.wiod.org/home.
The Mexican economy’s participation in global value chains was almost three times greater than that of Brazil, rising from 27.3% to 31.7% between 1995 and 2011. In manufacturing, the difference is even greater, since in 2011 the foreign value added contained in each country’s manufacturing exports was 43.5% in Mexico but just 14.3% in Brazil. Within Mexico’s manufacturing sector, the largest sectoral increases were recorded in coke, refined petroleum products and nuclear fuel (+19.3%), rubber and plastics (+14.4%) and chemicals (+11.5%).
Divergent patterns of trade specialization and integration into value chains have tended to reinforce Brazil’s upstream participation, that is in the early stages of production processes through raw material exports. In contrast, Mexico’s participation is more intensive and is located in the later stages of the value chains, with the country processing intermediate inputs for subsequent export. Despite the different reasons for Brazil’s weak capacity to integrate into these networks —such as the “excessive” industrial vertical integration inherited from the import substitution period (Canuto, Fleischhaker and Schellekens, 2015)— the recent increase in the use of imported intermediate inputs has undoubtedly led to changes in intersectoral linkages.
Mexico’s high degree of integration into global value chains did not forge strong linkages between the export manufacturing sector and the domestic production structure. According to Ruiz-Nápoles (2004) and Fujii and Cervantes (2012 and 2017), Mexico’s membership of NAFTA and its more active participation in value chains failed to trigger a dynamic structural reform process generating income and more highly skilled jobs.9 The large import content of Mexico’s manufacturing exports —and the resulting delinkage between the manufacturing export sector and the rest of the economy— is identified as one of the reasons for the country’s slow growth since becoming part of NAFTA (Moreno-Brid and Ros, 2009). This disconnect dampened the effect of the export multiplier on economic growth (Ruiz-Nápoles, 2004). The far reaching changes observed in Mexican exports —from a pattern concentrated in oil exports in the 1980s to concentration in more technology-intensive products— failed to elicit structural changes in the sense described above. In fact, this export-import pattern actually accentuated the rigidity of exports and the structural dependency on imported inputs.
The two countries’ production structures responded differently to the changes occurring in foreign trade. However, the result common to both countries was what is conventionally referred to as a loss of density or complexity in intersectoral linkage (Coutinho, 1997; Britto, 2002; Marconi, 2015). Studies show that this loss of complexity generally goes hand-in-hand with a smaller manufacturing share in value added (Marconi, 2015), a reduction in the value of backward and forward linkages, or a loss of linkages in various parts of the production chains (Coutinho, 1997; Kupfer, 2005). An analysis of complexity based on the determinants of input-output matrices affords a complementary reading of the indicators analysed above.
As figure 5 shows, the structural complexity index declined in both countries during the period under review; and Brazil’s production structure was more complex than Mexico’s. The structural complexity index fell by 10.8, from 21.5 to 10.7, in Brazil and by 3.9, from 8.3 to 4.4 in Mexico.
9 According to Katz (2000).

149CEPAL Review N° 133 • April 2021
Kaio Glauber Vital da Costa, Marta Reis Castilho and Martín Puchet Anyul
Although the two economies’ international integration strategies differ in intensity, and the two countries participate in different stages of global value chains, both Brazil and Mexico have seen their production structures become less complex.
Figure 5 Brazil and Mexico: structural complexity index, 1995–2011
0
5
10
15
20
25
1995
1996
1997
1998
1999
2000
2001
2002
2003
2004
2005
2006
2007
2008
2009
2010
2011
MexicoBrazil
Source: Prepared by the authors, on the basis of European Commission (EC), World Input-Output Database, 2013 [online] http://www.wiod.org/home.
The various reasons identified for this loss of complexity include the increased dependency of domestic production on imported intermediate inputs, which seems to have been due to a combination of greater trade openness and the microeconomic behaviour of domestic and transnational firms based in the countries in question. Greater integration meant a general increase in the import content of the intersectoral linkage. Although to different degrees, the integration of Brazil and Mexico into global production and value networks during the 2000 decade appears to have reinforced the trade specialization patterns inherited from the previous decade. This is because both countries started to rely increasingly on imports of parts, components and accessories, which, in turn, tended to make their export patterns more rigid. Brazil and Mexico needed their traditional export sectors to grow more strongly, to generate trade surpluses and thus contain the deficits in current transactions.
The results show how the differences in the two economies’ external integration models made both of them more reliant on imported inputs. Throughout the 2000s, Mexico’s trade profile reflected the intensification of economic policies that provided incentives to maquila firms (Moreno-Brid and Ros, 2009), with a high input content imported from the various subsidiaries of transnational corporations. In contrast, the Brazilian trade profile followed a path of greater reprimarization, and the import content of its production increased. This led to foreign trade structures that diverged progressively on the export side, but not in terms of imports, as discussed at the start of this section.10 While Mexican exports were concentrated in manufactured goods with high levels of economic complexity and technological content, in the Brazilian case the share of agricultural and industrial commodities in exports increased sharply on the back of the commodity boom, one of the characteristics of which is a low level of economic or technological complexity.
10 The divergence between the Mexican and Brazilian export structures can be seen in the evolution of the economic complexity indices estimated in the Atlas of Economic Complexity, coordinated by Hausmann (see [online] http://atlas.cid.harvard.edu/rankings/2010?country=chi). As noted above, this is based on the composition of the countries’ exports. In the case of Mexico, the economic complexity index increased and its ranking improved. In Brazil, the opposite happened, as both deteriorated between 1995 and 2010.

150 CEPAL Review N° 133 • April 2021
Production fragmentation, foreign trade and structural complexity: a comparative analysis of Brazil and Mexico
As noted at the start of this section, an analysis on the import side revealed a growing trade deficit in intermediate inputs in both economies. This persistent deficit indicates that the demand circuits for intermediate goods, which were previously served by domestic producers, were gradually replaced by foreign suppliers.11 According to Medeiros, Freitas and Passoni (2019), Marcato and Ultremare (2018) and Fujii and Cervantes (2013), increased import penetration caused the demand for intermediate inputs to leak abroad, thereby reducing the density of the domestic production structure.
These findings are important because they show how, in the Mexican maquila model, the economic complexity of its exports increased while its production structure became less complex. In contrast, in the Brazilian model the indicators of economic and structural complexity both declined. Thus, although the two countries differed in the external integration models they adopted, they shared a common outcome: a loss of complexity in their production structures. It is striking that structural complexity of the two economies declined while they became more dependent on imported inputs. This sheds light on the role played in these economies by imported inputs, which may be replacing the intermediate demand circuits previously served by domestic producers (Costa, Castilho and Puchet, 2018).
IV. Conclusions
This article has analysed the effects of trade specialization patterns on the production structures of Brazil and Mexico between 1995 and 2011, in an environment of fragmentation of production. The study seeks not only to elucidate processes of structural change in Brazil and Mexico, but also, from an analytical and methodological perspective, to contribute to the analysis of the complexity of the two economies using the structural complexity index. This index shows how the sectors interact, and makes it possible to determine the effects of exports and imports on the level and pattern of interdependence between sectors; in other words, it sheds light on the relationships that exist between structural change and foreign trade.
A comparative study of these two economies is justified for a number of reasons —in particular, the similarity of the two countries’ industrial sector, in terms of both size and diversification; and the fact that they are the two largest economies in Latin America, which gives them an important role in the dynamics of the region’s other economies. Brazil became more specialized in exporting natural-resource-based products, while on the import side it became increasingly dependent on foreign sourced intermediate inputs, mainly machinery and transport equipment. In contrast, Mexico’s exports have become more concentrated in export-oriented manufacturing maquilas, particularly in the machinery, and transport equipment and electrical equipment sectors; and its imports have been concentrated in intermediate inputs for those same sectors.
The two countries’ integration into global value chains tended to further deepen the trade patterns established during the 1990s. Brazil strengthened its participation in the early stages of value chains —that is in the initial stages of production processes— by exporting raw materials. Mexico, in contrast, participated more intensively in those chains, positioning itself in the later stages, where it processes imported intermediate inputs for subsequent export. Despite its more intensive participation in global value chains, it has been unable to forge strong linkages between the export manufacturing sector and the domestic production structure, which could have generated dynamic structural reform processes. This, at least partly, explains the relative lack of complexity of the Mexican economy. In the period analysed, both economies lost complexity, as the imported content of intermediate goods grew.
11 Costa (2017) calculates the structural complexity index for both economies, based on the difference between the domestic and total matrices (domestic intermediate demand plus imported intermediate demand). This calculation revealed that an increasing proportion of intermediate demand circuits were being closed by foreign suppliers through imports.

151CEPAL Review N° 133 • April 2021
Kaio Glauber Vital da Costa, Marta Reis Castilho and Martín Puchet Anyul
For Mexico, membership of NAFTA and deeper integration into global value chains were two closely related phenomena, which had weaker effects on income, employment and the generation of national value added than had been expected in the early 1990s.
In terms of import structure, the coincidence between the main importing sectors in 1995 and 2011 suggests a degree of rigidity in the two economies’ production profiles. In this connection, regional agreements (MERCOSUR and NAFTA) and global value chain participation seem to have intensified the characteristics inherited from the import substitution industrialization period. One of these is the inability of the domestic supply of intermediate goods to satisfy demand at times of robust economic growth, which increases reliance on imported intermediate inputs. This greater presence of imported inputs has suggested the occurrence of a process of deindustrialization or loss of density in the Brazilian production structure, and a reduction in the capacity of Mexican maquilas to generate spillover effects in the domestic economy. The persistent decline in both economies’ structural complexity indices shows that the increased presence of imported inputs, which have replaced domestically produced inputs in the intermediate demand circuits, seems to have reduced structural complexity in both countries.
Bibliography
Adami, C. (2002), “What is complexity?”, BioEssays, vol. 24, No. 12, December.Amaral, J., J. Dias and J. Lopes (2007), “Complexity as interdependence in input–output systems”, Environment
and Planning A: Economy and Space, vol. 39, No. 7.Aroche Reyes, F. (1993), “Economic structures in Brazil, Mexico and South Korea: an input-output application”,
doctoral thesis, London, Queen Mary University of London.Arthur, W. (1999), “Complexity and the economy”, Science, vol. 284, No. 5411, Washington, D.C., American
Association for the Advancement of Science (AAAS).Athukorala, P. and J. Menon (2010), “Global production sharing, trade patterns, and determinants of trade
flows in East Asia”, Working Papers Series on Regional Economic Integration, No. 41, Mandaluyong, Asian Development Bank (ADB), January.
Baldwin, R. (2011), “Trade and industrialisation after globalisation’s 2nd unbundling: how building and joining a supply chain are different and why it matters”, NBER Working Paper, No. 17716, Cambridge, National Bureau of Economic Research (NBER), December.
Basu, R. and T. Johnson (1996), “The development of a measure of intersectoral connectedness by using structural path analysis”, Environment and Planning A: Economy and Space, vol. 28, No. 4.
Boddin, D. (2016), “The role of newly industrialized economies in global value chains”, IMF Working Paper, No. 16/207, Washington, D.C., International Monetary Fund (IMF), October.
Bott, R. and J. Mayberry (1954), “Matrices and trees”, Economic Activity Analysis, O. Morgenstern (ed.), New York, John Wiley & Sons.
Britto, G. (2002), “Abertura comercial e reestruturação industrial no Brasil: um estudo dos coeficientes de comércio”, master’s thesis in Economic Sciences, Campinas, State University at Campinas.
Canuto, O., C. Fleischhaker and P. Schellekens (2015), “The curious case of Brazil’s closedness to trade”, Policy Research Working Paper, No. 7228, Washington, D.C., World Bank, April.
Castilho, M., J. Torracca and F. Freitas (2019), “The competitiveness of Brazilian manufacturing in both domestic and international markets”, International Integration of the Brazilian Economy, E. Grivoyannis (ed.), New York, Palgrave Macmillan.
Chenery, H. (1980), “Interactions between industrialization and exports”, World Bank Reprint Series, No. 150, Washington, D.C., World Bank.
Chenery, H. and T. Watanabe (1958), “International comparisons of the structure of production”, Econometrica: Journal of the Econometric Society, vol. 26, No. 4, October.
Côrrea, L. (2016), “Trajetórias dos países em desenvolvimento nas cadeias globais de valor: upgrading, estágio produtivo e mudança estrutural”, doctoral thesis in Economics, Rio de Janeiro, Rio de Janeiro’s Federal University.

152 CEPAL Review N° 133 • April 2021
Production fragmentation, foreign trade and structural complexity: a comparative analysis of Brazil and Mexico
Costa, K. (2017), “Entre similaridades e diferenças nos padrões de comércio exterior e de estrutura produtiva do Brasil e do México: uma análise multissetorial a partir de matrizes de insumo-produto”, doctoral thesis in Economics, Rio de Janeiro, Rio de Janeiro’s Federal University.
Costa, K., M. Castilho and M. Puchet (2018), “Structure productive et effet d’entraînements productifs à l’ère des chaînes globales de valeur: une analyse input-output”, Revue d’Économie Industrielle, vol. 3, No. 163.
Coutinho, L. (1997), “A especialização regressiva: um balanço do desempenho industrial pós-estabilização”, Brasil: desafios de um país em transformação, J. Velloso (coord.), Rio de Janeiro, José Olympio Editora.
Dietzenbacher, E. (1992), “The measurement of interindustry linkages: key sectors in the Netherlands”, Economic Modelling, vol. 9, No. 4, October.
Durlauf, S. (2005), “Complexity and empirical economics”, The Economic Journal, vol. 115, No. 504, June.Finn, J. (1976), “Measures of ecosystem structure and function derived from analysis of flows”, Journal of
Theoretical Biology, vol. 56, No. 2.Fontana, M. (2008), “The complexity approach to economics: a paradigm shift”, Working Paper, No. 2008/01, Torino,
Centro di Studi sulla Storia e i Metodi dell’Economia Politica “Claudio Napoleoni” (CESMEP).Fujii, G. and R. Cervantes (2017), “The weak linkages between processing exports and the internal economy:
the Mexican case”, Economic Systems Research, vol. 29, No. 4.(2013), “Mexico: value added in exports of manufactures”, CEPAL Review, No. 109 (LC/G.2556-P), Santiago, Economic Commission for Latin America and the Caribbean (ECLAC). (2012), “The Mexican trade liberalization process and its net effects on employment: 1988-2004”, EconoQuantum, vol. 9, No. 2.
Gazon, J. and M. Nihon (1976), Transmission de l’influence économique, une approche structurale, Paris, Sirey.Guo, D., G. Hewings and M. Sonis (2005), “Integrating decomposition approaches for the analysis of temporal
changes in economic structure: an application to Chicago’s economy from 1980 to 2000”, Economic Systems Research, vol. 17, No. 3.
Hausmann, R. and C. Hidalgo (2011), “The network structure of economic output”, Journal of Economic Growth, vol. 16, No. 4, December.
Hausmann, R., J. Hwang and D. Rodrik (2007), “What you export matters”, Journal of Economic Growth, vol. 12, No. 1, March.
Hausmann, R. and others (2014), The Atlas of Economic Complexity: Mapping Paths to Prosperity, Cambridge, The MIT Press.
Hermida, C. (2016), “Padrão de especialização comercial e crescimento econômico: uma análise sobre o Brasil no contexto da fragmentação da produção e das cadeias globais de valor”, doctoral thesis in Economics, Uberlândia, Federal University of Uberlândia.
Hewings, G. and others (1998), “The hollowing-out process in the Chicago economy, 1975-2011”, Geographical Analysis, vol. 30, No. 3.
Hidalgo, C. and others (2007), “The product space conditions the development of nations”, Science, vol. 317, No. 5837, Washington, D.C., American Association for the Advancement of Science (AAAS).
Hirschman, A. (1958), The Strategy of Economic Development, Yale Studies in Economics, vol. 10, New Haven, Yale University Press.
Ibarra, D. and J. Moreno-Brid (2001), “Currency boards and monetary unions: the road ahead or a cul de sac for Mexico’s exchange rate policy?”, Mexico beyond NAFTA: Perspectives for the European Debate, M. Puchet and L. Punzo (eds.), London, Routledge.
Jensen, R. and G. West (1980), “The effect of relative coefficient size on input-output multipliers”, Environment and Planning A: Economy and Space, vol. 12, No. 6.
Kaldor, N. (1967), Strategic Factors in Economic Development, Ithaca, ILR Press. Katz, J. (2000), Reformas estructurales, productividad y conducta tecnológica en América Latina, Santiago,
Fondo de Cultura Económica/Economic Commission for Latin America and the Caribbean (ECLAC). Kume, H. (1996), “A política de importação no plano real e a estrutura de proteção efetiva”, Texto para
Discussão, No. 423, Rio de Janeiro, Institute for Applied Economic Research (IPEA), May.Kupfer, D. (2005), “A indústria brasileira após a abertura”, Brasil em desenvolvimento: economia, tecnologia
e competitividade, A. Castro and others (eds.), Rio de Janeiro, Civilização Brasileira.

153CEPAL Review N° 133 • April 2021
Kaio Glauber Vital da Costa, Marta Reis Castilho and Martín Puchet Anyul
Kupfer, D. and others (2013), “Different partners, different patterns: trade and labour market dynamics in Brazil’s post-liberalization period”, OECD Trade Policy Papers, No. 149, Paris, Organization for Economic Cooperation and Development (OECD).
Lantner, R. (1974), Théorie de la dominance économique, Paris, Dunod.(1972), “L’analyse de la dominance économique”, Revue d’économie politique, vol. 82, No. 2.
Lantner, R. and D. Lebert (2015), “L’input-output est mort? Vive l’analyse structurale!: Dominance et amplification des influences dans les structures linéaires”, Économie Appliquée, vol. 68, No. 3. (2013), “Dominance, dependence and interdependence in linear structures: a theoretical model and an application to the international trade flows”, CES Working Papers, No. 43, Paris, University of Paris.
Lantner, R. and F. Carluer (2004), “Spatial dominance: a new approach to the estimation of interconnectedness in regional input-output tables”, The Annals of Regional Science, vol. 38, No. 3, September.
Lewis, W. (2006), The Theory of Economic Growth, London, Routledge. López, J. (1998), La macroeconomía de México: el pasado reciente y el futuro posible, Ciudad de México,
Miguel Ángel Porrua.Marcato, M. and F. Ultremare (2018), “Produção industrial e vazamento de demanda para o exterior: uma análise
da economia brasileira”, Economia e Sociedade, vol. 27, No. 2, Campinas, State University at Campinas. Marconi, N. (2015), “Estrutura produtiva e desenvolvimento econômico”, Indústria e desenvolvimento produtivo
no Brasil, N. Barbosa and others (coords.), Rio de Janeiro, Elsevier. McMillan, M. and D. Rodrik (2011), “Globalization, structural change and productivity growth”, NBER Working
Paper, No. 17143, Cambridge, National Bureau of Economic Research (NBER), June.Medeiros, C. and N. Trebat (2017), “Finance, trade, and income distribution in global value chains: implications
for developing economies and Latin America”, Discussion Paper, No. 002, Rio de Janeiro, Rio de Janeiro’s Federal University, January.
Medeiros, C., F. Freitas and P. Passoni (2019), “Structural change and the manufacturing sector in the Brazilian economy: 2000-2014”, The Manufacturing Sector in Argentina, Brazil, and Mexico: Transformations and Challenges in the Industrial Core of Latin America, Palgrave Studies in Latin American Heterodox Economics, J. E. Santarcángelo (ed.), Cham, Palgrave Macmillan.
Moreno-Brid, J. and J. Ros (2009), Development and Growth in the Mexican Economy: A Historical Perspective, New York, Oxford University Press.
Peacock, A. and D. Dosser (1957), “Input-output analysis in an underdeveloped country: a case study”, The Review of Economic Studies, vol. 25, No. 1, October.
Puchet, M. (1996), “Análisis de la integración económica: aspectos del caso EUA-México”, La inserción internacional del MERCOSUR: ¿mirando al Sur o mirando al Norte?, L. Bizzozero and M. Vaillant (eds.), Montevideo, Arca.
Rasmussen, P. (1957), Studies in Inter-Sectoral Relations, Amsterdam, North-Holland. Robinson, S. and A. Markandya (1973), “Complexity and adjustment in input-output systems”, Oxford Bulletin
of Economics and Statistics, vol. 35, No. 2, Oxford, Basil Blackwell.Rodrik, D. (2006), “What’s so special about China’s exports?”, China & World Economy, vol. 14, No. 5.Romero, I., E. Dietzenbacher and G. Hewings (2009), “Fragmentation and complexity: analyzing structural
change in the Chicago regional economy”, Revista de Economía Mundial, No. 23. Ros, J. (2015), Grandes problemas: ¿cómo salir de la trampa del lento crecimiento y alta desigualdad?,
Ciudad de México, El Colegio de México/National Autonomous University of Mexico (UNAM).(1994), “Mexico’s trade and industrialization experience since 1960: a reconsideration of past policies and assessment of current reforms”, Trade Policy and Industrialization in Turbulent Times, G. Helleiner (ed.), New York, Routledge.
Rosser, J. (1999), “On the complexities of complex economic dynamics”, The Journal of Economic Perspectives, vol. 13, No. 4.
Rostow, W. (1959), “The stages of economic growth”, The Economic History Review, vol. 12, No. 1.Ruiz-Nápoles, P. (2004), “Exports, growth, and employment in Mexico, 1978-2000”, Journal of Post Keynesian
Economics, vol. 27, No. 1.

154 CEPAL Review N° 133 • April 2021
Production fragmentation, foreign trade and structural complexity: a comparative analysis of Brazil and Mexico
Sarti, F. and C. Hiratuka (2018), “Desempenho recente da indústria brasileira no contexto de mudanças estruturais domésticas e globais”, Para além da política econômica, R. Carneiro, P. Baltar and F. Sarti (coords.), São Paulo, Editora Unesp.
Simon, H. (1962), “The architecture of complexity”, Proceedings of the American Philosophical Society, vol. 106, No. 6, December.
Sonis, M. and G. Hewings (1998), “Economic complexity as network complication: multiregional input-output structural path analysis”, The Annals of Regional Science, vol. 32, No. 3, August.
Souza, K. and M. Castilho (2016), “Integração produtiva e acordos comerciais: o caso dos países da Aladi”, Economia e Sociedade, vol. 25, No. 1, Campinas, State University at Campinas.
Torracca, J. (2017), “Coevolução das estruturas de produção e comércio exterior da indústria brasileira: convergência ou desarticulação?”, doctoral thesis, Rio de Janeiro, Rio de Janeiro’s Federal University, May.
Ulanowicz, R. (1983), “Identifying the structure of cycling in ecosystems”, Mathematical Biosciences, vol. 65, No. 2, August.
Wong, Y. (1954), “Some mathematical concepts for linear economic models”, Economic Activity Analysis, O. Morgenstern (ed.), New York, John Wiley & Sons.
Yan, C. and E. Ames (1965), “Economic interrelatedness”, The Review of Economic Studies, vol. 32, No. 4, October.