production and marketing of truck crops in the territory of hawaii - ctahr
TRANSCRIPT

HAWAII AGRICULTURAL EXPERIMENT STATIONHONOLULU, HAWAll
tinder the joint Sll]}(']·vision of the
ITNITEI> STA1']~S nEPAI{T~IEN1' OF AGRIC{TI.JT{TRE
and the
UNIV]~RSITYOF HAlVAII
BULLETIN NO. 78
HONOI.JULU, HA'VAII APRIL, 1938
PRODUCTION AND MARKETING OFTRUCK CROPS IN THE
TERRITORY OF HAWAIIBy
O. C. MAGISTAD, Ph.D., Director
and
T. O. FRAZIER, Statistician
CON1'ENTSPage
Introduction...................................................................................................................................... 1Estimated acreage of truck crops produced in Hawaii...................................................... 3Estimated production of truck crops in Hawaii.................................................................. 9Additional statistics relating to crop estimates.................................................................... 14Grading and packing.................................................................................................................... 18Marketing of truck crops............................................................................................................ 25Conclusion......................................................................................................................................... 32Appendix........................................................................................................................................... 35
INTRODUCTION 1
Production of fresh vegetables in the Territory of Hawaii is equalto about 60 percent of local consumption 2. There are also, of course,large imports of canned, dried, and prepared vegetables. It has beenmore profitable to use local lands and resources for growth of crops
1 The writers wish to express their appreciation of the contributions to this projectmade by H. H. Warner, director, Agricultural Extension Service; R. H. Gast, manager, Growers' Service Department, Inter-Island Steam Navigation Company; andH. B. Cady, marketing specialist, Agricultural Extension Service.2 "Hawaii's Food Supply and The Maritime Strike of 1936-1937" by H. B. Cady, Bulletin No. 30, Agricultural Extension Service, Honolulu, T. H., June 1937, p. 30, fig. 8.

2 nULLFJTIN NO. 78, IIA'VAIl FJXPERIM]~NT STATION
yielding higher returns, purchasing needful vegetables from mainlandUnited States, but such a policy has some drawbacks. Consumptionof fresh green vegetables by laboring classes in the cities and onplantations is low and should be increased, as the prevailing ricediet is often not adequate. Many small farmers could and do maketheir livings growing truck crops on marginal land, but they havehad little help in the production and still less in the marketing oftheir crops. With assistance, it is believed that truck farming in theTerritory can become more of an industry, with local production ofmany commodities now shipped into the Territory. Availability ofsugar processing tax funds for the general benefit of agriculture inthe Territory provided the means by which studies of truck cropproduction and marketing of locally grown vegetables could be improved. Experimental work on production problems has also beeninitiated. This bulletin reports work done with the processing taxfunds on a survey of production and marketing problems.
LEGAL AUTHORITY
Pursuant to Section 15 of the Agricultural .Adjustment Act, approved May 12, 1933 (48 Stat. 31) as amended by the act approvedMay 9, 1934 (48 Stat. 670), the President, by Proclamation No.2091 as amended by ProclaD:lations No. 2100 and 2127, derreedthat a certain amount of the processing taxes collected on Hawaiiansugar sho.uld be held as a separate fund to be used and expended forthe benefit of agriculture in the Territory of Hawaii, as the Secretary of Agriculture, with the approval of the President, shoulddirect. In behalf of the Territory of Hawaii, the Hawaii AgriculturalAdvisory Committee, consisting of the Governor of the Islands, arepresentative of the sugar industry, the President of the Universityof Hawaii, and the local representative of the Agricultural Adjustment Administration, Department of Agriculture, considered meansof devoting this fund to the interest of a more efficient utilization ofland in the Territory. The committee recommended, and the President and Secretary approved the allotment of $60,000 of this fundto the Hawaii Agricultural Experiment Station for development oftruck farming and improvement of marketing facilities for farmproducts.
After January 6, 1936, when the decision of the Supreme Courtinvalidated the Agricultural Adjustment Act \vith respect to the collection and use of processing taxes, the unexpended balance of the

PRODUC1"ION AND MAHKEyrING OF TRUCK CROPS 3
truck farming and marketing fUJ/ld was made available in the Supplemental Appropriation .A.ct, fiscal! year 1936 (49 Stat. 116).
This allotment was originally set up for one year's activity, butthe census and marketing pordons were spread over an IS-monthperiod, while the production repearch portion of the fund is beingcontinued over a 3D-month period.
The census and marketing work was done in cooperation betweenthe Agricultural Extension Service of the University of Hawaii andthe United States Departnlent of Agriculture. Tl?e work was sobeneficial to the grovvers and consumers of the Territory that theTerritorial Legislature of 1937 passed Act 205, appropriating $30,000for the ensuing biennium. This appropriation provides for continuation of the truck crop estimates and marketing work under the supervision of the Agricultural Extension Service.
ESTIMATED ACREAGE OF TRUCK CROPS PRODUCEDIN HAWAII
STATISTICAL BACKGROUND
Previous to 1936, the main source of statistical data on the acreages of crops produced in Hawaii other than sugarcane and pineapples was the United States Agricultural Census of 1930, supplemented by yearly surveys of acreages planted to coffee and rice andestimates of acreages of some of the more important truck crops,made by the Agricultural Extension Service of the University ofHawaii. This information ,vas deficient in several matters.
John Wesley Coulter\ in making a detailed study of land utilization in the Hawaiian Islands including events up to the spring of1933, stated that it was impossible to find out exactly the total ofscattered areas of land used for some of the smaller crops, or todetermine the acreages of a few minor crops on Maui and Molokai,two islands which are considered as a unit in the United States censusof 1930. He expressed the hope that "an accurate survey of all of thearable land of the Hawaiian Islands will soon be made."
"In each region, subregion, area, and subarea there is neededdetailed information on a~l types of farming carried on," he said. Adeficiency in the United States Agricultural Census of 1930, fully as
1 "Land Utilization in the Hawaiian Islands" by John Wesley Coulter, Ph.D., University of Hawaii Research Publication No.8, Honolulu, T. H., 1933, pp. 41, 47, 49,and 134.

4 RULLE~rIN NO. 78, HAWAII EXPERIMENT STATION
important as the defects observed by Dr. Coulter, is the lack of dataon marketing of truck crops produced in Hawaii, information whichis essential in helping the truck crop farmer.
CENSUS OF TRUCK CROPS PRODUCED IN HAWAII
(January-May, 1936)
With the availability of .funds for the benefit of truck crop farming in the Territory of Hawaii at the beginning of 1936, it was considered advisable to make a detailed survey of the area under cuItivation of crops other than sugarcane and pineapples for the purposesof bringing up to date statistics on crop acreages, filling in the lackof information on truck crop farming, and establishing a firm basisfor a crop estimating service in the Territory. The survey was begunon January 2, 1936, and completed on May 9 of the same year.Figures were obtained by a staff of trained agriculturists who madea careful personal canvass of every farm on the Islands of Hawaii,Maui, Oahu, Kauai, and Molokai. Valuable assistance was renderedthese enumerators by county agents of the Agricultural ExtensionService and various agencies and individuals. Planted acreage andestimated production of all crops for human consumption exceptsugarcane and pineapples, as well as data on where these crops wereto be marketed, were reported, and these statistics were subsequentlycompiled at headquarters for each locality, judicial district, island,and finally for the entire Territory. The total for each island andthe combined total for the Territory were published June 1, 1936 ina pamphlet entitled Census of Truck Crops Produced in H a'lvaii(January-M ay, 1936) which will be referred to hereinafter as the"Crop Census." The crops covered in this survey, occupying approximately 6 percent of the total cultivated land in the Territory,included fruits, nuts, coffee, rice, etc. Those commodities commonlydefined as truck crops occupied less than 2 percent of the Territory'sarable land.
MONTHLY TRUCK CROP ESTIMATES
The first periodic crop estimating service in the Territory of Ha\vaii was begun with the Estimate of Truck Crop Production in Hawaii for the Month of July, 1936. This crop forecast, a revision ofplanted acreage and an estimate of production for the month of July,was and a few before 1936.completed published days July 1,

PHUDucrrIUN AND l\lAHl\..FJ'I'INU 011' ~rHUCK CHOPS 5
I t was believed that the truck crop estimating service would beof distinct value to the farmers in planning their planting programsas well as to the \vholesalers and commission merchants in obtainingestimates of the quantity of local produce available. Since a largepart of the truck crop produce consumed in the Territory is shippedin from the mainland, many wholesalers have standing orders formainland shipment. This factor, together with the uncertainty as toquantities of truck crops available locally, induces the wholesaler toadopt the easiest course; namely, to continue shipments from themainland for the total amount of produce necessary rather than toplan on partial and uncertain delivery from local growers.
In the first crop estilnate, 25 of the more important truck cropcommodities were listed. It was found desirable, in subsequentmonths, to include 6 additional commodities in this group. Fieldestimates of each month's production were received in Honoluluheadquarters from enumerators before the twenty-fourth of the preceding nl0nth; for example, estinlates of September production werein the office by August 24, and the report was compiled, mimeographed, and mailed by September 1. In almost all cases theenumerators made direct personal inspection of the truck crop areasand then obtained from the farmers dates of plantings, probableamounts of harvest, and so forth, to confirm their own estimates.In only a very few cases were the services of farmer collaboratorsused in obtaining the estimates.
When each enumerator had completed his monthly survey, hewrote a last-minute report on the condition of crops in his territoryand sent it to headquarters, This information was summarized inthe comment sheet of the published bulletin.
Estimated acreages of the various commodities for the Territoryas a whole and for each of the five main islands as reported in themonthly truck crop estimate for the year July 1936 through June1937 are shown in tables 10 to 15, inclusive, in the appendix.Monthly averages of each commodity are computed. The tablesgive a picture, month by month, of total acreage devoted to eachcommodity and the error should not be made of totaling the monthlyacreages in order to arrive at the acreage planted to each commodityduring the year.
Estimated acreage forms the backbone of crop estimating work.Estimated production is based on planted acreage and follows itstrends as shown in figure 1. The curves for both acreage and pro-
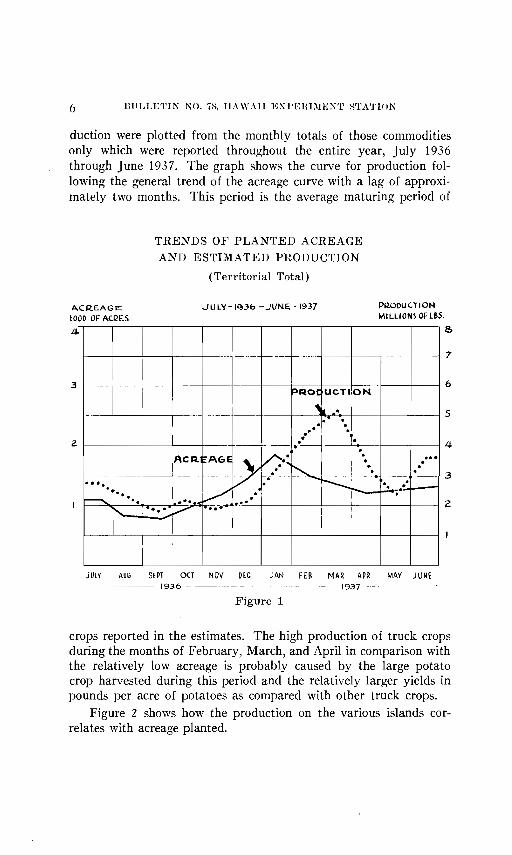
duction were plotted from the monthly totals of those commoditiesonly which were reported throughout the entire year, July 1936through June 1937. The graph shows the curve for production following the general trend of the acreage curve with a lag of approximately two months. This period is the average maturing period of
TRENDS OF PLANTED ACREAGE
AND ESTIMATED PRODUCTION
(Territorial Total)
ACREAGE1000 OF ACRES
4
JULV-I~36 -JUNE. 1937 PQODUCTIONtAl LLiONS OF LI~S.
&
f---+----f---t---+---+--+---t--t--+----t------t---t7
3 ~-+---+---+---+----t--__+-__+--t___-+__-_t_-___t_----1 6PROCUCTION
1-----+----+----+--.- --.---t----+-_--+-- '-"""ll .....•.+---i +--_-+------I 5..-. ..z. ••••• • • 4
r--~I--+--+-A-C-R.-+-I-A-G-'E-~,-y-t-~-••-.~.-,~t~ •••". .'••••
·....t... I // •••• --:--,~~.;:~ 3
~.. • •••"'!!V-,.. •__ ••• 2:.:.:.;,~ ...
JULY AUG SEPT OCT NOV DfC JAN FEB MAR APR MAY JUNE----- 1936 1937 -----
Figure 1
crops reported in the estimates. The high production of truck cropsduring the months of February, March, and April in comparison withthe relatively low acreage is probably caused by the large potatocrop harvested during this period and the relatively larger yields inpounds per acre of potatoes as compared with other truck crops.
Figure 2 shovvs how the production on the various islands correlates "vith acreage planted.
-
__ __ · __
~

PItOIJUC'rION AND l\lAHKE'rING 011' r:t'RUCK CROPS 7
PROPORTIONS OF PLANTED ACREAGE .A.ND ESTIMATEDPRODUCTION FOR EACH ISLAND
JULY 1936 JUNE 1937
Planted Acreage(Total monthly average
3,047.70 acres)
EstimatedProduction
(Annual Total-49,411,135 lbs.)
Figure 2
COMPARISON OF CROP ESTIMATES AND CROP CENSUS
Land occupied by commodities reported in the Crop Censustotaled 17,752 acres, itemized as follows:
AcresTruck crops -- 5,589Coffee 5,553
Broomcorn, field corn (dry), cotton, pigeonpeas__ 2,040Avocados and bananas 1,952Rice 1,2 76~uts 560Papaya 361Other fruits 421
Approximately one year later the acreage devoted to truck crop production as given in revised estimates was 3,056 acres. This figure is55 percent of the acreage given above. The following explanationscan be given for the nonagreement of the census figures with laterestimates:
(1) Enumerators failed to cover all truck crop areas in monthlyestimates; many small gardens surveyed during the original
-
_
8 BULL~TrIN NO. 78, IIAvVAII I1JXP~JHIl\lEN~' srrATION
census were not included. The monthly estimates should,therefore, be a better index of commercial production thanwas the Crop Census.
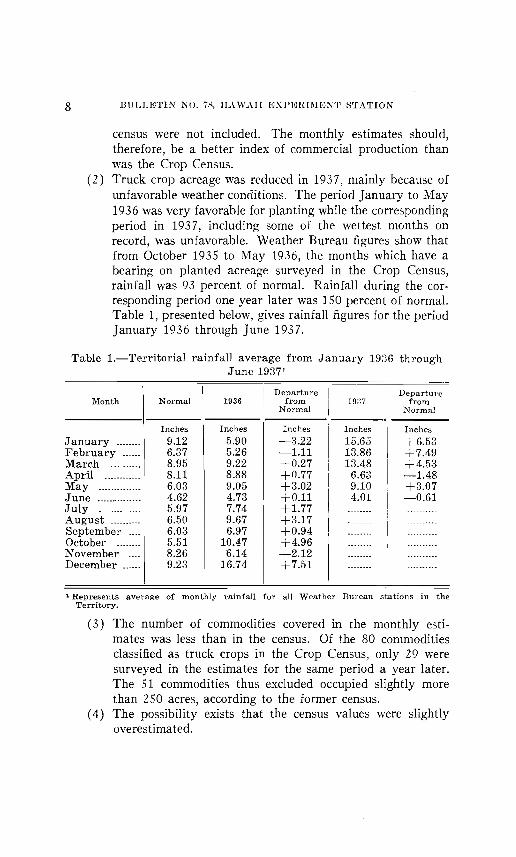
(2) Truck crop acreage was reduced in 1937, mainly because ofunfavorable weather conditions. The period January to May1936 was very favorable for planting while the correspondingperiod in 1937, including some of the wettest months onrecord, was unfavorable. Weather Bureau figures show thatfrom October 1935 to May 1936, the months which have abearing on planted acreage surveyed in the Crop Census,rainfall was 93 percent of normal. Rainfall during the corresponding period one year later was 150 percent of normal.Table 1, presented below, gives rainfall figures for the periodJanuary 1936 through June 1937.
Table 1.-Territorial rainfall average from January 1936 throughJune 19371
Departure DepartureMonth Normal 1936 from 19~7 from
Normal Normal.Inches Inches Inches Inches Inches
January ........ _- 9.12 5.90 -3.22 15.65 +6.53February ... .. 6.37 5.26 -1.11 13.86 +7.49March .- .. ... .. -. 8.95 9.22 +0.27 13.48 +4.53April ...... .. 8.11 8.88 +0.77 6.63 -1.48May ... 6.03 9.05 +3.02 9.10 +3.07June .._-_ ......... -_ ........ 4.62 4.73 +0.11 4.01 -0.61July ----_ .. .. _---.- 5.97 7.74 +1.77 .. ... .---_ .. .. ...
August ... _--_ ......... 6.50 9.67 +3.17 _-00 ... ... ... .---- ...
September 6.03 6.97 +0.94 ....... .............
October ............ 5.51 10.47 +4.96 ............ .. ......
November 8.26 '6.14 -2.12 ......... _-- ...
December .. 9.23 16.74 +7.51 ......... .--_ ..... .......
1 Represents average of monthly rainfall for all Weather Bureau stations in theTerritory.
(3) The number of commodities covered in the monthly estimates was less than in the census. Of the 80 commoditiesclassified as truck crops in the Crop Census, only 29 weresurveyed in the estimates for the same period a year later.The 51 commodities thus excluded occupied slightly morethan 250 acres, according to the former census.
(4) The possibility exists that the census values were slightlyoverestimated.
-- -
------ -------------
-- -- -- - _
---_ _
--- --- ----- -- - ---- -
--- ---- ------- --- -
\

9 PRODUCTION AND MARKETING OF TRUCK CROPS
COMPARISON WITH OTHER STATISTICS
The acreages devoted to truck crop production as given in theU. S. Agricultural Census of 1930 were neither as complete nor asdetailed in respect to number of commodities covered as was thecensus of 1936 made by this experiment station. Twenty-two commodities included in both the U. S. Agricultural Census, as revisedby Dr. Coulter in 1933, and the Crop Census, covered 3,419 acresaccording to the earlier report, or approximately 75 percent of the4,574 acres which the Crop Census reported for these same commodities in 1936. This discrepancy is in part due to increased activity in truck crop production in the Territory.
ESTIMATED PRODUCTION OF TRUCK CROPS IN HAWAII
IMPORTANCEThe volume of production, while based on planted acreage, is the
most important information contained in the monthly truck cropestimates. Previous to 1936, no reliable data were available concerning the production of truck crops in the Territory. Records for
RELATIVE VOLUMES AND MARKET VALUESOF TRUCK CROPS INCLUDED IN THE MONTHLY
TRUCK CROP ESTIMATESJULY 1936 JUNE 1937
A B
Poundage Basis Value Basis(Total pounds-49,411,135) (Total value-$1,844,340)
Figure 3
-

10 BULLE'l'IN NO. 78, HA"\VAII EXrERI~fENT STATION
several years will be needed to establish normal or mean valuesproduction for the Territory and for each of the five principal islands.When index values for normal production are obtained, croping can be simplified, and it may be possible to forecast productionin terms of percentage of the normal.
Figures on estimated production of each of the con1modities reported in the monthly crop estimates for the Territory and forof the five main islands are given in tables 16-21 in the appendix.The annual total and monthly averages for each commodity areshown. Production for each commodity is reported in the unit\vhich it is marketed in the Territory; thus, all commodities are reported in pounds, except bunched beets and carrots and head lettuce,which are reported in bunches or heads. The weights of "bunches"and "heads" may vary, but they are close enough to the pound tobe considered as such in order to estimate total production figures.
The relative importance of the various crops listed in the monthlycensus is sho"vn in figure 3.
GUIDES TO ESTIMATING PRODUCTION
During final compilation of the Crop Census, lists of all commodities were sent to Frederick G. Krauss, at that time director ofthe Agricultural Extension Service; W. T. Pope, senior horticulturist of the Hawaii Agricultural Experiment Station; and to otheragronomists and horticulturists. These men estimated a normal yieldper acre for each of the commodities, as a check against the valuesestimated by enumerators. Recent reliable publications relating tothe yield per acre of truck crops in the Territory were studied. Ata conference of the enumerators held at headquarters following thecompletion of the Crop Census, a table was drawn up of normalyields per acre for the commodities. This table has been supplemented as additional commodities were covered in the estimates.Table 2, appearing below, serves the enumerators as a guide in estimating monthly production.
At the end of each annual period, average acre yields for the yearfor the several crops will be computed from actual Territorial experience. These average yields will, over the years, constitute anindex of crop production as affected by climate, cultivation methods,insect damage, and other factors.
As a further aid to enumerators in their work, a table was prepared giving the average nunlber of days from planting to maturity
of
estimat
each
by

PHOIHJC'l"ION AND l\IAHKE'l'ING OF" THUCI( CROPS 11
or harvest for the various truck crops. The values in the table areapproximate only, and will vary with climatic conditions and particularly with altitude. This material is produced below in table 3.
Table 2.-Average production per acre of truck crops in Hawaii
Asparagus ________ pounds 2,500 Lotus root ________ pounds 15,000Bean, string Onion, bulb ..... --- .. do 10,000
(green) -_ ........ _- do 7,000 Papaya ------------ do 30,000Beet ________________ bunches 5,000 Pepper, bell ---- do 3,000Beet, topped ____ pounds 4,000 Potato, red ------ do 8,000Broccoli ---_ .. _------ do 4,500 Potato, white -- do 8,000Burdock ....... -_ ... _---- .. do 20,000 Pumpkin ... .. _-- .... __ .. do 8,000Cabbage, Squash, summer do 7,000
Chinese --_ ... _-_ .. do 9,000 Sweetpotato,Cabbage, head_. do 8,000 Nancy Hall -- do 10,000Cantaloup -- ... ----- do 4,000 Sweetpotato (allCarrot _.__________ bunches 10,000 others includ-Carrot, topped __ pounds 7,000 ing yams) ---- do 15,000Corn, green ______ do 10,000 Taro, upland ____ do 15;000Cucumber .... _-_ .... do 8,000 Taro, wetland do 20,000Eggplant, long__ do 10,000 Tomato ........ -_ ........ _- do 7,500Eggplant, round do 15,000 Tomato, egg do 6,000Lettuce, head 'Vatermelon ---- do 16,000
(Californiatype) ______________ heads 7,000
Table 3.-Period from planting to maturity for truck crops in Hawaii
Asparagus monthsBean, string
(green) daysBeet doBeet, toppd doBroccoli __ .. doBurdock doCabbage, Chinese __ doCabbage, head doCantaloup doCarrot doCarrot, topped doCorn, green doCucumber doEggplant, long doEggplant, round . doLettuce, head (Cali-
fornia type) do
18 Lotus root yearsOnion, bulb days
60 Papaya years65 Pepper, bell days75 Potato, red ._ do90 Potato, white .__ do
180 Pumpkin do60 Squash, summer do75 Sweetpotato,
100 NancY' Hall do75 Sweetpotato(all
100 others incIuding80 yams) do60 Taro, upland years90 Taro, wetland do90 Tomato days
Tomato, egg do75 Watermelon . do
1150
19080
100100
75
150
18011
7575
100
- __

12 BULLE~1IN NO. 78, ITAWAIl EXPERI~IENT STATION
COMPARISON WITH STEAMER RECEIPTS
In addition to the estimate of actual truck crop production, theenumerator makes an estimate of the proportion which will beshipped to Honolulu and this figure can be checked against steamerunloads in Honolulu. About 37 percent of the Territorial populationresides in Honolulu, according to population estimate of June 30,1936, supplied by Bureau of Vital Statistics, Territorial Board of
Table 4.-Comparison between estimated shipments to Honolulu fromoff-islands with actual receipts at Honolulu' July 1936-June 1937
(reduced to monthly average basis)
Commodity
Asparagus . . .__ .Bean, string . . .Beet . ... . .__ .Beet, topped .Broccoli .__ . . . ._Burdock . . .Cabbage, ChineseCabbage, head .CantaloupCal"rot ._. . . . .Carrot, topped . .Corn, green .__ . . .__ . ._._._Cucumber .__ ._ ... __ . ... __ . _ Eggplant, long .Eggplant, round . . .Lettuce, head . . . .Lotus root . . .Onion, bulb . ... . .. .__ . ...Papaya .. __ . .__ . ._. . .__ ._. ..Pepper, bell . . .__ .Potato, red ._. .Potato, white . ._. . .Pumpkin __ . .. .Squash, summer ._. .__ . ....Sweetpotato, Nancy HallSweetpotato, all others .Taro, upland _. . . .. __ Taro, wetland . ._ .. . .Tomato ._. .__ .. ._. ._ ..Tomato, egg . .Watermelon . . . . . ...
TOTAL . .
Estimated Steamershipments unloads
Pounds Pounds
8 206,978 6,631
19l 2,0371,289)3,650 2,955
17,237 15,67375,812 72,700
490,329 455,'676135 ..... _--_ ..... .....
345l 33,86336,227S10,345 20,65228,026 42,65613,4341 12,887495f22,557 19,908
.--_ .... ......... -_ .... .. ... _-_ .. _--------12,885 6,902
5,766 1901,886 1,394
75,243~ 54,67674.048f36,328 41,994
6,125 8,7931521 2,9582,784f3811 35,48233,794f
143,749 132,063...... ........ _---_ ...... ..... -------_ ..
19,853 10,2951,119,880 980,405
- __
_
_ _ _ _ ---- __ _
_ _
_ -- _
_
_ _
_ _ - ---_ _

I)RODUCTION AND l\iAHI(ETING OF r:rRUCI( cnops 13
Health, and n1uch of the Territory's food produced on the otherislands is shipped to Honolulu for consumption. The volume oftruck crops shipped into Honolulu for the fiscal year 1937 comprised27 percent of the total production. Receipts of truck crops at Honolulu from the outside islands are published in the weekly marketreport issued by the Agricultural Extension Service. A comparisonbetween the enumerators' combined estimates of shipments to Honolulu from the off-islands with actual receipts at Honolulu is shownin table 4, based on the monthly average for each commodity fromJuly 1936 through June 1937.
Estimates of shipments to Honolulu were reasonably accuratethroughout the year except for the month of February, for which theestimate was based on the assumption that the maritime strike(October 28, 1936 to February 8, 1937) would continue throughoutFebruary. Consequently, no shipments for mainland United Stateswere included in the February crop estimate. When the strikesuddenly ended, a large quantity of potatoes estimated for shipmentto Honolulu was sent directly to the mainland. The volun1e of truckcrops by percentage as estimated for shipment to Honolulu fromHawaii, Maui, Kauai, and Molokai is shown below in chart A offigure 4; chart B gives the proportion of actual steanler unloads inHonolulu from each of these islands.
PERCENTAGES OF TRUCK CROPS PRODUCED FOROAHU ON OUTSIDE ISLANDS
A 8Estimated Shipments Steamer Receipts
for Honolulu at Honolulu(Fiscal year-13,137,499 lbs.) (Fiscal year-ll,467,295 lbs.)
Figure 4

Comparison of estimated shiplnents for the mainland vvith actualshipment figures obtained through the courtesy of the U. S. Bureauof Entomology and Plant Quarantine offers a further check on accuracy of the estimates. Mainland shipments comprise 7 percent ofthe total production. Totals for the year show that the estimatesagreed well vvith actual shipments. T'he bulk of shipments fromthe Territory to the mainland is from Oahu. Kauai shipped approximately 420,000 pounds of potatoes, Havvaii a small quantity oflotus root, and nothing was shipped directly from Maui or Molokai.
ADDITIONAL STATISTICS RELATING TO CROP
ESTIMATES
SIZE OF TRUCK FARMS IN HAWAII
The most recent and accurate data available on the size of truckfarms in the Territory are contained in the monthly truck crop estimates. Acreage figures for the Islands of Kauai, Oahu, Molokai, andthe Island of Hawaii with the exception of the Kona and Kau districts appeared in the November 1936 crop estin1ate, and reviseddata on the size of truck farms on Maui in the March 1937 estimate.Data for the Kona and Kau districts of Hawaii were released in theJune 1937 report. Acreages shown in these reports are areas devotedto truck crops and do not include land in house lots, wood lots,pasture land or in crops such as corn, rice, etc. On the basis of suchvalues, the average size of the truck crop farm in Hawaii was 4.8acres.
NUMBER OF TRUCK FARMS IN HAWAII
The number of growers reported in the monthly crop estimatesis shown below in table 5, by islands and judicial districts. Figuresinclude growers producing only those commodities covered in eachcrop estimate. Thus, we have 1,177 grovvers in the Territory in July1936 and 1,673 in June 1937. In table 6, the growers are listed bythe commodities vvhich they produce; as n10st grovvers produceseveral commodities, there is much overlapping. A study of this tableindicates that there are almost 400 producers of wetland taro, over300 of bunched carrots, and almost that number producing stringbeans. Head cabbage, eggplants, papayas, sweetpotatoes, and tomatoes are each grown by about 200 farn1ers.

Table 5.-Number of growers reported in monthly crop estimates
'2'-
,..::
ic:c-:
cec<:':
c
c-:cd
'2CI"'--
<Jl
153525
329
112182637
300
10116199
27352
153622
326
102132734
278
10112188
27337
143524
32697142830
271
12115194
28349
15382:)
22.J
100142929
273
12117191
28348
153824
21999142427
262
13123,221
29386
133922
12119204
23353
21106
172523
266
1034232
1699122319
238
12118194
18342
113717
216921318
8214
298
9102187
93721
216771217
9200
10104195
2311
73516
32382151910
210
1094
1841
289
23314
4218215169
196
791
1831
282
3
63314
792
2163
318
218310142
186
Locality July I Aug. 1 Sept. \ Oct. I Nov. I Dec. I Jan. \ Feb. I Mar. I Apr. \ May I June1936 1936 1936 I 1936 1936 1936 1937 I 1937 1937 I 1937 1937 1937
--~. ---1--- ---,-- --_. --1---Hawaii:
North Kohala .South Kohala._ .Hamakua .North Hilo .South Hilo .Puna .Kau .South Kona .North Kona .
TotaL.. .Maui:
Lahaina .Wailuku .Makawao_ .Hana .
Total .Oahu:
H.onolulu1..............•. 108 115 126 128 135 156 11-171 150, 117 107 101 115
Ewa.. ..... .. ..... -.... 116 93 77 83 84 120 125 113 100 108 114 114Waianae................. 12 13 12 14 16 20 30 29 20 28 26 27Waialua 75 65 68 70 67 69 72 75 67 69 68 74Koolauloa _._. 45 22 I 19 21 25 109 122 I 122 111 119 121 121Koolaupoko............. 82 77 I 51 50 45 205 197 192 171 167 183 227
~otal.._..... ._........ 438 385 I 353 366 372 679 693 I 681 586 598 613 678Kaual: I
Hanal.ei..---._ .. ... .. _.. 1~ 16 16 15 22 52 55 I 53 54 5~ I 57 5~Kawalhau ..--..... 40 34 441 41 46 70 69 I 72 71 7'J 74 7bLihue._.. ... _._... 36 30 26 31 27 34 36 34 34 34 I 34 37Koloa._... _._ .. _. ..... 61 53: 56 54 54 I 57 57 55 54 48 52 46Waimea_... .. •••• 34 33 I 30 I 30 30 54 55 54 52 47 I 37 36
Total.. __ .__ _..... 195 166 I 172 171 179 267 272 I 268 265 258 254 249Molokai: 40 38 43 I 66 57 70 91 I 105 113 57 I 83 I 94'rotal for Territory._ 1.177 1,067 1,067 Tl}14- 1,120 \~1,596 1-1,680 1,702 1,585 1,533 -1,565 1,673===========================================:::::_-
1 190 FERA growers in Honolulu from July to October 1936 not included.
------ -- --
__ _ ~
~ _ _ _ "
_ _ ~ ~
__ ~
~ _
_ _
~ ~
~ ~ ~ ~ ~
_ __ ~
__ __ '\ __
~
__ ~
__
_ _ ---
I'
I
I
~
_ _ o _._._..
~
----==--==- --

Table 6.-Number of growers producing each CO""Ylmorlitv covered bv monthly truck crop estimates
Territorial totalCommodity
Asparagus .. ... .Bean, string . .. .Beet_._._. . ._ .._.Beet, topped_. . . .BroccoIi.. .. ._., .Burdock. ._... . .....Cabbage, Chinese . .Cabbage, head. .. ... ..Cantaloup . .Carrot . . ... ._Carrot, topped ._.Corn, green .. _. .. ...Cucumber . .Eggplant, long_.. .Eggplant, round_..Lettuce, head... ... ...Lotus root .Onion, bulb._. . ... ....Papaya .. .Pepper, beIL_.Potato, red ...Potato, \vhite .Pumpkin ._Squash, summer_. ...Sweetpotato,
Nancy Hall .Sweetpotato,
all others__ . ... _ Taro, uplandTaro, wetlandTomato. ..._._ ... .. .Tomato, eggWatermelon
TotaL .__ .
July Aug. Sept. Oct. Nov. Dec. Jan. Feb. Mar. Apr. May June1936 1936 1936 1936 1936 1936 1937 1937 1937 1937 1937 1937
23 20 27 26 23 23 25 23 22 23 24 25262 296 310 326 313 257 345 303 285 293 296 268
90 93 84 122 111 78 120 129 111 108 113 916 1 1 1 .... _---- 4 1 3 2 6 5 20
36 39 37 49 54 53 60 49 54 54 57 67118 122 129 139 114 131 121 112 115 116 113 117
60 75 89 119 137 134 217 154 142 143 128 104180 170 162 185 201 193 229 252 237 214 198 192
6 1 .. --_ ....... ........... _.-- ........ ... ... ... _--_. ... ....... .. . .............. ..279 293 273 310 278 309 326 346 360 370 325 308
44 34 45 53 43 30 35 43 61 33 42 67---.---- .- ............. .. _- .. -----.-- 60 104 115 126 118 81 61
94 110 109 136 114 119 145 98 127 130 137 110249 277 278 296 244 243 232 221 194 189 192 198105 117 126 139 111 102 105 93 76 72 77 82
16 15 20 17 27 37 27 33 37 32 33 36. .... -_ ..... . ...... ................ -. ..- ............. ...... ....... 44 39 33 29 34 46 50
44 17 5 5 5 7 19 30 53 60 61 52. .......... -----_ .. ._ .. _---- ..... _--- .. .... .. . .... -_ ..... --_.--- .. ----_ .... .- ...... .. .. ..... 210
49 51 57 56 53 47 46 58 48 40 49 468 19 22 24 28 28 31 29 20 14 20 27
76 45 55 84 95 144 166 112 97 84 97 106106 96 93 96 67 68 79 74 81 71 82 95
11 10 9 9 8 14 22 10 22 19 20 22
10 11 15 10 11 4 4 4 5 6 7 7
-----_ .... ... .. -... --- .. --_ ... _.- -----_ ..... _._.--.- 198 207 205 196 182 186 172._ .... -_ .. ............... - -------- .-.- .. -.... ...------ .. 55 28 14 14 18 18 20
... ........... . .. .-----_ . .. _-.- ...... 405 406 410 375 378 379 369260 234 234 260 239 245 257 269 195 147 204 234126 118 108 100 105 84 98 100 59 65 88 101141 55 30 12 5 11 16 29 43 76 126 160
-- -- --- .--- ---- --2,399 2,319 2,318 2,574 2,386 3,127 3,510 3,351 3,186 I 3,095 i 3,204 3,417
Monthlyaveragefor crop
estimates .......0\
24296104
4 to51 c:::
121125 l;j
8201
22 ZZ315
44 -1
95 SfJ
119234 >101 >28
23 trj
30 ><210
502397 l;j
z84 815 U1
8
8 >80
192 z24
389232
9659
3,398
Note: 190 FERA growers in Honolulu from January to October 1936 not included.1 Head lettuce and Nancy Hall sweetpotatoes were included with all varieties in the Crop Census. Figures are estimated.2 The average for cantaloup cannot be taken as a true monthly average.
- - - __ _____J --- - - --- - -_ __ _
__ __ _ __
~ __ ~
__ __ __ _ _
- ------- - --- - - _ - _ ------- _ -----~
__ ~ _
__ ------- --__
~ __
_ ~
__ __ _ --- _ -
~ ~
__ __ _ _ - - ----- ----- - - - - -- - ~
~
__
_ __
~ ~
~
~
_ _ ------ --- _ ----
__ - _ _ _
~-------
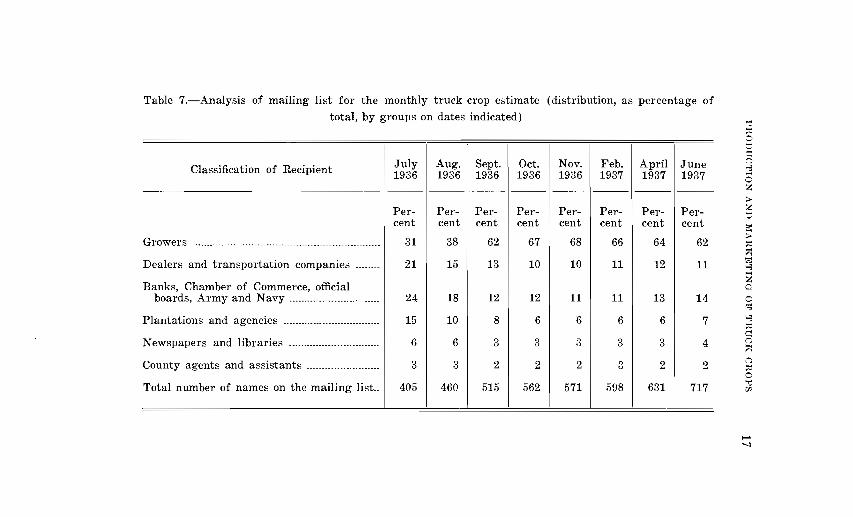
Table 7.-Analysis of mailing list for the monthly truck crop estimate (distribution, as percentage of
total, by groups on dates indicated)
Classification of Recipient July Aug. Sept. Oct. Nov. Feb. April June1936 1936 1936 1936 1936 1937 1937 1937--- --- --- --- --- --- --- ---
Per- Per- Per- Per- Per- Per- Per- Per-cent cent cent cent cent cent cent cent
Gl~owel~s ........_ .... __ ._.. ___ ........._ ....._ ......._ ... ____ ......... 31 38 62 67 68 66 64 62
Dealers and transportation companies _. __ ..._ 21 15 13 10 10 11 12 11
Banks, Chamber of Commerce, officialboards, Army and Navy ...._._ .. __ ._..........__ ._.._ 24 18 12 12 11 11 13 14
Plantations and agencies .._.._ ...._ ........_ ............ 15 10 8 6 '6 6 6 7
Newspapers and libraries ......._ ......_._... __ ........ 6 6 3 3 3 3 3 4
County agents and assistants ._...................... 3 3 2 2 2 3 2 2
Total number of names on the mailing list_. 405 460 515 562 571 598 631 717
otj
("J
8oz>'''';
a=>;0
t;j8
Zoo
8
("J
("J
ow
.......-...J
~ ~
~
~
~
~
~
~
~ ~
~
~
~

18 BULLETIN NO. 78, I-IAWAII EXPEHIMENT STATION
MAILING LIST
The original mailing list for the truck crop estimates was compiled in the latter part of June 1936, based on mailing lists for theWeekly Market Letter and Agricultural Notes of ··the .A.griculturalExtension Service. Some names were suggested by the project leaderand enumerators. This list has gradually been augmented by namessubmitted by the enumerators or persons directly. requesting copies.Analyses made from time to time show the distribution and growthof the mailing list of the monthly crop estimates. These have beensummarized in table 7 on page 17. It is gratifying to know thatthe community is finding a real use for these truck crop estimatesand that the mailing list is continually. growing as new requests comein from residents of the Territory.
GRADING AND PACKING
BACKGROUND
Practically no grading of truck crops was done in the Territoryof Hawaii prior to 1936, the only commodity sold on the basis ofgrade being tomatoes. Likewise, there was no standardized packingor containers for locally grown truck crops. The most common typeof container was the burlap bag used for shipping cabbage, each bagholding about 60 pounds, and also used extensively for carrots,beans, potatoes, sweet corn, onions, beets, and turnips. Next mostprevalent was a type of box, about 2 cubic feet in size, used originally for crating 5-gallon kerosene cans. This box was used by thefarmers principally for packing tomatoes.
Improvement of grading and packing methods in the Territoryfor several years had been recognized as an important phase in thedevelopment of truck farming since it was apparent that considerablewaste resulted from the crude practices prevailing. This was particularly true in shipping fresh vegetables from the off-islands to theHonolulu market: the cylindrically-shaped burlap bag caused loss ofcargo space, freight was paid on unmarketable produce, and· wasteresulted from rehandling and unduly heavy spoilage.
TOMATO GRADING AND PACKING
In November 1935, with the availability of funds for an educational program covering this aspect of marketing, the grading andpacking project was inaugurated on tomatoes because: (1) Thetomato season was at hand at the inception of this project on Jan-
_
PRODUCTION AND MAHKETING OF TRUCK CROPS 19
uary 1; (2) there existed a pressing need for such work on tomatoes,as was indicated by numerous requests from growers for assistance;(3) it was believed that a technique might be developed for this crop\vhich could be adapted to all important island truck crops; (4) thepossibilities for early results from improved grading and packingpractices with tomatoes seemed better than with other crops; and(5) this crop was adaptable to a spectacular, graphic demonstrationproject-this approach was deemed necessary because of the character and attitude of the growers and the trade in Hawaii toward improvements in the handling of truck crops for market.
Preliminary studies in the field indicated that the fjeld quality ofHawaiian tomatoes was excellent at most seasons of the year,although pest injury was a constant menace. It was felt, moreover,that the potential consumer quality of island tomatoes during mostseasons of the year was above that of the mainland receipts, particularly during the winter months, yet island fruit had neverapproached price parity ,vith mainland fruit. At the inception of theproject, the mainland product was selling at from 3 to 6 cents apound more on the Honolulu wholesale market throughout the year,and it seemed obvious that the trouble must lie in the mishandlingof locally grown fruit.
Analysis of field and market studies indicated that most of theproblems incidental to the packing and handling of island tomatoescould be approached most satisfactorily and conclusively by supplanting the nondescript container in use with the California 30pound lug, and by grading, ,vrapping, and packing tomatoes in sucha way that their quality would place them on a quotable basis withmainland receipts on the Honolulu market.
For the purpose of inaugurating the improved grading and packing program under conditions which would make for early results,shook was secured from the mainland in sufficient quantity to makeup a thousand 3D-pound lug boxes for free distribution to the twogro,vers' associations on Maui, the principal tomato-producing areain the 1"'erritory, where it was deemed advisable to center the demonstration program. The material for grading and packing, includingbox-making equipment and grading tables, was secured, and thisequipment constructed and established in the associations' packinghouses. Actually, field work was begun on Molokai between December 28 and 31, 1935, when several boxes of tomatoes were gradedand packed for the Honolulu market.

20 BULLETIN NO. 78, HAvVAII EXPEUIl\fENT S'rATION
1\ demonstrator experienced in grading and packing tomatoes inCalifornia was stationed on lVlaui from January 6 to March 16,1936,teaching and supervising the packing of lugs. At the close of thisperiod, the demonstration "vork ,vas held in abeyance for severalweeks because, due to unfavorable weather conditions, only a shortcrop ,vas available for picking. Six growers' meetings were held,at ,vhich the advantages of the lug pack were explained and theresults of test shipments to Honolulu reported.
1'est shipments to the Honolulu market were begun January 10.These shipments were follo,ved by the project leader through theirsale on the Honolulu market. Difficulty was experienced from thefirst in getting growers to ship tomatoes in the "pink" stage. Thebulk of the test shipments, shipped "mature-green," necessarily hadto be held in the I{onolulu market until they ripened so that theycould be offered against imports of Mexican tomatoes then on themarket.
A preliminary record of sales showed that, during the entiredemonstration period, shipments of tomatoes in California lug boxesaveraged from 2 to 3 cents a pound rnore than tomatoes shipped inthe ordinary jumble pack kerosene box, or the equivalent of 30 to45 cents more on each lug box. The cost of the new containers andpacking amounted to only 18 cents a box. Further, it was determinedthat the wastage of fruit shipped in lug boxes was less than 5 percent, ,vhile with the old containers the wastage during the entiredemonstration period averaged about 35 percent.
In February an. experiment was made in shipping tomatoes fromthe Territory to the Shanghai market and it ,vas found to be practicable. An exhibit showing the excellent quality of locally growntomatoes ,vas held in the display window of a prominent businessconcern in the center of the Honolulu business and shopping district,and considerable support ,vas given to the demonstration by localwholesale and retail vegetable dealers as ,veIl as the local press. Thegrading and packing work ,vas constantly publicized by radio and inthe English and Japanese newspapers throughout the entire Territory. Demonstrations of grading and packing ,vere given at countyfairs and at gro,vers' meetings on all islands of the Territory.
GRADING AND PACKING OTHER COMMODITIES
With 'York in tomato grading and packing well established byspring, major efforts of the project ,vere next directed toward other

PHODUCTION AND l\lAHKliYTING OF r:rHUCK CHOPS 21
commodities. Early in June small quantities of rhubarb appeared onthe Honolulu wholesale market shipped in sacks and selling at aboutone-fifth the price of mainland rhubarb. Through the projects'scientific aides and the Weekly Market Letter, the growers were informed that any box, preferably the apple box, which is the standardrhubarb container, \vould be much better than sacks. This resultedin a considerably better price for properly packed Hawaiian rhubarb.
During July and August some fifty test shipments of head cabbage, Chinese cabbage, cucumbers, broccoli, and lettuce were madeto Honolulu from the Volcano and Waimea sections of I-Iawaii, towhich the project demonstrator had been transferred. The purposeof the test shipments from Hawaii \vas twofold:
( 1) To study (a) types of containers and their capacities forvarious cOll1modities, (b) the most desirable packs, (c)handling, stowage, and temperatures in transit, and (d)condition and temperatures of commodities upon arrival;and
(2) To convince the gro\vers, some of WhOITI had previouslysho\vn reluctance in the ll1atter, of the advantages of standardized grades and packs.
Cooperating in this project, the Inter-Island Steam NavigationCompany issued a revised cubic measurement basis of acceptance,under which growers using standard packs and standard containerswere temporarily allovved to ship under an "adjusted measuren1entbasis" at a lower transportation cost than those shipping in nonstandard containers. rrhe program \vas designed to foster the moregeneral use of standardized packs and packages. It was felt necessary to demonstrate to growers that standardization would increasetheir net returns more than enough to offset the slightly increasedcosts.
TOll1ato grading and packing vvas continued on Thtlaui, mean\vhile,in cooperation \vith the Growers' Service Department of the InterIsland Steam Navigation Company. A study of the comparativecosts of marketing and net returns from tomatoes packed in kerosenecases and in lugs between April and August 1936 is presented intable 8.

zz BULLETIN NO. 78, H_A..'VAII EXPERIl\lENT srrArrIUX
Table B.-Comparison of costs of marketing Territorial grovvn tomatoes in kerosenecases an d lugs
Kerosene Case Receipts
rrrall::-;- Avpr-porta- Sellillg' Total rrotal age U('tlll'n
("0/-;( tion cost fixptl fixed saIp::-; to1936 of cost }:(,l' em.;l cost priee grower
easel vel' ca::-;e3 vel' ])er pel' percase2 e:lse4 pound POUIH15 PQund
------Cents Cents Cents Cents Cents Cellts C(-~nts
April______________________ 4.0 16.0 36.83 56.83 1.14 4.91 3.77May____ .. ________ .____ .____ 4.0 16.0 31.50 51.50 1.03 4.20 3.17June. ________ ._____________ 4.0 16.0 25.28 45.28 .91 3.37 2.46July. ____ .._. ______ .________ 4.0 16.0 30.90 50.90 1.02 4.12 3.10August__ .___________ ._. __ 4.0 16.0 31.28 51.28 1.03 4.17 3.14
Lug Pack Receipts
I
TraI.lsporta
tioncostperlug~
Cents
figures8.08.08.08.0
Sdlillgcost})cr
lug31936
A pril ••
May. .June .July.. .. ._August .
1I'HC1\:-
Cost iJlgof eos1.
lug6 PPl'I lug7
1---------------- 1------------- I
Cents I Cents
I No10.0 110.010.0 10.010.0 10.010.0 10.0
rrot a I ] rrot (II A~~;:;-ti x('(l I fixed sa Ipscosl I cost prieepel' per perlugS Iwulld PQund
-------------------·I~-----·_---
:i~O:}l ~~~i: I c~:~: c::~:22.01 50.01 1.67 4.8923.45 I 51.45 1.72 5.2126.01 54.01 1.80 5.78
Rptul'nto
growerper
pound
Cents
4.373.223.493.98
CompariE:on of Returns
Return to grower per pound1936
APriL. ------------1May I
~f;~-_~-_-_-_-_-_-_~-_--~--------~----~---- I
August !
Kerosene case
Cents3.773.172.463.103.14
Lug5
Cents
4.373.223.493.98
Increased return to groweron lug pack
Percent
37.930.912.626.8
1 Figured on basis of 40 cents for case which averages 10 trips to market.2 From Kahului, Maui, taken as a fair average.3 Basis 15 percent commission.4 Case of 50 pounds net weight.5 True average of grades, Special, No.1, and No.2 (No.3 being eliminated) with actual
percentages of worthless taken into consideration.6 10 cents including lid.7 Packing at 9 cents and paper 1 cent, totaling 10 cents.8 30 in
---_.~
I
------- -----~ - - ---- ----
e. - __ -. __ --
_ _ 1
II II
_
· ·· ·
~
Lug averaging pounds weight.

I'RODucrrION AND l\IAHI(ETING 0]' THUCI( cnops 23
Lugs, lids, and paper were sold to growers at cost, and labor wascharged at the rate of 9 cents per packed lug. The total packing costof 20 cents per lug was probably somewhat lower than would be thecase for commercial operations, unless larger volumes were handled.The actual labor during this demonstration cost more than the 9cents per lug charged because of limited supplies of tomatoes. Thedeficit was borne by the Growers' Service Department of the InterIsland Steam Navigation Company.
The comparative net returns as shown in table 8 do not,fore, accurately reflect commercial packing conditions in the caseof the lug pack. 1'he lug pack obviously costs more per pound toput up, but even after allowing another 5 cents per lug, or one-sixthof a cent per pound, for packing operations under commercial conditions, the average net return would still be decidedly in favor of thelug pack. With a steady volume of 1,000 lugs per week or more, itshould be possible to grade properly and pack, including cost of allmaterials, for approximately 25 cents per packed lug.
MARKETING PUBLICATIONS
Partially as a result of the information gained from test shipments, a circular entitled "Some Recommended Truck Crop Packages and Packs" was issued by this project on August 26, 1936, asAgricultural Notes No. 136, under the joint auspices of the Agricultural Experiment Station and the Extension Service, University ofHawaii. Packs and packages described therein were taken as standard by the Inter-Island Steam Navigation Company in revising theirbasis of acceptance.
As a further progress report on the tomato grading, packing, andmarketing phases of this project, Agricultural Notes No. 137, entitled "Some Economic Aspects of Tomato Growing and Marketingwithin the Territory of Hawaii," was issued jointly by the ExtensionServIce and the Hawaii Experiment Station.
SUBSEQUENT GRADING AND PACKING WORK
---During October, test shipments from Hawaii to Honolulu werecontinued. The commodities receiving most attention were head cabbage, Chinese cabbage, cucumbers, head lettuce, and summer squash.This work was also carried on in cooperation with the Inter-IslandSteam
there-·
Navigation Company.

24 BULI~ETIN NO. 78, HA"VAIl EXPERI1\lENT STATION
Results exceeded expectations, particularly in the case of headcabbage. It was demonstrated that medium-sided, well-graded headcabbage packed in the No.4 standard crate arrived with a brightercolor, shovved less vvastage, and sold much better than sacked receipts.Growers and vvholesalers both accepted the new package more readilythan was anticipated. It was recommended that the use of sacks becontinued for excessively large-sized cabbage and for No.2 quality.The crate pack is definitely established, has realized returns morethan high enough to justify the increased cost, and is expected tobecome the universally accepted package for fancy quality cabbage.
Cucumbers well graded and packed in lugs sold at substantialpremiums over those shipped indiscriminately in large crates.
Chinese cabbage, packed as recommended in Agricultural NotesNo. 136, arrived with less wastage and sold at better prices.
The grading of lettuce improved but little, due to a high marketshortly after November 1 resulting from the maritime strike.
Summer squash in lugs showed marked improvement in conditionupon arrival.
There was c01l1partively little lug box material in the Territorywhen the shipping strike became effective about Novelnber 1. Additional supplies had been ordered but were still on the mainland. Thesupply of crate material was somewhat larger but was practicallyexhausted by December 1. This lack of supplies, normally takencare of by the Grovvers' Service Department, greatly hampered and,in fact, practically stopped the work on improvement of grades andpacks.
During the period of the strike, the demonstrator divided histime among the Islands of IVlolokai, Oahu, and Kauai, and assistedgrowers by demonstrating what constitutes good grades and, in general, how to pack and market crops for the highest possible returns.Grading and packing demonstrations were held for the benefit of theAgricultural Extension Service county agents and their assistants,who were in Honolulu for their annual conference in late Januaryand early February 1937. Shortly thereafter, lack of funds necessitated termination of the services of the demonstrator.
Subsequently, various shipments from off-islands were checkedon the Honolulu market, and reports on arrival conditions and desirability of packs vvere made to growers, or to county agents whoacted as intermediaries.
Territorial production of vegetables, particularly during Febru-

PUODUCTION AND l\IAUI{ETING OF TUUCI{ cuops 25
ary and March 1937, was much lighter than normal and prices werehigher, due partially to the light local supply and partially to thefreeze in California which curtailed supplies from that source. As aresut of these factors, poor quality produce, indiscriminately packed,brought good prices.
From March until June of 1937, the grading and packing workconsisted mainly of demonstrations and inspections of market receipts, followed by correspondence with growers and county agents,the aim still being to increase the acceptance and use of standardizedgrades, packs, and packages. After June, marketing activities ceasedto be carried on as a processing tax fund project. Provision for continuation of the ,york by the Agricultural Extension Service wasmade possible through a Territorial appropriation. The work willalso continue to be supported by the Growers' Service Departmentof the Inter-Island Steam Navigation Company.
MARI(ETING OF TRUCK CROPS
STATISTICAL BACKGROUND
Since truck crops occupy less than two percent of the arableland in the Territory of Hawaii, and this small part is comprisedmainly of second rate and marginal lands tilled by tenant farmers,market statistics, until recently, have given little place to truckcrops. Prior to 1930, prices of a few truck crops on the Honolulumarket were given in the Extension Letter issued monthly by theAgricultural Extension Service. Beginning that year, a more complete list of prices was reported weekly by the Extension Servicewith the cooperation of the Honolulu Chamber of Commerce. Thisservice was later taken over completely by the Extension Servicewith the publication of the Weekly Market Review. The mailinglist of this market news service at that time carried less than fiftynames. For a short time the Weekly Market Review was supplemented by the Market Letter issued by the Federal Territorial FoodProducts Inspection Service, which represented the U. S. Bureau ofAgricultural Economics in Hawaii. This market news sheet gavesteamer unload figures and prices of fresh vegetables and eggs on theHonolulu market, together with comments. On May 19, 1936, thetwo publications were combined into the Weekly Market Letter. Atthe close of June 1937, the mailing list of this market news servicehad reached a total of 1,051 names.

26 llULLIDr:rIN NO. 78, HAVVAll EXPEHIlVIENr:r S'j\1'rION
It was not until 1936 that any current figures on the volume oftruck crops shipped into Honolulu from the mainland, foreign coun:..tries, and islands of the Hawaiian group other than Oahu were available to the public. Weekly totals of shipments are now published· inthe Weekly Market Letter, supplemented by monthly totals. Thesefigures have been made available to the Extension Service throughthe courtesy of the Inter-Island Steam Navigation Company, YoungBrothers, Castle & Cooke, and Territorial Plant Inspection Service.
The figures have given an accurate conception of the volume ofvegetables produced for the Honolulu market by islands of the Territory other than Oahu. The Crop Census and monthly crop estimatesmake available, in addition, detailed data on the amount of truckcrops produced on each of the islands for local consumption.
DESTINATION OF TRUCK CROPS PRODUCED IN THE
TERRITORY
Total commercial truck crop production for the Territory for1936-37 was estimated at 49,411,135 pounds (see table 16 in theappendix). Of this total, about 3,342,700 pounds.were shipped tothe mainland. Deducting estimated shipments to Honolulu and themainland from the total production on each of the Islands of Hawaii,Maui, Kauai, and l\1010kai (tables 17, 18, 20, and 21 in the apppendix), the total estimated amounts produced by the islands for localconsumption ,vere as follow: Hawaii, 4,871,424 pounds; Maui,5,223,310 pounds, Kauai, 2,865,144 pounds; and Molokai, 220,193pounds. The total consumption for Oahu, obtained as the sum ofproduction on Oahu (table 19 in the appendix) plus shipments fromoff-islands and deducting shipments to the mainland, was 32,888,737pounds. Inter-Island shipments, except from outside islands to Oahu,were insignificant in amount. To obtain actual figures, a specialanalysis of inter-island shipping records would be necessary.
A comparison, by islands, of the consumption of truck crops anddistribution of population as shown in figure 5 indicates that consumption on Oahu is a relatively large percentage of production· inthe Territory. This percentage probably would be somewhat reducedhad figure? been compiled on the amount of truck crops shipped fromOahu to the other islands, and· further reduced if small farms on outside islands, producing vegetables for home consumption, were sur
in the estimates.veyed crop

PHODUCr.l'ION AND ~IAHKEr.rING 0]-' TltUCI( CHOPS 27
TERRITORIAL POPULATION BY COUNTIES, AND DESTINATION (FOR CONSUMPTION) OF THE TRUCK CROPS
PRODUCED IN THE TERRITORY IN 1936 1937.
A
Territorial Populationby Counties
(Population estimate as of June30, 1936, Bureau of Vital Stati.~
tics, Territorial Board of Health)(Total Population-393,277)
*Includes Islands of Molokaiand Lanai
B
I)estination of the Territory'sTruck Crops
June 1936 July 1937
(Total Production49,411,135 lbs.)
Figure 5
VALUE OF TRUCK CROPS PRODUCED IN THE TERRITORY
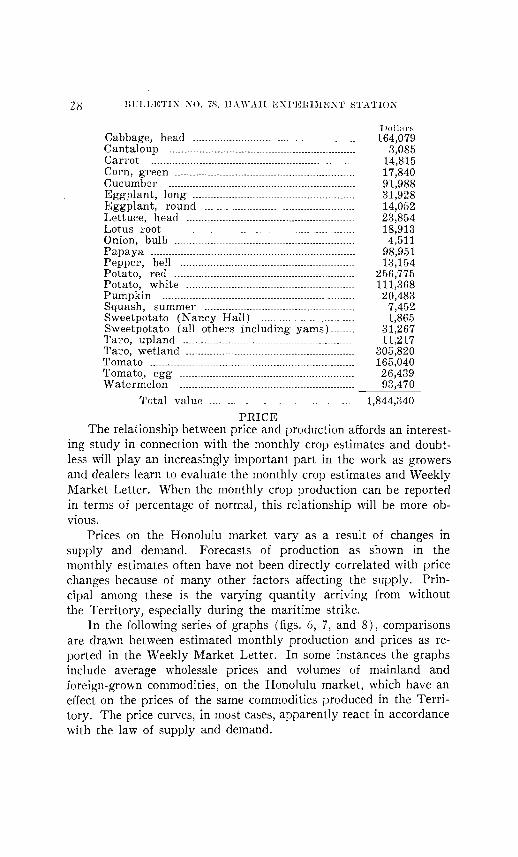
The wholesale value of commodities reported in the estimates forthe period July 1936 through June 1937 totaled $1,844,340. Themonthly value of each commodity was obtained as a product ofmonthly production and average price as reported in the WeeklyMarket Letter of the Extension Service. Prices for the year 19361937 doubtless were higher than normal as the result of the foodshortage during the maritime strike. The values, on an annual basis,of the commodities reported in the estimates, are shown in table 9.
Table 9.-Computed value of truck crops produced in the Territoryof Hawaii during the year July 1, 1936, to June 30, 1937. (Home and
plantation gardens not included.)
Asparagus . . . ._ .. _. __ ..B~an, green-pod . __ . ._. _._._ __ .. __ .__ .Beet .. ._ .. _ _ __ __ ._ .._ .. .._ .Beet, topped _ ... __ .._ _. .. __ .... .. _. "'_Broccoli . .. . ._. .__ . . . .. __ .. __ .. __ ._ _.BUI'dock _ .__ . _ .. _. __ ._._. .__ __ .Cabbage, Chinese . . . __ .... . .__ .
Dollars20,32596,11420,021
40411,67115,98982,130
-
-
28 BULLETI~ NO. ',S, HA'YAII EXPI1jHI~IJ1~NT STA~rION
Cabbage, head ------------------------------------------------------Cantaloup . ._. .Cal'rotCorl1, greenCucumber .Eggplant, long ..Eggplant, round .Lettuce, headLotus l"oot --- .Onion, bulb .Papaya .Pepper, bellPotato, redPotato, white .Pumpkin .Squash, summerSweetpotato (Nancy Hall)Sweetpotato (all others including yams)Taro, upland .Taro, wetland ..TomatoTomatQ, egg .W atel'melon .
Total value
IJollnrs164,079
3,08514,81517,84091,98831,92814,05223,85418,913
4,51198,95113,154
256,775111,368
20,4837,4521,865
31,26711,217
305,820165,04026,43993,470
1,844,340
PRICEThe relationship between price and production affords an interest-
ing study in connection vvith the monthly crop estimates and doubtless will play an increasingly important part in the work as growersand dealers learn to evaluate the monthly crop estin1ates and WeeklyMarket Letter, When the monthly crop production can be reportedin terms of percentage of norn1al, this relationship will be more obVIOUS.
Prices on the Honolulu market vary as a result of changes insupply and demand. Forecasts of production as shown in themonthly estimates often have not been directly correlated with pricechanges because of many other factors affecting the supply. Principal among these is the varying quantity arriving from withoutthe Territory, especially during the maritime strike.
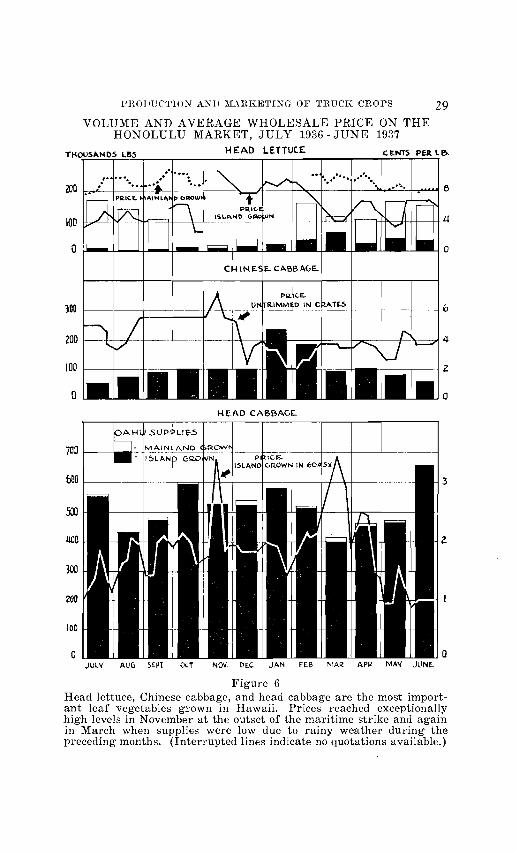
In the following series of graphs (figs. 6, 7, and 8), comparisonsare drawn betvveen estimated monthly production and prices as reported in the 'Veekly Market Letter. In some instances the graphsinclude average wholesale prices and volumes of mainland andforeign-grown commodities, on the Honolulu market, which have aneffect on the prices of the same commodities produced in the Territory. The price curves, in most cases, apparently react in accordancewith the la\v of supply and demand.
_ - _
_ _ _
_ _ _ _ _ _ _ _ _
_ _ _ _ _
_
THOUS"N 05 L85·
PHODUCTION AND MAHICETING OF TRUCIC CROPS 29
VOLUME AND AVERAGE WHOLESALE PRICE ON THEHONOLULU MARKET, JULY 1936 JUNE 1937
HEAD LETTutE CENTS PU Le>.
o
JOO .----+---t------f
200
100 I-----+----+----t-<
oHEAD CABBAGE.
---+---+---+-----+---f b
4
-+----+----1 2
o
700 t---........__--+
bOD t---+------t---.---+-=:=rl-+-t--t---+----+----+--+---\-t----+--+
500
!lOD
300
zoo
100
oJULV AVCJ 5EPT. ocT NOV. DE..C. JAN. FE.B. MAR APR MAY JUNE.
Figure 6Head lettuce, Chinese cabbage, and head cabbage are the most important leaf vegetables grown in Hawaii. Prices reached exceptionallyhigh levels in November at the outset of the maritime strike and againin March when supplies were low due to rainy weather during thepreceding months. (Interrupted lines indicate no quotations available.)
-

30 BULLETIN NO. 78, HA\VAll EXPERIMEN'r srj1ATION
VOLUME AND AVERAGE WHOLESALE PRICE ON THEHONOLULU MARKET, JULY 1936 JUNE 1937
THOUSANDS LBS. P UM P K l N CENTS PE.R. LB
7
b
5
2.
3
..... o
0POTATOES
7
6
5
4
3
2
o...._ ......_ ....--......._ ......._ .......__ -...._~_.....
o
bO
20
100 I----+----+----+---i~-+---H
40
BO 1----+---!------+-----4-/---t-¥----t\--ftt--=l--+-----.,II--t--t---+--- I L.L
..JULY AUb. SEPT: 0(1 NOV. DEC JAN. FEe.. MAR. APIl. MAV JUNEFigure 7
Potatoes are the principal truck crop produced in Hawaii for exportto the mainland. vVhile a distinction is made between supplies ofisland-grown red and white potatoes, the price curve on island-grownwhite potatoes only is shown in the above chart. Prices on island-grownred potatoes were quoted between January and April, inclusive, andcorresponded very closely with prices on the island-grown whites.(Interrupted lfnes indicate no quotations available.)
Potatoes were imported from the Orient from July to the first ofNovember when the U. S. Department of Agriculture placed a banon Oriental potatoes. During November, December, and January,imports were from Canada.
-
~_ __

PRODUCTION AND l\IARK:mr:rING OF TRUCK CROPS 31
VOLUME AND AVERAGE WHOLESALE PRICE ON THEHONOLULU MARKET, JULY 1936 JUNE 1937
THOUSANO!. L8S. CUCUMBE.R.· C.ENTS PER. L8
H-----t-----t &
-+---+--+---+--=--+---1 10
o
5Q
Z5
)50 J----+---+---+--~:.=.:::.:.~~:..:.=.._t-__t--t___-_r_-_r_----_;_-_; IZ
175 1----L-~-+---~-_4--+_-_+_-..:._r-_+--t_-;_-_t_-_; 14
100 .......-H---t--1i---I-----l-f--t--1r--+
15
700 1--- IIIIIII--l-----+-----4---1---4---"l",,:::r-Il.....7+-__..I----t--+---t-----t
zoo
100
oJULV AUG. SEPT OCT. NOV. DEC. J~. 1=£6. MAR. ~P~. MIN JUNE.
Figure 8The prices and Oahu supplies of egg tomatoes are not included inthe above chart. The average monthly supply of egg tomatoes isestimated to be approximately 37,000 pounds and the price corresponds to No.2 loose-pack globe tomato prices. The above chart depictsthe premium paid on the Honolulu market for properly graded tomatoes. The price of tomatoes reached peaks during the maritime strikeand in March when production had been affected by the winter rains.
lines indicate no
-
5OOt-----+---+---t---~~__t_--t-t----t---:~_+_--I-+-ir----+--_+_-___..
(Interrupted quotations available.)

32 BULLETIN NO. 78, HA'VAII EXPEHIl\fEN'l"' STA'l"'ION
CONCLUSION
Monthly truck crop estimates covering a full year are publishedin the appendix of this bulletin, making possible direct comparisonsbetween a given month and the same month one year earlier. Withthe continuance of the crop estimating and reporting service assured,by Territorial appropriation, for the biennium beginning July 1,1937, these monthly records will become increasingly valuable.
It is believed that, as the growers become convinced of the advantages of improved grading and packing, the acceptance and useof standardized grades, packs, and packages 'vill increase. The countyagents are continuing demonstrations and inspections of market receipts. Marketing activities are also being continued as an Extension Service project.
As explained in the introduction, the production research portionof the truck crop project funds is being expended over a 30-monthperiod. Under the leadership of J. H. Beaumont, field experimentsare being carried on at Waipahu, Oahu; Waimea, Hawaii; and atthe Haleakala Branch Station at Makawao, MauL Varietal studiesare being made of beans, beets, broccoli, cabbage, carrots, chard,eggplant, onions, peas, peppers, rutabagas, tomatoes, and turnips.The current status of this phase of the project is described at theend of each quarter in the mimeographed reports issued by theHawaii Agricultural Experiment Station.
..•>. >.~ .-c••.

APPENDIX

Table 10.-Total planted acreage-Territorial summary, 1936-37
July Aug. Sept. Oct. Nov. D(Jc. Jun.1
Feb. :Mar. Apr. ~l:lY JUlle l\lonthl~"
1936 1936 1936 1936 1936 ID36 1937 1937 1937 1937 1937 1937 Averag'e--- ----1---
Asparagus................................................... 40.2.:3 42.73 44.56 43.58 49.43 49.58 50.381 48.63 49.47 48.72 58.70 66.96 49.58Bean, string (green) ...................... 30.07 31.-1-9 37.87 42.04 33.50 35.f>2 43.23 44.08 37.45 40.19 3:).07 2fj,68 36.60Beet...................................................................... 3.17 2.75 3.19 5.39 6.25 4.13 6.99 6.53 6.23 5.96 6.47 4.98 5.171~_
Beet, to I)ned.............................................. .86 .12 .12 I') ................ .37 .09 .14 .03 .36 .64 1.84: .30)')···)6
Broccoli.......................................................... 5':>2 4.05 4.29 6.30 7.28 8.13 7.86 10.79 10.96 11.24 10.29 11.99 8.23Bllrdocl{......................................................... 8.58 15.67 16.95 15.65 1G.94 16.98 14.81 12.88 13.84: 14.40 15.01 16.62 14.77 0
eCabbage, Chinese.............................. 12.19 13.93 14.61 17.32 29.18 44.13 6;).10 51.03 41.:;0 31.67 29.51 22.04 31.02 eCabbage, hen d ........................................ 117.90 111.15 103.19 195.73 194.38 16·L63 177.18 158.89 178.90 176.27 177.50 203.36 163.27 ("":
Cantalonp.................................................... 4.99 . .45 ................. ................ 1.361
CCarrot............................................................... 17.00 25.73 26.33 30.65 28.82 26.f>f> 32.:)i) 33.46 39.92 4:).00 40.07 30.66 31.361 ZCarrot, topped....................................... 9.40 9.21 12.98 1:3.42 11.23 8.99 10.57 14.62 19.23 10.68 9.81 17.48 12.30543.86 >Corll, g·reen................................................ 44.60 99.03 134.39 139.;-)4 139.05 87.71 39.55 100.55 ZCllclImber..................................................... 22.68 29.-1-6 21.91 30.78 39.79 56.72 7:).03 47.75 55.83 49.26 57.42 37.00 43.64: eEggplant, long...................................... 38.22 37.95 36.58 39.39 33.91 30.-1-5 2n.80 27.97 23.-1-8 23.13 22.87 25.94 30.8114') 40 >Eggplant, round................................. 15.55 12.13 13.08 15.57 15.64 10.71 11.98 11.34 8.08 7.82 8.21 9.03 11.595 -.Lettuce, head
(California type) ......................... 1.51 2.70 3.31 3.49 5.06 6.71 11.42 10.81 14.19 11.68 13.78 10.70 7.9:>LOttIS root................................................... 46.89 48.39 47.72 47.60 46.97 33.06 fr1.18 49.26 ZOnion, bulb................................................ 44.11 13.27 1.60 2.37 .79 1.29 5.47 11.95 25.04 30.26 31.3°1 27.33 16.40 CPal)aya............................................................ 27;).94 27;).941 CPepper, bell............................................... 8.03 7.24 7.49 6.06 7.07 7.90 7.58 11.60 10.13 8.7D 8.73 5.96 8.0:>I)otato, red................................................. 4.18 4.22 1.75 8.87 146.56 461.30 668.33 460.09 298.25 187.56 41.25 29.9-1 IH2.691')( -- 8
Potato, white........................................... 52.40 22.66 22.37 53.87 9-1.29 154.93 209.30 167.79 196.98 92.4-1 102.37 88.88 104.865-~1' .....C
I"tImpl{ill....................................................... 121.80 11-1.03 185.66 184.69 143.89 81.70 99.18 88.17 89.42 77.67 83.13 96.86 113.8i)Squash, sunllner.................................. 4.95 -1.38 3.63 2.35 1.07 2.15 6.12 2.14 4.67 4.07 3.61 3.38 3.55Sweetpotato <.1
(Nancy Hall) ..................................... 2.64 2.34: 3.25 1.90 2.31 .70 .78 5.79 5.87 3.87 .82 .92 2.60, 0Sweetpotato (all others ~88.7S rFJ.
including ynn1s) ............................ 78.30 77.09 95.21 95.89 76.73 91.47 88.59 86.18 1
Taro, llVlalld............................................ 76.55 77.69 68.47 69.99 69.76 69.58 72.97 72.14t~raro, wetland........................................ 1,187.10 1.332.23 1,292.73 1,223.51 1,178.32 1,169.58 1,189.98 1,224.77 \1,296.91Tomato........................................................... 20:>.43 181.63 173.94 207.26 203.73 192.27 212.77 227.31 145.89 108.84 125.10 146.00 177.51 t') __ ryTOlnato, egg............................................. 24.81 25.18 2-1.01 22.38 28.16 33.75 40.58 35.78 I 25.54 24.82 33.11 32.50 29.225,,"06. h) CJ1
'Yatermelon.............................................. 302,;":8 135.1-1 7-1.8-1 36.2.) 8.GO ,12.70 18.29 45.70 I 105.37 209.00 366.4-9 387.80 141.89-- -- --- --_. --- --1- --- ---
Total...................................................... 11,098.82 8;)1.61 837.51 987.43 1.106.78 2,845.73 3.441.82 3,17;).76 3.002.80 2.734.;}3 2,752.66 3.026.28 3.047.70
1 Not true monthly averag-e for C'fllltalollp and papaya in tables 10 21.
~
~
~ ~
~
~ ~ ~ ~ ~
~
_ ~
~
~
~
~
~
I
-

Table 11.-Total planted acreage-Hawaii, 1936-37
July IAug. ISept. I Oct. I. Nov. Dec. Jan. Feb. lVlar. Apr. May June lVlonthly1936 1936 1936 1936 1936 1936 1937 1937 1937 1937 1937 1937 Ayerage
--- -- --- --- -- -- (.N
0.8910\
Asl}aragus................................................... 1.30 ............... 0.88 0.35 0.50 0.85 0.75 0.70 0.70 0.83 0.84 0.71Bean, string (green) ..................... 1.86 2.64 3.36 3.171 2.96 2.25 3.02 2.48 4.00 3.78 3.69 3.38 3.05Beet..................................................................... .26 .61 .57 1.42 1.96 1.15 1.69 1.53 1.97 1.79 2.15 1.57 1.39lBeet, topped............................................. .64 ............... ............... ............... ! ............... .37 .09 .14 ............... .17 .44 .90 .235 1.62Broccoli......................................................... 1.06 2.07 1.71 1.89
1
2.06 1.67 2.64 1.45 1.94 1.46 2.79 4.92 2.14 dBurdock......................................................... 3.24 10.94 11.71 9.91 12.21 12.14 10.14 8.31 8.90 9.29 9.92 11.54 9.83Cabbage, Chinese.............................. 6.60 7.67 9.45 7.50 I 15.66 19.84 20.14 15.80 15.58 13.11 12.89 8.93 12.76 t!jCabbage, head....................................... 16.89 39.04 42.40 44.31 53.01 52.88 48.90 39.24 42.10 38.97 55.09 59.66 44.37 8Cantaloup.................................................... ................ ............... ............... ............... ZCarrot............................................................... 2.32 8.35 5.27 5.59 7.21 6.37 7.71 5.82 9.14 11.36 12.24 6.73 7.34} ZCarrot, topped....................................... 1.56 .68 5.73 7.02 5.23 6.72 4.57 4.41 4.04 1.72 2.03 6.06 4.15 11.49 9Corn, greell................................................ 12.50 7.32 5.03 9.49 9.04 9.00 11.69 9.15 -1
~ooCucumber..................................................... 5.52 14.31 12.82 12.61 12.70 8.99 8.40 4.36 6.83 12.46 16.69 16.54 11.02Eggplant, long...................................... 2.92 2.31 3.36 3.68 3.62 3.66 4.27 4.19 3.53 3.11 3.49 5.06 3.6°l 6 °'1 >Eggplant, round................................. 2.45 2.56 4.75 3.72 4.67 1.80 1.97 2.06 1.67 1.43 1.44 2.77 2.615 .-Lettuce, head >
(California type) ......................... 1.29 2.60 3.05 3.48 4.95 6.27 10.76 10.47 13.64 11.25 13.21 10,44 7.62Lotus root................................................... .85 1.00 1.00 1.00 1.00 1.00 1.50 1.0;] >1Ollion, bulb................................................ 4.00 .20 ................ ................ •.............. ............... ............... ................ .02 .06 .14 ................ .37Papa:ra............................................................ 11.98 11.98Pepper, bell............................................... 3.45 1.23 2.84 2.33 2.56 1.32 1.63 2.01 1.49 1.09 2.02 3.39 2.11Potato, red................................................. 2.03 2.60 1.41 2.72 4.40 6.95 11.39 10.19 5.53 4.32 6.23 7,46 5,44lPotato, 'vhite.......................................... 6.22 6.01 4.62 16.07 15.13 12.89 15.86 13.28 12.34 7.97 9.40 8.62 10.705 16.14 ZPumpl\:in....................................................... 14.90 15.77 105.19 113.24 115.12 45.48 34.45 21.86 17.94 15.19 18.44 29.11 4;].56 8
Squash, summer.................................. .54 .60 .65 .49 087 .96 1.19 .94 1.42 1.39 1.81 2.05 1.08 r.n8
S,veetpotato >(Nancy Hall) .................................... 2.64 2.30 3.25 1.85 1.80 .07 .07 .07 1.00l
8........ ...... ............... ............... ...............0S,veetpotato (all others r 6.23
including yams) ............................ 6.53 5.25 4.21 3.63 3.85 6.21 6.95 5.23(Taro, upland............................................ 55.34 60.38 60.30 61,46 61.83 61.75 62.29 6O,48} ~_.>Taro, \Vetlalld....................................... 108.00 90.72 79.22 60.39 54.64 48.69 81.41 "'4 ,..., l':';J._O, ., ...Tomato........................................................... 10.18 14.83 15.33 16.87 20.09 24.13 37.03 47.00 50,41 44.97 37.70 38.H6 29.S:3tTomato, egg'............................................. I .;;9 .51 1.12 .91 .81 .2-1 .30 .46 0") .15 .67 1.10 .575 30.40
\Vatermeloll.............................................. 1 11.36 1.10 3.47 2.75 2.73 2.63I
3.85 4.10 5.37 4.70 20.59 33.26 8.00
Tota l...................................................... 1103.82--
262.42 290.12 402.45 i 395.52 351.11 344.55 320.87 360.62 439.18 378.11138.93 242.94
~
~ ~
""'"
~
~
""'" ""'" ~
~ ~ ~
""'" ~ ~
~
""'" ~

Table 12.-Total planted acreage-Maui, 1936-37
July Aug. Sept. Oct. Nov. Dec. I Jan. Feb. I :Mar. Apr. :May June Monthly1936 1936 1936 1936 1936 1936 1937 1937 1937 1937 1f)37 1~37 Average-- -- -- ---i--
==~A-\.sparaglls................................................... 0.30 0.25 0.25 ................... ................. ................... ................ ................. ................ 0.07Bean, string (green) ..................... 5.62 4.37 5.04 8.02 6.47 3.10 4.60 4.33\ 2.89 1.52 1.56 2.54 4.17Beet..................................................................... .88 .57 .42 .66 .44 .34 .48 .66 1.17 1.08 .71 .57 .661Beet, topped.............................................. .22 .12
.12
1
.12 ................... .................. ................. .03 .19 .20 .94 .16j 0.82Broccoli.......................................................... 2.20 1.27 1.79 2.89 1.87 2.65 1.82 3.11 2.49 2.12 1.64 1.88 2.14Bllrdock.............. ......................................... 1.46 .54 .68 1.70 .66 1.58 1.30 .88 1.04 1.06 1.08 1.17 1.10 0Cab bage, Chinese.............................. 1.31 2.10 1.60 2.25 3.01 5.40 21.89 17.52 11.08 5.40 7.13 6.24 7.08 U
dCab bage, head........................................ 90.30 64.80 54.81 140.86 130.60 103.02 117.00 97.32 110.71 118.69 109.37 131.49 105.75 0Calltaloup.................................................... .25 .06 8.................. ................... ....................... loo-1
Carrot............................................................... 2.51 1.66 1.50 3.56 .86 1.55 2.80 2.64 2.59 8.63 6.21 6.01 3.381 0ZCarrot, topped....................................... 7.36 8.47 7.05 6.04 6.00 2.24 5.98 10.21 15.19 8.46 7.03 11.22 7.94S 11.32>Corn, greell................................................ 1.62 44.26 88.16 133.99 117.35 56.35 11.35 64.72 Z
Cllcumber.................................................... 3.20 2.64 1.18 3.07 4.81 8.20 14.75 6.54 7.43 6.08 5.32 4.53 5.65 UEggplant, long...................................... 3.75 3.44 3.50 4.11 3.42 2.95 2.42 2.53 2.25 2.04 1.92 1.73 2.841Eggplant, round................................. .19 .38 .55 .93 .25 .50 .48 .48 .49 .30 .29 .25 .42S 3.26 >Lettuce, head
(California type) ......................... .22 .10 .26 .01 .11 ,44 .66 .23 .49 .43 .57 .26 .32Lotus root................................................... .8-! .12 .02 .12 .28 .36 .25
8................... loo-1
Onion, bulb................................................ 40.10 14.05 1.60 2.37 .79 1.29 3.87 8.25 21.77 25.85 25.61 24.93 14.21 Z0
Papaya............................................................ 3.90 3.90 0Pepper, bel!............................................... .01 .62 .74 .62 .50 .24 .13 .05 .02 .................... .................. .01 .25 bj
Potato, red................................................. ,..- I'> 20.00 20.00 20.00 1.00 6.82} - 0 816:~~ 117:~ '33:'74
.................. ............... ................ ...............Potato, white.......................................... 44.86 M.48 77.06 93.93 32.05 15.07 34.45 57.71 67.11 46.19 u3. 1Pumpl{in....................................................... 95.82 9 ~~ ~~ 6" I 6~ -6 24.30 29.43 54.95 57.00 59.68 56.65 57.47 57.97 61.19
da.• , 'i.... i.a 0
Squash, summer................................. 4.41 2.28 .20 .20 .20 1.19 2.93 1.08 1.50 1.58 .75 1.08 1,45Sweetpotato 0
(Nancy Hall) .................................... ............... ................ ................ ................. .................... ............... .02 .18 .16 .19 ,44 .44 .121 0Sweetpotato (all others r 8.55 w.
including yams) ........................... 4.04 7.71 7.85 11.48 10.36 8.82 8.75 8.43 JTaro, upland............................................ 11.75 11.23 3.24 1.50 1.00 .65 1.50 4.411Taro, \vetland......................................... 81.40 97.33 99.51 99.64 102.50 94.72 100.76 96.30S 100.96
Tomato........................................................... 1:56.44 143.53 137.35 142.40 117.65 77.24 61.95 58.93 38.98 19.69 39.00 60.15 87.781 87.79CoNTomato, egg............................................. ............... .................. ............... .04 .01 ................ ................. ............... .................... .01S -.]
Watermeloll.............................................. 84.62 24.55 19.12 6.00 2.00 ................. ................. 4.00 18.75 47.00 78.00 83.50 30.63-- -- --- -- --- -- -- -- --
TotaI...................................................... fY!6.03 388.67 332.88 ! 427.15 368.43 438.07 572.61 526.77 580.39 572.74 562.83 591.64 568.65
-~
~ ~
_ I
-
~
~ ~ ~
~
~
~
~
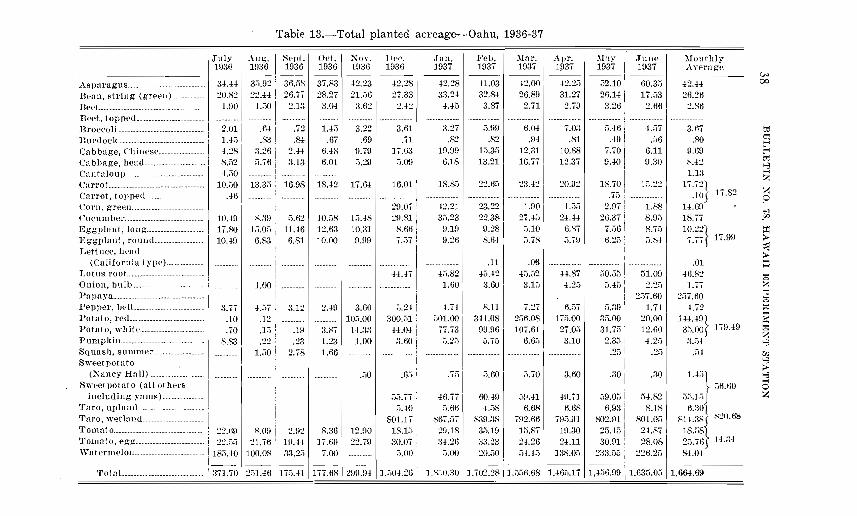
Table 13.-Total planted acreage-Oahu, 1936-37
July Ang. SflPt. Oct. Xov. Dpc. Jan. F(:~b. )Iar. Apr. 1\lay June ~Ionthly
1936 1936 1936 1936 1936 1936 1937 1937 1937 1P37 1P37 1937 Average---. --- w
...-\sl)araglls................................................... 3-t44 3;j.92 36.58 37.83 42.23 42.28 42.28 41.03 42.00 42.25 52.10 60.35 42.44 00
Beau, string (gTflflll) ..................... 20.82 22.44 26.77 28.27 21.56 27.33 33.24 32.84: 26.89 31.27 26.14 17.53 26.26
Beet..................................................................... 1.90 1.50 2.13 3.04 3.62 2.42 4.45 3.87 2.71 2.79 3.26 I 2.66 2.86
Beet, topped............................................. ...............
Broccoli.......................................................... 2.01 .64 .72 1.45 3.22 3.61 3.27 5.99 6.04 7.03 5.461 4.57 3.67 OJBllrdock.............. ....................................... 1.45 .83 .84- .67 .69 .71 .82 .82 .94 .81 .49 .56 .80 rj
t-'Cab bage, Chinese.............................. 4.28 3.26 2.44- 6.48 9.79 17.63 19.99 15.35 12.31 10.88 7.70 6.11 9.69Cabbage, head........................................ 8.52 5.76 3.13 6.01 5.29 5.09 6.18 13.21 16.77 12.37 9.40 9.30 8.42
t;j1-3
CalltaloUl)··.... ...... .. .... .. .................... 4.,jO ................ ................. ................ 1.13 ZCarrot............................................................... 10.50 13.35 16.98 18.42 17.64 16.01 18.85 22.65 23.42 20.92 18.70 15.22 17.72l ZCarrot, topped....................................... .46 ................. ................ ............... ................ ...................... ........................ ..................... ...................... ..................... .75 ....................... .105 17.82 9Corn, green................................................ 29.07 42.21 23.22 1.90 1.55 2.97 1.88 14.69
-1Cllcllmber...........................................,......... 10.49 8.39 5.62 10.58 15.48 29.81 35.23 22.38 27.45 24.44 26.37 8.95 18.77 ~oo
Eggplant, lOll g...................................... 17.80 13.05 11.46 12.63 10.31 8.66 9.19 9.28 :>.10 6.87 7.56 8.75 10.::!::!}Eggplant, rOulld................................. 10.49 6.83 6.81 10.00 9.99 7.57 9.26 8.64 0.78 5.79 6.25 5.84 7.77 17.99 >Lettuce, head :s
>(California type) ......................... ................ ............... ................ ................ ...................... ...................... .11 .06 ..................... ..................... ...................... .01
LOtllS root ................................................... 44.47 45.82 45,42 45.52 44-.87 50.55 51.09 46.82Ollion, bulb................................................ ................. 1.00 ............... ............... ............... ..................... 1.60 :3.60 3.15 4.25 5.45 2.25 1.77Papa~ya............................................................ 257.60 257.60Pepper, belL............................................. 3.77 4.37 3.12 2,49 3.60 5.24 4.74 8.11 7.27 6.57 5.39 1.74 4.72Potato, red................................................. 300.51 ;")01.00 34-1.08 256.08 175.00 35.00 20.00 144.49l.10 .12 ............... ............... 10<j.00Potato, ·white........................................... .70 .15 .19 3.87 14.33 44.04 77.73 99.96 107.61 27.05 31.75 12.60 35.005 179.49 t;j
ZPlllllpl{ill....................................................... 8.83 .22 .23 1.23 1.00 3.60 5.25 5.75 6.65 3.10 2.35 4.25 3.54 1-3Sqnash, sulllmer.................................. ............... 1.50 2.78 1.66 ................ ..................... ....................... ...................... ...................... ...................... .25 .25 .54 enSweetpotato ""3
>(Nancy Hall) .................................... ............... ............... ............... .50 .65 .73 5.60 5.70 3.60 .30 .30 1.451 1-3
Sweetpotato (all others J56.60 0including yallls) ............................ 55.77 46.77 60,49 59.41 49.71 59.05 54.82 0:>.15 Z
Taro, upland............................................ ;').40 5.66 4.;>8 6.68 6.68 6.93 8.18 6·:3°lTaro, wetland......................................... 801.17 867.37 839.38 792.66 795.91 802.91 801.05 814.38S 820.68
TOlllato........................................................... 22.69 8.09 2.92 8.36 12.90 18.15 29.18 35.19 15.87 19.30 23.45 24.87 18.58l .Toulato, egg............................................. 22.55 :!1.76 19,44 17.69 22.79 30.07 34.26 33.23 24.26 24.11 30.91 28.08 25.765 44.34'Vaterllleloll ............................................. 185.40 100.08 33.25 7.00 .. .....,.,. 5.00 5.00 20.50 [>4.45 138.05 233.55 226.25 84.04
--177.681 299.94
--- ---!---Total...................................................... 371.70 2iH.46 175.41 1,,")04.26 1.8;")0.:30 1,702.28 i 1,5;)0.68 1,4&").17 1,456.99 1,633.05 1,664.69
_ " ~
······ ··· · · · ~
,
~
~ ~
~ ~ ~
~ ~ ~
~ ~
~
~~"

Table 14.-Total planted acreage-Kauai, 1936-37
10,49 13.14 13.371.67 2.91 3,45
17.65 9,41 2.00
56.34 57.78 51.26
:::=otj
(1
oz>d
>:::=
t;J
1-04
Zoo
(1
(1
o'"0(f1
CoN\0
2.97
6.80
190.81
19.42
11.06
6.112.86
.25
.282.971,494.40
.16
2.891.085
4.065.90
6.041.765
1.14.04
.1635.94112.535 48A7
2.69
Nlonthly...'\..verage
2,48
.883.435.32
.07
.521.48
.303.63
G.G82.90
.18
.623.24
.763.11
1.23
June1937
.11
.981 1.23
.10 .10
Apr. ~Iay
1937 1937
5.58 5.583.28 3.12
.30 .35
.63 AO3.20 3,422.28 1.795.18 3.49
3.64 2.39.50
3.11 1.145.51 5.914.87 5.52
.18
4,48
6,419.955.30
.1-1
A92.932.537.92
6.;;83A4
.38
1.08.10
:Mar.1937
4.31
1.28.10
3.16
1A5
5.617.61
.73
2.85
.03 .20 .20 .26 .2937.16 133.84 1135.94 88.82 16.64 8.24 .02
.3;') 20.94 21.78 20.50 60.71 21.72 3.013.3f) 2.82 4A1 2.56 1.90 2A8 3.07
.
.01 I .01 .0] .01 .01 .01 .01 .011
11A6 I 14.53 13.08 12.86 9.69 8.12 7.62 11.05t4.06 i ,42 .25 .25 .25 .25 1.00 .921
172.03' 207.61 205.62 201.82 188.27 185.20 168.70 189.89 f18.641 17A6 2;)A4, 30.7il 17.49, 1f,'.IS 11 Ail 12.37, 16.541
4.35 3A4 6.02 2.09 1.26 .56 1.53 3.32 2.88 f.75 1.50 1.75 10.25 13.75 13.50 18.45 21.64 9.51
99.27 '4M.981 467.52 430.01 378.62 301.50 265.95 2GO.39 321.55
Xov. Dec. Jan. ]j"eb.1936 1936 1937 1937
6.60 6.60 6.60 6.602.30 2.63 4.:34 4.39
.21 .21 .37 ,45............... . .
.13 .20 .13 .242.31 ~.51 2.52 2.83
.72 1.26 3.08 2.365,40 3.55 5.05 8.W
2.31.03
1A1 5.24 10.238.79 10.38 9.956.33 6.99 4.94
.84 .27 .16
.73
6.61
.262.:3;'")
.096.15
.162.4-1
2.347.32
.92.
2.78.3-1
.073.291.094.02
Oet.1936
58.70
12.733.741.50
.97
.10
7.22
.]0
.22
.182.50
2.52
1.734.006.572.35
.12
.75
.091.77
.]3
Aug. Sept.1936 1936
6.31 6.601.72 2.53
.07 .06
.25 .07 .073.34 3.68
.90 1.121.55 2.84
A52.24
.01 .02
].:38
2A1
3.254A82,41
·:l-,06
2.19.20
1.:)3
.142.03
.611,43
July1936
Total .
Beet, topped .Broccoli ..Bllrdock .Cabbage, Chinese .Cabbage, head ..Caritaloup .Carrot .Carrot, topped .Corrl, gre'ell .Cllcumber .Bggplant, long .Bggplant, round .Lettuce, head
(California type) .LotllS root .Onion, bulb .I:lapaya .Pepper, belL ..Potato, red .Potato, 'vhite .Pumpkill ..Squash, summer ..Sweetpotato
(Nancy Hall) .Sweetpotato (all others
including yarns) .Taro, upland .Taro, ,vet land ..Tomato ..Tonulto, egg ..Watermelon ..
.A.sparagus ..Bean, string (green) .RAAt
~
~
~ ~
~
~
~
~
~
~ ~ ~
~
~
..

Table 15.-Total planted acreage-Molokai, 1936-37
.01 .03 I .08
.04 .081 .07
Sept. I Oct. I Nov.1936! 1936 1936
.06 .30 I .26
.10 i .02
:0dt"1t"1t:;j8
Zz9-1
::g>1ioj::g
t;jZ8008>8oZ
0::>>
o
.10
.111 .05
.151 .012.46 2.46
.30 .81
.251 .441.90 .87
.48
10,45
June l\Ionthly1937 vera ge
0.19 0.25.33 .26
.01
.33
.01
.22\ .23l
.20 .03S 0.26
13.75 7.933.55 2.305.08 8.11l
.12 .03S 8.14
.0216.34
6.32J.03l
38.06 49.23S 49.26
9.65 24.75
23.15 9.71
110.02 114.70
.501.80
.80
9.27
.10
1.03
.53
.15
l'fay1~37
0.19.56
38.0611.50
15.90
18.253.134.38
.12
106.27
1.25.25
1.10
.03
0.191' 0.19.23 .34:
................
.04
1.06
.29 I .45
7.75 8.004.17 .777.30 6.24
.12
.871.15
1.253.251.75
1.40
.04
.04
0.25.04.02
7.754.527.03
1.23
2.001.00
.12
1.08
Peb. I :Mar. Apr.1937 1937 1937
...............................
9.58 8.51 3.121.10 .
69.00 69.00 37.0054.94 23.14 9.70
. .
6.851 13.05 3.75
165.59 1142.56 74.25
.03
.02
2.83
.05
.03
.122.00
0.65.03
7.69
6.276.93
1.05
69.0059.17
Jan.1937
155.87
.04
.09
.31
.50
.04
.37
.938.83
3.55
1.10
Dec.1936
0.20.21.01
95.97
24.5055.29
,41
.12
.01.05
.53
I
···············1
.03
.121 .....:== I
.69
O ')r--:: • 0 ')-1 0 ')-.._0 ....D ._0
.17 .23 .21
.01 I .01 .02
.561 2.1~ I 1.1~l1.M 11.6D 8.90
4.97 I 26.90 34.45. .
17.00 19.00 3.00-- --- ---35.02 61.48 49.02
.01
.821 .50
.22 I .129.27 10.58
.01 .01
.661 .70
.04
5.63 2.04
3.55 .
20.93 14.77
July Aug.1936 1936
0.15 0.25.39 .32
.02 .02
.04
.14 .13
.02 .06
Total. .
...~sparagus .Bean, string (green) .Beet .Beet, topped .Broccoli. .Burdock .Cabbage, Chinese .Cabbage, head .Calltaloup .Carrot .Carrot, topped .Corn, green .CtIcumber .Eggplant, long .Eggplant, round .Lettuce, head
(California type) .LottIS root ..Onion, bulb .Papaya .Pepper, belL .Potato, red .Potato, 'vhite .Punlpkin .Squash, sumnler .Sweetpotato
(Nancy Hall) .Sweetpotato (all others
including yanls) .Taro, upland .Taro, wetland ..Tomato .Tomato, egg .'\Vatermelon .
~~ ~
_
~
I,
~
I
~
~ ~
~
~
~
~

Table 16.-Estimated production-Territorial summary, 1936-37
July1936
Aug.1936
Sept.1936
Oct.1936
Nov.1936
Dec.1936
Jan.1937
Feb.1937
l\iar.1937
Apr.1937
l\Iay1937
June1937 Total
lVlonthlyAverage
I-'
C
Cr:
>
t.?;j8
Zoo
8
d(1
(1
or.n
f-4
7,027
32,28333,82120,:n3
418.5758.481
636,843302,632
65.3667,268
9,165129,804
16.1181,478
10,25334,246
163.928753,942
4.67559,46541,67954.089
112.84357,21029,699
5.303.821
169.06758,790
1,602,830246,45343.978171.600
84,320
387,398236,750242,550418.575101,770
7,642,1203.631,580
784.39587,215
109,9851,5;37,645
193,41017.730
123,040410.950
1.967,1359,047.305
18,700713,582500,150378,625
1,354,120686,520356,390
1,183,470411,530
11.219.8102,9;)7.430527.7352.059.200
49.411.13iJ
68,81566.90059,13097,91055.76023.075
3,800
62.1953,000
20.800418.575
5,385235,300320.515131,930
13,875
4.050103.965
18.9856.000
23.80029,400
130.9201,129,725
69,69032,700
7,800
6.6&3366.300199.200
58,0809,275
88.18531,40064,225
135,41543,48027,260
7,230153.605
19,8701,8009.453
23.120149,410779,595
25,600
34,66556.100
3,500
700139,960
20,8201.500
11,42521.070
163,640727,260
10:l,27;:)44,80072,790
129.90023,81520,420
600
84,10032.650
6,600
75.34547,70034,170
109.36521,22515,750
10,700111,450
14,175500
9.47016.440
173,280713.770
26,200
'11.03536,20035,06079.73543,36027,350
51,31517.100
3,400
28,200143,645
18,155400
7,82016.080
274.060713,790
20,15236,4005,600
10.235 9,550 5.640 10,405782,650 2,138,500 2,281,200 1,441,150317.700 337,850 1,249,250 376,850
63.070 54,610 66,015 39,65014,110 3,450 8.825 10.200
17,545140,39517,710
50012.62032,615
320.915743,400
38,14521,70075,940
174,72539,71533,170
16,13058,8003,450
12,480111.99012.065
1,73010,09072,580
139,410709,290
34,21514,85037,310
100,71042,71521,770
7.840355.050151.000
46.9501.650
3,420
300
41,94531,390
7.1354.550
84.74054,4401,885
11,175
4.93012G,970
15,390
7,98537,405
138,555716.140
120,70574.9;)040,915
62.20566,200
11.6654,270
78,80071.805
4,650
2,750
10,000
13,820
3,830152,465
21,050800
7,27042,12G
155,97081;:'),870
116,05092,33049,685
7,700
57,99G42,350
8,500
5,950
94,17590,30536,040
10,3404,000
98,70042,550
2,100
4,700127,325
13,9451.0007,165
34,820131,900596,940
7,200
44,500
7,570
6,000134.185
11.660300
8.46545,700
108.700570,460
10047.75549,800
129,07584,27034,510
7,45516.000
121,60064,850
5,600
241,350 197,545 194,925 126.300 135,350 157,250 130.75044,600 81,730 57,100 58.500 59.600 56.700 53.300
1,995,720 1,676,470 1,631,160 1,563.660 1,4[>4,100 1,512,100 1.386,600292.705 231,305 274.843 373,025 22iJ.105 31iJ,750 306,760 115.880 156.255 156.295 275.95043.640 36,210 34,780 37,645 25.850 33,730 44,525 38.965 55,870 81,450 58,97)0
412,100 158,700 85,500 5,900 2,850 4,000 17.400 5.000 1,200 81.600 735.750
2.254.200 1,844,715 2.178.735 1.940.495 4.497.550 5.228.237 6.358.735 6.996.525 5,342.870 4.3:29.175 5,675.110
8,886
8,800
66,35574,59526,445
9,43513.150
295,37590.44511,595
9,620112,690
9,58;'")3.2007,475
39,59580,375
831,06518,60053,66746,860
128,100
233,55536,120
549.200
............................................. 2.764.788TOTAL
Asparagus poundsBean, string (green)...... doBeet bunchesBeet, topped poundsBroccoli doBurdock doCabbage, Chinese doCabbage, head doCantaloup doCarrot bunchesCarrot, topped poundsCorn, green doCucumber doEggplant, long doEggplant, round doLettuce, head
(California t~Tpe) headsLotus root poundsOnion, bulb doPapaya doPepper, bell doPotato, red doPotato, \yhite doPumpkin doSquash, SUnlnlel' doSweetpotato
(Nancy Hall) doSweetpotato (all others
including ~Tams) doTaro, upland doTaro, 'wetland doTomato (10
Tomato, eg'g' doWaternlelon do
-~
~
~ ~
~ ~
~ ~
~
~
~
~
~
~
~

Table 17.-Estimated production-Hawaii, 1936-37
Julv Aug. Sept. I Oct. Nov. I Dec. Jan. Feb. !Mar. I Apr. May JuneTotal
Monthly1936 1936 1936 1936 1936 1936 1937 1937 1937 I 1937 1937 1937 Average--.
Asparagus ....................................pounds 100 .................. 70 80 .................. I .................. .................. 80 400 730 61··..~·······: ..·I ....;.....:.~ I .........::.....Beau, string (green) ...... do 5,530 16,880 10,780 10,060 10,180 115,630 14,960 9,0;>0 l_,llv 10,;)30 11,835 15,450 143,060 11,922Beet ...................................................bunches 1.310 1,295 580 900 1,230 2,855 1,660 2,375 I 2,850 I 4,240 3,225 5,000 27,520 2,293Beet, topped ...........................poullds 2.600 .................. .................. .................. .................. 1.730 500 400 I ... ........ I 400 800 3,100 9,530 794Broccoli .......................................... do 2,590 6,120 3,510 1,785 2,090 3,045 5,280 1,590 1,555 1,195 1,400 9,160 39,320 3,277 1.1.
Bllrdocl\: .......................................... do 20,770 32,550 24,825 25,850 23,550 58,400 22,420 12,570 11,350 11,820 11,950 18,050 274,10~ I 22,8..J.2 ctCab bage, Chinese ............... do 65,825 74,900 87,350 97,710 88,880 90,580 118,580 125,750 68,700 67,59;3 73,300 44,925 1,004,09;.:> 83,675
Cab bage, head ........................ do 188,730 208,000 247,450 311,120 265,330 314,405 275,630 279,760 2·:1:5,450 159,390 282,680 495,365 3,273,310 272,776Cantalonp ........................................ do .................. ................... ................... ......................... ......................... ZCarrot .............................................bunches 9,300 8,010 7,880 5,780 6,770 5,375 4,255 4,335 10,375 11,810 10,515 13,650 98,055 8.171 ZCarrot, topped .....................pounds 14,000 9,000 10,100 8.400 5,600 13,550 7,850 1,700 7,600 3,200 10,600 24,100 115,700 9,642Corn, green .............................. do 23,225 2,920 2,350 6,590 2,800 5,800 18,630 62,315 8,902 -1CucllInber .................................... do 17.900 58,650 51,815 53,840 38,190 36,370 43,680 21,470 18,800 22,475 29,075 39,750 432,015 36,001Eggplant, long ..................... do 6.675 8,210 12,020 12,850 11.550 11,320 15,805 18,075 9,950 7,775 8,565 18,250 141,045 11,754 :=:Eggplant, round ............... do 6.800 7,200 11,150 13,880 15,800 7,770 14,125 11,275 5,620 4,140 3,650 6,300 107,710 8,976 >Lettuce. head >(California type) ............heads 8,186 7,070 6,050 13.745
.:'~.':~~ I .:.~.:~18,652 48,495 79,700 32,140 62,990 56,095 357,773 29,814
Lotus root .................................ponnds 4,000 1,500 •••.•••••••••••••• ·1 •••••.•••••••••••• ................... .......................... 8,000 1,143Onion, bulb .............................. do 10,000 500 ................... .................. .................. .................... .................. .................. .................. ........................ 10,500 875
I-Papaya ............................................. do 9,425 9,425 9,425Pepper, bell .............................. do 2,785 1,755 4,525 4,6&"5 2,750 1,730 2,150 2,025 1,435 1,035 2,180 2,765 29,820 2,485Potato, red ................................. do 8,650 11.000 3,400 2,500 3.750 18,050 6,650 56,000 14.400 9,650 16,300 3~"5,100 185,450 15,454Potato. ,,~hite ........................ do 43.650 27,350 14,750 8,850 36,440 11,550 15,100 68,150 28,075 19.900 30,850 37,675 342,340 28,528 ZPumpkin ......................................... do 13,300 20,400 18,550 22,375 36,500 33,920 32,600 6,300 5,325 2,850 2,950 6,030 201,100 16,758Squash, summer .................. do 1.895 3,800 2,000 3,850 1,800 I 450 4,610 2,950 3,050 7,450 6,000 7,075 44,930 3,744 <.J:S'weetpotato(~ancy Hall) .................. do 8,800 7,200 5,950 2,750 3,420 .................. ................... ................... ................... .................. .................. 500 28,620 2,385
Sweetpotato (all others Cincluding yams) ............ do 22,200 8,325 11,625 11.850 8,200 11,350 11,800 85,350 12,193 Z
Taro, upland ........................... do 34.000 48,300 54,100 [>4,500 54,600 54,700 53,300 353,500 50,500Taro, ,vet land ........................ do 133,920 126,060 117,000 90,800 92,300 83,400 114,500 757,980 108,283Tomato ........................................... do 21,370 42,650 35,215 54,600 46.020 39,950 69.925 73,630 60,750 50.425 53,825 81,150 629,510 52,459Tonlato, egg .............................. do 1.695 2,220 3,975 3.000 2,560 I 100 1,200 1,545 25 200 900 3,700 21,120 1,760",Yaternlelon .............................. do 72.300 9,000 3,000 12,000 1,600 2,850 1,500 400 2,100 700 1,000 105,900 212,350 17,696
--- ---TOTAL ............................ .............. i 534.761 563,760 564.9::15 670,610 61-:1,375 , 899.760 866.737 934.420 753.025 586.820 779,920 1.237,145 9.006.278 834,588
--- --- --- --- --- --- --- --- --- ~ --~ ~-~ --~
~
~ '"""
~ ~
.......... u ........ '"""
~
~
~
~ '""" ~ ~
~ ~
'""" ~ ~
~
~ ~ ~
'"""
-~ --~
_

Table 18.-Estimated production-Maui, 1936-37
July Aug. Sept. Oct. Kov. Dec. Jan. Feb. I Mar. Apr. May June l\lonthly1936 1936 1936 1936 1936 1936 1937 1937 1937 1937 1937 1937 To tal Average
--- --- --- ----.~sl)arag·tlS pOUllds 50 50 4Bean, string (green)...... do 28,700 21,925 24,360 37,540 26,795 11,030 18,025 18,205 10,685 5,265 11,500 22,955 236,985 19,749Beet bunches 3,935 3,905 2,450 2,450 1,790 610 1,390 1,190 1,645 2,635 2,015 1,245 25,260 2.105Beet, topped poullds 600 300 1,000 800 _................ 500 1,100 1.000 2,900 8,200 683Broccoli do 2,350 1.425 2,925 4,305 3,165 2,905 3,980 1,800 3,725 3,815 2,830 7,215 40,440 3.370Burdock do 11.750 4.850 3,975 10,975 8,500 9,000 6,375 1,750 2,850 3,800 7,300 6,200 77,325 6,444 ::Cabbage, Chinese do 3.700 7.550 23,400 20,020 11.205 7,590 112,325 89,400 64,000 32,500 42,000 62,500 476,190 39,682 CCabbage, head do 597,300 329,200 322,300 474,900 397,300 380,815 434,800 385,150 388,550 505,200 458,400 596,600 5,270,515 439,210Cantaloup do 500 500 125 r:Carrot bunches 19,900 12,050 10,780 9,870 6.965 5,825 7,560 3,600 8,350 22,585 21,145 23.220 131.850 12.654 jCarrot, topped pounds 31.400 40,400 31,200 55,600 25,790 1,000 13,650 34,500 40,100 39,600 19,800 41,100 374:140 31.178Corn, green do 535 7,200 4,000 18.500 64,900 46,100 29.300 170.535 24,362 ~-.
CucuInber do 13.500 9,425 11,830 20,100 10,945 6,420 30,695 7,265 9,115 8,205 22,850 32,70D 183.050 15.254Eggplant, long do 15,900 16.150 20,070 21,175 10,345 9,160 5,490 4,815 3,125 910 8,120 10,555 125,815 10,485Eggplant, round do 1,150 2,855 3,275 5,890 1,150 1,320 1,205 850 820 290 870 2,625 22,300 1.858 ;:::Lettuce, head >
(California type) heads 700 500 1,650 75 810 1,845 1,500 2,100 4,200 2,525 6,700 6,100 28.705 2.392Lotus root pounds 650 200 4,150 593Onion, bulb do 118.100 44,000 8,500 10,000 300 3,450 1,900 500 5,300 3,300 16,700 212,050 17,671 ::3Papaya do 5,500 5,500 5,500 2Pepper, bell do 25 1.850 600 1,000 635 210 500 145 25 50 5,040 420 ,-Potato, red do 5.000 600 97,600 103,200 8.600Potato, 'white do 243.000 92,000 82,300 69,200 44.700 112,250 ,229,700 15,000 14,075 27.800 28,900 221,840 1,180,765 98,397Pumpkin do 67,100 40.200 18,100 46,200 16,010 11,500 29,100 35,400 46,600 32,800 47,300 118,000 508.310 42.359Squash, SUlllmer do 9,700 1,800 100 200 85 1,200 9,500 500 5,000 2,650 2,800 6,600 40,135 3.345Sweetpotato
(XallC)T Hall) do 1,200 1,000 2,200 183 GSweetpotato (all others C
including yams) do 7,000 11,200 7,500 9,600 13,600 6,900 9.450 65,250 9.321Taro, upland do 3,000 32,000 3.000 4,000 5.000 2,000 49.000 7.000 .Taro. 'wetland ., do 150.500 134,900 101.300 88,400 87.300 95,900 81,800 740.100 105,729Tonulto do 186,150 225,050 170,510 181,805 275,085 122.925 122,675 72,850 32,900 1;:>.750 50,300 146,OiSO 1.602.110 133,509TOlllato, eg'g do 100 75 175 15Wnternwlon do 206,!OO 6;,,!00 I 36,800 1,i100 1,000 . 22,000 298,000 6.31,100 i ;'2,592 t;
TOTAL 11.;-)61.910 923.835 I 776,785 973.705 842.6:-:0 853.390 1.216.320 792.220 8:>9.665 878.230! 910,030 1,7nO,205 12.340.945 1,094,789
~
~
~ ~
~ ~
~
~
~ ~ ~
~
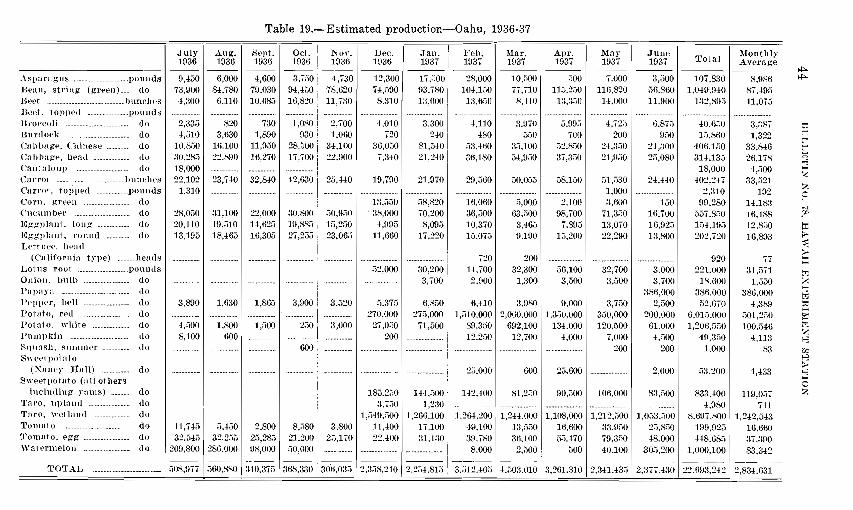
Table 19.-Estimated production-Oahu, 1936-37
IJuly Aug. Sept. Oct. Nov. Dec. Jan. Feb. 1\Iar. Apr. May June
Total~Ionthly
1936 1936 1936 1936 19:36 1936 1937 1937 1937 1937 1937 1937 ...L\.verage
Asparagus ....................................pounds 9,450 6,000 4,600 3,730 4,730 12,300 17.500 28,000 10,500 500 7,000 3,500 107,830 8,986Bean, string (green) ...... do 73,900 84,780 79,030 94,450 78,620 74,390 93.780 104,150 77,710 113,250 116,820 56,860 1,049,940 87,495Beet ...................................................bunches 4,300 6,110 10,685 16,820 11,730 8,310 13,600 13,650 8,440 13,350 14,000 11,900 132,895 11,075Beet, topped ...........................pounds ................... .................... ................... .................. ................... ........................ .......................... .......................... .......................... ........................ ..........................
Broccoli .......................................... do 2,335 820 730 1,080 2,700 4,010 3,300 4,110 3,970 5,995 4,723 6.875 40,650 3,387~'""
Bllr(locli: .......................................... do 4,510 3,630 1,890 930 1,060 720 240 480 550 700 200 950 15,860 1,322 c::Cnbbage, Chinese ............... do 10,850 16.100 11,950 28,500 34,100 36,050 81,540 53,460 33,100 52,850 24,350 21,300 406,150 33,846
~Cabbage, head ........................ do 30,285 22,890 16,270 17,700 22,900 7,340 21,240 36,180 54,950 37,350 21,950 25,080 314,135 26,178Can~ nloup do 18,000 .................. 18,000 4,500..................................... .................. ..................
2:Carrot .............................................bunches 22,102 23,740 32,840 42,630 25,440 19,790 21,970 29,560 50,055 58,150 51,530 24,440 402,247 33,5212:Carrot, tOI>ped .....................pounds 1,310 .................. ................... .................... .................. ......................... ........................ ........................ ........................ ........................ 1,000 ........................... 2,310 192
Corn, green .............................. do 13,550 58,820 16.060 5,00.0 2,100 3,600 150 99,280 14,183-1Cucunlber ...................................... do 28,050 31,100 22,000 30,800 50,950 . 38,000 70,200 36,500 63,500 98,700 71,350 16,700 557,850 46,488 ~oo
Eggplunt, long ..................... do 20,110 19,510 14,625 19,885 15,250 4,995 8,095 10,370 3,465 7,895 13,070 16,925 154,195 12,850Eggplant, round ............... do 13,195 18,465 16,305 27,255 23,06~) 11,660 17,220 15,075 9,190 15,200 22,290 13,800 202,720 16,893 p...Lettnce, hpnd
p...(California t~Tpe) ............head::; .................. ................... .................. .................. .................. ......................... ......................... 720 200 ........................ ......................... .......................... 920 77
Lotus root .................................pounds 52,000 30,200 14,700 32,300 56,100 32,700 3,000 221,000 31,571Onion, bulb .............................. do ................... .................... .................... .................... .................. ........................... 3,700 2,900 1,300 3,500 3,500 3,700 18,600 1,550Pal)a~~a ............................................. do 386,000 386,000 386,000Pepper, bell .............................. do 3,890 1,630 1,865 3,900 3,520 5,375 6,850 6,410 3,980 9,000 3,750 2,500 52,670 4,389Potato, red ................................. do ................... .................. ..................... ..................... .................... 270,000 275,000 1,510,000 2,060,000 1,350,000 350,000 200,000 6,015,000 501,250Potato, white ........................ do 4,500 1,800 1,500 250 3,000 27,050 71,500 89,350 692,100 134:,000 120,500 61,000 1,206,550 100,546
2:Pumpkin ....................................... do 8,100 600 ..................... ...................... .................... 200 ......................... 12,250 12,700 4,000 7,000 4,500 49,350 4,113 8Squash, sumluer .................. do ................... .................. .................. 600 .................... ............................ ......................... ........................ ........................... ......................... 200 200 1,000 83 "(J2
Sweetpotato 8p...(:Kaney Hnll) .................. do ................... ................... ................... .................. ..................... ......................... .......................... 25,000 600 25,600 ........................ 2,000 53,200 4,433
Sweetpotato (all othersC
including yall1s) ............ do 183,250 141,500 142,400 81,2~0 90,500 106,000 83,500 833,400 119,057 2:Taro, upland ........................... do 3,750 1,230 ........................ ......................... ......................... ........................ ......................... 4,980 711Taro, \yetlnnd ........................ do 1,549,500 1,266,100 1,264,200 1,244,000 1,108,000 1,212,500 1,053,500 8,697,800 1,242,543Tonulto ........................................... do 11,745 5,450 2,800 8,380 3,800 11,400 17,100 -19,100 13,550 16,600 33,950 25,850 199,925 16.660'l'olllato, egg .............................. do 32,545 32,255 25,285 21,200 25,170 22,400 31,130 39.780 36,100 55,470 79,350 48,000 448,685 37.390Watermelon .............................. do 209,800 286,000 98,000 50,000 ................. .......................... ............................ 8,000 2,500 I 500 40,100 305,200 1,000,100 83,342
--- --- -- --- --- --- ---1-- ---TOTAL ............................................. 1508,977 560,880 340,375 368,330 306,033 2,358,240 2,254,815 3,512.405 4,503,010 3,261.310 2,341,435 2,377,430 22,693,242 2,834,631
-
--- --- --- --- --- ~ ~
""""
~
~
~
~
~
"""" """" ~ ~
""'" ~ ~ ~
~ ~
.. .. .. ~
~
~--

Table 20.-Estimated production-Kauai, 193'6-37
July Aug. Sept. Oct. Nov. Dec. Jan. Feb. :Mar. Apr. l\Iay JuneTotal
l\Ionthly1936 1936 1936 1936 1936 1936 1937 1937 1937 1937 1D37 1937 .A.verage
--- --_. --- --- ---Asparagus ....................................pounds 20 ................... 30 .................. 200 100 20 150 200 200 150 150 1,220 102
Bean, string (green) ...... do 1,795 8,000 11,680 8,940 9,540 10,160 13,630 11,740 10,210 8,070 11,590 5,900 111,255 9,271
Beet ...................................................bunches 40 3;')0 180 830 640 240 1,060 850 1,240 595 630 840 7,495 625
Beet, topped ...........................pounds .................. ................... .................. .................. ................... .................. .................. .................. .................. .................. ...................... ..................... ........................ .........................Broccoli .......................................... do 200 100 .................... 100 I 30 130 60 320 220 420 500 550 2,630 219
Bllr(lock .......................................... do 2,215 4,520 4,030 4,270 4,120 4,460 3,580 1,180 1,590 4,650 3,600 4,100 42.315 3,526 2Cabbage, Chinese ............... do 10,150 9,200 9,740 4,370 5,190 8,470 5,450 5,480 10.695 9,760 2,195 80.700 6,725................... ....-j
Cab bage, head ........................ do 14,750 10,370 10,920 12,000 30,510 6,200 11,630 12,610 22,540 19,200 15,84:0 12,680 179.250 14,938
Cantaloup .................................... do ...................... 100 .................... ..................... 100 25:
Carrot .............................................bunches 990 2,880 6,120 3,520 2,570 2.830 4,180 3,340 6,070 11,250 4,150 6,780 54.680 4,557 0Z
Carrot, topped .....................pounds •• .................. 400 2,000 .................. 300 .................... ..................... ................... 2,000 .................. ...................... 4,700 392 >Corn, green .............................. do .................... 7,000 12,650 2,080 990 1,225 1,050 24,995 3,571 ZCucumber ......................................... do 6,730 28,900 5,430 5,910 19,420 19,700 30,050 12,300 17,550 470 9,560 7,560 163,580 13,632 '::l
Eggplant, long ..................... do 6,435 12,100 10,040 15,020 11,320 5,830 4,000 3,900 3,290 3,895 6,285 1,440 83,555 6,963Eggplant, round ............... do 5,280 5,940 5,310 2,660 900 1,020 620 150 120 670 350 150 23,170 1,931 >Lettuce, head ;;i
(California type) ............heads ..................... ....................... ..................... ......... ......... .................. ...................... ..................... ..................... ...................... ................... ...................... ..................... ....................... ..;;:,
Lotus root .................................ponnds 1,000 1,550 700 350 .................. ................... 3,600 514Z
Onion, bulb .............................. do .................. .................... ..................... ................... ................... .................. .................... ...................... ..................... 1,000 ................... 1,000 83Pepper, bell .............................. do 95 20 ....................... 30 ................... .................... .................... 20 .................. ...................... 130 70 365 30Potato, red ................................. do 4,500 ................... ..................... 1,770 800 67,000 501,000 572,GOO 109,200 81,500 ..................... 200 1,338,470 111,G39Potato, 'white ........................ do 4.025 450 150 500 600 150 1,400 165,350 510,000 190,150 18,950 .................... 891,725 74,310 "-3
Pumpkin ....................................... do 1,545 3,150 5,900 3,030 1,780 1,280 1,320 510 290 130 300 19,235 1,603.................. ....-j
Squash, snmlner .................. do ..................... ...................... ...................... ....... ............ ..................... ................... .................. .................... .................. .................. ..................... ..................... ...................... ......................
Sweetpotato(Nancy Hall) .................. do .................... .................... ......................... ...................... .................... .................... .................. ................... .................. .................... .................... ..................... ....................... .......................
Sweet potato (all othersincluding yams) ............ do 21,900 32,320 27,400 20,800 21,950 30,800 21,800 176,970 25,281 iJ1
Taro, upland ........................... do 3,8CO 200 .................. ................... ................... ................... .................. 4.0GO 579Taro, ,vetland ........................ do 142,800 141,600 140,850 134,550 1G9,6oo 111,700 128,100 959,200 137,029Tonlato ............................................ do 10,840 16,430 20,120 17,360 24,070 19,210 37,250 24,580 4,930 31,380 14,050 16,050 236,270 19,689Tonlato, egg .............................. do 1,880 9,165 6,950 10,480 9,840 3,350 1,400 3,200 2,840 200 1,200 7,250 r,7,755 4,813,\Yaternlelon .............................. do 58,700 51,700 13,900 4,500 3,000 .................... ................... .................... .................... 18,500 25,150 175,450 14,621.................. c.n
--- --- --- --- --- --- --- '--- ---TOTAL ............................................. 120,040 164,325 110.360 102.660 123,710 316,700 802,340 999,750 8;13,550 547,885 260,100 I 242,315 4,643.735 456,568
~ ~
~
~ ~ ~
............... u
~ ~
~
~ ~ ...... u .................
~ u .................
.. .. ~
.. ~ ~
~
_ .. ~ ~
~
~ ~ ~
~
~-

Table 21.-Estimated production-Molokai, 1936-37
-3
?-1,-:J)
""'"I
>
>
-~
-3'll-3>-3
oZ
0\
112
84125
563275
25
85053396
3,350
3,214
131,367
20
9,24724,135
83,245
3,0711,469
15,15941
3317,650
1,156
l\tIonthly....<\.verag·e
40,200
15516,405
240
300
Total
4oo17.65013.875
1.345
22,500
10.2006,4001,150
726,935
10,095100
6.7503.300
21,50017,625
181,910490
64,730289,615
8,7006,850
1,500
4,200
2,800
100
3,100
300
68,015
7251,700
10,0001,2008,590
200
40017,650
June1937
700
834
725
625
275
70
7,5002,5807,440
100
2,200
8,6004,170
1,860
37,690
May1937
100
100
480
370
845
2,00050
3,340120
6,120
5,000
1,100
Apr.1937
68,625
6,90042,100
100
670
200
400
495
775
2,280
2,800
2,000400
1,395
5,9103,750
5,0001,100
Mar.1937
27,275
90
5050090
200
950
100
150
2,2006,200
6,000
9,000
Feb.1937
7.81086,600
119,940
180200
100
1006,325
735
50
2,500
1,200
7,81068,800
88,025
:30
395
530
22011,4]0
200
17:)
100
1.20026,485
Nov. Dec.! Jan.1936 1936 1937== ----so 1-25
835 580.................. 50
405:!oo
100
150
Oct.1936
1,47550
5,40023,4oo
375650
3,350
3,10033,550
I
........ ::::::::::::::1
2,050 230 525
::::::::::: I ::::;: :::::::;~~
5,000
19,0002,600 12,500 21,050 31,620
..................................................................................
7,000 17,500 300 .--- ---
52,250 63,430 53,725 69,460
500
2,200
1,075400
3,125
Aug. Sept.1936 1936
2,600 1,47550
150 I 100
1,00028,300
50
39,400
200400
2,765
2,640
3,430
1001,375
150
2,000
July1936
17525,475
20
39.100
.................. i
.....................
350
TOTAL
Asparagus poundsBean, string (green)...... doBeet bunchesBeet, topped poundsBroccoli doBllr(}ock doCabbage, Chine,se doCabbage, head doCantaloup doCarrot bunchesCarrot, topped poundsCorn, green doCucuillber doEggplant, long doEggplant, round doLettuce, head
(California type) headsLotus root poundsOnion, bulb doPal)aya doPepper, bell doPotato, red doPotato, white doPunlpkin doSquash, sumiller doSweetpotato
(Nancy Hall) doSweetpotato (all others
including yams) doTaro, upland doTaro, wetland doTOluato doTonlato, egg do\Vatermelon do
~
1
~ ~
~
~ ~
~
~
~
~ ~ ~
~ ~
~
~
~ ~
~