production and geologic implications of the natih 9-c, 3-d
TRANSCRIPT

In the northern part of theSultanate of Oman, oil is pro-duced chiefly from carbon-ate reservoirs of Cretaceousage. Major fields such asFahud and Natih (Figure 1)were discovered in the 1960sand rapidly brought onstream by PetroleumDevelopment Oman (PDO).The oil-bearing reservoirsoccur in the Natih and theShu’aiba carbonate forma-tions (Figure 2). The mainreservoir in both fields is theNatih Formation. NatihField was brought on streamin 1967 and, like Fahud Field,production was initially by adepletion drive. As a resultof falling reservoir pressure,water injection was installedand this was later supple-mented by gas injection.When the petroleum engi-neers of PDO recognized theimportance of fractures todevelopment of these fields,the developments werechanged to gas/oil gravitydrainage (GOGD). The full-field GOGD involves lower-ing the fracture oil rim by 70m through crestal gas injec-tion and down-dip waterproduction.
Essential to the successof the developments was theimprovement of oil recoveryfrom the fractured carbonate reser-voirs. Core analysis and field studieshad provided a semiquantitativemodel of fracture frequency, and itwas recognized that the degree andorientation of fracturing obtainedfrom 3-D seismic might prove animportant tool. However, existingcompressional seismic coveragecould not give adequate informationon fracture intensities and orienta-tions, and it was necessary to explorethe use of a new seismic technique.As a result, it was decided to acquirea 9-C, 3-D (nine-component, three-
dimensional) seismic survey in anappropriate candidate field. Theobjective was to examine whether thereservoir fracturing would manifestitself in shear-wave anisotropy, themeasurement of which could then beused to characterize the direction andintensity of fracture systems.
Natih Field was selected for the9-C, 3-D trial seismic survey on tech-nical (the existence of a fracturemodel and of a single formation, theFiqa Formation, between the targetNatih reservoir and the surface) andeconomic (a 3-D compressional sur-vey was scheduled for the field)grounds.
In advance of the full survey, asmall-scale 2-D pilot seismic survey(9-C, 2-D) was acquired in 1989 to
test the feasibility of the full9-C, 3-D. In addition, twoVSPs (a zero-offset and an off-set VSP, both in well N-85)were acquired and a wireline(dipole) shear log was run toprovide independent mea-sures of anisotropy. Positiveresults were obtained fromthese tests and the 9-C, 3-Dsurvey trial was acquired in1991.
Geologic setting and reser-voir characteristics. NatihField was discovered in 1963by the Natih-1 (N-1) well andwas estimated to containapproximately 3000 millionbarrels of stock-tank oil ini-tially in place at 32° API, withan ultimate recovery of about630 million barrels. The fieldis within the Fahud Salt Basin(Figure 1a) on a domal struc-ture measuring about 10 � 6km. It is bounded to the northby a reverse fault with athrow of about 1000 m. Themain reservoir, the NatihFormation, is a 380-m thickcarbonate that is subdividedinto a series of stacked oil-bearing members, A to E. Thebulk of the reserves, however,are in Natih-A and Natih-B.The cap rock is shale of theoutcropping Fiqa Formationand the underlying strata are
shales of the Nahr Umr Formationthat cap the Shu’aiba reservoir(Figure 2).
Natih Formation is a middleCretaceous (Albian to Cenomanian)sequence of chalky limestones of theWasia Group (age equivalents of theMauddud and Mishrif formations inthe United Arab Emirates). The for-mation consists of four main upward-shoaling cycles of argillaceous limemudstones and wackestones coars-ening upward into algal and/or rud-ist packstones. Natih-A at the top ofthe reservoir is eroded and had beenexposed and leached prior to thedeposition of the overlying FiqaFormation. Another subaerial expo-sure surface has been identifiedwithin Natih Formation at the top of
0000 THE LEADING EDGE OCTOBER 2000 OCTOBER 2000 THE LEADING EDGE 1117
Production and geologic implications of theNatih 9-C, 3-D seismic survey
VICTOR H. HITCHINGS and HANS POTTERS, Petroleum Development Oman
Editor’s note: This article was publishedin GeoArabia, Vol. 5, No. 4, 2000. It hasbeen slightly modified to conform to TLEstyle.
600
625
650
675
700
700
700
575
600
700
800
650
9C-3D AREA
NATIH FIELD - OMAN(PRE-3D)
N-85
km
0 1
ZERO-OFFSET9C2D PILOT LINE
VSP OFFSET
I
Muscat
Fahud
Masirah
Ghaba SaltBasin
ARABIANGULF
UNITED ARABEMIRATES
FahudSalt
Basin
GULF OFOMAN
SAUDI ARABIA
58o56oE
24oN
22o
SaihHatat
N
OM
AN
MO
U
NTA IN S
HAWASINA THRUST SHEETS
MARADIFAULT ZONE
SemailGap
TransferFault
HUQFAREA
0 100
km
(Par.) autochthonous
Ordovician Amdeh Fm.
Basement
Salt BasinEast Oman OphioliteComplex Batain nappes
Oil field
Hawasina nappesSemail Ophiolite
Huqf outcrop
Fault
Thrust fault
Natih
Oil well
Structure contour (m)575
Anticline
PDOConcession
ApproximateLimit of
Natih Field
OMAN
SALAKH ARC
H
N-1
a)
b)
Figure 1. (a) Location of Natih Field, main oilprovinces, and PDO North Oman concessions. (b)Natih Field 9-C, 3-D survey area (on pre 3-D map).
Natih-E.After the Natih was deposited,
extension created NW-trending faultsacross the field. This was followed bya compressional phase that began inthe Late Cretaceous and which reac-tivated the extensional faults asreverse faults. However, the maincompressive event was associatedwith the uplift of the OmanMountains during the Pliocene, andthere was also minor strike-slipmovement along the northern seg-ment of the Maradi fault zone (Figure1a). This tectonic activity produced
the NE-trending fault and fractureset (NE-SW compression) that dom-inates the area.
Reservoir quality is variablewithin Natih Formation. The bestreservoir conditions occur at the topof the shoaling-upward cycles in rud-ist-bearing rocks that have an aver-age porosity of 25% and which arepartly leached. However, the perme-ability of the matrix is generally onlyin the range of 1-30 millidarcies, andproduction from the matrix is almostentirely dependent upon the fracturenetwork. Understanding the spatial
distribution and orientation of thefractures is critical in optimizingdevelopment of the reservoir.Fracture development largely resultsfrom the regional tectonics in combi-nation with uplift, or from release ofstress.
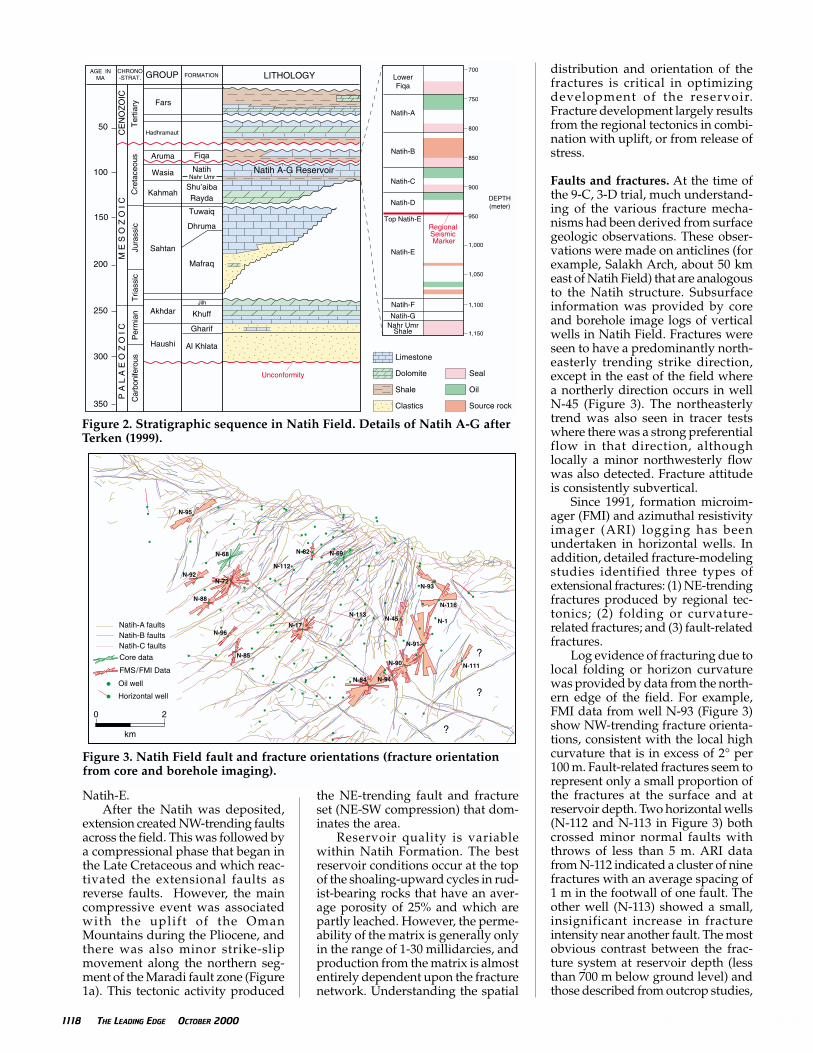
Faults and fractures. At the time ofthe 9-C, 3-D trial, much understand-ing of the various fracture mecha-nisms had been derived from surfacegeologic observations. These obser-vations were made on anticlines (forexample, Salakh Arch, about 50 kmeast of Natih Field) that are analogousto the Natih structure. Subsurfaceinformation was provided by coreand borehole image logs of verticalwells in Natih Field. Fractures wereseen to have a predominantly north-easterly trending strike direction,except in the east of the field wherea northerly direction occurs in wellN-45 (Figure 3). The northeasterlytrend was also seen in tracer testswhere there was a strong preferentialflow in that direction, althoughlocally a minor northwesterly flowwas also detected. Fracture attitudeis consistently subvertical.
Since 1991, formation microim-ager (FMI) and azimuthal resistivityimager (ARI) logging has beenundertaken in horizontal wells. Inaddition, detailed fracture-modelingstudies identified three types ofextensional fractures: (1) NE-trendingfractures produced by regional tec-tonics; (2) folding or curvature-related fractures; and (3) fault-relatedfractures.
Log evidence of fracturing due tolocal folding or horizon curvaturewas provided by data from the north-ern edge of the field. For example,FMI data from well N-93 (Figure 3)show NW-trending fracture orienta-tions, consistent with the local highcurvature that is in excess of 2° per100 m. Fault-related fractures seem torepresent only a small proportion ofthe fractures at the surface and atreservoir depth. Two horizontal wells(N-112 and N-113 in Figure 3) bothcrossed minor normal faults withthrows of less than 5 m. ARI datafrom N-112 indicated a cluster of ninefractures with an average spacing of1 m in the footwall of one fault. Theother well (N-113) showed a small,insignificant increase in fractureintensity near another fault. The mostobvious contrast between the frac-ture system at reservoir depth (lessthan 700 m below ground level) andthose described from outcrop studies,
1118 THE LEADING EDGE OCTOBER 2000 OCTOBER 2000 THE LEADING EDGE 0000
AGE INMA
CHRONO-STRAT. FORMATION
Hadhramaut
GROUP LITHOLOGY
Fars
Fiqa
NatihNahr Umr
Aruma
Wasia
Sahtan
Mafraq
Akhdar Khuff
Gharif
Haushi Al Khlata
50
100
150
200
250
300
350
Kahmah
CE
NO
ZO
ICM
E S
O Z
O I
CP
A L
A E
O Z
O I
C
Car
boni
fero
usP
erm
ian
Tria
ssic
Jura
ssic
Cre
tace
ous
Ter
tiary
Shu’aibaRayda
Tuwaiq
Dhruma
Jilh
Limestone
Dolomite
Shale
Seal
Oil
Source rockClastics
Unconformity
Natih A-G Reservoir
LowerFiqa
Natih-B
Natih-A
Natih-C
Natih-D
Natih-E
Top Natih-ERegional Seismic Marker
Natih-F
Natih-GNahr Umr
Shale
700
1,150
1,100
1,050
1,000
950
900
850
800
750
DEPTH(meter)
Core data
FMS/FMI Data
Natih-C faultsNatih-B faultsNatih-A faults
Oil well
Horizontal well
0 2
km ?
?
?N-91
N-88
N-92
N-68
N-96
N-85
N-84
N-113
N-94
N-93
N-116
N-1
N-111N-90
N-45
N-82
N-112
N-72
N-17
N-69
N-95
Figure 3. Natih Field fault and fracture orientations (fracture orientationfrom core and borehole imaging).
Figure 2. Stratigraphic sequence in Natih Field. Details of Natih A-G afterTerken (1999).

is the widespread development at thesurface of an intense (generally NW-trending) fracture set. The generalabsence of these fractures in the sub-surface is consistent with their rela-tionship to uplift or stress release.
The 3-D survey of 1992 was inter-preted in 1993 and Whyte (1995) pub-lished some of the field developmentfindings. The map-set generated fromthis conventional 3-D survey wasused in an integrated 1997 review ofthe fault/fracture system and pro-duction characteristics. The faultswere identified as belonging to threedistinct groups: (1) Main FaultZone—the major field-boundingreverse fault and its associated faults(NW-orientation); (2) a set of “fish-net” faults (NE- and NW-orientation),and (3) sets of en-echelon faults (gen-erally NE-orientation) that may bebounded by faults with a curvilineartrace (in map view) or by reactivatedNE-component fishnet faults.
Figure 4 shows the fault typesthat affect Natih-A, B, and C. Thefault pattern identified from the inter-play of the three types and the impor-tance of strike-slip and block rotationhas been evaluated. More impor-tantly, a series of “domains” wasdefined based on the fault character-istics and especially on the intensityand orientation of smaller faultswithin larger blocks (Figure 5).
A comparison of fracture orien-tations from cores and boreholeimages shows close agreement withfault orientations (Figure 3). Blockswhere rotation is interpreted havefracture strikes that depart from thenortheasterly regional strike orienta-tion by about 20° (for example, wellN-85). Fractures associated with themain fault and the steeper curvatureare also evident (in well N-93, forexample).
The fault and fracture character-istics have a predictably close rela-tionship with production behavior inthat the most “disturbed” blockshave the highest productivity. Interms of production, wells withinareas described as “quiet” in terms offaulting, produce typically 535 b/dwhereas a well in a “disturbed” areacan produce 3780 b/d. Figure 6shows an area of the field with the“productivity index” (PI) superim-posed. The highest productivity (blueand purple) comes, for the most part,from a “rotated” strike-slip block. Thepoorest productivity (green and pink)occurs in quiet areas (in terms of thefault classification).
The 9-C, 3-D time-splitting areas
0000 THE LEADING EDGE OCTOBER 2000 OCTOBER 2000 THE LEADING EDGE 1119
a
0 2
km ?
N-91
N-88
N-92
N-68
N-96
N-85
N-84
N-113
N-94
N-93
N-116
N-1
N-111N-90
N-45
N-82
N-72
N-17
N-69
N-95
N-112
0 2
km
b
?
?N-91
N-88
N-92
N-68
N-96
N-85
N-84
N-113
N-94
N-93
N-116
N-1
N-111N-90
N-45
N-82
N-72
N-17
N-69
N-95
N-112
LEGEND
Boundary fault zone
’Fishnet’faults
Re-activated (strike-slip)’Fishnet’ faultsRotational and right- and left- stepping faults
Natih-C faults
Oil wellHorizontal well
Natih-B faultsNatih-A faults
0 2
km
c
?
N-91
N-88
N-92
N-68
N-96
N-85
N-84
N-113
N-94
N-93
N-116
N-1
N-111N-90
N-45
N-82
N-72
N-17
N-69
N-95
N-112
Figure 4. Natih Field fault types: (a) fishnet faults; (b) strike-slip androtational faults; and (c) fishnet, strike-slip, and rotational faults. In (a) and(b), selected faults have been stripped out to show the nominated fault types;in (c), all faults and their classifications are shown.
a)
b)
c)

delineated from the shear seismic sur-vey have a clear correlation with thefault domains described above andwill be discussed later.
The purpose of the 9-C, 3-D trialwas twofold: (1) it had to prove theviability of shear seismic in itsentirety (i.e., acquisition, processingand interpretation for the detectionand quantification of fractures); and(2) it had to satisfy a business needin terms of its impact on an oil devel-opment plan.
An area in the west of Natih Fieldwas selected for the survey (Figure1b). This avoided the central areawhere existing production facilitiesmay have hampered survey quality,but it still represented a large part ofthe area of the field. The remainderof the field was to be covered by aconventional 3-D survey.
The 9-C, 3-D technique is consid-ered by the geophysical communityas one of the most promising inno-vations of recent years. However,what was missing from the originalinterpretation was a sound under-standing of the relationship betweenthe observed seismic anisotropy onthe one hand, and the Natih fracturepattern and production behavior onthe other. In early 1997, a detailedreview of the performance of all wellsin Natih Field was conducted, andthis has now been linked to a newand much more detailed model offaults and fractures. These newresults stimulated a fresh look at theNatih 9-C, 3-D data, and our conclu-sions are the subject of this paper.
Anisotropy of Natih reservoir. Theprinciple of fracture detection byseismic shear waves is quite simpleand is related to optical birefringenceas observed in crystals. A verticalshear wave polarized in an arbitrarydirection impinging upon strata con-taining vertical fractures will splitinto a fast and a slow wave that canbe thought of as propagating inde-pendently with different velocities(Figure 7). The wave polarized in theplane of the fractures is not affectedby the presence of the fractures, butthe one perpendicular to it is sloweddown. After a while, both waves arereflected from the bottom of the frac-tured strata and travel upward, againwith different velocities. More intensefracturing produces a larger differ-ence between the two velocities.When the signals are recorded at thesurface, the time difference betweenthe slow and the fast wave can bedetected by unraveling the rather
complicated mixed wave motionobserved by horizontal particle-motion detectors (multicomponentgeophones). For this purpose, spe-cial shear vibrators generate waves intwo perpendicular polarizations. Thisenables an accurate measurement ofthe direction of the fast and slowwaves from four wavefields, as eachsource direction produces a signal intwo horizontal geophones.
All unwanted effects of shallowerlayers were removed by anisotropicstripping. As a result, an accurate
interpretation of the Top Natih (topof the Natih reservoir) and Top Natih-E (an important regional seismicmarker) was made, and theanisotropic parameters for this inter-val were determined. Superimposingthe slow and fast wave data, as inFigure 8, shows the anisotropy. In theNatih interval, the difference betweenthe fast (SF) and the slow (SS) shearwaves shows itself as the time (ver-tical) separation of the red and greenreflections. Because of the time split-ting across the two lines, it is possi-
1120 THE LEADING EDGE OCTOBER 2000 OCTOBER 2000 THE LEADING EDGE 0000
Figure 6. Natih Field productivity indices (PI) of crestal wells.
Fault Domains
Natih-C faults
Natih-B faults
Natih-A faults
INC
RE
AS
ING
FA
ULT
CO
MP
LE
XIT
Y
Shear zones (rotation) Possible shear zone Shear/compressed zone A/A (less strong) Moderate quiet area Moderately faulted ’Quiet’ area ’Quiet’ area (poor data?)
Horizontal well
Oil well
0 2
km ?
?
?Limits of
Figure 10a
0 - 1 PI
1 - 10 PI
10 - 100 PI
100 - 1000 PI
0 2
km ?
?
?
Figure 5. Natih Field fault/struc-ture domains. Domains aredefined by the degree (inten-sity) and orientation of faults inareas defined by boundingfaults.

ble to identify locations whereanisotropy is small and locationswhere it is large. Small time-splittingvalues (4 ms) are predominant on theleft in Figure 8 (i.e., on the westernand southern flanks of the field). Alarge increase in time splitting occursup structure to the right, as shown bythe growing time-distance betweenany given pair of red and green loops(locally greater than 30 ms).Moreover, close inspection reveals,both on the in-line (Figure 8a) and thecross-line (Figure 8b) sections, thattime splitting gradually increaseswith increasing depth starting fromthe Top Natih reflection. This isexactly what is expected from a frac-tured interval as deeper reflectionshave traversed a larger interval overwhich the slow wave gets retardedrelative to the fast wave.
By taking the 200-ms intervalfrom Top Natih to Top Natih-E (thesebeing the strongest and most reliablehorizons) as representative of thereservoir, anisotropy direction and ata given surface location time split-ting over the entire survey area canbe determined. Time splitting isdivided by the two-way interval timefor the fast wave to obtain relativetime splitting. Figures 9a and 9b aremap views of the direction of the fastwave in Natih reservoir and the per-centage time splitting for the sameinterval, respectively.
Anisotropy of the Natih intervalis characterized by a polarizationdirection for the fast horizontal shearwave that trends approximatelynortheast (red on Figure 9a). As thisdirection coincides with that of thepervasive open fractures, it is inagreement with geologic expecta-tions. There are also areas where thefast-mode polarization tends more tothe N-NE (60-80°) and east-northeast(25-40°) and where fractures are prob-ably oriented somewhat differently.
Figure 9b shows a large shear-wave anisotropy present over abouthalf the survey area. Anisotropy islarge both in absolute (locally greaterthan 30 ms) and in relative terms(more than 15%). Reliable high-split-ting values do not coincide withmapped faults, which excludes fault-related extensional fractures as acause of anisotropy. However, faultsdo bound several domains of differ-ent shear-wave splitting withinwhich splitting variations are rela-tively small. This could imply thateach domain has its own fairly uni-form fracture pattern and intensity,whilst being in a different mechani-
cal stress state from its neighbors.Anisotropic areas can be identi-
fied by comparing the time-splittingmap (Figure 10b) with the modifieddomain map (Figure 10a) of the 9-C,3-D survey. Areas having the highestdegree of time splitting or anisotropycoincide with “rotational” areas, orthose interpreted as having been sub-jected to strike-slip movements. Theseare, in turn, the areas of highest pro-duction and the most fractured. Incontrast, the areas with the lowestdegree of splitting coincide with quietareas on the domain maps. The limi-tation of areas of different time split-ting (anisotropy) by faults is thenexplained as the bounding ofdomains that have differing degreesand orientation of faults and fractures.
Economic application of 9-C, 3-D.Given the interdependency of seismicanisotropy, structural domains, andproduction behavior, it is feasible tosuggest that the 9-C, 3-D map couldbe employed as a planning tool tolocate potential high-productivitywells. Mueller (1992) described howshear waves were used to predict thelateral variability in vertical fractureintensity in the Austin Chalk of Texas.
In this case, comparing interpretedstacked SF (fast) and SS (slow) sec-tions enabled anomalies to be seen inthe shear-wave data. Anomalousareas, where there are lateral seismicdiscontinuities in the SS sections, wereinterpreted as fracture zones about250 m wide. Such a zone was testedwith a horizontal well drilled throughtwo SS amplitude anomalies. Theresults showed two fracture zonesalong the well trajectory that coin-cided with the SS zones. In the sameway, the Natih 9-C, 3-D data set couldbe used as a well planning tool by:
• Selecting a general area for locat-ing a well based on productiondata.
• Planning and refining the welltrack using SF and SS sections gen-erated as random lines from the 9-C data cube in order to optimize theintersection of fractures.
It should also be noted thatdomains of small shear-waveanisotropy might be areas where non-GOGD production is possible andthat optimal development may be bylocalized water flood.
The 9-C, 3-D survey results are
0000 THE LEADING EDGE OCTOBER 2000 OCTOBER 2000 THE LEADING EDGE 1121
Shear 135 N
Shear East (slow)
Shear South (fast)
ShearSouth
ShearEast
North
East
TOP VIEW
Shear wave splitting (birefringence) due to
fracture-related anisotropy
Shear135 N
Figure 7. The shear-wave splitting phenomenon due to vertical fractures.

consistent with the 1997 fault/frac-ture model, but they cover only thewestern part of the field. Whyte(1995) described developing themovement of the fracture oil rim asthe challenge of “hitting a movingtarget.” As the oil rim is further devel-oped and lowered, the well-target-ing zone will move down the flankof the field. A careful consideration
of the business case may show thatcompleting the 9-C, 3-D survey overthe whole field could have a cost ben-efit for mitigating the risk of sitingwells in suboptimal areas.
Conclusions. The major results ofthis study are:
1) The 3-D (compressional) seismic
survey has been used to defineareas of differing fault and frac-ture characteristics, here termed“domains.”
2) Areas with variable shear-wavesplitting in the 9-C, 3-D seismicsurvey can be related to differentdomains.
3) As the domains show distinctlydifferent production characteris-
1122 THE LEADING EDGE OCTOBER 2000 OCTOBER 2000 THE LEADING EDGE 0000
1,500
1,700
1,900
2,100
2,300
2,500
2,700
2,900
a b
Top Natih
Natih-ETop Natih
Natih-E
TIM
E (
mill
isec
ond)
0 1km 0 1km
a) b)
Figure 8. (a) In-line final stacks oriented into Natih eigendirections for the fast (SF) and slow (SS) data and (b) cross-line final stacks oriented into Natih eigendirections for the SF and SS data. Red=fast mode; green=slow mode;black=common.
140
BIN
line
num
ber
120
100
80
60
40
20
00 20 40 60 80 100
a Orientation(degrees)
85 — 9080 — 8575 — 8070 — 7565 — 7060 — 6555 — 6050 — 5545 — 5040 — 4535 — 4030 — 3525 — 3020 — 2515 — 2010 — 155 — 100 — 5-5 — 0-10 — -5-15 — -10-20 — -15-25 — -20-30 — -25-35 — -30-40 — -35-45 — -40-50 — -45-55 — -50-60 — -55-65 — -60-70 — -65-75 — -70-80 — -75-85 — -80-90 — -85
0 1
km
BIN point number
Limit of 9C3Dsurvey area
0
BIN
line
num
ber
140
120
100
80
60
40
20
0
BIN point number
20 40 60 80 100
b Above —30.000
27.857 —30.000
25.714 —27.857
23.571 —25.714
21.429 —23.571
19.286 —21.429
17.143 —19.286
15.000 —17.143
12.857 —15.000
10.714 —12.857
8.571 —10.714
6.429 — 8.571
4.286 — 6.429
2.143 — 4.285
0.080 — 2.145
Below— 0.080
Splitting (%)
0 1
km
a) b)
Figure 9. Direction of (a) fast shear mode and (b) time splitting at Top Natih-E (after stripping). The interval ofshear-wave splitting covering the Natih-A, B, C, and D members is 200 ms of traveltime. Note the predominance ofNE trends.

tics in terms of well productivity,there is the potential for using the9-C, 3-D as a tool for measuring theintensity of fracturing and hence asa well location tool.
4) A review of the business case mayshow that completing the 9-C, 3-Dsurvey over the whole field couldhave a cost benefit for lowering therisk of siting wells in suboptimalareas.
Suggestions for further reading.“Generation of a field developmentplan, Natih Field, North Oman” byBostock et al. (in Proceedings 1st ArchieConference, 1990). “Recent develop-ments in reservoir engineering and theirimpact on oil and gas field develop-ment” by Davies and Niko (PetroleumGeoscience, 1995). “Fractured reservoirsimulation and field development,Natih Field, Oman” by Dijkum andWalker (SPE 1991 Annual TechnicalConference and Exhibition). “A shearexperiment over the Natih Field inOman: Pilot seismic and borehole data”by Hake et al. (Geophysical Prospecting,1998). “Middle Cretaceous carbonatereservoirs, Fahud Field and northwest-ern Oman” by Harris and Frost (AAPGBulletin, 1984). “Natih Field: Fault andfracture model” by Hitchings (unpub-lished internal report, PetroleumDevelopment Oman, 1997). “The 3-Dshear experiment over the Natih Fieldin Oman” by Kolk et al. (Geophysical
Prospecting, in press). “Fracture patternsof Natih Formation outcrops and theirimplications for the reservoir modellingof the Natih Field” by Mercadier andMakel (Proceedings of the 7th SPEMiddle East Oil Show, 1991). “Usingshear waves to predict lateral variabil-ity in vertical fracture intensity” byMueller (TLE, 1992). “Fahud Fieldreview: a switch from water to gas injec-tion” by O’Neill (Proceedings of the 5thSPE Middle East Oil Show, 1987). “The3-D shear experiment over the NatihField in Oman: Reservoir geology, dataacquisition and anisotropy analysis” byPotters et al. (Geophysical Prospecting,1999). “The Natih petroleum system ofNorth Oman” by Terken (GeoArabia,1999). “Natih Field, Oman: the use of 3-D seismic in a mature, fractured car-bonate reservoir” by Whyte (in MiddleEast Petroleum Geosciences, GEO’94, GulfPetroLink, 1995). LE
Acknowledgments: The authors thankPetroleum Development Oman and theMinistry of Oil and Gas of Oman for permis-sion to publish this paper. VH thanks the mem-bers of Petroleum Development Oman’sFahud/Natih Petroleum Engineering Team forsupport in the development of the fault/fracturemodel. Thanks are also due to two anonymousreviewers whose suggestions were appreciated.Pascal Richard is gratefully acknowledged forencouragement and enthusiasm.
Victor (Vic) Hitchings was awarded a PhD ingeology by University College, Swansea in
1982. He joined Shell as a reservoir geologistin 1986 after six years incore evaluation withRobertson Research. Afterworking in the ShellInternational Explorationand Development ResearchLaboratory in The Nether-lands and for Shell Nigeriaas a reservoir geologist, hejoined Petroleum Develop-
ment Oman in 1993. Hitchings was senior pro-duction geologist in the Fahud/Natih Team from1993 to 1997 and development geologist for theNatih Team from 1996 to 1997. He is at pre-sent a senior reservoir geologist at ShellTechnical, Exploration and Production in TheNetherlands.
Hans Potters joined Shell in 1984 after obtain-ing his PhD in physicsfrom Utrecht University.He has held geophysicalresearch and managementpositions in The Nether-lands, the United States,and Oman. From 1991 to1993, he was responsiblefor the Natih 9-C, 3-D pro-ject carried out by Petro-
leum Development Oman and Shell Research.In 1994, he was appointed head of theQuantitative Interpretation Group of PDO.Potters is now the Subsurface IntegrationCoordinator at Shell Technical, Exploration andProduction in The Netherlands.
Corresponding author: V. Hitchings,[email protected]
1124 THE LEADING EDGE OCTOBER 2000 OCTOBER 2000 THE LEADING EDGE 1123
BIN point number
0 20 40 60 80 100
140
BIN
line
num
ber
120
100
80
60
40
20
0
BIN point number
0 20 40 60 80 100
140
120
100
80
60
40
20
0
a b
Above — 30.00027.857 — 30.00025.714 — 27.85723.571 — 25.71421.429 — 23.57119.286 — 21.42917.143 — 19.28615.000 — 17.14312.857 — 15.00010.714 — 12.857
8.571 — 10.7146.429 — 8.5714.286 — 6.4292.143 — 4.2850.080 — 2.145
Below — 0.080
Splitting (%)
0 1
km
BIN
line
num
ber
Taken from Figure 5
0 1
km
a) b)
Figure 10. Comparison of (a) structural domains in the 9-C, 3-D area and (b) time splitting. Note the correlationbetween rotational shear zones and areas of intense shear-wave splitting.