production and employment - bcrp.gob.pe · 15 annual report 2017 tacna and in additional projects:...
TRANSCRIPT
11
ANNUAL REPORT 2017
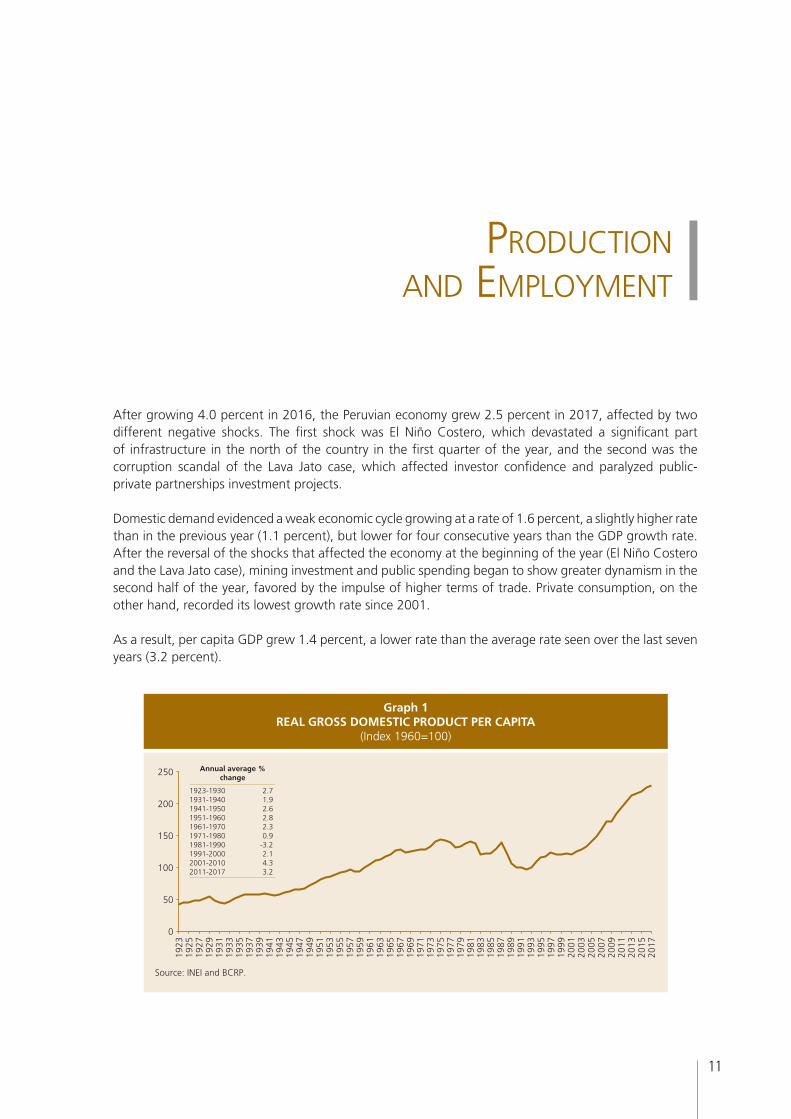
After growing 4.0 percent in 2016, the Peruvian economy grew 2.5 percent in 2017, affected by two different negative shocks. The first shock was El Niño Costero, which devastated a significant part of infrastructure in the north of the country in the first quarter of the year, and the second was the corruption scandal of the Lava Jato case, which affected investor confidence and paralyzed public-private partnerships investment projects.
Domestic demand evidenced a weak economic cycle growing at a rate of 1.6 percent, a slightly higher rate than in the previous year (1.1 percent), but lower for four consecutive years than the GDP growth rate. After the reversal of the shocks that affected the economy at the beginning of the year (El Niño Costero and the Lava Jato case), mining investment and public spending began to show greater dynamism in the second half of the year, favored by the impulse of higher terms of trade. Private consumption, on the other hand, recorded its lowest growth rate since 2001.
As a result, per capita GDP grew 1.4 percent, a lower rate than the average rate seen over the last seven years (3.2 percent).
ProductIon and EmPloymEnt I
Graph 1REAL GROSS DOMESTIC PRODUCT PER CAPITA
(Index 1960=100)
250
200
150
100
50
0
1923
1925
1927
1929
1931
1933
1935
1937
1939
1941
1943
1945
1947
1949
1951
1953
1955
1957
1959
1961
1963
1965
1967
1969
1971
1973
1975
1977
1979
1981
1983
1985
1987
1989
1991
1993
1995
1997
1999
2001
2003
2005
2007
2009
2011
2013
2015
2017
Source: INEI and BCRP.
Annual average % change
1923-1930 2.71931-1940 1.91941-1950 2.61951-1960 2.81961-1970 2.31971-1980 0.91981-1990 -3.21991-2000 2.12001-2010 4.32011-2017 3.2
12
CENTRAL RESERVE BANK OF PERU
1. Domestic Demand
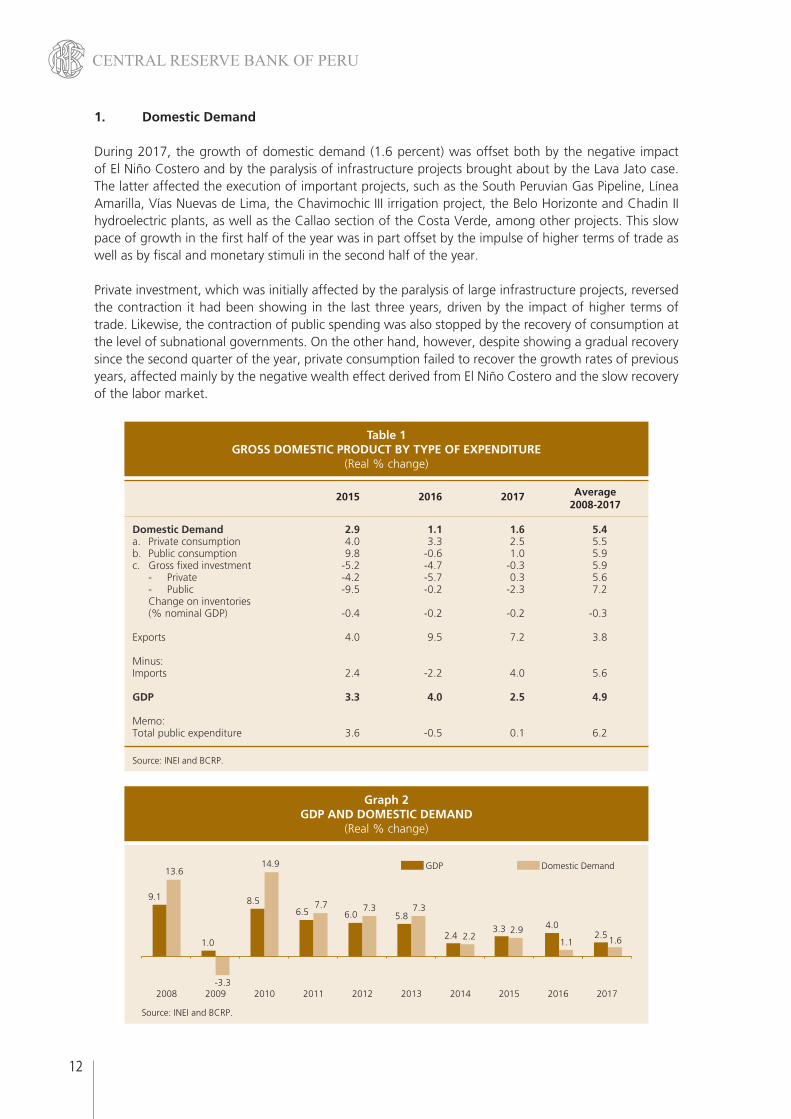
During 2017, the growth of domestic demand (1.6 percent) was offset both by the negative impact of El Niño Costero and by the paralysis of infrastructure projects brought about by the Lava Jato case. The latter affected the execution of important projects, such as the South Peruvian Gas Pipeline, Línea Amarilla, Vías Nuevas de Lima, the Chavimochic III irrigation project, the Belo Horizonte and Chadin II hydroelectric plants, as well as the Callao section of the Costa Verde, among other projects. This slow pace of growth in the first half of the year was in part offset by the impulse of higher terms of trade as well as by fiscal and monetary stimuli in the second half of the year.
Private investment, which was initially affected by the paralysis of large infrastructure projects, reversed the contraction it had been showing in the last three years, driven by the impact of higher terms of trade. Likewise, the contraction of public spending was also stopped by the recovery of consumption at the level of subnational governments. On the other hand, however, despite showing a gradual recovery since the second quarter of the year, private consumption failed to recover the growth rates of previous years, affected mainly by the negative wealth effect derived from El Niño Costero and the slow recovery of the labor market.
Average
2015 2016 2017 2008-2017
Domestic Demand 2.9 1.1 1.6 5.4a. Private consumption 4.0 3.3 2.5 5.5b. Public consumption 9.8 -0.6 1.0 5.9c. Gross fixed investment -5.2 -4.7 -0.3 5.9 - Private -4.2 -5.7 0.3 5.6 - Public -9.5 -0.2 -2.3 7.2 Change on inventories (% nominal GDP) -0.4 -0.2 -0.2 -0.3 Exports 4.0 9.5 7.2 3.8 Minus: Imports 2.4 -2.2 4.0 5.6 GDP 3.3 4.0 2.5 4.9 Memo: Total public expenditure 3.6 -0.5 0.1 6.2
Source: INEI and BCRP.
Table 1GROSS DOMESTIC PRODUCT BY TYPE OF EXPENDITURE
(Real % change)
Graph 2GDP AND DOMESTIC DEMAND
(Real % change)
4.02.5
1.1 1.6
13.6
8.5
14.9
1.0
-3.3
6.57.7
6.07.3
5.87.3
2.43.3
2.22.9
9.1
Source: INEI and BCRP.
2016 20172008 2009 2010 2011 2012 2013 2014 2015
GDP Domestic Demand

13
ANNUAL REPORT 2017
1.1 Private Consumption
Consumption expenditure in the private sector grew 2.5 percent in 2017–a lower rate than in 2016 (3.3 percent)–, reflecting in part the impact of El Niño Costero, which affected labor-intensive activities such as trade, services, and construction. In line with this, most indicators, i.e. employment, wage bill, confidence, and retail sales showed a significant deterioration in comparison with the levels observed in 2016. Moreover, unemployment in Metropolitan Lima increased slightly while consumer loans –in real terms– continued to slow down compared to their growth rates in previous years. In contrast, imports of consumer durables grew after having shown negative rates in the previous years.
2015 2016 2017
Occuped EAP in Metropolitan Lima 1.0 1.8 1.5
Real wage bill in Metropolitan Lima 2.4 3.0 -0.7
Metropolitan Lima unemployment rate 6.5 6.8 6.9
Consumer Confidence Index Apoyo 61 64 61
Index of expectations about household situation 12-month ahead 68 65 64
Real consumer loans 9.6 7.1 5.2
Retail sales 3.5 2.1 0.6
Imports of consumer goods -0.7 -3.2 5.0
Non-durable 1.8 -4.2 4.6
Durable -5.3 -3.0 2.2
Source: BCRP, INEI, and Apoyo.
Table 2INDICATORS OF PRIVATE CONSUMPTION
(% change respect to the similar month of previous year)
Graph 3PRIVATE CONSUMPTION
(Real % change)
Source: INEI and BCRP.
2016 2017
3.3
2.5
2008
8.9
2009
3.1
2010
9.1
2011
7.2
2012
7.4
2013
5.7
2014 2015
3.9 4.0
1.2 Private Investment
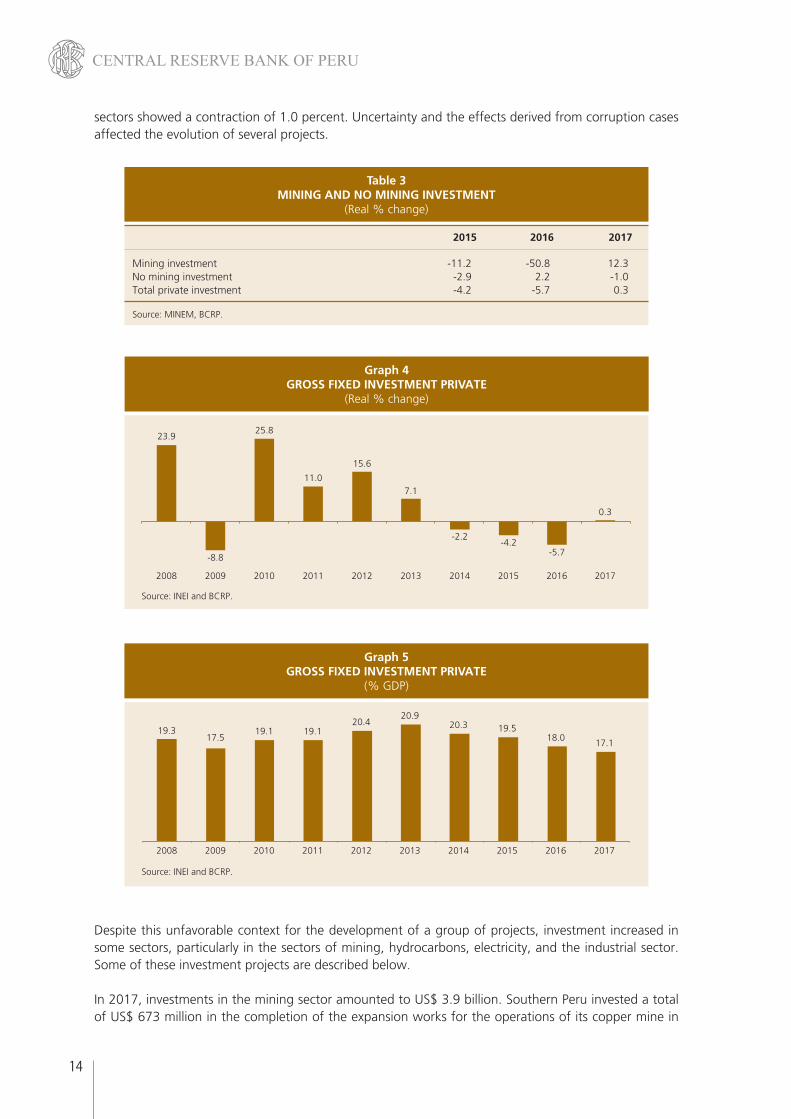
After recording negative rates for three consecutive years, private investment registered a recovery of 0.3 percent in 2017, reflecting the increase in mining investment (12.3 percent) associated with the higher prices of our export products (13.1 percent). On the other hand, investment in the non-mining
14
CENTRAL RESERVE BANK OF PERU
sectors showed a contraction of 1.0 percent. Uncertainty and the effects derived from corruption cases affected the evolution of several projects.
2015 2016 2017
Mining investment -11.2 -50.8 12.3No mining investment -2.9 2.2 -1.0Total private investment -4.2 -5.7 0.3
Source: MINEM, BCRP.
Table 3MINING AND NO MINING INVESTMENT
(Real % change)
Graph 4GROSS FIXED INVESTMENT PRIVATE
(Real % change)
Source: INEI and BCRP.
2016 2017
-5.7
0.3
2008
23.9
2009
-8.8
2010
25.8
2011
11.0
2012
15.6
2013
7.1
2014 2015
-2.2-4.2
Graph 5GROSS FIXED INVESTMENT PRIVATE
(% GDP)
Source: INEI and BCRP.
2016
18.0
2017
17.1
2009
17.5
2008
19.3
2010
19.1
2011
19.1
2012
20.4
2013
20.9
2014
20.3
2015
19.5
Despite this unfavorable context for the development of a group of projects, investment increased in some sectors, particularly in the sectors of mining, hydrocarbons, electricity, and the industrial sector. Some of these investment projects are described below.
In 2017, investments in the mining sector amounted to US$ 3.9 billion. Southern Peru invested a total of US$ 673 million in the completion of the expansion works for the operations of its copper mine in
15
ANNUAL REPORT 2017
Tacna and in additional projects: US$ 343 million was invested in the expansion of Toquepala, which reached an implementation level of 87 percent and is estimated to be completed in the second quarter of 2018. Additional projects developed by the company that were completed in December 2017 include, for example, the implementation of a high pressure grinding roller system in Toquepala, optimizing the management of heavy mineral ore in Cuajone, and implementing tailing thickeners in the Cuajone concentration plant. On the other hand, Antapaccay invested US$ 532 million mainly in its exploitation and tailings processes.
In the hydrocarbons sector, Repsol invested US$ 183 million mainly to adapt its fuel to the New Fuel Specifications of La Pampilla Refinery” (RLP-21).
In the electricity sector, the Thermal Power Plant of Santo Domingo de los Olleros (steam turbine-combined cycle) continued to be developed, while the implementation of the 200 Kv Moyobamba - Iquitos Transmission Line was paralyzed by conflicts with some communities. At end 2017, these projects show an advance of 98 and 17 percent, respectively. Moreover, Luz del Sur invested US$ 138 million in expanding the capacity and making improvements in the electricity grid, while Edelnor invested US$ 73 million in the electricity distribution grids (expansion and reinforcement of grids to meet the requirements of residential, commercial, and industrial users), US$ 29 million in subtransmission infrastructure (expansion and security of substations and transmission lines ), US$ 5.2 million in electrification in some human settlements, and US$ 2 million in the improvement of public lighting.
In the industrial sector, Gloria made investments for a total of US$ 101 million, mainly to improve its dairy production plant in Huachipa; Union de Cervecerías Peruanas Backus y Johnston invested US$ 59 million to expand the capacity of breweries, distribution centers, their stock of plastic boxes and glass containers, and transport units, while Unión Andina de Cementos invested US$ 39 million, mainly in the Carpapata III Hydroelectric Power Plant, improving the power plant infrastructure, and in maintenance of the Atocongo and Condorcocha plants.
1.3 Public Expenditure
Showing some recovery in comparison with the decline observed in 2016 (0.5 percent), public spending grew 0.1 percent in 2017. This recovery is explained by higher public consumption, whereas public investment, on the other hand, continued declining.
Consumption expenditure grew 1.0 percent as a result of the increased resources allocated to the maintenance of channels, drainage systems, and physical security structures established to face disaster hazards as part of the reconstruction projects initiated in response to the disasters caused by El Niño Costero.
Public investment fell 2.3 percent in 2017. This fall resulted from a strong contraction of investment during the first two quarters of the year (mainly due to El Niño Costero in the first quarter of 2017) and from a gradual recovery of government investment thereafter which reflected subnational governments’ higher expenditure in projects aimed to improve and expand potable water and sewerage systems, road and educational infrastructure projects, and a gradual increase of expenditure for the reconstruction plan and the implementation of the infrastructure projects for the Pan American Games.
1.4 Exports and Imports
Exports of goods and services grew 7.2 percent in 2017, less than in the previous year (9.5 percent), this slowdown reflecting mainly the reduction in the growth rate of exports of copper (down from 41.8
16
CENTRAL RESERVE BANK OF PERU
in 2016 to 4.7 percent in 2017) and coffee (down from 30.0 to 1.9 percent). On the other hand, non-traditional exports showed greater dynamism than in 2016, as reflected mainly in exports of agricultural products, fisheries, and textiles in a context of recovery of external demand.
Imports of goods and services increased 4.0 percent (versus a fall of 2.2 percent in 2016), favored by a context marked by an acceleration of domestic demand due to the recovery of private investment and a greater demand for inputs.
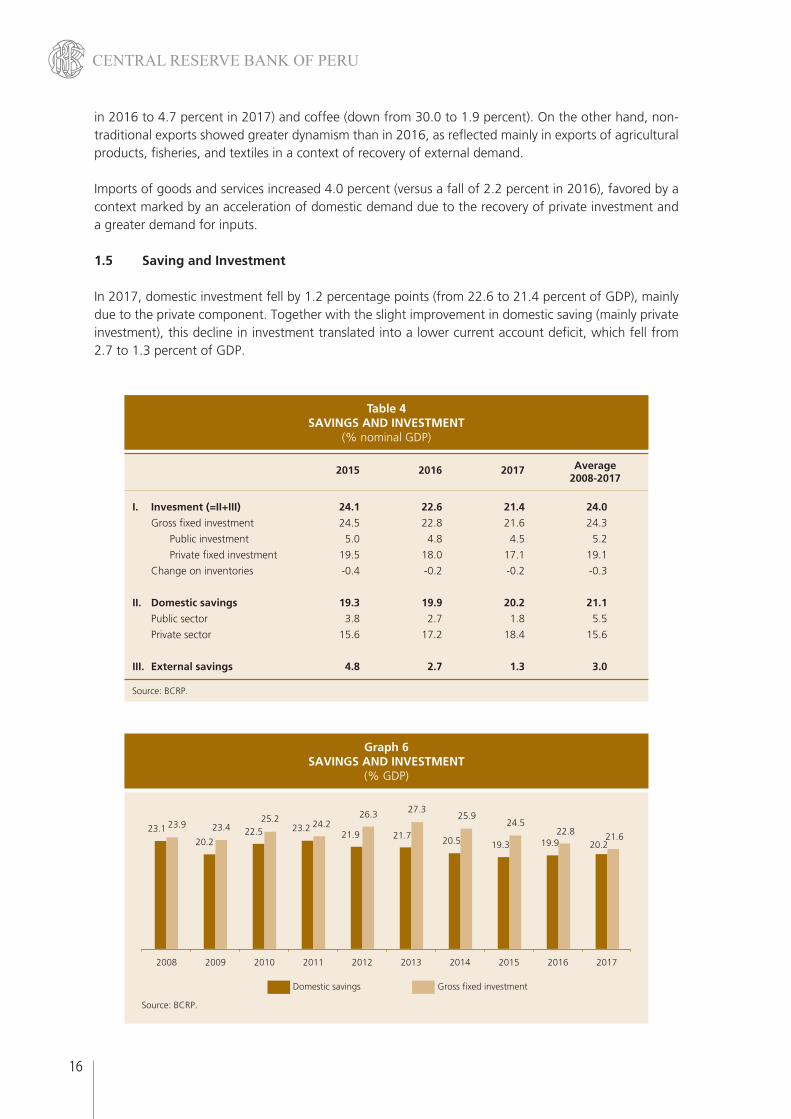
1.5 Saving and Investment
In 2017, domestic investment fell by 1.2 percentage points (from 22.6 to 21.4 percent of GDP), mainly due to the private component. Together with the slight improvement in domestic saving (mainly private investment), this decline in investment translated into a lower current account deficit, which fell from 2.7 to 1.3 percent of GDP.
Average
2015 2016 2017 2008-2017
I. Invesment (=II+III) 24.1 22.6 21.4 24.0
Gross fixed investment 24.5 22.8 21.6 24.3
Public investment 5.0 4.8 4.5 5.2
Private fixed investment 19.5 18.0 17.1 19.1
Change on inventories -0.4 -0.2 -0.2 -0.3
II. Domestic savings 19.3 19.9 20.2 21.1
Public sector 3.8 2.7 1.8 5.5
Private sector 15.6 17.2 18.4 15.6
III. External savings 4.8 2.7 1.3 3.0
Source: BCRP.
Table 4SAVINGS AND INVESTMENT
(% nominal GDP)
Graph 6SAVINGS AND INVESTMENT
(% GDP)
Source: BCRP.
2016 20172008 2009 2010 2011 2012 2013 2014 2015
Domestic savings Gross fixed investment
19.9 20.222.8 21.6
23.1 23.9
20.2
23.4 22.525.2
23.2 24.221.9
26.3
21.7
27.3
20.5
25.9
19.3
24.5

17
ANNUAL REPORT 2017
2. Economic Sectors
On the side of production sectors, the lower growth of the output during 2017 (2.5 percent versus 4.0 percent in 2016) is mainly explained by the slowdown of activity in the primary sectors. The sector of metal mining recorded a growth rate of 4.2 percent after having grown 21.2 percent in 2016, as a result of which its marginal contribution to GDP fell significantly. This was particularly noteworthy in a context of delay in the start of new projects.
On the other hand, non-primary sectors registered the same growth rate as in the previous year (2.4 percent). These sectors initially showed a period of low growth as a result of the shocks observed in the first months of the year, but the recovery of private investment and public spending boosted domestic demand during the second half of the year after the effects of the shocks subsided. The recovery of the construction sector is worth highlighting since this sector grew 2.2 percent after two years of contraction. In contrast, affected mainly by the events associated with El Niño Costero, the sectors of commerce and services failed to recover the dynamism they showed in the previous years. Likewise, non-primary manufacturing recorded its fourth consecutive year of contraction (-0.9 percent), even though it was lower than in previous years.
Average
2015 2016 2017 2008-2017
Agriculture and livestock 2/ 3.5 2.7 2.6 3.6Agriculture 2.3 1.8 2.6 3.3Livestock 5.2 3.7 2.7 4.7
Fishing 15.9 -10.1 4.7 -2.1
Mining and hydrocarbons 3/ 9.5 16.3 3.2 4.6Metallic mining 15.7 21.2 4.2 4.3Hydrocarbons -11.5 -5.1 -2.4 3.3
Manufacturing 4/ -1.5 -1.4 -0.3 1.9Manufacturing based on raw materials 1.8 -0.6 1.9 0.3Non-primary manufacturing -2.6 -1.6 -0.9 2.5
Electricity and water 5.9 7.3 1.1 5.5
Construction -5.8 -3.1 2.2 6.2
Commerce 3.9 1.8 1.0 5.5
Services 4.2 4.0 3.4 5.8
GDP 3.3 4.0 2.5 4.9
Memo: Primary 6.9 10.0 2.9 3.6 Non-primary 2.4 2.4 2.4 5.3
1/ Preliminary data.2/ Includes the forestry sector.3/ Includes non-metallic mining and secondary production.4/ Includes secondary production.
Table 5GROSS DOMESTIC PRODUCT BY ECONOMIC SECTOR 1/
(Real % change)

18
CENTRAL RESERVE BANK OF PERU
Average
2015 2016 2017 2008-2017
A. Agriculturel production 2.3 1.8 2.6 3.3
For the domestic market 3.2 -1.9 -0.2 2.7 Potato 0.2 -4.3 5.0 3.4 Rice 8.8 0.5 -3.8 2.3 Onion 0.3 -7.2 2.1 1.5 Tangerine 5.4 12.8 0.0 7.8 Orange 1.3 7.6 1.5 3.8 Alfalfa 3.3 -2.7 -1.8 1.3 Tomato -11.2 -1.4 -5.3 2.4 Banana -3.3 0.9 -1.4 1.1 Cassava 2.9 -4.0 1.0 0.9 Amilaceous maize 1.9 -9.9 -0.5 1.2 Garlic 10.1 -12.9 21.3 1.6 Lemon 1.6 0.9 -38.1 -4.7 Other 3.6 -2.1 0.5 3.5 For industry 1.7 -10.6 -2.9 -0.9 Yellow hard maize 17.2 -14.3 1.3 1.1 Oil palm 10.8 7.6 9.5 13.0 Sugar cane -10.3 -3.7 -4.4 1.3 For export 0.6 15.4 10.0 6.4 Coffee 13.5 11.5 21.5 4.2 Asparagus -1.8 2.0 0.8 3.0 Grapes 17.9 15.4 -6.6 12.6 Avocado 7.8 20.9 3.4 14.5 Mango -8.0 8.0 1.9 2.6 Cocoa 13.4 16.6 11.2 14.4 Quinoa -7.9 -25.0 -0.9 9.5 Blueberry 317.7 164.4 85.9 n.d. Other -41.7 33.7 7.0 0.4 B. Livestock production 5.2 3.7 2.7 4.7 Poultry 8.1 5.6 4.1 7.3 Beef -0.1 -3.0 -1.4 1.4 Eggs 7.7 3.8 3.6 4.9 Pork 5.6 4.5 5.7 3.3 Milk 3.4 2.7 2.9 2.4 Other -4.3 3.3 -5.1 0.2 C. Total 2/ 3.5 2.7 2.6 3.6
1/ Preliminary.2/ Includes the forestry sector.Source: INEI and MINAGRI.
Table 6AGRICULTURE AND LIVESTOCK PRODUCTION 1/
(Real % change)
2.1 Agriculture Sector
The agricultural sector grew 2.6 percent in 2017, recording a rate similar to that observed in 2016 despite the adverse impact of El Niño Costero on this sector in the first months of the year. With this growth rate, the sector accumulated thirteen continuous years of growth.

19
ANNUAL REPORT 2017
This positive performance of the sector in 2017 is explained by the growth of agro-exports (10.0 percent) thanks to farmers’ constant search for profitable products, such as blueberries, for example, as well as to their constant search for greater technological resources that allow them to face climate alterations better. It is worth pointing out that the success of blueberry exports in external markets is reflected in the fact that these exports grew 318, 164, and 86 percent in 2015, 2016, and 2017, respectively.
In addition to this, it is also worth mentioning that agricultural production was better oriented to agro-industry and to the domestic market than in the previous crop year thanks to the water resources that El Niño Costero left in the main reservoirs of the North Coast.
Graph 7STORAGE VOLUME OF MAIN RESERVOIR 1/
(Million cubic feet)
1/ As of August 30months of beginning of crop season.Source: ANA.
Aug.16 Aug.17 Aug.16 Aug.17 Aug.16 Aug.17 Aug.16 Aug.17
Poechos Tinajones Gallito Ciego San Lorenzo
408
364
65
296
230
360
136166
The country’s diversity of geographical farming areas made it possible to offset the adverse effects of El Niño Costero on the north coast and on the central areas of the country since the highlands, the jungle and the south coast had better climatic conditions than in the previous crop year. Thus, while there was a lower output of the traditional crops produced in the north coast (sugar cane and lemon) and of the complementary crops also produced in this area (rice, grapes, and bananas), other crops showed higher volumes: potatoes (5.0 percent), garlic (21.3 percent), palm oil (9.5 percent), coffee (up 21.5 percent after overcoming the 2013 – 2015 period when coffee crops were affected by the rust pest), avocadoes (3.4 percent), and cocoa (11.2 percent). The livestock subsector also recorded high production volumes of poultry and pork meat (4.1 and 5.7 percent, respectively), as well as high volumes of eggs and milk (3.6 and 2.9 percent, respectively) for the domestic market.

20
CENTRAL RESERVE BANK OF PERU
It is worth mentioning that in the case of the production oriented to the domestic market, there was an oversupply of potatoes and good harvests of vegetables (onion and garlic) on the one hand, and, on the other hand, there was a lag in the harvests of rice, so the output showed a net drop, although lower than in the previous year. A similar situation was observed in the agro-industrial output with the recovery of the production of hard yellow maize (due to increased availability of water) and the growing production of oil palm, which offset the lower production of sugarcane associated with the effects of El Niño Costero (lower yields due to the “tropicalization” of this crop).
2.2 Fishing Sector
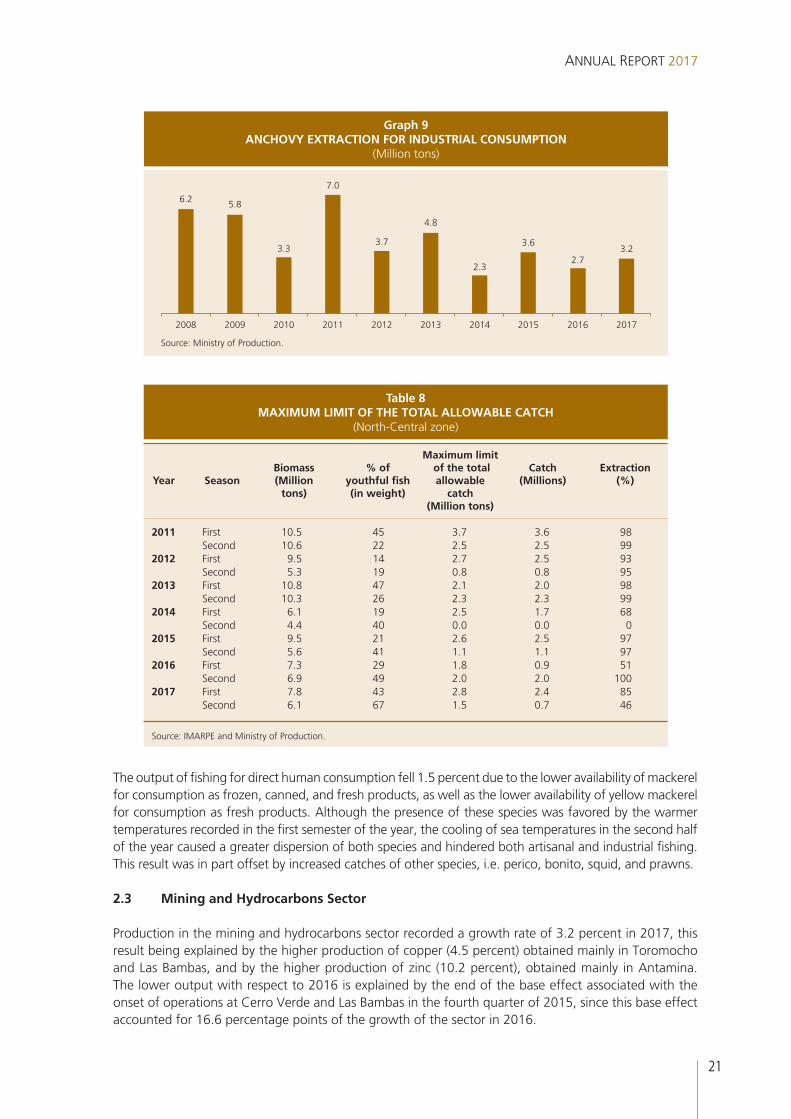
In 2017, the fishing output grew 4.7 percent as a result of increased anchovy landings in the first half of the year. In spite of El Niño Costero, the distribution, reproduction, and growth of the anchovy biomass were not seriously affected during the first fishing season because, first of all, sea warming occurred in surface waters and not in sub-surface waters, and second, the event was short-lived. As a result, the assigned quota and the respective catches were greater than those obtained in the first fishing season in 2016. Thus, the volume of anchovy catch for industrial consumption increased from 2.7 to 3.2 million MT between 2016 and 2017.
Conversely, the cooling of sea temperatures observed along the Peruvian coast during the second half of the year brought about the dispersion of the anchovy biomass, favoring spawning conditions and increasing the presence of juvenile fish. In these conditions, the Ministry of Production first established a lower fishing quota for the second fishing season than the one authorized in 2016, and then, ordered the temporary closure of the fishing season in the months of November and December.
Average Species
2015 2016 2017 2008-2017
Fishing sector 15.9 -10.1 4.7 -2.1Anchovy 60.3 -24.4 15.8 -6.3Jack mackerel -62.2 -28.9 -44.8 -25.7Prawns 23.0 9.3 32.5 11.1Giant Squid -8.2 -42.4 2.6 -4.0Mackerel -48.2 276.6 -59.7 -1.2Tuna 134.1 -1.8 8.4 12.3Scallops -71.6 -32.0 -54.4 -13.6
Source: Ministry of Production.
Table 7FISH CATCH BY MAIN SPECIES
(% change)
Graph 8COFFEE PRODCUTION
(Thousand tons)
Source: MINAGRI.
2017
341
2008
274
2009
243
2010
279
2011
332
2012
320
2013
256
2014
222
2015
252
2016
281
21
ANNUAL REPORT 2017
The output of fishing for direct human consumption fell 1.5 percent due to the lower availability of mackerel for consumption as frozen, canned, and fresh products, as well as the lower availability of yellow mackerel for consumption as fresh products. Although the presence of these species was favored by the warmer temperatures recorded in the first semester of the year, the cooling of sea temperatures in the second half of the year caused a greater dispersion of both species and hindered both artisanal and industrial fishing. This result was in part offset by increased catches of other species, i.e. perico, bonito, squid, and prawns.
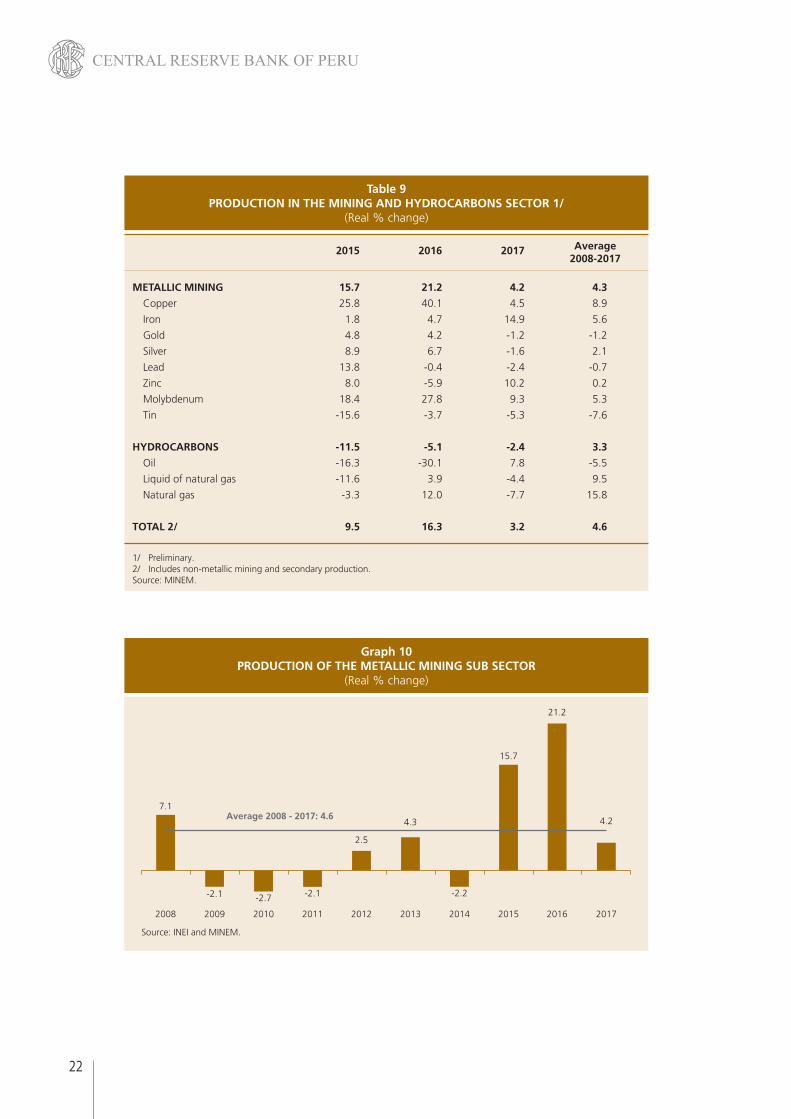
2.3 Mining and Hydrocarbons Sector
Production in the mining and hydrocarbons sector recorded a growth rate of 3.2 percent in 2017, this result being explained by the higher production of copper (4.5 percent) obtained mainly in Toromocho and Las Bambas, and by the higher production of zinc (10.2 percent), obtained mainly in Antamina. The lower output with respect to 2016 is explained by the end of the base effect associated with the onset of operations at Cerro Verde and Las Bambas in the fourth quarter of 2015, since this base effect accounted for 16.6 percentage points of the growth of the sector in 2016.
Graph 9ANCHOVY EXTRACTION FOR INDUSTRIAL CONSUMPTION
(Million tons)
Source: Ministry of Production.
2016
2.7
2008
6.2
2009
5.8
2010
3.3
2011
7.0
2012
3.7
2013
4.8
2014 2015 2017
2.3
3.63.2
Maximum limit Biomass % of of the total Catch Extraction Year Season (Million youthful fish allowable (Millions) (%) tons) (in weight) catch (Million tons)
2011 First 10.5 45 3.7 3.6 98 Second 10.6 22 2.5 2.5 992012 First 9.5 14 2.7 2.5 93 Second 5.3 19 0.8 0.8 952013 First 10.8 47 2.1 2.0 98 Second 10.3 26 2.3 2.3 992014 First 6.1 19 2.5 1.7 68 Second 4.4 40 0.0 0.0 02015 First 9.5 21 2.6 2.5 97 Second 5.6 41 1.1 1.1 972016 First 7.3 29 1.8 0.9 51 Second 6.9 49 2.0 2.0 1002017 First 7.8 43 2.8 2.4 85 Second 6.1 67 1.5 0.7 46
Source: IMARPE and Ministry of Production.
Table 8MAXIMUM LIMIT OF THE TOTAL ALLOWABLE CATCH
(North-Central zone)
22
CENTRAL RESERVE BANK OF PERU
Average
2015 2016 2017 2008-2017
METALLIC MINING 15.7 21.2 4.2 4.3
Copper 25.8 40.1 4.5 8.9
Iron 1.8 4.7 14.9 5.6
Gold 4.8 4.2 -1.2 -1.2
Silver 8.9 6.7 -1.6 2.1
Lead 13.8 -0.4 -2.4 -0.7
Zinc 8.0 -5.9 10.2 0.2
Molybdenum 18.4 27.8 9.3 5.3
Tin -15.6 -3.7 -5.3 -7.6
HYDROCARBONS -11.5 -5.1 -2.4 3.3
Oil -16.3 -30.1 7.8 -5.5
Liquid of natural gas -11.6 3.9 -4.4 9.5
Natural gas -3.3 12.0 -7.7 15.8
TOTAL 2/ 9.5 16.3 3.2 4.6
1/ Preliminary.2/ Includes non-metallic mining and secondary production.Source: MINEM.
Table 9PRODUCTION IN THE MINING AND HYDROCARBONS SECTOR 1/
(Real % change)
Graph 10PRODUCTION OF THE METALLIC MINING SUB SECTOR
(Real % change)
Source: INEI and MINEM.
2016 2017
21.2
4.2
2008
7.1Average 2008 - 2017: 4.6
2009
-2.1
2010
-2.7
2011
-2.1
2012
2.5
2013
4.3
2014 2015
-2.2
15.7
23
ANNUAL REPORT 2017
2007 2016 2017
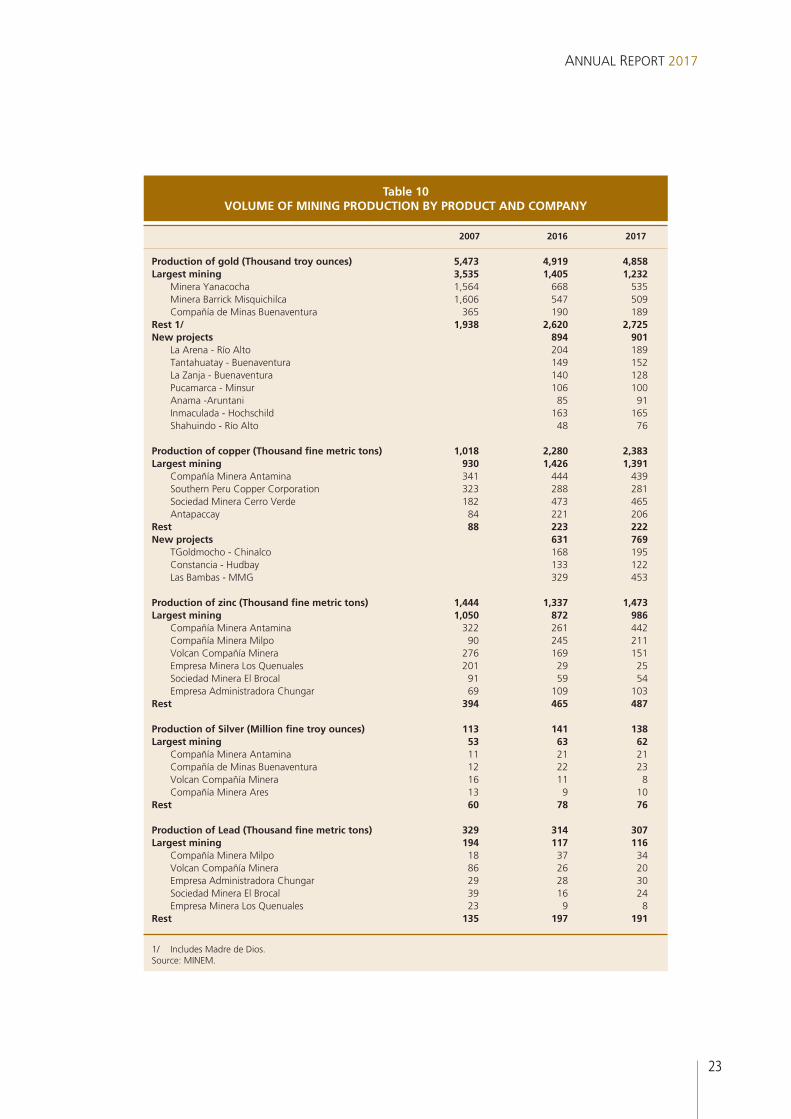
Production of gold (Thousand troy ounces) 5,473 4,919 4,858Largest mining 3,535 1,405 1,232 Minera Yanacocha 1,564 668 535 Minera Barrick Misquichilca 1,606 547 509 Compañía de Minas Buenaventura 365 190 189Rest 1/ 1,938 2,620 2,725New projects 894 901 La Arena - Río Alto 204 189 Tantahuatay - Buenaventura 149 152 La Zanja - Buenaventura 140 128 Pucamarca - Minsur 106 100 Anama -Aruntani 85 91 Inmaculada - Hochschild 163 165 Shahuindo - Río Alto 48 76
Production of copper (Thousand fine metric tons) 1,018 2,280 2,383Largest mining 930 1,426 1,391 Compañía Minera Antamina 341 444 439 Southern Peru Copper Corporation 323 288 281 Sociedad Minera Cerro Verde 182 473 465 Antapaccay 84 221 206Rest 88 223 222New projects 631 769 TGoldmocho - Chinalco 168 195 Constancia - Hudbay 133 122 Las Bambas - MMG 329 453
Production of zinc (Thousand fine metric tons) 1,444 1,337 1,473Largest mining 1,050 872 986 Compañía Minera Antamina 322 261 442 Compañía Minera Milpo 90 245 211 Volcan Compañía Minera 276 169 151 Empresa Minera Los Quenuales 201 29 25 Sociedad Minera El Brocal 91 59 54 Empresa Administradora Chungar 69 109 103Rest 394 465 487
Production of Silver (Million fine troy ounces) 113 141 138Largest mining 53 63 62 Compañía Minera Antamina 11 21 21 Compañía de Minas Buenaventura 12 22 23 Volcan Compañía Minera 16 11 8 Compañía Minera Ares 13 9 10Rest 60 78 76
Production of Lead (Thousand fine metric tons) 329 314 307Largest mining 194 117 116 Compañía Minera Milpo 18 37 34 Volcan Compañía Minera 86 26 20 Empresa Administradora Chungar 29 28 30 Sociedad Minera El Brocal 39 16 24 Empresa Minera Los Quenuales 23 9 8Rest 135 197 191
1/ Includes Madre de Dios.Source: MINEM.
Table 10VOLUME OF MINING PRODUCTION BY PRODUCT AND COMPANY
24
CENTRAL RESERVE BANK OF PERU
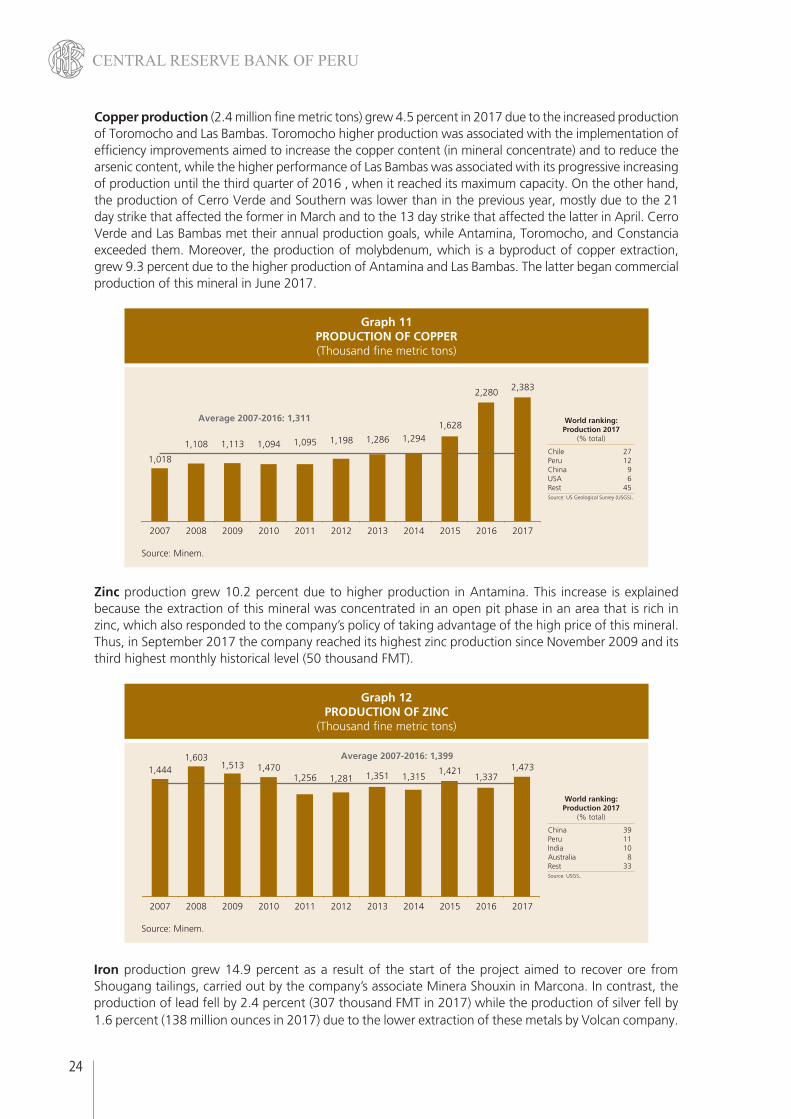
Copper production (2.4 million fine metric tons) grew 4.5 percent in 2017 due to the increased production of Toromocho and Las Bambas. Toromocho higher production was associated with the implementation of efficiency improvements aimed to increase the copper content (in mineral concentrate) and to reduce the arsenic content, while the higher performance of Las Bambas was associated with its progressive increasing of production until the third quarter of 2016 , when it reached its maximum capacity. On the other hand, the production of Cerro Verde and Southern was lower than in the previous year, mostly due to the 21 day strike that affected the former in March and to the 13 day strike that affected the latter in April. Cerro Verde and Las Bambas met their annual production goals, while Antamina, Toromocho, and Constancia exceeded them. Moreover, the production of molybdenum, which is a byproduct of copper extraction, grew 9.3 percent due to the higher production of Antamina and Las Bambas. The latter began commercial production of this mineral in June 2017.
Graph 11PRODUCTION OF COPPER(Thousand fine metric tons)
Source: Minem.
2016
2,280
2008
1,108
2007
1,018
2009
1,113
2010
1,094
2011
1,095
2012
1,198
2013
1,286
2014
1,294
2015
1,628
2017
2,383
Average 2007-2016: 1,311 World ranking: Production 2017
(% total)
Chile 27Peru 12China 9USA 6Rest 45Source: US Geological Survey (USGS).
Graph 12PRODUCTION OF ZINC
(Thousand fine metric tons)
Source: Minem.
2016
1,337
2008
1,603
2007
1,444
2009
1,513
2010
1,470
2011
1,256
2012
1,281
2013
1,351
2014
1,315
2015
1,421
2017
1,473Average 2007-2016: 1,399
World ranking: Production 2017
(% total)
China 39Peru 11India 10Australia 8Rest 33Source: USGS.
Zinc production grew 10.2 percent due to higher production in Antamina. This increase is explained because the extraction of this mineral was concentrated in an open pit phase in an area that is rich in zinc, which also responded to the company’s policy of taking advantage of the high price of this mineral. Thus, in September 2017 the company reached its highest zinc production since November 2009 and its third highest monthly historical level (50 thousand FMT).
Iron production grew 14.9 percent as a result of the start of the project aimed to recover ore from Shougang tailings, carried out by the company’s associate Minera Shouxin in Marcona. In contrast, the production of lead fell by 2.4 percent (307 thousand FMT in 2017) while the production of silver fell by 1.6 percent (138 million ounces in 2017) due to the lower extraction of these metals by Volcan company.
25
ANNUAL REPORT 2017
Graph 13PRODUCTION OF GOLD(Thousand troy ounces)
Source: Minem.
2016
4,919
2008
5,783
2007
5,473
2009
5,916
2010
5,275
2011
5,343
2012
5,194
2013
5,024
2014
4,504
2015
4,720
2017
4,858
Average 2007-2016: 5,215
World ranking: Production 2017
(% total)
China 14Australia 10USA 8Russia 8Canada 6Peru 5Rest 50Source: USGS.
Graph 14PRODUCTION OF LIQUID HYDROCARBONS
(Thousand barrels per day)
200
180
160
140
120
100
80
60
40
20
0
Source: Perupetro.
2008 2009 2010 2011 2012 2013 2014 2015 2016 2017
Liquids of natural gas Petroleum
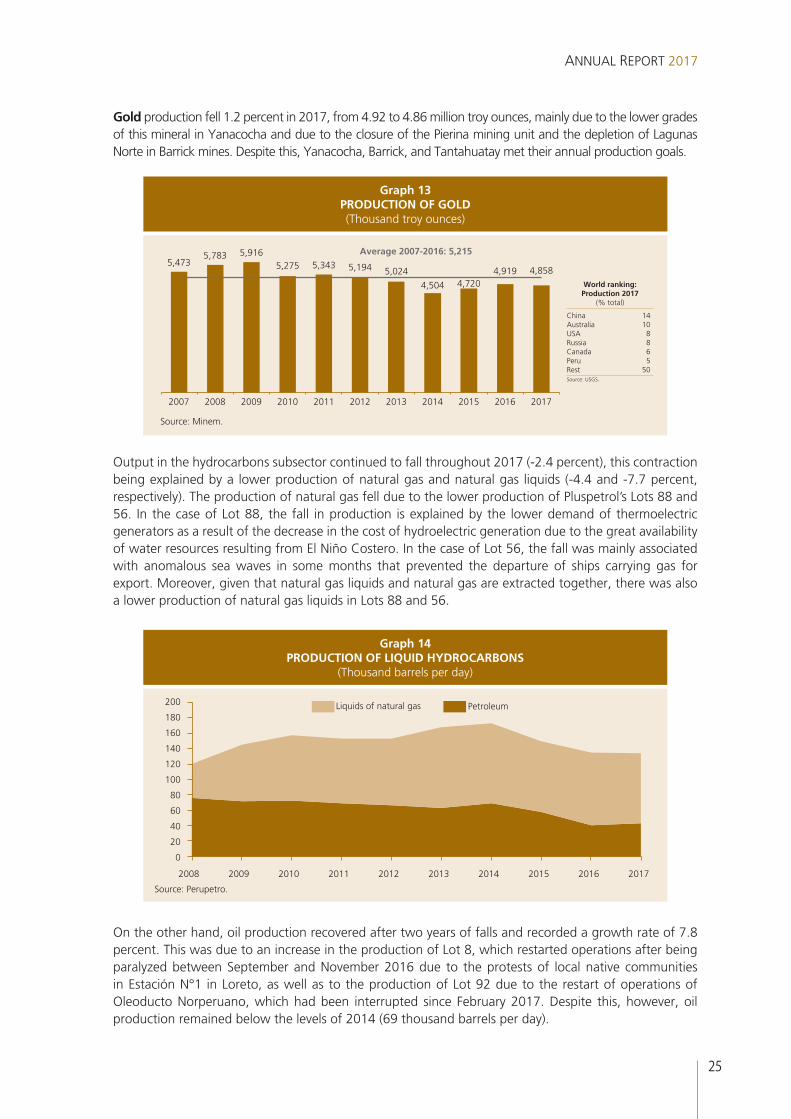
Output in the hydrocarbons subsector continued to fall throughout 2017 (-2.4 percent), this contraction being explained by a lower production of natural gas and natural gas liquids (-4.4 and -7.7 percent, respectively). The production of natural gas fell due to the lower production of Pluspetrol’s Lots 88 and 56. In the case of Lot 88, the fall in production is explained by the lower demand of thermoelectric generators as a result of the decrease in the cost of hydroelectric generation due to the great availability of water resources resulting from El Niño Costero. In the case of Lot 56, the fall was mainly associated with anomalous sea waves in some months that prevented the departure of ships carrying gas for export. Moreover, given that natural gas liquids and natural gas are extracted together, there was also a lower production of natural gas liquids in Lots 88 and 56.
On the other hand, oil production recovered after two years of falls and recorded a growth rate of 7.8 percent. This was due to an increase in the production of Lot 8, which restarted operations after being paralyzed between September and November 2016 due to the protests of local native communities in Estación N°1 in Loreto, as well as to the production of Lot 92 due to the restart of operations of Oleoducto Norperuano, which had been interrupted since February 2017. Despite this, however, oil production remained below the levels of 2014 (69 thousand barrels per day).
Gold production fell 1.2 percent in 2017, from 4.92 to 4.86 million troy ounces, mainly due to the lower grades of this mineral in Yanacocha and due to the closure of the Pierina mining unit and the depletion of Lagunas Norte in Barrick mines. Despite this, Yanacocha, Barrick, and Tantahuatay met their annual production goals.

26
CENTRAL RESERVE BANK OF PERU
Graph 15PRODUCTION OF NATURAL GAS
(Million cubic feet per day)
1,600
1,400
1,200
1,000
800
600
400
200
0
Source: Perupetro.
RestLot 56Lot 88
2008 2009 2010 2011 2012 2013 2014 2015 2016 2017
2.4 Manufacturing Sector
Manufacturing in 2017 decreased by 0.3 percent due to the lower activity of non-primary manufacturing, which registered a fall of 0.9 percent. This is explained by the slowdown of activity in the export-oriented textile industry and industry producing inputs and capital goods for the domestic market.
The manufacturing branches engaged in the processing of raw materials grew 1.9 percent. This rate reflected the greater production of the fishing industry, mainly the processing of fishmeal and fish oil associated with the greater availability of anchovy, as well as increased oil refining, particularly in the La Pampilla refinery, which increased its installed capacity from 95 MBD to 117 MBD and reduced its sulfur levels.
Conversely, the refining of non-ferrous metals decreased, especially in the case of copper cathodes from Cerro Verde due to the lower availability of copper oxides, and in the case of refined zinc from the Cajamarquilla Refinery, which paralyzed its operations due to El Niño event. Furthermore, the production of piled rice decreased due to a lower agricultural supply, while the production of sugar declined due to the lower yield of sugarcane, since the production of both rice and sugar was affected by El Niño.
Average
2015 2016 2017 2008-2017
Manufacturing based on raw materials 1.8 -0.6 1.9 0.3 Rice 8.8 0.5 -3.9 2.3Sugar -9.6 5.1 -5.6 1.7Meat products 5.8 4.4 2.7 4.8Fishmeal and fish oil 53.0 -19.3 15.7 -6.3Canned and frozen fish products -17.4 -6.1 0.3 -0.2Refining of non-ferrous metal -5.5 1.3 -2.7 -1.6Refining of crude 0.4 5.3 8.3 4.7
Source: Ministerio de la Producción and INEI.
Table 11MANUFACTURING BASED ON RAW MATERIALS
(Real % change)

27
ANNUAL REPORT 2017
Output in non-primary manufacturing decreased 0.9 percent, as a result of which this subsector records four consecutive years of decline. In the first half of 2017, the industry was affected by El Niño, which caused problems in the areas of transport, supply of inputs, and labor shortages due to the closure of roads and bridges as well as due to the damage caused to factories’ infrastructure and machinery.
Output in the branches engaged in the production of mass consumption goods grew 0.2 percent, the increase in the production of footwear, various food products, and other paper and cardboard items standing out. On the other hand, the production of toilet and cleaning products decreased because one of main companies in the sector transferred its operations to Colombia, while the production of dairy products declined, affected in the first months of the year by the El Niño Costero and by lower demand for some products of this category.
Production in the branches related to exports fell 1.9 percent due to the lower production of clothing, and yarn, fabrics and finishes due to lower demand in the first half of the year. The production of canned foods, particularly asparagus, also decreased, affected by logistical problems caused by El Niño Costero as well as by lower external demand. It is worth mentioning that in the case of the textile industry, external demand recovered in the last months of the year due to orders for new products in niche markets and due to requests from new customers.
In the branches related to inputs, the output decreased 3.2 percent due to the lower production of the wood industry, affected also by El Niño event. In addition, editing and printing activities and the production of chemical products were also lower due to lower external demand. In contrast, however, after two years of decline, the plastics industry showed an increase due to the recovery of domestic demand associated with sanitation and construction projects.
Output in the investment-oriented branches decreased 0.4 percent. This was particularly noteworthy in the production of electrical machinery due to a lower demand for transformers, electrical panels, and electrical wires and cables, the production of these goods being affected by competition of imported products. In the case of metallic products, the decline was generated by the agro-export sector’s lower demand for metal containers and by a lower demand for construction materials, especially ceramic floors and ready-mix concrete.
Graph 16NON-PRIMARY MANUFACTURING
(Real % change)
Source: INEI and PRODUCE.
2016 2017
-1.6-0.9
2008
8.6
Average 2008 - 2017: 4.1
2009
-6.1
2010
16.2
2011
6.5
2012
4.3
2013
3.7
2014 2015
-1.5-2.6

28
CENTRAL RESERVE BANK OF PERU
Average
2015 2016 2017 2008-2017
Mass consumption goods 0.2 1.5 0.2 3.1 Dairy products 3.1 -4.6 -4.9 2.9 Bakery 1.2 -4.6 3.1 0.8 Oils and fats 4.5 2.3 6.5 4.1 Miscellaneous food products -8.0 -6.2 14.7 4.2 Beer and malt -0.4 -0.8 0.0 2.6 Soft drinks 9.1 7.2 -3.9 6.2 Clothing -8.7 -4.2 -4.3 -2.2 Shoes 3.0 4.1 16.2 7.3 Furnitures 7.8 5.7 -5.1 7.3 Other paper and cardboard items 12.5 1.6 12.7 7.9 Toiletries and cleaning products -1.9 9.8 -14.9 2.6 Pharmaceutical products -20.4 10.1 -8.0 -2.5 Miscellaneous items -6.0 -9.9 15.0 -0.9
Goods for external markets -6.3 -4.2 -1.9 -1.5 Canned food -4.2 4.1 -2.9 3.3 Synthetic fibers -10.5 -4.0 0.9 -3.1 Yarns, fabrics and finished garments -5.1 -7.7 -1.6 -2.6 Knitted garments -5.9 -10.2 4.1 -3.4 Clothing items -8.7 -4.2 -4.3 -2.2 Inputs -4.4 -0.7 -3.2 1.6 Wheat flour 0.6 -4.4 0.6 1.3 Othe textil items -7.0 -1.0 8.9 -1.7 Woods -11.0 -4.4 -32.0 -8.7 Paper and cardboard -16.6 -5.5 -7.3 0.0 Paper and cardboard containers 1.4 7.4 7.9 4.9 Publishing and printing -17.9 2.5 -16.6 0.3 Basic chemicals 0.9 -6.4 5.3 1.4 Explosives, chemical and natural scents 19.6 3.9 -3.7 7.9 Rubber -5.2 -10.5 6.6 -2.0 Plastic -1.7 -0.8 1.3 4.7 Glass 0.2 9.5 2.3 10.1 Capital goods -3.6 -5.1 -0.4 4.8 Iron and steel industry -3.6 2.2 4.5 0.7 Metallic products 2.8 -10.2 -3.8 6.6 Machinery and equipment -7.3 -9.2 22.8 2.2 Electric machinery -30.5 15.6 -5.2 -1.0 Transport equipment -7.1 -16.2 -5.6 5.7 Paints, varnishes and lacquers -2.4 -9.1 5.3 4.8 Cement -1.9 1.5 0.7 5.5 Construction materials -3.1 -5.4 -3.0 4.1 Industrial services -7.0 -2.6 -4.5 7.9 Total non-primary manufacturing -2.6 -1.6 -0.9 2.5
Source:Ministry of Production.
Table 12GROWTH OF NON-PRIMARY MANUFACTURING BY TYPE OF GOODS
(Real % change)
2.5 Construction Sector
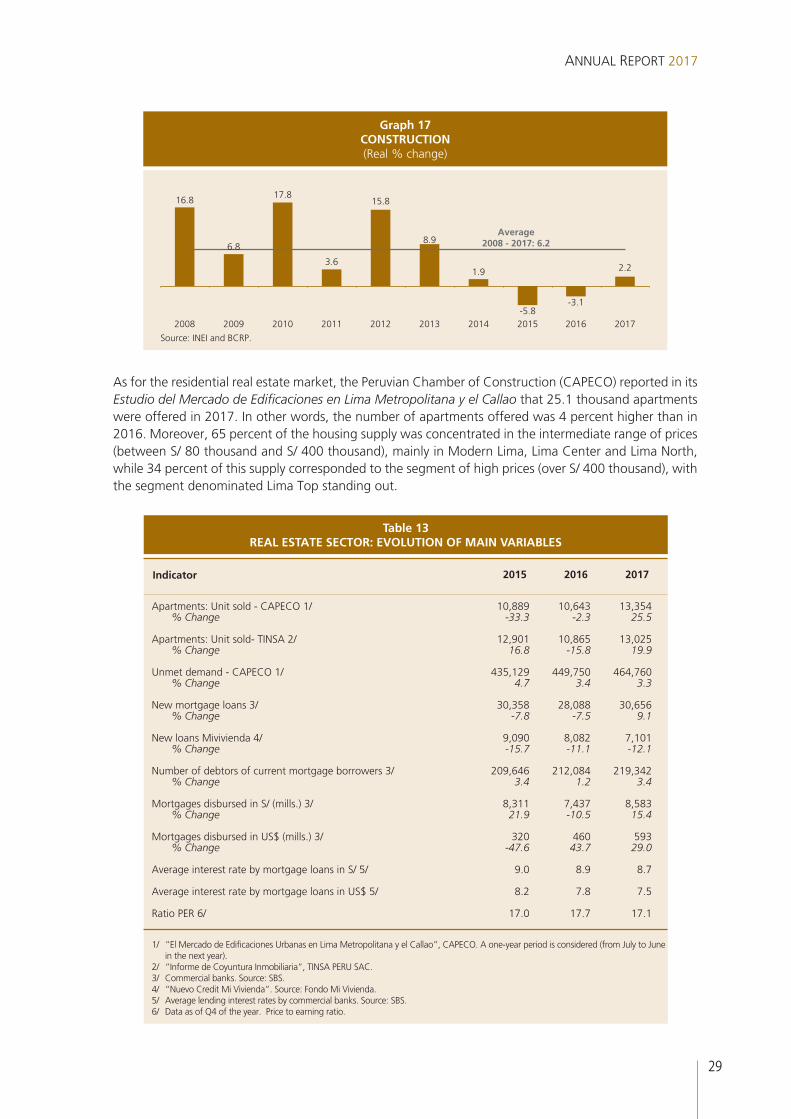
After showing falls in the previous two years, the construction sector grew 2.2 percent in 2017. Investment recovered in the second half of the year, after being affected by a slowdown in the pace of public spending and by the effects of El Niño Costero in the first half of the year. The recovery of investment in the second half of the year was reflected in a higher consumption of cement for real estate, commercial and business center projects, as well as in an acceleration in the progress of public works, both at the levels of the national government and the subnational governments. The implementation of public works showed an increase of 7.5 percent in the year (14.2 percent in the second semester), while the domestic consumption of cement increased 0.3 percent during the year (4.4 percent in the second half of the year).
29
ANNUAL REPORT 2017
As for the residential real estate market, the Peruvian Chamber of Construction (CAPECO) reported in its Estudio del Mercado de Edificaciones en Lima Metropolitana y el Callao that 25.1 thousand apartments were offered in 2017. In other words, the number of apartments offered was 4 percent higher than in 2016. Moreover, 65 percent of the housing supply was concentrated in the intermediate range of prices (between S/ 80 thousand and S/ 400 thousand), mainly in Modern Lima, Lima Center and Lima North, while 34 percent of this supply corresponded to the segment of high prices (over S/ 400 thousand), with the segment denominated Lima Top standing out.
Average 2008 - 2017: 6.2
Graph 17CONSTRUCTION(Real % change)
Source: INEI and BCRP.
2016
-3.1
2008
16.8
2009
6.8
2010
17.8
2011
3.6
2012
15.8
2013
8.9
2014 20172015
1.9 2.2
-5.8
Indicator
2015 2016 2017
Apartments: Unit sold - CAPECO 1/ 10,889 10,643 13,354 % Change -33.3 -2.3 25.5
Apartments: Unit sold- TINSA 2/ 12,901 10,865 13,025 % Change 16.8 -15.8 19.9
Unmet demand - CAPECO 1/ 435,129 449,750 464,760 % Change 4.7 3.4 3.3 New mortgage loans 3/ 30,358 28,088 30,656 % Change -7.8 -7.5 9.1 New loans Mivivienda 4/ 9,090 8,082 7,101 % Change -15.7 -11.1 -12.1 Number of debtors of current mortgage borrowers 3/ 209,646 212,084 219,342 % Change 3.4 1.2 3.4 Mortgages disbursed in S/ (mills.) 3/ 8,311 7,437 8,583 % Change 21.9 -10.5 15.4 Mortgages disbursed in US$ (mills.) 3/ 320 460 593 % Change -47.6 43.7 29.0 Average interest rate by mortgage loans in S/ 5/ 9.0 8.9 8.7 Average interest rate by mortgage loans in US$ 5/ 8.2 7.8 7.5
Ratio PER 6/ 17.0 17.7 17.1
1/ “El Mercado de Edificaciones Urbanas en Lima Metropolitana y el Callao”, CAPECO. A one-year period is considered (from July to June in the next year).
2/ “Informe de Coyuntura Inmobiliaria”, TINSA PERU SAC.3/ Commercial banks. Source: SBS.4/ “Nuevo Credit Mi Vivienda”. Source: Fondo Mi Vivienda.5/ Average lending interest rates by commercial banks. Source: SBS.6/ Data as of Q4 of the year. Price to earning ratio.
Table 13REAL ESTATE SECTOR: EVOLUTION OF MAIN VARIABLES
30
CENTRAL RESERVE BANK OF PERU
A total of 13,354 apartments were sold in 2017. Moreover, 68 percent of these apartments were in the process of construction, which reflects the advanced sale of apartments on blueprints or during the construction process. Furthermore, 63 percent of the homes sold were in an intermediate price range (between S/ 80 thousand and S/ 400 thousand), while 36 percent were in a range of high prices (over S/ 400 thousand).
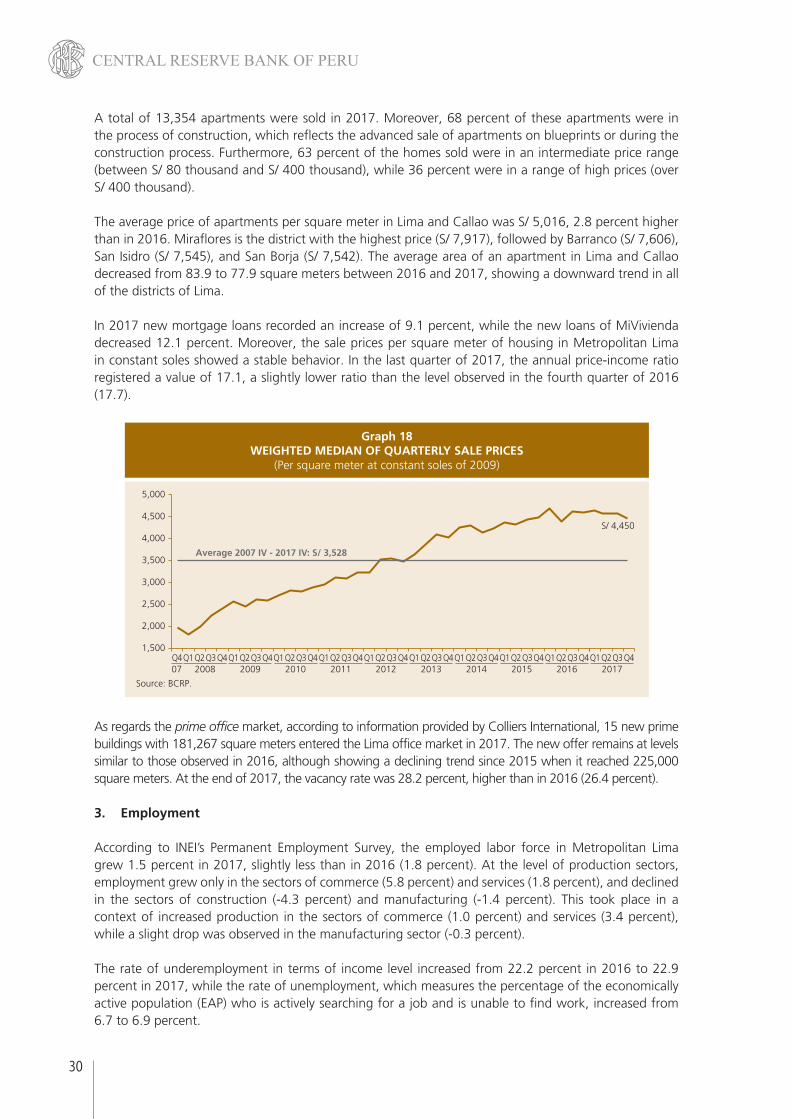
The average price of apartments per square meter in Lima and Callao was S/ 5,016, 2.8 percent higher than in 2016. Miraflores is the district with the highest price (S/ 7,917), followed by Barranco (S/ 7,606), San Isidro (S/ 7,545), and San Borja (S/ 7,542). The average area of an apartment in Lima and Callao decreased from 83.9 to 77.9 square meters between 2016 and 2017, showing a downward trend in all of the districts of Lima.
In 2017 new mortgage loans recorded an increase of 9.1 percent, while the new loans of MiVivienda decreased 12.1 percent. Moreover, the sale prices per square meter of housing in Metropolitan Lima in constant soles showed a stable behavior. In the last quarter of 2017, the annual price-income ratio registered a value of 17.1, a slightly lower ratio than the level observed in the fourth quarter of 2016 (17.7).
Graph 18WEIGHTED MEDIAN OF QUARTERLY SALE PRICES
(Per square meter at constant soles of 2009)
5,000
4,500
4,000
3,500
3,000
2,500
2,000
1,500
Source: BCRP.
Q4 Q4 Q4 Q4 Q4 Q4 Q4 Q4 Q4 Q4 Q4Q2 Q2 Q2 Q2 Q2 Q2 Q2 Q2 Q2 Q2Q1 Q1 Q1 Q1 Q1 Q1 Q1 Q1 Q1 Q1Q3 Q3 Q3 Q3 Q3 Q3 Q3 Q3 Q3 Q3
S/ 4,450
Average 2007 IV - 2017 IV: S/ 3,528
200807 2010 2012 2014 2016 20172009 2011 2013 2015
As regards the prime office market, according to information provided by Colliers International, 15 new prime buildings with 181,267 square meters entered the Lima office market in 2017. The new offer remains at levels similar to those observed in 2016, although showing a declining trend since 2015 when it reached 225,000 square meters. At the end of 2017, the vacancy rate was 28.2 percent, higher than in 2016 (26.4 percent).
3. Employment
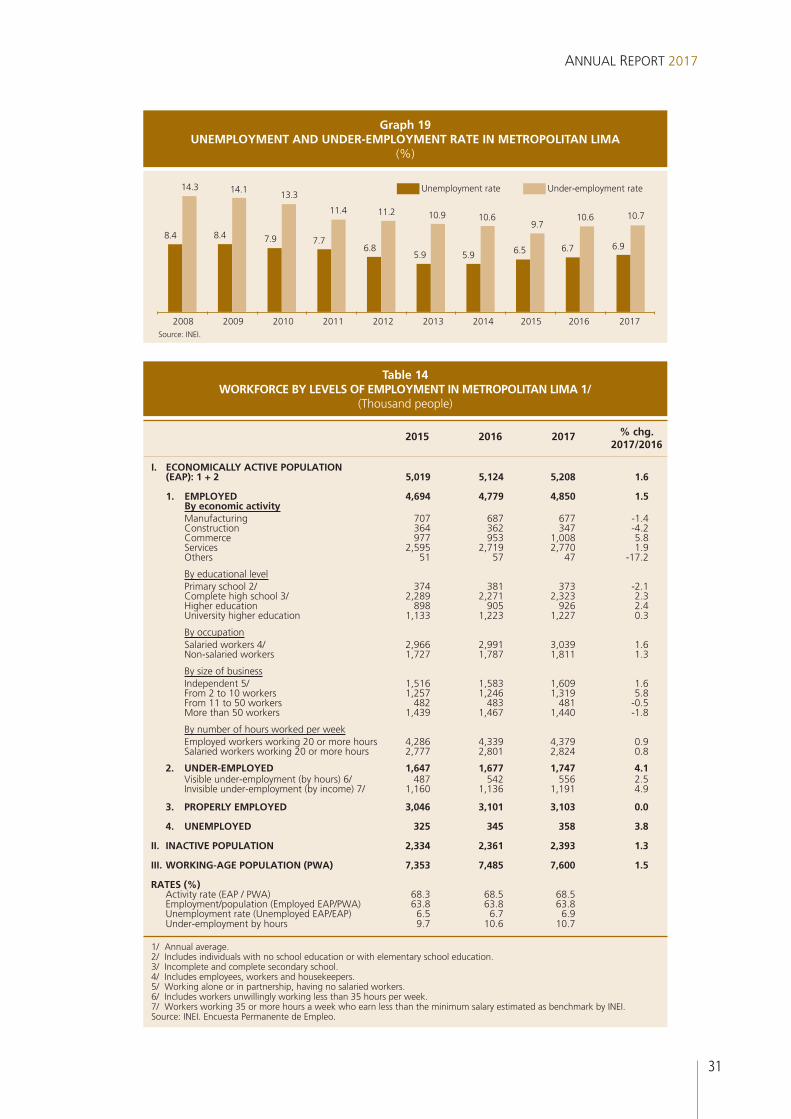
According to INEI’s Permanent Employment Survey, the employed labor force in Metropolitan Lima grew 1.5 percent in 2017, slightly less than in 2016 (1.8 percent). At the level of production sectors, employment grew only in the sectors of commerce (5.8 percent) and services (1.8 percent), and declined in the sectors of construction (-4.3 percent) and manufacturing (-1.4 percent). This took place in a context of increased production in the sectors of commerce (1.0 percent) and services (3.4 percent), while a slight drop was observed in the manufacturing sector (-0.3 percent).
The rate of underemployment in terms of income level increased from 22.2 percent in 2016 to 22.9 percent in 2017, while the rate of unemployment, which measures the percentage of the economically active population (EAP) who is actively searching for a job and is unable to find work, increased from 6.7 to 6.9 percent.
31
ANNUAL REPORT 2017
% chg.
2015 2016 2017 2017/2016
I. ECONOMICALLY ACTIVE POPULATION (EAP): 1 + 2 5,019 5,124 5,208 1.6 1. EMPLOYED 4,694 4,779 4,850 1.5 By economic activity Manufacturing 707 687 677 -1.4 Construction 364 362 347 -4.2 Commerce 977 953 1,008 5.8 Services 2,595 2,719 2,770 1.9 Others 51 57 47 -17.2 By educational level Primary school 2/ 374 381 373 -2.1 Complete high school 3/ 2,289 2,271 2,323 2.3 Higher education 898 905 926 2.4 University higher education 1,133 1,223 1,227 0.3 By occupation Salaried workers 4/ 2,966 2,991 3,039 1.6 Non-salaried workers 1,727 1,787 1,811 1.3 By size of business Independent 5/ 1,516 1,583 1,609 1.6 From 2 to 10 workers 1,257 1,246 1,319 5.8 From 11 to 50 workers 482 483 481 -0.5 More than 50 workers 1,439 1,467 1,440 -1.8 By number of hours worked per week Employed workers working 20 or more hours 4,286 4,339 4,379 0.9 Salaried workers working 20 or more hours 2,777 2,801 2,824 0.8 2. UNDER-EMPLOYED 1,647 1,677 1,747 4.1 Visible under-employment (by hours) 6/ 487 542 556 2.5 Invisible under-employment (by income) 7/ 1,160 1,136 1,191 4.9 3. PROPERLY EMPLOYED 3,046 3,101 3,103 0.0 4. UNEMPLOYED 325 345 358 3.8 II. INACTIVE POPULATION 2,334 2,361 2,393 1.3 III. WORKING-AGE POPULATION (PWA) 7,353 7,485 7,600 1.5 RATES (%) Activity rate (EAP / PWA) 68.3 68.5 68.5 Employment/population (Employed EAP/PWA) 63.8 63.8 63.8 Unemployment rate (Unemployed EAP/EAP) 6.5 6.7 6.9 Under-employment by hours 9.7 10.6 10.7
1/ Annual average.2/ Includes individuals with no school education or with elementary school education.3/ Incomplete and complete secondary school.4/ Includes employees, workers and housekeepers.5/ Working alone or in partnership, having no salaried workers.6/ Includes workers unwillingly working less than 35 hours per week.7/ Workers working 35 or more hours a week who earn less than the minimum salary estimated as benchmark by INEI.Source: INEI. Encuesta Permanente de Empleo.
Table 14WORKFORCE BY LEVELS OF EMPLOYMENT IN METROPOLITAN LIMA 1/
(Thousand people)
Graph 19UNEMPLOYMENT AND UNDER-EMPLOYMENT RATE IN METROPOLITAN LIMA
(%)
2008 2009 2010 2011 2012 2013 2014 2015 2016 2017Source: INEI.
Unemployment rate Under-employment rate14.3 14.113.3
11.4 11.2 10.9 10.69.7
10.6 10.7
5.9 6.5 6.7 6.95.9
6.87.77.98.48.4

32
CENTRAL RESERVE BANK OF PERU
Box 1IMPACT OF EL NIÑO COSTERO
In the first half of 2017 Peru was affected by an episode of El Niño, which was called El Niño Costero due to its characteristics. Unlike a typical El Niño event, which is caused by the displacement of warm Kelvin waves from the Central Pacific area and brings about an increase in the subsurface temperature of the sea, this event was caused by the displacement of waters from Ecuador towards the south and by atypical atmospheric conditions, which caused a sudden warm up in sea temperature. As a result, as from the second half of January, the surface temperature of the sea off the coast of Paita began to increase steadily and the anomalies –measured as the difference between the observed temperature and the historical average– recorded unusually high values. Although Peru has experienced very strong El Niño events recently (e.g. in 1982-83 and 1997-98), the occurrence of an event with the characteristics of El Niño Costero is infrequent: the last time the country experienced a similar event was in 1925.
El Niño Costero generated significant impacts on production. In non-primary sectors such as manufacturing, construction and transport services, the impact was widespread and stronger, while in the primary sectors, the impact was specific for some agricultural products and the production chain of some mines was affected.
In the sector of agriculture, the most affected crops were lemons, bananas, sugar cane, rice, and grapes. These crops faced not only immediate problems, such as the flooding of the fields, but also effects on their yields throughout the year as a result of a permanent loss of cultivation hectares. In the case of lemon, the excess of rain affected its ripening process and the quality of the crop, and the recovery process thereafter was slower than expected. In the case of bananas, El Niño caused difficulties and damages that affected the processes of harvesting and transportation towards the packing centers, which affected mainly the exports of organic bananas. Moreover, sugarcane crops were damaged by the flooding of the fields, which affected harvesting, as well as by the subsequent greening of the cane due to excessive rains, which hindered the cutting and burning of sugarcane for its processing. Finally, the yields of some agricultural exports, i.e. grapes and paprika, were affected by pests associated with excess humidity and high temperatures.
The impact of El Niño Costero in the fishing sector was mitigated by the short duration of the event and also because the warming of marine temperatures affected the superficial waters and not the subsurface waters, which are the ones that have a direct effect on anchovy.
In the mining sector, El Niño Costero caused (i) a loss of connectivity due to the disruption of roads and railroad tracks, and (ii) problems in carrying out the process of mineral concentration due to rain and fog. The flow of shipments from the mines of the central region to the port of Callao was interrupted by the damage caused in several sections of the Central Highway as well as by interruption of train shipments using the central railway. Despite this, there was no significant impact on production since mining companies had accumulated mineral inventories, but the exports of companies that did not have inventories in the port of Callao declined. For example, Volcan had to suspend temporarily the delivery of concentrates to its customers by invoking the force majeure clause in its contracts. The closure of the main access roads to the center of the country not only affected the shipment of finished products, but also constrained the entry of inputs necessary for the production process. For instance, some companies that transport minerals to their concentrationr plants using dump trucks reported that they reduced the rate of preparation of concentrates due to the problems they faced (haze and road problems). This lower mining production also generated a lower consumption of electricity.
Like mining, manufacturing production was affected by (i) the closing of roads used to transport inputs and finished products, (ii) the damage caused to factories; and (iii) lower demand. In the case of primary manufacturing, production decreased in the first half of the year as a result of the temporary closure of the Cajamarquilla refinery (Huachipa), which refines zinc and cadmium. On the other hand, non-primary manufacturing reported lower production of dairy products, food products, beverages, miscellaneous manufacturing products, paper and cardboard products, iron and steel, and printing activities. It is worth mentioning that Lima concentrates 61 percent of the national manufacturing production, while the regions in the North account only for 13 percent of this production. Moreover, in no case was the effect permanent and companies in these branches recovered in the second half of the year.

33
ANNUAL REPORT 2017
On the other hand, even though growth in the construction sector was affected due to the lower demand for materials for self-construction projects and to the difficulties faced to deliver construction material, cement plants did not stop operating. The fall in activity in this sector affected other companies, such as construction materials and related services.
The North Coast region was the region most affected by El Niño Costero. A significant part of its road infrastructure collapsed, which had a strong negative impact on commercial activities and services in the departments of this region. Tumbes, Piura, Lambayeque, and La Libertad represent about 18 percent of the country’s total commerce and transportation services. The pace of recovery in these sectors has been lower due to the slower pace of recovery observed in terms of household income and due to delays in the reconstruction of road infrastructure.
El Niño Costero had a significant impact on infrastructure, damages concentrating in the north coast region of Peru, which accounts for around 20 percent of the country’s production. According to the Authority in charge of Reconstruction –Reconstrucción con Cambios (RCC)–, El Niño Costero affected 2,638 kilometers of road, 192 bridges, 7,095 kilometers of departmental roads, about 1,444 school buildings, and 45,613 homes.