product architecture assessment: a tool to link product ...faculty.babson.edu/sfixson/fixson 2005...
TRANSCRIPT
www.elsevier.com/locate/dsw
Journal of Operations Management 23 (2005) 345–369
Product architecture assessment: a tool to link product, process,
and supply chain design decisions
Sebastian K. Fixson*
University of Michigan, Industrial and Operations Engineering, 1205 Beal Avenue, IOE 2793, Ann Arbor, MI 48109, USA
Received 5 August 2003; received in revised form 31 March 2004; accepted 26 August 2004
Available online 30 November 2004
Abstract
Increasingly heterogeneous markets, together with shorter product life cycles, are forcing many companies to simultaneously
compete in the three domains of product, process, and supply chain. Dependencies among decisions across these domains make
this competitive situation very complex. To address this complexity, three-dimensional concurrent engineering (3D-CE) has
been suggested ([Fine, C.H., 1998. Clockspeed—Winning Industry Control in the Age of Temporary Advantage. Perseus Books,
Reading, MA.]). Applying 3D-CE requires an operationalization of one of its core elements: the product architecture. In this
paper, I develop a multi-dimensional framework that enables comprehensive product architecture assessments. The framework
builds on existing product characteristic concepts such as component commonality, product platforms, and product modularity.
The framework’s utility is illustrated with two example products, showing how individual product architecture dimensions link
decisions across different domains. This framework can be used to focus advice for product design on product architecture
dimensions that are critical for a given operational strategy, to assess advantages and limitations of operational strategies in
conjunction with given product architectures, or to develop dynamic capabilities such as planning effective product–operation
strategy combinations.
# 2004 Elsevier B.V. All rights reserved.
Keywords: Product architecture; Modularity; 3D-CE; Product–process–supply chain design
1. Introduction
For many manufacturing firms, heightened com-
petition throughout 1980s and 1990s has brought back
into focus the value of considering manufacturing
concerns during product design, and to overlap
formerly sequential design processes. Concurrent
* Tel.: +1 734 615 7259; fax: +1 734 764 3451.
E-mail address: [email protected].
0272-6963/$ – see front matter # 2004 Elsevier B.V. All rights reserved
doi:10.1016/j.jom.2004.08.006
engineering (CE), also called simultaneous engineer-
ing, experienced a steep growth in interest from both
industry and academia (Fleischer and Liker, 1997;
Nevins and Whitney, 1989). Over the last two decades
numerous facets of this approach have been
researched, ranging from design’s impact on ease of
manufacturing and assembly processes (Boothroyd
et al., 2002; Rusinko, 1999; Whitney, 1988), to the
implications for development lead time due to
concurrent development processes (Haddad, 1996;
.
S.K. Fixson / Journal of Operations Management 23 (2005) 345–369346
Koufteros et al., 2001; Roemer et al., 2000; Terwiesch
et al., 2002).
More recently, the competition has intensified for
many firms through increased demand heterogeneity
and shorter product life cycles. Formerly large mass
markets have fractured into smaller niche markets
demanding higher levels of product variety while
competitors are introducing new products in shorter
intervals. To respond to these pressures, many firms
have put customization of mass produced products at
the center of their attention. This development can be
observed for products ranging from sneakers with the
customer’s own name imprinted on them to custo-
mized beauty products to personalized food where, for
example, each customer picks the ingredients for his
cereal (Mirapaul, 2001). Similarly, the automobile
market shows increasing numbers of niches, as well as
increasing numbers of models in these niches, e.g.,
sports cars (The Economist Intelligence Unit, 2000a,
2000b). Furthermore, in addition to quality, variety,
and price, many products compete today on their level
of availability. Firms, such as computer maker Dell,
have built their entire business model initially not on
superior products but on customization and delivery
speed (Magretta, 1998).
For the idea of concurrent engineering, these
developments imply the need to enlarge its scope and
add supply chain considerations to the tasks to be
concurrently addressed. Fine (1998) named this
expansion ‘‘three-dimensional concurrent engineering
(3D-CE)’’. He argues that all three domains (product,
process, and supply chain) possess an architecture, and
matching these architectures is key to the success of
3D-CE. Others have introduced the term ‘‘concurrent
enterprising’’ to describe the future direction of mass
customization (Jiao et al., 2004). They describe it as
‘‘an approach to achieving an alliance of customers,
products, processes, and logistics by means of
parallelity, integration, standardization, teamwork,
and many others, for delivering an increasing product
variety to satisfy diverse customer needs while
maintaining near mass production efficiency’’ (Jiao
et al., 2004, p. 83). While these ideas are conceptually
very powerful, relatively little is known about how to
actually coordinate the many decisions across the
three domains of product, process, and supply chain.
This paper argues that the product architecture, when
properly defined and articulated, can serve as such a
coordination mechanism. Given that various indivi-
dual product characteristics have been identified as
having consequences – enabling or constraining – for
individual decisions in individual product life cycle
phases, it is argued that a comprehensive product
architecture assessment methodology can serve as the
nexus to link these decisions with each other.
The remainder of the paper is organized as follows.
The next section, starting with a working definition of
product architecture, presents two overviews. The first
discusses how individual product characteristics can
affect various decisions in each of the domains of
product, process, and supply chain; the second
presents three categories of product architecture
modeling and description approaches that exist in
the literature. Building on this foundation, Section
three develops a multi-dimensional product architec-
ture assessment framework for assembled hardware
products, and Section four illustrates the framework’s
coordination role with two example applications.
Section five presents insights on how the framework
can improve managerial decision-making, and con-
cludes with providing avenues for future research.
2. Product architecture: nominal definition and
utility in coordinating product, process, and
supply chain decisions
2.1. Nominal definition of product architecture
Ulrich defines the product architecture as ‘‘the
scheme by which the function of a product is allocated
to physical components’’ (Ulrich, 1995, p. 419). With
complex mechanical and electromechanical products
(automobiles, appliances, etc.), which usually consist
of a substantial number of components, the product
architecture encompasses the information on how
many components the product consist of, how these
components work together, how they are built and
assembled, how they are used, and how they are
disassembled. As such, the product architecture serves
the purpose of defining ‘‘. . . the basic physical
building blocks of the product in terms of what they
do and what their interfaces are to the rest of the
device’’ (Ulrich and Eppinger, 2000, p. 182). To
summarize, the product architecture can be nominally
defined as a comprehensive description of a bundle of
S.K. Fixson / Journal of Operations Management 23 (2005) 345–369 347
product characteristics, including number and type of
components, and number and type of interfaces
between those components, and, as such, represents
the fundamental structure of the product.
2.2. Some effects of product architecture
characteristics on product design, process design,
and supply chain design decisions
To move a product from the initial idea to its arrival
at the customer requires many decisions on design and
operation of numerous processes in the three domains
of product, process, and supply chain. These decisions
are of strategic and operational nature, and many of
these decisions are constrained, or enabled, by product
characteristics such as the number and complexity of
components, component commonality, or product
modularity (Fig. 1).
In the product (development) domain, decisions
with rather long-term horizons range from capability
development of design engineers to the selection of
locations for development facilities to the formation of
strategic development alliances. On the project level,
product related decisions comprise questions of
product functionality, product line variety, material
choices, and product styling (Pahl and Beitz, 1996).
Organizational decisions include the number and size
of project teams, whether these teams are cross-
functional, methods to steer team group processes, and
tools to plan product development milestones,
sequences, and the degree of overlap (Brown and
Eisenhardt, 1995). Individual product characteristics
have been found to affect many of these decisions. The
number, size, and composition of project teams, for
example, are in most cases not independent of the
number, size, and composition of the product’s
components. It has been found that the organizational
structures of product development units tend to mirror
the product structures of the products they develop
(Gulati and Eppinger, 1996; von Hippel, 1990). This
phenomenon has been identified as beneficial in stable
industries (Sanchez and Mahoney, 1996) and detri-
mental in dynamic industries (Chesbrough and
Kusunoki, 1999; Henderson and Clark, 1990). In
either case, the structure that is initially selected for
the product will affect the task structure of the product
development organization, and the task structure, in
turn, contributes to the organization’s performance
(Eppinger et al., 1994). The underlying reason is that
the task structure determines the interaction and
communication patterns of the development teams.
For example, high levels of product complexity are
usually detrimental to fast product development
because they translate into complex process interac-
tions which in turn increases the number of iterations
in the development process (Ahmadi et al., 2001;
Terwiesch et al., 2002). Reducing product complexity,
for instance by regrouping components into fewer
modules, has been identified as a way to shorten
product development time (Griffin, 1997). For multi-
ple projects, both development cost and time can be
lowered if components can be reused across product
families (Clark and Fujimoto, 1991; Nobeoka and
Cusumano, 1995; Reinertsen, 1997). Similarly, the
extent to which decision makers in product develop-
ment can choose to overlap the development activities
is influenced by the degree to which the relations
between the components hinder or promote the
reduction of process iterations. For example, lowering
the degree of interaction between components has
been found to positively affect development time
(Loch et al., 2003; Thomke, 1997; Yassine et al.,
2003).
Decisions on the strategic level in the process
domain typically affect large-scale production invest-
ments; examples for these decisions are the size of
production capacity, the type of manufacturing
processes, or the locations of production facilities.
On the tactical level, examples of relevant decisions
include the scheduling of production, the organization
of teams, and the planning of maintenance. A major
class of decisions in the process domain is the
selection of number and type of processes that will be
used to manufacture the product. These decisions are
not independent of product architecture characteristics
such as complexity of the individual components,
number of components, extent to which components
can be reused across product families, or degree of
coupling between components. High levels of part
complexity, for example, have been found to require
complex manufacturing processes which result in
relatively higher production costs compared to simpler
parts that require simpler processes (Banker et al.,
1990). For this reason, design for manufacturability
(DFM) calls for part simplification, which allow
process simplification that results in higher yields and

S.K. Fixson / Journal of Operations Management 23 (2005) 345–369348
Fig. 1. Product characteristics impacting (constraining and enabling) design decisions in product, process, and supply chain domain.
lower costs. At the same time, part count has been
identified as a major cost driver in assembly (Boer and
Logendran, 1999). The explanation for this effect is
simple: fewer parts require fewer assembly operations,
which saves time and cost. Consequently, design for
assembly (DFA) aims for part count reduction
(Boothroyd et al., 2002). The total cost effect of
product characteristics proposed by DFM and DFA
depends on the specific circumstances. For example,
for cellular network base stations, it has been found
that a reduction of the number of physical modules has
led to a reduction in operation (manufacturing) costs
(Kaski and Heikkila, 2002). If components can be
reused across product families or multiple product
generations (commonality), scale effects can reduce
the cost per unit by distributing the fixed cost portions
across larger volumes. This effect has been identified
for mopeds, custom-phones, and microwave ovens
(Salvador et al., 2002). The magnitude of these
savings, however, needs to be compared to the cost for
potential ‘overdesign’ of the component for some of
the products in the product family. Products whose
production costs are dominated by variable materials
costs, such as automotive wire harnesses, may not gain
much through the use of commonality (Thonemann
and Brandeau, 2000).
Interfaces between components that are only
loosely coupled tend to minimize complexity and
uncertainty within the production process. Hence, the
better the process is known and the more likely it can
be performed successfully, and the lower the total
number of different processes in the production
system is, the lower the expected production costs.
For example, electronic interfaces that consist only of
S.K. Fixson / Journal of Operations Management 23 (2005) 345–369 349
a plug and a socket may be easier to assemble error-
free than a complex mechanical rod connection. In
addition, the testability of pre-assembled units, and
their costs, can be affected by the interfaces between
them.
In the supply chain domain, decisions of strategic
nature include number and location of logistics
facilities, contractual relations with suppliers, long-
term sourcing arrangements, and postponement and
mass customization strategies. Examples for opera-
tional decisions relate to service levels, delivery
schedules (e.g., just-in-time), vehicle routing, and
crew planning. Individual product architecture char-
acteristics that have been identified to affect these
decisions are the degree of commonality across
components, the way in which the components
interact with each other, and the type of the interfaces
between the components. For example, the decisions
on number and location of suppliers, on the service
level, and on delivery frequencies are all impacted by
the number and type of components a product consists
of. The use of common components allows inventory
levels to be lowered through risk pooling (Baker et al.,
1986; Collier, 1982; Gerchak et al., 1988). To take
advantage of this effect requires an understanding of
which function of a product will be provided by which
component and the development of an allocation plan.
The goal to increase a supplier’s incentive to deliver
high quality components can be supported by
designing components whose functions can be traced
individually in the end-product (Baiman et al., 2001).
However, the independence of components can also
result in shifts of bargaining power between supply
chain partners and thus change their competitive
positions (Doran, 2003; van Hoek and Weken, 1998).
Depending on the industry, the level of component
independence can also affect a firm’s sourcing
strategy: outsourcing commodity items and keeping
components of strategic relevance in-house (Momme
et al., 2000).
The type of interfaces between components can
affect the extent to which strategies for postponement
and late customization can be realized. Maximizing
the benefits from a postponement strategy may require
a re-sequencing of processes (Feitzinger and Lee,
1997; Lee and Tang, 1998). However, some interface
qualities together with some manufacturing processes
may make an operation reversal impossible. For
example, if a metal welding process is used after paint
is applied to the product, the welding is likely to
destroy the paint.
2.3. Product architecture models and descriptions in
the literature
To analyze the many effects that individual product
architecture characteristics exert on different deci-
sions across the domains of product, process, and
supply chain, a variety of different models and
descriptions have been developed. Without claiming
exhaustive representation, I organize below the
existing models into three categories and present
their advantages and limitations.
The first category can be labeled mathematical
models. These models often simplify the product
architecture in order to be able to focus on the effect of
interest. For example, to explore the advantages and
disadvantages of platform-based product develop-
ment, each product of a product family is assumed to
consist of a common component, i.e. the platform, and
a product-specific component (Krishnan and Gupta,
2001). The core of this model analyzes the effects of
this choice compared to two independent products,
given different degrees of market diversity and non-
platform economies of scale. Similarly, modeling the
quality impact of function traceability, Baiman et al.
(2001) distinguish between only two cases: one where
component and functions are in a one-to-one relation-
ship (decoupled) and one where they are not
(coupled). Other models incorporate a larger number
of components and focus on the effects of the
interactions among them on product development by
assigning probabilities for rework due to overlapping
processes (Ahmadi et al., 2001). The optimization
model’s objective then is to minimize the time
consumed by the iterations. In fact, a variety of
optimization models have been developed to optimize
the platform choice, either following a module-based
strategy or a scale-based strategy (Simpson, 2003).
Most of these models view the product family design
problem as optimizing the tradeoff between common-
ality and distinctiveness (Desai et al., 2001; Krishnan
and Gupta, 2001), while some pursue an optimization
of the supply chain by rearranging process sequences
(Garg, 1999). The advantage of these mathematical
models is their computational elegance as well as their
S.K. Fixson / Journal of Operations Management 23 (2005) 345–369350
broad applicability (across industries and across
products). At the same time, however, their generic
nature makes it often difficult to translate the findings
into specific advice for the product architecture
design.
Models in the second category, which I call
conceptual models, are strongly influenced by
research work on product modularity. This category
can be further separated into two subsets. Work in the
first subset is based on the description of product
modularity by Ulrich and Tung (1991). Ulrich and
Tung described five different types of modularity:
component-swapping, component-sharing, fabricate-
to-fit, bus, and sectional. Ulrich later collapsed the first
three types into one and called it slot architecture
(Ulrich, 1995; Ulrich and Eppinger, 2000). Others
have subsequently renamed the fabricate-to-fit as cut-
to-fit and added mix modularity, the latter to include
processed products (Pine, 1993). More recently,
Salvador et al. (2002) added combinatorial modularity
as a specific form of slot modularity. The second
subset in this category focuses more on understanding
the system effects and the characteristics that such a
system exhibits, as opposed to providing detailed
descriptions of the components. Some authors focus
on the effects a modular product can have on the
structure of an industry (Langlois and Robertson,
1992) or on a firm’s organization (Sanchez and
Mahoney, 1996). Others concentrate on a system’s
ability to accept upgrades and re-use (Garud and
Kumaraswamy, 1996), or on the forces that drive a
system towards (e.g., demand heterogeneity) or away
from (e.g., synergistic specificity) higher levels of
modularity (Schilling, 2000). Placing their emphasis
on the nature and role of the interfaces, instead of the
components, Baldwin and Clark (2000) present in
their extensive work the mechanisms by which an
architecture changes. They develop six ‘operators’ to
describe the evolution from one product architecture
to another: splitting a design into modules, substitut-
ing one module for another, augmenting—adding a
new module to the design, excluding a module from
the design, inverting to create new design rules, and
porting a module to another design. While concep-
tually very powerful, the modularity descriptions in
the conceptual category have been difficult to test
empirically. A major reason for this problem is that
modularity definitions come in different flavors. They
range from describing different product architectures
by changing a single parameter of a component, to re-
arranging components into new combinations, to
entirely reassigning functions to different components
(Fixson, 2003). The few empirical studies that exist
measure product modularity indirectly by asking
company employees to assess the degree to which
their customers can individually change the design
(Duray et al., 2000), to estimate the degree to which
products ‘share common modules’ or ‘can be
reassembled in different forms’ (Tu et al., 2004), or
to approximate the degree of independence between
components in the event of a design change to one of
the components (Worren et al., 2002).
The models in the third category fall under
engineering models. These models are typically more
applied than those of the previous two categories.
Most models provide indices to compare product
architectures along the dimensions of interest. For
example, one model presents two indices, one – the
generational variety index – reflecting the amount of
redesign effort required for future product generations,
the other – the coupling index – indicating the
coupling between product components (Martin and
Ishii, 2002). The indices are based on qualitative
assessments of the speed of technology development
and the strength of the linkages between components,
respectively. Others have developed indices to assess
the compatibility of components in a module with
respect to their material (Allen and Carlson-Skalak,
1998; Newcomb et al., 1998), product function
(Huang and Kusiak, 1998), or manufacturing pro-
cesses (Kota et al., 2000). Some of these models
employ variations of a design structure matrix
(Steward, 1981), which lists in its top row and first
column the product’s components. Each cell in the
matrix then represents a functional interaction
between components of the product. Algorithms have
been developed to cluster the components by
rearranging columns and rows, and to assign the
components to modules based on various matching
criteria, e.g., material, functionality, etc. Derivatives
of the design structure matrix list the design tasks that
correspond to the components in the first column and
first row (Browning, 2001). Then the cells in the
matrix reflect precedence relationships, i.e., which
task supplies data to or receives information from
which other tasks. These design structure matrix
S.K. Fixson / Journal of Operations Management 23 (2005) 345–369 351
versions have been used to study organizational
behavior in design organizations (Sosa et al., 2003). In
general, engineering models serve their individual
purpose very well; however, they are often difficult to
transfer due to their application specificity.
2.4. Requirements for product architecture measures
for trade-off analyses
The brief reviews of some of the effects of
individual product architecture characteristics on
decisions across the three domains, and of three
classes of product architecture descriptions lead to two
requirements that a product architecture assessment
tool must meet to show the product architecture as a
coordinating mechanism. First, since there are
numerous linkages between product architecture
characteristics and decisions across the three domains,
the tool must be able to discern these different
linkages. To do so it must capture all relevant
dimensions of the product architecture simulta-
neously, but show them separately. For to allow the
identification of an individual product architecture
characteristic as a cause, the tool must be able to
observe its variation while ‘controlling’ for the other
product architecture dimensions. Second, the product
architecture assessment tool must initially keep
description separate from evaluation, because a
particular product architecture characteristic might
positively enable a decision in one domain (e.g.
product development) while having a negative
constraining effect in another domain (e.g., supply
chain). Separate description and evaluation allow for
the detection of the cause–consequence relationships
in these cases.
3. Product architecture—an operational
definition
To develop a product architecture description that
is comprehensive and at the same time operationaliz-
able, I augment the nominal definition proposed in the
previous section with Ulrich’s (1995) distinction
between modular and integral architectures. ‘‘A
modular architecture includes a one-to-one mapping
from functional elements to physical components of
the product, and specifies de-coupled interfaces
between components. An integral architecture
includes a complex (non one-to-one) mapping from
functional elements to physical components and/or
coupled interfaces between components’’ (Ulrich,
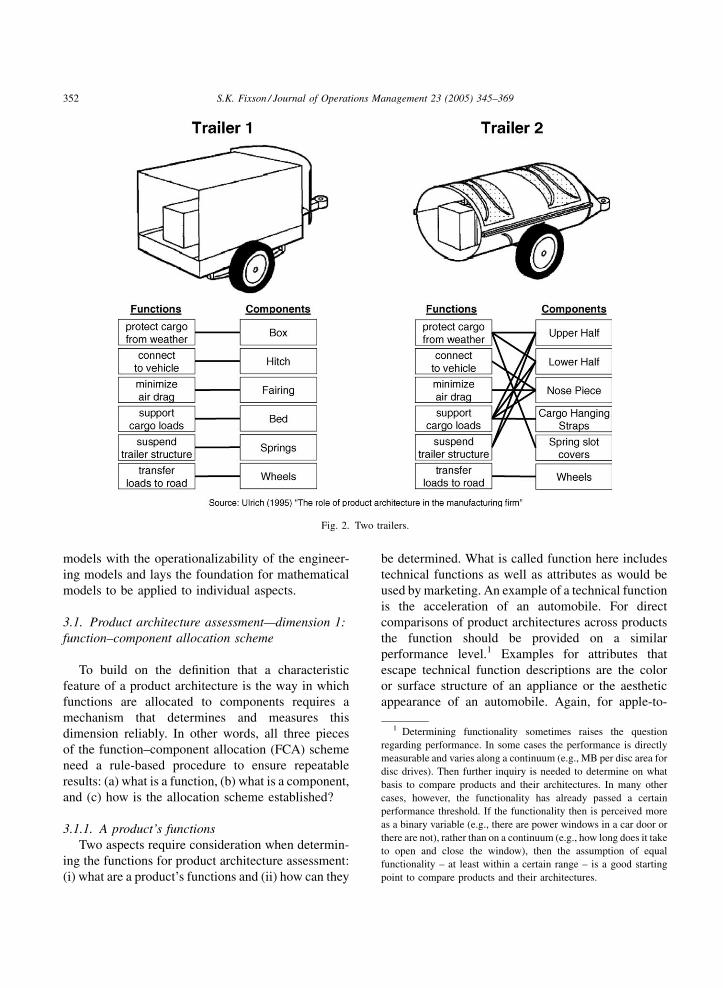
1995, p. 422). To demonstrate his typology he uses
two trailers with different architectures (Fig. 2).
Ulrich acknowledges that his typology describes
ideal types: ‘‘The types shown are idealized; most real
products exhibit some combination of the character-
istics of several types. Products may also exhibit
characteristics of different types depending on
whether one observes the product at the level of the
overall final assembly or at the level of individual
piece parts and subassemblies’’ (Ulrich, 1995, p. 424).
In order to achieve the ultimate goal to assess the
impact of product architecture decisions on decisions
in the domains of product, process, and supply chain,
what is needed then is a method to determine where in
between these extremes – modular and integral – a
particular design is located in the space of possible
function–component mappings, or, at a minimum,
how two or more mappings compare to each other
with respect to their locations in this space. To develop
a framework that allows this type of comparative
analysis, I expand Ulrich’s work in three dimensions.
First, for his ideal cases, Ulrich defines jointly how
functions are allocated to physical components and
whether interfaces are coupled. I will relax this joint
requirement. While both dimensions are necessary for
a complete description of a product architecture, these
two dimensions are, to a large extent, independent
from each other and, consequently, should be treated
independently. Second, both dimensions, function
allocation and interfaces, appear to be themselves
multi-dimensional constructs. Therefore, the frame-
work to be developed needs to be capable of capturing
all aspects of the multiple underlying dimensions.
Third, since the notions of modular or integral are
associated with an allocation of the functionality of the
product, it appears that a label for the entire product is
essentially creating an average assessment of the
product architecture. I argue that this average hides too
much of the information of interest, and that a finer-
grained description is necessary. Below I suggest a
product architecture assessment framework that
satisfies these three expansions of Ulrich’s product
architecture description. The suggested framework
combines the comprehensiveness of the conceptual
S.K. Fixson / Journal of Operations Management 23 (2005) 345–369352
Fig. 2. Two trailers.
1 Determining functionality sometimes raises the question
regarding performance. In some cases the performance is directly
measurable and varies along a continuum (e.g., MB per disc area for
disc drives). Then further inquiry is needed to determine on what
basis to compare products and their architectures. In many other
cases, however, the functionality has already passed a certain
performance threshold. If the functionality then is perceived more
as a binary variable (e.g., there are power windows in a car door or
there are not), rather than on a continuum (e.g., how long does it take
to open and close the window), then the assumption of equal
functionality – at least within a certain range – is a good starting
point to compare products and their architectures.
models with the operationalizability of the engineer-
ing models and lays the foundation for mathematical
models to be applied to individual aspects.
3.1. Product architecture assessment—dimension 1:
function–component allocation scheme
To build on the definition that a characteristic
feature of a product architecture is the way in which
functions are allocated to components requires a
mechanism that determines and measures this
dimension reliably. In other words, all three pieces
of the function–component allocation (FCA) scheme
need a rule-based procedure to ensure repeatable
results: (a) what is a function, (b) what is a component,
and (c) how is the allocation scheme established?
3.1.1. A product’s functions
Two aspects require consideration when determin-
ing the functions for product architecture assessment:
(i) what are a product’s functions and (ii) how can they
be determined. What is called function here includes
technical functions as well as attributes as would be
used by marketing. An example of a technical function
is the acceleration of an automobile. For direct
comparisons of product architectures across products
the function should be provided on a similar
performance level.1 Examples for attributes that
escape technical function descriptions are the color
or surface structure of an appliance or the aesthetic
appearance of an automobile. Again, for apple-to-
S.K. Fixson / Journal of Operations Management 23 (2005) 345–369 353
apple comparisons of two or more product architec-
tures the attributes should be provided on a similar
level.2
The second aspect requires a closer look at the
hierarchy level on which a product’s functions are
selected. Every product’s function can be decomposed
into sub-functions, and these sub-functions can be
decomposed further into lower level sub-functions
(Pahl and Beitz, 1996). Two thoughts are suggested to
guide the function determination process: compar-
ability and applicability. First, since this framework is
developed as a tool to compare products with respect
to their differences in their product architectures (i.e.,
with respect to their different degrees of being
modular or non-modular, the function selection should
consider choosing a level on which the variance in
function–component allocation between the products
becomes visible. In its most simple case, this means
choosing functions that are in full or to the same
degree delivered by the different architecture candi-
dates. Second, the function selection should neither
choose the highest level of the functional hierarchy nor
the lowest in order to be meaningful. The function on
the highest level is necessarily provided by all
components, for otherwise there would not be a
reason for them to be there at all. For example, assume
a hair dryer is the product under investigation. Its main
(and highest level) function is ‘to dry hair’. If ‘to dry
hair’ were selected as a function of interest, the result
would be the allocation of this function to all
components, for no component of the hair drier
would exist in the first place if it were not contributing
to the product’s functionality. On the other hand, if the
function is chosen too low, e.g., ‘hold part A in
position x relative to part B with force f’, then exactly
one and only one component delivers this function,
i.e., the function tends to become idiosyncratic to a
particular design. In other words, if the function
description is too detailed, i.e., on a very low level of
the function hierarchy, it is likely to predetermine its
realization with parts and components. In either of
these extremes the function–component allocation
schemes would be trivial. In contrast, if one begins to
2 The exact performance levels of attributes are typically either
hard to determine (‘‘Does a hatchback look ‘better’ than a sedan?’’)
or are entirely based on individuals’ preferences (‘‘Max prefers a red
bicycle over a blue one.’’).
define functions like ‘generate air flow’, ‘heat air
flow’, ‘control heat’, ‘control air flow’, and ‘supply
energy’, then it becomes more meaningful to
investigate how they are mapped to the components.
When in doubt, a level should be chosen that is rather
higher than lower in the functional hierarchy because
the higher a function is located in the functional
hierarchy the closer it is to an actual user need. Users
usually care about that a function or attribute is
provided, but not necessarily how it is provided by
certain technical solutions on lower hierarchy levels.
3.1.2. A product’s components
Similar to the case of product functions, two aspects
drive the product component determination: (i) what is a
component and (ii) how is it determined? To maintain
maximum flexibility of the product architecture assess-
ment framework, component is used here as a pure
placeholder.It isdefinedheresuchthat itcanrepresentall
subsystems, modules, orparts (aboveconnectors suchas
clips and screws). What the components ultimately
represent depends on the second aspect to consider: the
selected hierarchy level of the product.
Almost all assembled products simultaneously dis-
play some sort of inner hierarchy and are also part of a
larger system and its hierarchy. This phenomenon has
been described as nested hierarchies (Alexander, 1964;
Christensen, 1992; Gulati and Eppinger, 1996; Simon,
1962). Consequently, it is important to determine the
product hierarchy level that corresponds to the level of
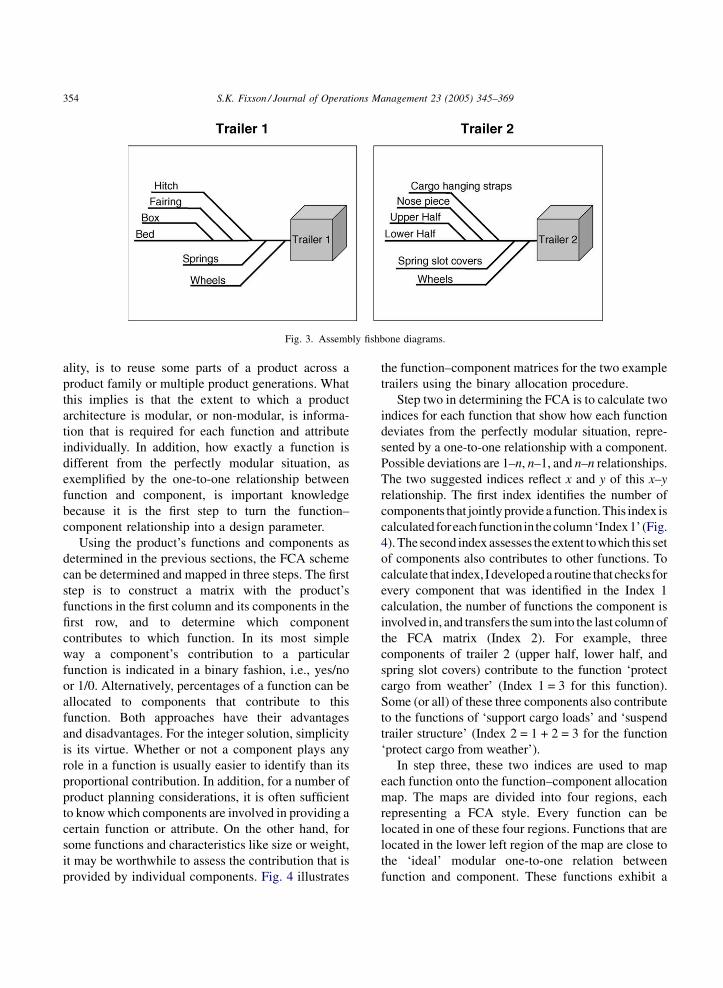
functions determined earlier. Mechanisms that can help
in this process are assembly trees or assembly fishbone
diagrams(Fig.3).Thesourceof this informationcanbea
tear-down analysis in which a product is physically
disassembled to understand its structure and parts
(Ulrich and Pearson, 1998), or design drawings and
assembly process descriptions. Working backwards
through the assembly tree, starting from the full product,
all components (parts, modules, subassemblies, etc.)
that are assembled directly to the main component are
considered on the relevant level.
3.1.3. Function–component allocation (FCA)
schemes
To increase product variety, firms mostly vary only
some functions or attributes of a product but never all
of them. In fact, the basic idea of concepts such as
mass customization, product platforms, and common-
S.K. Fixson / Journal of Operations Management 23 (2005) 345–369354
Fig. 3. Assembly fishbone diagrams.
ality, is to reuse some parts of a product across a
product family or multiple product generations. What
this implies is that the extent to which a product
architecture is modular, or non-modular, is informa-
tion that is required for each function and attribute
individually. In addition, how exactly a function is
different from the perfectly modular situation, as
exemplified by the one-to-one relationship between
function and component, is important knowledge
because it is the first step to turn the function–
component relationship into a design parameter.
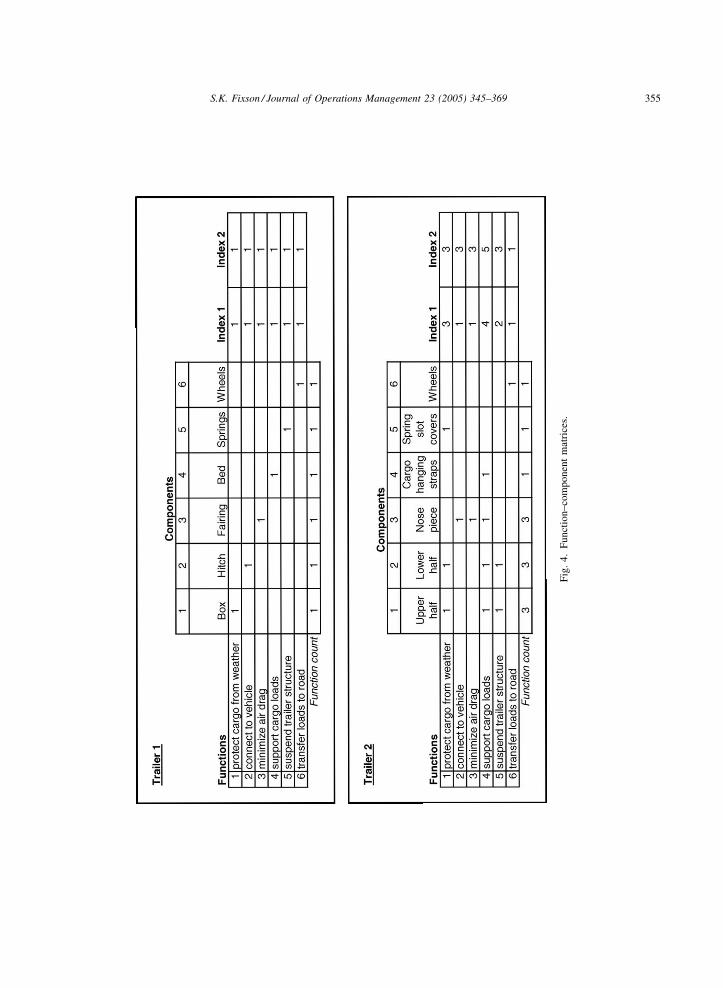
Using the product’s functions and components as
determined in the previous sections, the FCA scheme
can be determined and mapped in three steps. The first
step is to construct a matrix with the product’s
functions in the first column and its components in the
first row, and to determine which component
contributes to which function. In its most simple
way a component’s contribution to a particular
function is indicated in a binary fashion, i.e., yes/no
or 1/0. Alternatively, percentages of a function can be
allocated to components that contribute to this
function. Both approaches have their advantages
and disadvantages. For the integer solution, simplicity
is its virtue. Whether or not a component plays any
role in a function is usually easier to identify than its
proportional contribution. In addition, for a number of
product planning considerations, it is often sufficient
to know which components are involved in providing a
certain function or attribute. On the other hand, for
some functions and characteristics like size or weight,
it may be worthwhile to assess the contribution that is
provided by individual components. Fig. 4 illustrates
the function–component matrices for the two example
trailers using the binary allocation procedure.
Step two in determining the FCA is to calculate two
indices for each function that show how each function
deviates from the perfectly modular situation, repre-
sented by a one-to-one relationship with a component.
Possible deviations are 1–n, n–1, and n–n relationships.
The two suggested indices reflect x and y of this x–y
relationship. The first index identifies the number of
components that jointly provide a function. This index is
calculatedforeachfunctioninthecolumn ‘Index1’ (Fig.
4). The second index assesses the extent towhich this set
of components also contributes to other functions. To
calculate that index, Idevelopeda routine thatchecksfor
every component that was identified in the Index 1
calculation, the number of functions the component is
involved in, and transfers the sum into the last column of
the FCA matrix (Index 2). For example, three
components of trailer 2 (upper half, lower half, and
spring slot covers) contribute to the function ‘protect
cargo from weather’ (Index 1 = 3 for this function).
Some (or all) of these three components also contribute
to the functions of ‘support cargo loads’ and ‘suspend
trailer structure’ (Index 2 = 1 + 2 = 3 for the function
‘protect cargo from weather’).
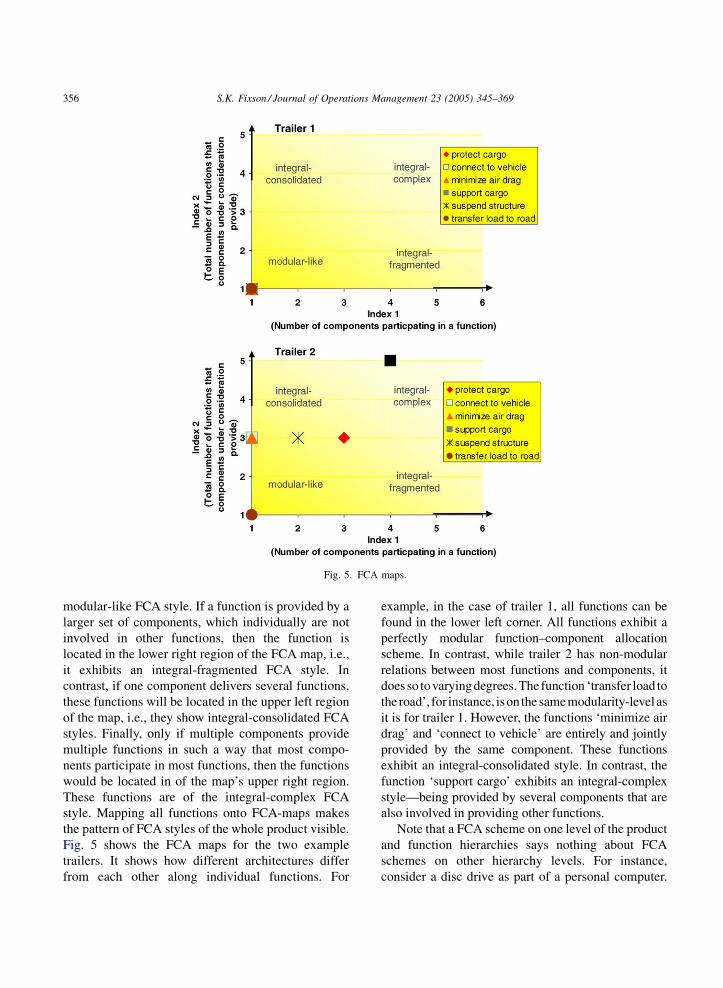
In step three, these two indices are used to map
each function onto the function–component allocation
map. The maps are divided into four regions, each
representing a FCA style. Every function can be
located in one of these four regions. Functions that are
located in the lower left region of the map are close to
the ‘ideal’ modular one-to-one relation between
function and component. These functions exhibit a
S.K. Fixson / Journal of Operations Management 23 (2005) 345–369 355
Fig
.4.
Funct
ion–co
mponen
tm
atri
ces.
S.K. Fixson / Journal of Operations Management 23 (2005) 345–369356
Fig. 5. FCA maps.
modular-like FCA style. If a function is provided by a
larger set of components, which individually are not
involved in other functions, then the function is
located in the lower right region of the FCA map, i.e.,
it exhibits an integral-fragmented FCA style. In
contrast, if one component delivers several functions,
these functions will be located in the upper left region
of the map, i.e., they show integral-consolidated FCA
styles. Finally, only if multiple components provide
multiple functions in such a way that most compo-
nents participate in most functions, then the functions
would be located in of the map’s upper right region.
These functions are of the integral-complex FCA
style. Mapping all functions onto FCA-maps makes
the pattern of FCA styles of the whole product visible.
Fig. 5 shows the FCA maps for the two example
trailers. It shows how different architectures differ
from each other along individual functions. For
example, in the case of trailer 1, all functions can be
found in the lower left corner. All functions exhibit a
perfectly modular function–component allocation
scheme. In contrast, while trailer 2 has non-modular
relations between most functions and components, it
does so tovarying degrees.The function ‘transfer load to
the road’, for instance, isonthesamemodularity-levelas
it is for trailer 1. However, the functions ‘minimize air
drag’ and ‘connect to vehicle’ are entirely and jointly
provided by the same component. These functions
exhibit an integral-consolidated style. In contrast, the
function ‘support cargo’ exhibits an integral-complex
style—being provided by several components that are
also involved in providing other functions.
Note that a FCA scheme on one level of the product
and function hierarchies says nothing about FCA
schemes on other hierarchy levels. For instance,
consider a disc drive as part of a personal computer.
S.K. Fixson / Journal of Operations Management 23 (2005) 345–369 357
3 Pimmler and Eppinger’s methodology helps to describe the
interactions between components and can be used to guide improve-
ments in design and team organization. In contrast to Pimmler and
Eppinger, who propose their methodology to improve the design by
rearranging units such that the number of off-diagonal interactions
is reduced, the methodology suggested here uses the matrices for
descriptive purposes only. This also allows using only the upper half
of the matrix. The lower half is reserved for determining the
interfaces’ levels of reversibility (see next section).
Investigating the role of the disc drive for the FCA
scheme of the computer will produce a different result
than the analysis of the disc drive’s internal FCA
scheme. In sum, FCA schemes have to be defined
anew for each level of the hierarchy, and one product
can have different schemes on different levels.
Similarly, different products can have similar FCA
schemes on some levels while exhibiting quite
different ones on other levels.
3.2. Product architecture assessment—dimension 2:
interface characteristics
A product’s interface characteristics are often
described with terms such as ‘coupled’ or ‘dependent’
(e.g., Baldwin and Clark, 2000; Schilling, 2000).
However, products can exhibit different degrees of
being coupled, depending on the product life cycle
phase. For example, a coupling with respect to a
certain product function may or may not be the same
coupling that determines whether a user can easily
replace the component providing that function.
Consequently, the interface measurement needs to
be conducted on a disaggregated level to allow
investigation of the individual effects. To make the
dimension interface measurable, I group the informa-
tion into three categories: the interfaces’ role for the
product function (‘type’), their role for making,
changing, and unmaking of the product (‘reversi-
bility’), and their role with regard to substitutes
(‘standardization’). In each category, the correspond-
ing interface characteristic is assessed individually.
Like the function–component allocation, the interface
assessment investigates the characteristics of the
interfaces only on the determined hierarchy level.
3.2.1. Interface type
The interfaces’ roles for the product function, i.e.,
their types, are determined by their number and
distribution across the product, their nature, and their
intensity. Obviously, the simple count correlates to
some degree with the number of components the
product consists of (at the hierarchy level under
consideration). If the number of components is n, then
the number of interfaces is at least n–1 and at most
(n(n–1))/2; the former would be a string of compo-
nents, the latter a web of connections where every
component forms an interface with every other
component. This rather simple calculation assumes
that only one connection or interface exists between
two components and abstracts multiple or multi-
directional connections into a yes/no relationship.
The distribution of the interfaces provides addi-
tional information about the product architecture. For
example, if a component interacts with a significant
number of other components (relative to the total
number of components) there are two possible
explanations. First, the component may play a pivotal
role in the product architecture. It could signal a
central component, one that supplies general or central
functionality. This resembles what most researchers
understand as a product platform (Meyer and Lehnerd,
1997; Simpson, 2003). Second, the product architec-
ture under consideration may not be very modular, but
rather fragmented. A product architecture with
fragmented FCA styles is more likely to have many
components that show interactions with many other
components than a product architecture with modular
FCA styles.
Depending on the functionality of the components
participating in the interfaces under consideration, the
interfaces can also vary in their nature and intensity.
The interfaces’ ‘nature’ reflects the physical effects
that occur for the interface to play its intended role.
For example, an interface can transmit mechanical
force, electrical energy, or signals. It can also represent
a non-contact relation, e.g., the gap between fender
and hood of an automobile, or the signal transmission
between a wireless router and a wireless PC card. An
interface’s ‘intensity’ reflects its strength and desir-
ability with respect to its functional role, i.e., its
nature. To some extent this is a measure of the degree
of coupling, albeit for the functional role only. To
assess an interface’s nature and intensity I build on
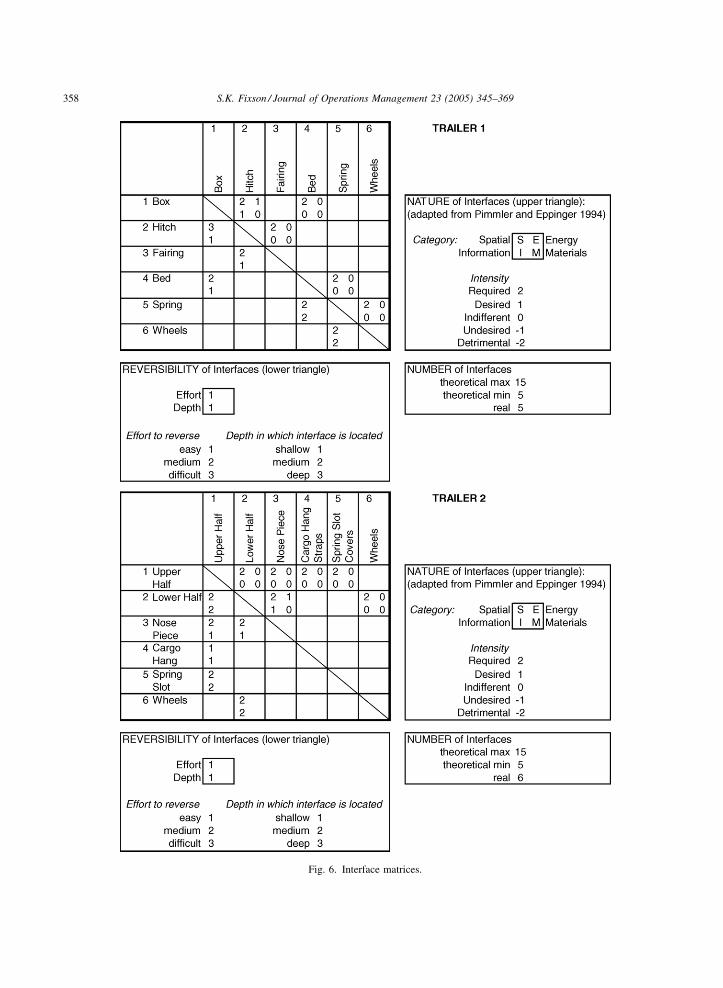
work by Pimmler and Eppinger (1994), who have
developed a methodology for the analysis of product
design decomposition.3 After decomposing the pro-
S.K. Fixson / Journal of Operations Management 23 (2005) 345–369358
Fig. 6. Interface matrices.
S.K. Fixson / Journal of Operations Management 23 (2005) 345–369 359
duct into components, the interactions between these
components are documented and coded in a matrix.
Four forms of interactions can be considered accord-
ing to Pimmer and Eppinger: (1) a spatial interaction
identifies needs for adjacency or orientation between
two elements, (2) an energy interaction identifies
needs for energy transfer between two elements, (3) an
information interaction identifies needs for informa-
tion or signal exchange between two elements, and (4)
a material interaction identifies needs for materials
exchange between two elements. They further suggest
specifying the importance and desirability, i.e., the
intensity, of the interaction on a five-point scale from
�2 to +2. The identification and scoring of each
interaction for each of the four forms results in a
matrix that has in each interaction field four numbers
between �2 and +2. The upper left corner contains the
number for the spatial-type interaction, the upper right
the number for energy-type interactions, the lower left
corner shows the number for information-type
interactions, and the lower right corner displays the
rating for material-type interactions. The upper
triangles in Fig. 6 show the interface matrices for
the two trailers. Empty cells can be interpreted as
being filled with zeros. Due to their mechanical
characteristics, most of the interfaces for both trailers
are spatial in nature. The only exception is the energy
and signal transmission from the towing vehicle to the
rear lights. Note that despite their very different FCA
schemes, both architectures exhibit a number of
similarities with respect to the type of interfaces.
3.2.2. Interface reversibility
The second interface characteristic that needs to be
analyzed is the interfaces’ ‘reversibility’. The notion
of various product changes over the product life, such
as upgrades, add-ons, adaptation, wear, consumption,
or reuse – which are often assumed as being one of the
major advantages of modular product architectures –
strongly depends on the reversibility of the interface.
Table 1
Criteria to assess effort level to disconnect interface
Score 1 (low)
Tool requirements None
Time to disconnect (s) <10
Examples Snap-fit connection
The effort to reverse, or disconnect, the interface can
serve as a proxy to determine the reversibility of an
interface. This effort depends on two factors: first, the
difficulty to physically disconnect the interface, and
second, the interface’s position in the overall product
architecture.
Theoretically, every interface can be disconnected.
However, that modular product architectures have
strong interactions within modules and weak ones
between them implies that the weakness of these
relations can be translated into low efforts to reverse
(or disconnect) the interface. The repair of an outer
panel of an automobile door illustrates that the answer
to this question lies on a continuum. Consider a
conventional car door. The steel structure is welded
together before it is painted jointly with the car’s body-
in-white. In a final step, all trim parts are attached to
the door. Now suppose the outer panel is damaged in
an accident. To repair the outer panel all assembled
parts would have to be removed, the damaged door
outer panel would have to be cut, a new outer panel
would have to be welded to the other door panels, the
door would have to be repainted, and the components
would have to be reassembled. Contrast this with a
door architecture, where the outer panel is not part of
the load carrying structure and not welded to it, but
attached with a mechanism that is relatively easy to
disconnect (e.g., screws). Not only can the door outer
panel be replaced without first removing many other
parts, the reversible attachment mechanism also
reduces the level of skills and specialized equipment
required to remove the damaged part and to attach the
new one. Consequently, the overall effort to dis-
connect – or reverse – the interface between the outer
panel and the rest of the door is lower for the
alternative door architecture than for the conventional
door architecture. This example demonstrates that the
level of an interface’s reversibility depends not only on
its own technical specifications (skill and equipment
requirements) but also on its position within the
2 (medium) 3 (high)
Generic Special
10–60 >60
Nut–bolt connection Weld bond
S.K. Fixson / Journal of Operations Management 23 (2005) 345–369360
Table 2
Criteria to assess depth level to disconnect interface
Score Fraction of total product components
that needs to be removed prior to the
interface disconnection (%)
1 (low) <10
2 (medium) 10–33
3 (high) >33
overall product, i.e., how deep it is ‘buried’ in the
product. Similar efforts are to be expected for other
product changes during product use, i.e., add-ons,
upgrades, changes during the use phase, and replace-
ment of worn or consumable components.
For the purpose of comparatively measuring the
interfaces’ reversibility, I suggest assigning two values
to each interface. Note that others have suggested
similar measures to assess disassembly efforts for
recycling (e.g., Das et al., 2000). The first value
represents the difficulty involved in disconnecting the
interface. Its score corresponds to the time and tools
required to disconnect the interface (Table 1). The
second value represents the depth in which an
interface is ‘buried’, how many other units have to
be removed before a disconnection of the interface is
possible. This score is specified in fractions of total
number of components (on the hierarchy level under
consideration) (Table 2). Both values should be
assigned with the comparative purpose in mind.
The results for the two example trailers are shown
in the lower triangles of the matrices in Fig. 6. With
respect to the difficulty to reverse most of the
interfaces, the two trailer concepts are very similar.
For both product architectures, the difficulty can be
considered to be relatively low, primarily because of
the use of mechanical fasteners (only bed and hitch of
trailer 1 are assumed to be welded together). Due to
the relatively small number of components, none of
the designs exhibit significant ‘depth’ in which some
of the interfaces could be ‘buried’. Note, however, that
a component like the Upper Half of trailer 2 has an
above average number of interfaces. If this component
needed to be replaced, it would require disconnecting
all relevant interfaces.
3.2.3. Interface standardization
The third interface category is concerned with the
interfaces’ roles regarding component substitutes and
product families. This interface characteristic
deserves particular consideration, because it is critical
if one pursues product variety through component and
interface standardization. A common idea about
modular product architectures is the relative ease
with which an inter-module interface is supposed to
allow an exchange of sub-units. This ‘ease’ has two
components. The first is the interface’s reversibility
(which was covered in the previous section), and the
second is the degree to which there are alternatives for
an exchange. The latter one is the subject of this
section.
As discussed in the section on existing models,
some researchers have used different types of
component interchange to categorize different types
of modularity. Component swapping, component
sharing, fabricate-to-fit, bus, and sectional are often
used characterizations (e.g., Kusiak, 1999; Pine, 1993;
Ulrich and Tung, 1991). However, the extent to which
an interface allows this interchangeability of compo-
nents is a matter of the unit-of-analysis choice. For
example, component swapping modularity and com-
ponent sharing modularity do not describe the
interface itself, but rather the alternatives that exist
on either side of the interface. If one component is
defined as the one remaining in the system (often the
larger one) and the interface allows the exchange of
the other one, then the term component swapping is
used. On the other hand, if the larger one is exchanged
(i.e., the reference switches to the smaller one) the
term component sharing is used. Consider the
interface between a lamp and a light bulb. If the light
bulb is exchanged (say, with one with a different color)
and the same lamp kept, it is called component
swapping. If the same light bulb is used in a different
lamp, however, it is called component sharing. Note
that the technical characteristics of the interface can be
identical in both cases. Thus, the use of these terms
depends on which component is chosen as the
reference system.
If the chosen reference system offers similar
interfaces in various locations, the term bus mod-
ularity has been applied. Examples are electrical
systems, shelving systems with rails and the bus
systems used in computers. If the standardization is
taken one step further, it allows the connection of
every unit with every other unit. This is what is meant
by sectional modularity. One example would be
S.K. Fixson / Journal of Operations Management 23 (2005) 345–369 361
LEGO blocks, others include piping fittings or
sectional sofas.
These examples illustrate two insights. First, they
support the separate determination of function–
component allocation and interface characteristics
that this framework introduces, because identical
interfaces can be found in different function–
component allocation schemes, and a single func-
tion–component allocation scheme can exhibit multi-
ple, different interface types. The features discussed in
this section are characteristics of particular interfaces
rather than the product architecture as a whole.
Second, the extent to which an interface can be
considered standardized from each component’s
perspective is key to assessing its role in a product
family.
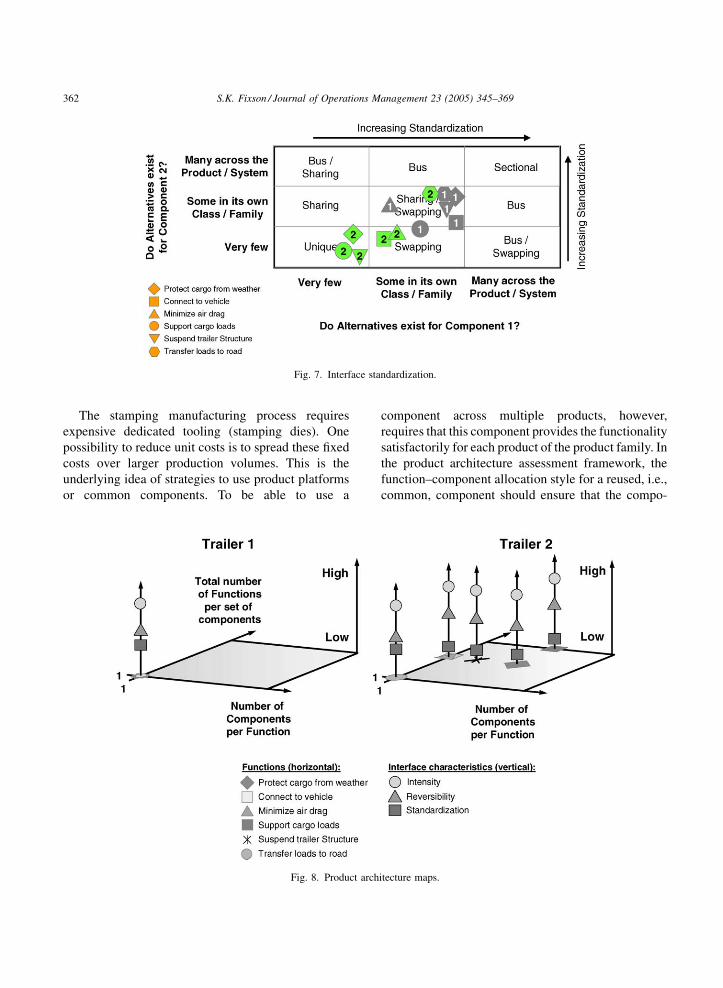
To identify the interfaces’ role with respect to
component interchangeability, I suggest a mapping
tool that describes an interface from the perspectives
of both components ‘involved’ in the interface
(Fig. 7). One extreme, the lower left corner, indicates
interfaces where there are very few alternatives to
replace or substitute either one of the components
(e.g., at a space station). The other extreme, the upper
right corner, locates interfaces where multiple
replacements or substitution options exist for both
components (e.g., LEGO blocks). The map’s center
locates interfaces like the lamp/light bulb combina-
tion. A case of an interface where there are many
alternatives for one component but very few for the
other (upper left corner or lower right corner) can be
imagined as a separate electrical system with a unique
voltage (e.g., on a boat or at a remote house). The level
of interface standardization increases from the lower
left to the upper right corner of the map.
Fig. 7 shows the interfaces for the major functions
of the two trailer examples. Each icon characterizes
the alternatives on each side of an interface, separately
one per function. Not knowing the product families
that could surround these example trailers, it is
assumed that the functions of trailer 1 exhibit a higher
level of reusability across a product family than those
of trailer 2. The reason for this is that it is more likely
for those components that carry the functions to find
use in other designs for trailer 1 than it is for trailer 2,
the latter showing a higher level of idiosyncrasy.
However, the level of standardization is not homo-
genous across either product architecture. For exam-
ple, while the component for trailer 2’s function
‘support cargo loads’ is very unique, the components
providing the function ‘minimize air drag’ can be
viewed as also being usable for a similar but slightly
different trailer, and the component corresponding to
the function ‘transfer loads to road’ is exactly as
standardized as the one of trailer 1.
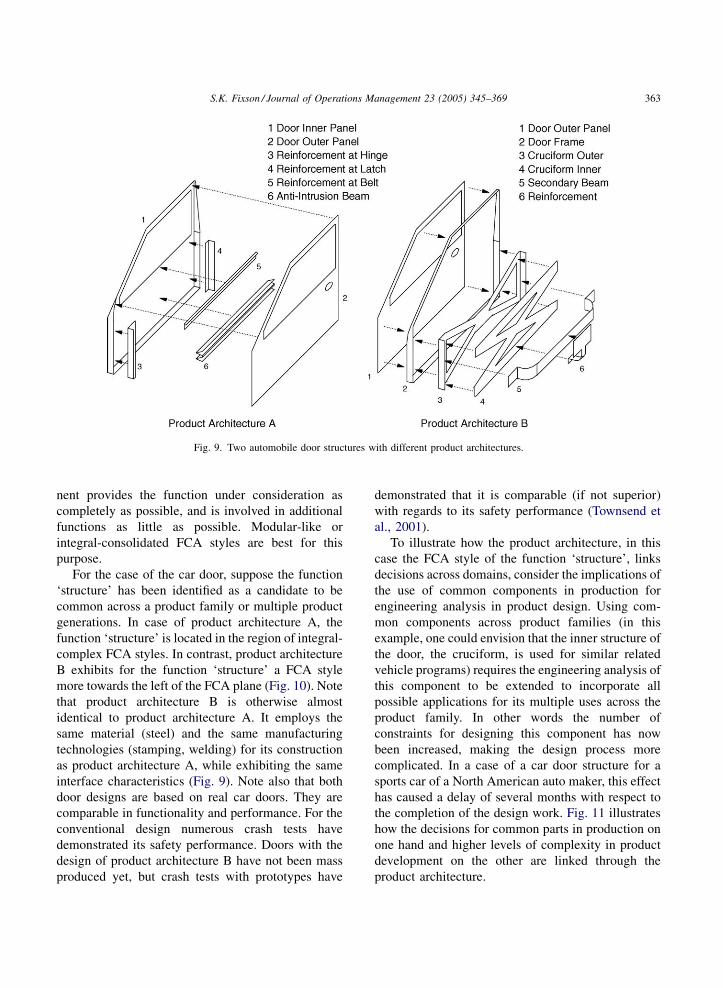
3.3. Pulling it all together: product architecture
maps
Together with the function–component allocation
data, the interface information completes the descrip-
tion of the product architecture. Consequently, adding
the information for all three interface dimensions to
the function–component allocation map results in the
product architecture map. These product architecture
maps show in their x–y plane how the functions are
allocated to the components. Independent from that,
and independent of each other, the different interface
dimensions are shown along the vertical axis (z).
These product architecture maps serve as a graphic
representation of the complete product architecture
description. They allow quick visual references of
similarities and differences of the analyzed product
architectures. Fig. 8 shows the maps for the two
trailers. Note that for these pictorial representations,
the measures for each of the three interface
characteristics have been aggregated per function, if
necessary.
The suggested product architecture assessment
framework can serve as the nexus for creating the
linkages between decisions in the domains of product,
process, and supply chain. The next section provides
an illustration of how the framework can be used to
identify (a) the linkages themselves and (b) how to use
this knowledge for trade-off analyses.
4. Illustration
To demonstrate how the product architecture
coordinates decisions across product, process, and
supply chain domains, a car door is introduced as an
example product. The vast majority of today’s car
doors are constructed as a shell-shaped structure,
welded together from stamped steel components
(product architecture A in Fig. 9).
S.K. Fixson / Journal of Operations Management 23 (2005) 345–369362
Fig. 7. Interface standardization.
The stamping manufacturing process requires
expensive dedicated tooling (stamping dies). One
possibility to reduce unit costs is to spread these fixed
costs over larger production volumes. This is the
underlying idea of strategies to use product platforms
or common components. To be able to use a
Fig. 8. Product arch
component across multiple products, however,
requires that this component provides the functionality
satisfactorily for each product of the product family. In
the product architecture assessment framework, the
function–component allocation style for a reused, i.e.,
common, component should ensure that the compo-
itecture maps.
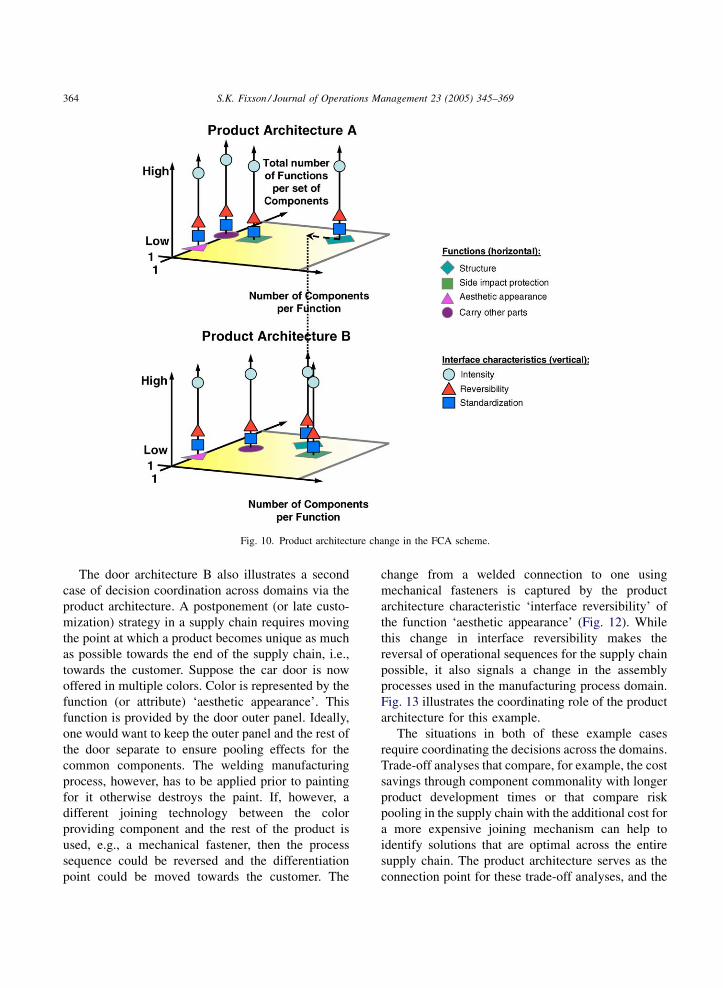
S.K. Fixson / Journal of Operations Management 23 (2005) 345–369 363
Fig. 9. Two automobile door structures with different product architectures.
nent provides the function under consideration as
completely as possible, and is involved in additional
functions as little as possible. Modular-like or
integral-consolidated FCA styles are best for this
purpose.
For the case of the car door, suppose the function
‘structure’ has been identified as a candidate to be
common across a product family or multiple product
generations. In case of product architecture A, the
function ‘structure’ is located in the region of integral-
complex FCA styles. In contrast, product architecture
B exhibits for the function ‘structure’ a FCA style
more towards the left of the FCA plane (Fig. 10). Note
that product architecture B is otherwise almost
identical to product architecture A. It employs the
same material (steel) and the same manufacturing
technologies (stamping, welding) for its construction
as product architecture A, while exhibiting the same
interface characteristics (Fig. 9). Note also that both
door designs are based on real car doors. They are
comparable in functionality and performance. For the
conventional design numerous crash tests have
demonstrated its safety performance. Doors with the
design of product architecture B have not been mass
produced yet, but crash tests with prototypes have
demonstrated that it is comparable (if not superior)
with regards to its safety performance (Townsend et
al., 2001).
To illustrate how the product architecture, in this
case the FCA style of the function ‘structure’, links
decisions across domains, consider the implications of
the use of common components in production for
engineering analysis in product design. Using com-
mon components across product families (in this
example, one could envision that the inner structure of
the door, the cruciform, is used for similar related
vehicle programs) requires the engineering analysis of
this component to be extended to incorporate all
possible applications for its multiple uses across the
product family. In other words the number of
constraints for designing this component has now
been increased, making the design process more
complicated. In a case of a car door structure for a
sports car of a North American auto maker, this effect
has caused a delay of several months with respect to
the completion of the design work. Fig. 11 illustrates
how the decisions for common parts in production on
one hand and higher levels of complexity in product
development on the other are linked through the
product architecture.
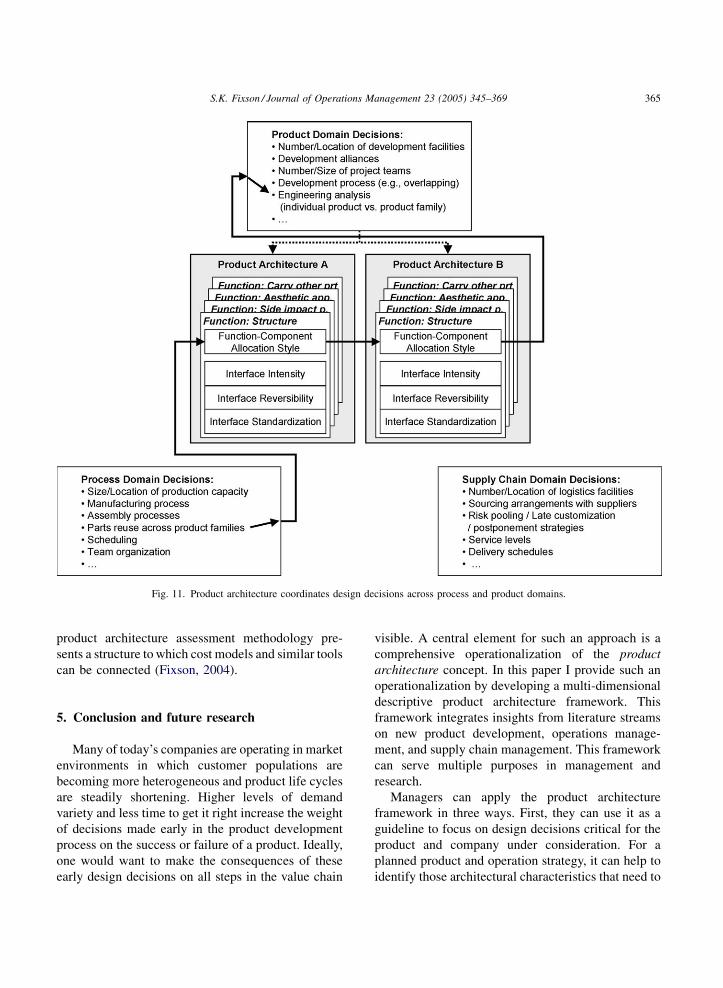
S.K. Fixson / Journal of Operations Management 23 (2005) 345–369364
Fig. 10. Product architecture change in the FCA scheme.
The door architecture B also illustrates a second
case of decision coordination across domains via the
product architecture. A postponement (or late custo-
mization) strategy in a supply chain requires moving
the point at which a product becomes unique as much
as possible towards the end of the supply chain, i.e.,
towards the customer. Suppose the car door is now
offered in multiple colors. Color is represented by the
function (or attribute) ‘aesthetic appearance’. This
function is provided by the door outer panel. Ideally,
one would want to keep the outer panel and the rest of
the door separate to ensure pooling effects for the
common components. The welding manufacturing
process, however, has to be applied prior to painting
for it otherwise destroys the paint. If, however, a
different joining technology between the color
providing component and the rest of the product is
used, e.g., a mechanical fastener, then the process
sequence could be reversed and the differentiation
point could be moved towards the customer. The
change from a welded connection to one using
mechanical fasteners is captured by the product
architecture characteristic ‘interface reversibility’ of
the function ‘aesthetic appearance’ (Fig. 12). While
this change in interface reversibility makes the
reversal of operational sequences for the supply chain
possible, it also signals a change in the assembly
processes used in the manufacturing process domain.
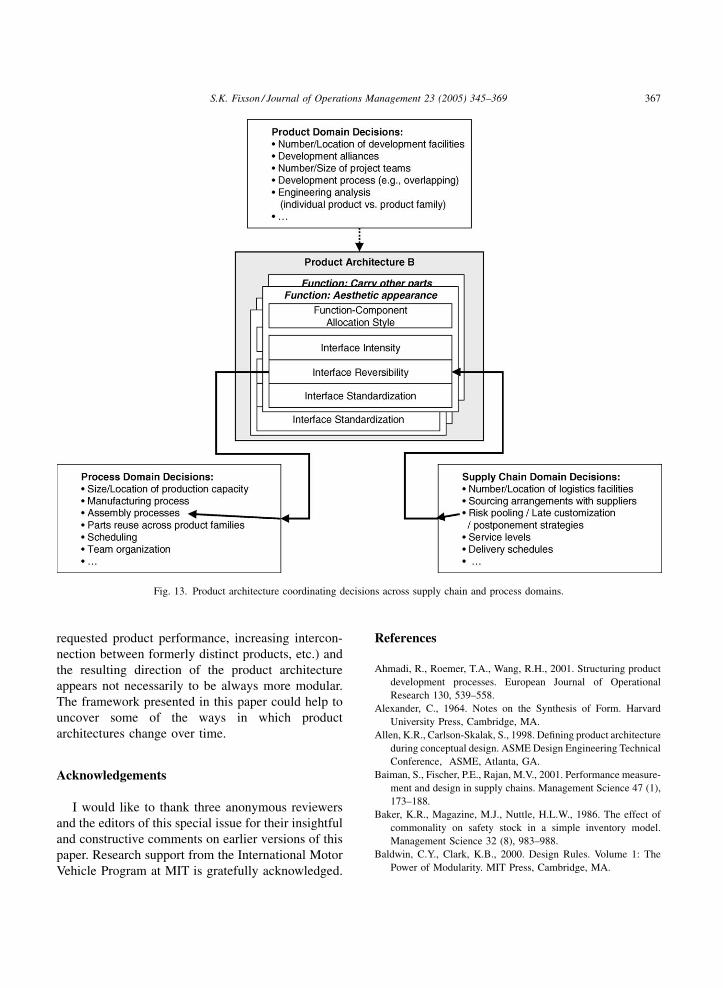
Fig. 13 illustrates the coordinating role of the product
architecture for this example.
The situations in both of these example cases
require coordinating the decisions across the domains.
Trade-off analyses that compare, for example, the cost
savings through component commonality with longer
product development times or that compare risk
pooling in the supply chain with the additional cost for
a more expensive joining mechanism can help to
identify solutions that are optimal across the entire
supply chain. The product architecture serves as the
connection point for these trade-off analyses, and the
S.K. Fixson / Journal of Operations Management 23 (2005) 345–369 365
Fig. 11. Product architecture coordinates design decisions across process and product domains.
product architecture assessment methodology pre-
sents a structure to which cost models and similar tools
can be connected (Fixson, 2004).
5. Conclusion and future research
Many of today’s companies are operating in market
environments in which customer populations are
becoming more heterogeneous and product life cycles
are steadily shortening. Higher levels of demand
variety and less time to get it right increase the weight
of decisions made early in the product development
process on the success or failure of a product. Ideally,
one would want to make the consequences of these
early design decisions on all steps in the value chain
visible. A central element for such an approach is a
comprehensive operationalization of the product
architecture concept. In this paper I provide such an
operationalization by developing a multi-dimensional
descriptive product architecture framework. This
framework integrates insights from literature streams
on new product development, operations manage-
ment, and supply chain management. This framework
can serve multiple purposes in management and
research.
Managers can apply the product architecture
framework in three ways. First, they can use it as a
guideline to focus on design decisions critical for the
product and company under consideration. For a
planned product and operation strategy, it can help to
identify those architectural characteristics that need to
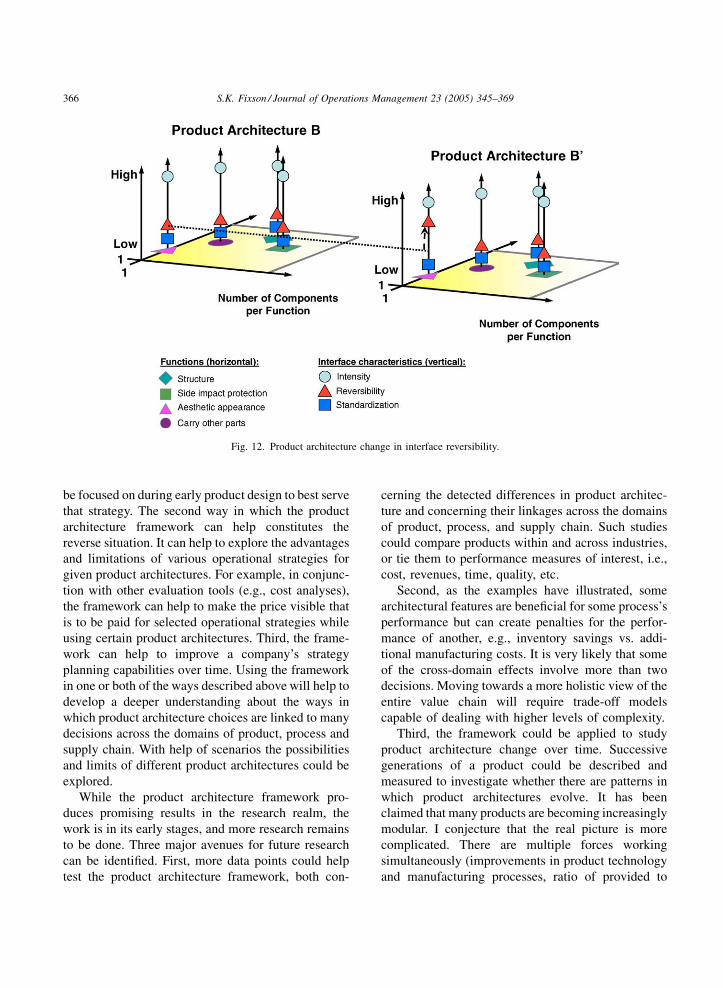
S.K. Fixson / Journal of Operations Management 23 (2005) 345–369366
Fig. 12. Product architecture change in interface reversibility.
be focused on during early product design to best serve
that strategy. The second way in which the product
architecture framework can help constitutes the
reverse situation. It can help to explore the advantages
and limitations of various operational strategies for
given product architectures. For example, in conjunc-
tion with other evaluation tools (e.g., cost analyses),
the framework can help to make the price visible that
is to be paid for selected operational strategies while
using certain product architectures. Third, the frame-
work can help to improve a company’s strategy
planning capabilities over time. Using the framework
in one or both of the ways described above will help to
develop a deeper understanding about the ways in
which product architecture choices are linked to many
decisions across the domains of product, process and
supply chain. With help of scenarios the possibilities
and limits of different product architectures could be
explored.
While the product architecture framework pro-
duces promising results in the research realm, the
work is in its early stages, and more research remains
to be done. Three major avenues for future research
can be identified. First, more data points could help
test the product architecture framework, both con-
cerning the detected differences in product architec-
ture and concerning their linkages across the domains
of product, process, and supply chain. Such studies
could compare products within and across industries,
or tie them to performance measures of interest, i.e.,
cost, revenues, time, quality, etc.
Second, as the examples have illustrated, some
architectural features are beneficial for some process’s
performance but can create penalties for the perfor-
mance of another, e.g., inventory savings vs. addi-
tional manufacturing costs. It is very likely that some
of the cross-domain effects involve more than two
decisions. Moving towards a more holistic view of the
entire value chain will require trade-off models
capable of dealing with higher levels of complexity.
Third, the framework could be applied to study
product architecture change over time. Successive
generations of a product could be described and
measured to investigate whether there are patterns in
which product architectures evolve. It has been
claimed that many products are becoming increasingly
modular. I conjecture that the real picture is more
complicated. There are multiple forces working
simultaneously (improvements in product technology
and manufacturing processes, ratio of provided to
S.K. Fixson / Journal of Operations Management 23 (2005) 345–369 367
Fig. 13. Product architecture coordinating decisions across supply chain and process domains.
requested product performance, increasing intercon-
nection between formerly distinct products, etc.) and
the resulting direction of the product architecture
appears not necessarily to be always more modular.
The framework presented in this paper could help to
uncover some of the ways in which product
architectures change over time.
Acknowledgements
I would like to thank three anonymous reviewers
and the editors of this special issue for their insightful
and constructive comments on earlier versions of this
paper. Research support from the International Motor
Vehicle Program at MIT is gratefully acknowledged.
References
Ahmadi, R., Roemer, T.A., Wang, R.H., 2001. Structuring product
development processes. European Journal of Operational
Research 130, 539–558.
Alexander, C., 1964. Notes on the Synthesis of Form. Harvard
University Press, Cambridge, MA.
Allen, K.R., Carlson-Skalak, S., 1998. Defining product architecture
during conceptual design. ASME Design Engineering Technical
Conference, ASME, Atlanta, GA.
Baiman, S., Fischer, P.E., Rajan, M.V., 2001. Performance measure-
ment and design in supply chains. Management Science 47 (1),
173–188.
Baker, K.R., Magazine, M.J., Nuttle, H.L.W., 1986. The effect of
commonality on safety stock in a simple inventory model.
Management Science 32 (8), 983–988.
Baldwin, C.Y., Clark, K.B., 2000. Design Rules. Volume 1: The
Power of Modularity. MIT Press, Cambridge, MA.
S.K. Fixson / Journal of Operations Management 23 (2005) 345–369368
Banker, R.D., Datar, S.M., Kekre, S., Mukhopadhyay, T., 1990.
Cost of product and process complexity. In: Kaplan, R.S. (Ed.),
Measures for Manufacturing Excellence. Harvard Business
School Press, Boston, MA, pp. 269–290.
Boer, M., Logendran, R., 1999. A methodology for quantifying the
effects of product development on cost and time. IIE Transac-
tions 31 (4), 365–378.
Boothroyd, G., Dewhurst, P., Knight, W.A., 2002. Product Design
for Manufacture and Assembly. Marcel Dekker, New York.
Brown, S.L., Eisenhardt, K.M., 1995. Product development: past
research, present findings, and future directions. Academy of
Management Review 20 (2), 343–378.
Browning, T.R., 2001. Applying the design structure matrix to
system decomposition and integration problems: a review and
new directions. IEEE Transactions on Engineering Management
48 (3), 292–306.
Chesbrough, H.W., Kusunoki, K., 1999. The modularity trap: inno-
vation, technology phase shifts, and the resulting limits of virtual
organizations. In: Nonaka, I., Teece, D.J. (Eds.), Managing
Industrial Knowledge—Creation, Transfer and Utilization.
SAGE Publications, London, pp. 202–230.
Christensen, C.M., 1992. Exploring the limits of the technology S-
curve. Part I: Component technologies. Production and Opera-
tions Management 1 (4), 334–357.
Clark, K.B., Fujimoto, T., 1991. Product Development Performance.
Harvard Business School Press, Boston, MA.
Collier, D.A., 1982. Aggregate safety stock levels and component
part commonality. Management Science 28 (11), 1297–1303.
Das, S.K., Yedlarajiah, P., Narendra, R., 2000. An approach for
estimating the end-of-life product disassembly effort and cost.
International Journal of Production Research 38 (3), 657–673.
Desai, P., Kekre, S., Radhakrishnan, S., Srinivasan, K., 2001.
Product differentiation and commonality in design: balancing
revenues and cost drivers. Management Science 47 (1), 37–51.
Doran, D., 2003. Supply chain implications of modularization.
International Journal of Operations & Production Management
23 (3), 316–326.
Duray, R., Ward, P.T., Milligan, G.W., Berry, W.L., 2000.
Approaches to mass customization: configurations and empirical
validation. Journal of Operations Management 18, 605–
625.
Eppinger, S.D., Whitney, D.E., Smith, R.P., Gebala, D.A., 1994. A
model-based method for organizing tasks in product develop-
ment. Research in Engineering Design 6, 1–13.
Feitzinger, E., Lee, H.L., 1997. Mass customization at Hewlett-
Packard: the power of postponement. Harvard Business Review
75, 116–121.
Fine, C.H., 1998. Clockspeed—Winning Industry Control in the
Age of Temporary Advantage. Perseus Books, Reading, MA.
Fixson, S.K., 2003. The multiple faces of modularity—a literature
analysis of a product concept for assembled hardware products.
Technical Report 03-05. Industrial & Operations Engineering,
University of Michigan, Ann Arbor, MI, p. 87.
Fixson, S.K., 2004. Assessing product architecture costing: product
life cycles, allocation rules, and cost models. ASME 2004
Design Engineering Technical Conferences, ASME, Salt Lake
City, UT.
Fleischer, M., Liker, J.K., 1997. Concurrent Engineering Effective-
ness—Integrating Product Development Across Organizations.
Hanser Gardner Publications, Cincinatti.
Garg, A., 1999. An application of designing products and processes
for supply chain management. IIE Transactions 31 (5), 417–429.
Garud, R., Kumaraswamy, A., 1996. Technological designs for
retention and reuse. International Journal of Technology Man-
agement 11 (7/8), 883–891 (special issue).
Gerchak, Y., Magazine, M.J., Gamble, A.B., 1988. Component
commonality with service level requirements. Management
Science 34 (6), 753–760.
Griffin, A., 1997. Modeling and measuring product development
cycle time across industries. Journal of Engineering and Tech-
nology Management 14, 1–24.
Gulati, R.K., Eppinger, S.D., 1996. The coupling of product archi-
tecture and organizational structure decisions. Working Paper
#3906-96. MIT Sloan School of Management, Cambridge, MA,
p. 31.
Haddad, C.J., 1996. Operationalizing the concept of concurrent
engineering: a case study from the US auto industry. IEEE
Transactions on Engineering Management 43 (2), 124–132.
Henderson, R.M., Clark, K.B., 1990. Architectural innovation: the
reconfiguration of existing product technologies and the failure
of established firms. Administrative Science Quarterly 35,
9–30.
Huang, C.-C., Kusiak, A., 1998. Modularity in design of products
and systems. IEEE Transactions on Systems, Man and Cyber-
netics A: Systems and Humans 28 (1), 66–77.
Jiao, R.J., Huang, G.G.Q., Tseng, M.M., 2004. Concurrent enter-
prising for mass customization. Concurrent Engineering:
Research and Application 12 (2), 83–88.
Kaski, T., Heikkila, J., 2002. Measuring product structures to
improve demand–supply chain efficiency. International Journal
of Technology Management 23 (6), 578–598.
Kota, S., Sethuraman, K., Miller, R., 2000. A metric for evaluating
design commonality in product families. Journal of Mechanical
Design 122 (4), 403–410.
Koufteros, X., Vonderembse, M.A., Doll, W., 2001. Concurrent
engineering and its consequences. Journal of Operations Man-
agement 19, 97–115.
Krishnan, V., Gupta, S., 2001. Appropriateness and impact of plat-
form-based product development. Management Science 47 (1),
52–68.
Kusiak, A., 1999. Engineering Design: Products, Processes, and
Systems. Academic Press, San Diego.
Langlois, R.N., Robertson, P.L., 1992. Network and innovation in a
modular system: Lessons from the microcomputer and stereo
component industries. Research Policy 21, 297–313.
Lee, H.L., Tang, C.S., 1998. Variability reduction through opera-
tions reversal. Management Science 44 (2), 162–172.
Loch, C.H., Mihm, J., Huchzermeier, A., 2003. Concurrent engi-
neering and design oscillations in complex engineering projects.
Concurrent Engineering: Research and Application 11 (3), 187–
199.
Magretta, J., 1998. The power of virtual integration: an interview
with dell computer’s Michael Dell. Harvard Business Review
76, 73–84.

S.K. Fixson / Journal of Operations Management 23 (2005) 345–369 369
Martin, M.V., Ishii, K., 2002. Design for variety: developing stan-
dardized and modularized product platform architectures.
Research in Engineering Design 13, 213–235.
Meyer, M.H., Lehnerd, A.P., 1997. The Power of Product Platforms.
The Free Press, New York.
Mirapaul, M., 2001. Made especially for you—in industrial
quantities. The New York Times, New York, NY, March 11,
p. 11.
Momme, J., Moeller, M.M., Hvolby, H.-H., 2000. Linking modular
product architecture to the strategic sourcing process: case
studies of two Danish industrial enterprises. International
Journal of Logistics: Research and Applications 3 (2), 127–
146.
Nevins, J.L., Whitney, D.E., 1989. Concurrent Design of Products
and Processes: A Strategy for the Next Generation in Manu-
facturing. McGraw-Hill, New York.
Newcomb, P.J., Bras, B., Rosen, D.W., 1998. Implications of
modularity on product design for the life cycle. Journal of
Mechanical Design 120 (3), 483–491.
Nobeoka, K., Cusumano, M.A., 1995. Multiproject strategy, design
transfer, and project performance: a survey of automobile
development projects in the US and Japan. IEEE Transactions
on Engineering Management 42 (4), 397–409.
Pahl, G., Beitz, W., 1996. Engineering Design—A Systematic
Approach. Springer, London.
Pimmler, T.U., Eppinger, S.D., 1994. Integration analysis of product
decompositions. Working Paper # 3690-94-MS. MIT Sloan
School of Management, Cambridge, MA, p. 39.
Pine, B.J.I., 1993. Mass Customization. Harvard Business School
Press, Boston, MA.
Reinertsen, D.G., 1997. Managing the Design Factory. The Free
Press, New York.
Roemer, T.A., Ahmadi, R., Wang, R.H., 2000. Time-cost trade-offs
in overlapped product development. Operations Research 48 (6),
858–865.
Rusinko, C.A., 1999. Exploring the use of design-manufacturing
integration (DMI) to facilitate product development: a test of
some practices. IEEE Transactions on Engineering Management
46 (1), 56–71.
Salvador, F., Forza, C., Rungtusanatham, M., 2002. Modularity,
product variety, production volume, and component sourcing:
theorizing beyond generic prescriptions. Journal of Operations
Management 20, 549–575.
Sanchez, R., Mahoney, J.T., 1996. Modularity, flexibility, and
knowledge management in product and organization design.
Strategic Management Journal 17, 63–76 (winter special
issue).
Schilling, M.A., 2000. Towards a general modular systems theory
and its application to interfirm product modularity. Academy of
Management Review 25 (2), 312–334.
Simon, H.A., 1962. The architecture of complexity. Proceedings of
the American Philosophical Society 106 (6), 467–482.
Simpson, T.W., 2003. Product platform design and optimization:
status and promise. ASME 2003 Design Engineering Technical
Conferences, ASME, Chicago, IL.
Sosa, M.E., Eppinger, S.D., Rowles, C.M., 2003. Identifying mod-
ular and integrative systems and their impact on design team
interactions. Journal of Mechanical Design 125, 240–252.
Steward, D.V., 1981. System Analysis and Management: Structure,
Strategy, and Design. Petrocelli Books, New York/Princeton.
Terwiesch, C., Loch, C.H., De Meyer, A., 2002. Exchanging pre-
liminary information in concurrent engineering: alternative
coordination strategies. Organization Science 13 (4), 402–419.
The Economist Intelligence Unit, 2000a. Developments in the global
sports car sector. EIU Motor Business International, pp. 43–69.
The Economist Intelligence Unit, 2000b. Global niche vehicle
markets: prospects to 2005. EIU Motor Business Journal, pp.
150–164.
Thomke, S.H., 1997. The role of flexibility in the development of
new products: an empirical study. Research Policy 26, 105–119.
Thonemann, U.W., Brandeau, M.L., 2000. Optimal commonality in
component design. Operations Research 48 (1), 1–19.
Townsend, J., Kaczmar, M., El-Sayed, M., 2001. Modular door
system for side impact safety of motor vehicles. In: Proceedings
of the 17th International Technical Conference on the Enhanced
Safety of Vehicles (ESV), Amsterdam, The Netherlands.
Tu, Q., Vonderembse, M.A., Ragu-Nathan, T.S., Ragu-Nathan, B.,
2004. Measuring modularity-based manufacturing practices and
their impact on mass customization capability: a customer-
driven perspective. Decision Sciences 35 (2), 147–168.
Ulrich, K.T., 1995. The role of product architecture in the manu-
facturing firm. Research Policy 24, 419–440.
Ulrich, K.T., Eppinger, S.D., 2000. Product Design and Develop-
ment. McGraw-Hill, Boston.
Ulrich, K.T., Pearson, S.A., 1998. Assessing the importance of
design through product archaeology. Management Science 44
(3), 352–369.
Ulrich, K.T., Tung, K., 1991. Fundamentals of product modularity.
Working Paper WP# 3335-91-MSA. MIT Sloan School of
Management, Cambridge, MA, p. 14.
van Hoek, R.I., Weken, H.A.M., 1998. The impact of modular
production on the dynamics of supply chains. The International
Journal of Logistics Management 9 (2), 35–50.
von Hippel, E., 1990. Task partitioning: an innovation process
variable. Research Policy 19 (5), 407–418.
Whitney, D.E., 1988. Manufacturing design. Harvard Business
Review 66, 83–91.
Worren, N., Moore, K., Cardona, P., 2002. Modularity, strategic
flexibility, and firm performance: a study of the home appliance
industry. Strategic Management Journal 23, 1123–1140.
Yassine, A.A., Joglekar, N.R., Braha, D., Eppinger, S.D., Whitney,
D.E., 2003. Information hiding in product development: the
design churn effect. Research in Engineering Design 14, 145–
161.