producing gas from its source - the discovery companies · 6. tissot bp: “recent advances in...
TRANSCRIPT

36 Oilfield Review
Producing Gas from Its Source
Charles BoyerPittsburgh, Pennsylvania, USA
John KieschnickRoberto Suarez-RiveraSalt Lake City, Utah, USA
Richard E. LewisGeorge WatersOklahoma City, Oklahoma, USA
For help in preparation of this article, thanks to BarbaraAnderson, Ridgefield, Connecticut, USA; Walter Arias, Riode Janeiro, Brazil; Keith Greaves, Salt Lake City, Utah;Valerie Jochen, College Station, Texas; Barbara Marin andMark Puckett, Houston, Texas; Camron Miller, Oklahoma City,Oklahoma; and Jeron Williamson, Pittsburgh, Pennsylvania.AIT (Array Induction Imager Tool), ClearFRAC, ECLIPSE,ECS (Elemental Capture Spectroscopy sonde), ELANPlus,FiberFRAC, FMI (Fullbore Formation MicroImager),geoVISION, Platform Express and SpectroLith are marks of Schlumberger.
Shale, the most abundant of sedimentary rocks, is finally getting its due. Shale has
long been regarded as a sealing rock that drillers passed through on their way to
striking pay in sandstone or carbonate formations. However, thanks to the right
combination of geology, economics and technology, organic-rich shales are prompt-
ing US operators to lease drilling rights to thousands of acres in a drive to discover
the next shale-gas province.
Millions of oil or gas wells drilled over the past150 years have penetrated substantial intervals ofshale before reaching their target depths. With somuch shale exposure, is every dry hole actually apotential shale-gas producer? Certainly not. Shalegas is produced only under certain conditions.
Shale, an abundant sedimentary rock ofextremely low permeability, is often considered anatural barrier to the migration of oil and gas. Ingas shales, the gas is generated in place; the shaleacts as both the source rock and the reservoir.This gas can be stored interstitially within thepore spaces between rock grains or fractures inthe shale, or it can be adsorbed to the surface oforganic components contained within the shale.Contrast this to conventional gas reservoirs, inwhich gas migrates from its source rock into asandstone or carbonate formation where itaccumulates in a structural or stratigraphic trap,often underlain by a gas/water contact. It shouldcome as no surprise, therefore, that gas shales areconsidered unconventional reservoirs.
Shale gas is produced from continuous gasaccumulations, according to the US GeologicalSurvey (USGS).1 The USGS lists 16 traits, any orall of which may be present in continuous gasaccumulations.2 Those traits that are particularlycharacteristic of gas shale include regionalextent, lack of an obvious seal and trap, absenceof a well-defined gas/water contact, naturalfracturing, estimated ultimate recovery (EUR)that is generally lower than that of aconventional accumulation and very low matrix
permeability.3 Furthermore, economic productiondepends heavily on completion technology.
Despite their apparent shortcomings, in theUSA, certain shales are being targeted forproduction—those with the right combination ofshale type, organic content, maturity, perme -ability, porosity, gas saturation and formationfracturing. When these formation conditions aretriggered by favorable economic conditions, anunconventional gas play becomes a boom.
Today’s shale-gas plays are taking off, thankslargely to a growing demand for gas, and equally important, to a growing range ofadvanced oilfield technologies. This trend isexpanding in the United States, where rising gasprices and consumption of nearly 23 Tcf [651,820 million m3] of gas per year are fuelingan increase in onshore drilling. E&P companiesare leasing drilling rights to hundreds of thousandsof acres, while advanced drilling and completiontechnologies are helping to extend the boundariesof known shale-gas basins. These plays are alsopushing the boundaries of science, prompting acloser look at this common detrital rock, andspurring development of new instruments andtechniques to evaluate shale resources.
In this article, we discuss the conditionsrequired for shale to generate hydrocarbons, the conditions required to create shale-gasreservoirs, and the technology required to exploitand produce those reservoirs. We will also reviewsome of the practices used in the Barnett Shaleof north-central Texas.
1. Other types of continuous gas resources listed by theUSGS are basin-centered gas, tight gas and coalbed gas.
2. Schenk CJ: “Geologic Definition of Conventional andContinuous Accumulations in Select U.S. Basins—The2001 Approach,” Abstract for AAPG Hedberg ResearchConference on Understanding, Exploring and DevelopingTight Gas Sands, Vail, Colorado, USA, April 24–29, 2005.
3. Matrix permeability refers to the capability of fluids toflow through a rock, primarily by way of intersticesbetween mineral grains that make up the rock, but doesnot include flow through fractures in the rock.
59100schD06R1.qxp:59100schD06R1 11/16/06 7:48 PM Page 36

Autumn 2006 37
The Hydrocarbon SourceShale comprises clay- and silt-sized particles thathave been consolidated into rock layers ofultralow permeability. Clearly, this descriptionoffers little to commend shale as a target forexploration and development. However, someshales are known to contain enough organicmatter—and it doesn’t take much—to generatehydrocarbons. Whether these shales are actuallycapable of generating hydrocarbons, and whether
they generate oil or gas, depends largely on the amount and type of organic material theycontain; the presence of trace elements thatmight enhance chemogenesis; and the magnitudeand duration of heating to which they have been subjected.
Organic matter, the remains of animals orplants, can be thermally altered to produce oil orgas. Before this transformation can take place,however, those remains must first be preservedto some degree. The degree of preservation will
have an effect on the type of hydrocarbons theorganic matter will eventually produce.
Most animal or plant material is consumed byother animals, bacteria or decay, so preservationusually requires quick burial in an anoxicenvironment that will inhibit most biological orchemical scavengers. This requirement is met inlake or ocean settings that have restricted watercirculation, where biological demand for oxygenexceeds supply, which occurs in waters containing
59100schD06R1.qxp:59100schD06R1 11/16/06 7:48 PM Page 37

less than 0.5 milliliters of oxygen per liter ofwater.4 Even in these settings, however,anaerobic microorganisms can feed off theburied organic matter, producing biogenicmethane in the process.
Further sedimentation increases the depth ofburial over time. The organic matter slowly cooksas pressure and temperature increase in concertwith greater burial depths. With such heating,the organic matter—primarily lipids fromanimal tissue and plant matter, or lignin fromplant cells—is transformed into kerogen.5
Depending on the type of kerogen produced,further increases in temperature, pressure andtime may yield oil, wet gas or dry gas (left).
Kerogen, an insoluble material formed bydegradation of organic matter, is the primaryingredient in the generation of hydrocarbons.Kerogen has been classified into four broad groups,each of which has a distinct bearing on what typeof hydrocarbons, if any, will be produced.6
• Type I kerogen: generated predominantly fromlacustrine environments and, in some cases,marine environments. It is derived from algal,planktonic or other matter that has beenstrongly reworked by bacteria and microorgan-isms living in the sediment. Rich in hydrogenand low in oxygen, it is prone to oil produc-tion, but can also produce gas, depending onits stage of thermal evolution. Type I kerogensare not found widely, and are responsible foronly 2.7% of the world’s oil and gas reserves.7
• Type II kerogen: typically generated in reduc-ing environments found in moderately deepmarine settings. This type is derived primarilyfrom the remains of plankton that have beenreworked by bacteria. It is rich in hydrogenand low in carbon. It can generate oil or gaswith progressive heating and maturation. Sul-fur is associated with this type of kerogen,either as pyrite and free sulfur, or in organicstructures of kerogen.8
• Type III kerogen: derived primarily from terres-trial plant debris that has been deposited inshallow to deep marine or nonmarine environ-ments. Type III kerogen has lower hydrogenand higher oxygen content than Types I or II,and consequently generates mostly dry gas.
• Type IV kerogen: typically derived from oldersediments redeposited after erosion. Prior todeposition, it may have been altered by sub-aerial weathering, combustion or biologicaloxidation in swamps or soils. This type of kero-gen consists of residual organic matter withhigh carbon content and no hydrogen. It isconsidered a form of “dead carbon,” with nopotential for generating hydrocarbons.9
38 Oilfield Review
4. Demaison GJ and Moore GT: “Anoxic Environments andOil Source Bed Genesis,” AAPG Bulletin 64, no. 8(August 1980): 1179–1209.
5. Kerogen, which literally means “producer of wax,” wasoriginally used to denote the insoluble organic materialfound in oil shales of Scotland. The term has beenloosely used since its inception, and its meaning hasdevolved to encompass insoluble organic matter insedimentary rock that is the source of most petroleum.For more on kerogen definitions: Hutton A, Bharati S and Robl T: “Chemical and Petrographic Classificationsof Kerogen/Macerals,” Energy & Fuels 8, no. 6(November 1994): 1478–1488.
6. Tissot BP: “Recent Advances in Petroleum GeochemistryApplied to Hydrocarbon Exploration,” AAPG Bulletin 68,no. 5 (May 1984): 545–563.Bordenave M-L: Applied Petroleum Geochemistry. Paris: Editions Technip, 1993.Demaison and Moore, reference 4.
7. Klemme HD and Ulmishek GF: “Effective PetroleumSource Rocks of the World: Stratigraphic Distributionand Controlling Depositional Factors,” AAPG Bulletin 75,no. 12 (December 1991): 1809–1851.
8. Vandenbroucke M: “Kerogen: From Types to Models of Chemical Structure,” Oil & Gas Science andTechnology—Revue de l’Institut Français du Pétrole 58,no. 2 (2003): 243–269.
9. Tissot, reference 6.
10. Baskin DK: “Atomic H/C Ratio of Kerogen as an Estimateof Thermal Maturity and Organic Matter Conversion,”AAPG Bulletin 81, no. 9 (September 1997): 1437–1450.
11. Bitumen, organic matter that is soluble in organicsolvents, is a thermally degraded derivative of kerogen.The exact relationship between kerogen, bitumen andthe hydrocarbons that evolve during heating of organicmatter is still being investigated.
12. Peters KE, Walters CC and Moldowan JM: TheBiomarker Guide: Biomarkers and Isotopes in theEnvironment and Human History, 2nd Edition. Cambridge,England: Cambridge University Press, 2004.
13. Aizenshtat Z, Stoler A, Cohen Y and Nielsen H: “TheGeochemical Sulphur Enrichment of Recent OrganicMatter by Polysulfides in the Solar-Lake,” in Bjorøy M et al (eds): Advances in Organic Geochemistry.Chichester, England: Wiley (1981): 279–288.
14. Peters et al, reference 12.15. Cracking is a process in which high temperature and
pressure act upon large, heavy hydrocarbon molecules,causing them to split into smaller, lighter components.Under such conditions, oil can be transformed into a gas.
16. Peters et al, reference 12.17. Hood A, Gutjahr CCM and Heacock RL: “Organic
Metamorphism and the Generation of Petroleum,” AAPG Bulletin 59, no. 6 (June 1975): 986–996.
18. Fresh cores are most preferred, while outcrop samplesare less desirable, simply because outcrop samples tendto be degraded through weathering.
1.5
Hydr
ogen
/car
bon
ratio
1.0
0.5
0 0.1 0.2 0.3
Type I
Type II
Type III
Type IV
Oxygen/carbon ratio
Dry gas
Increasingmaturation
CO2, H2O
Oil
Wet gas
No hydrocarbonpotential
Products given offfrom kerogen
> Evolution of kerogen. A modified Van Krevelen diagramshows changes to kerogen brought on by increased heatduring burial. The general trend in the thermal transformationof kerogen to hydrocarbon is characterized by generation ofnonhydrocarbon gases, and then progresses to oil, wet gasand dry gas. During this progression, the kerogen losesoxygen primarily as it gives off CO2 and H2O; later, it begins tolose more hydrogen as it evolves hydrocarbons.
59100schD06R1.qxp:59100schD06R1 11/16/06 7:48 PM Page 38

Autumn 2006 39
From this discussion, we can generalize thatmarine or lacustrine kerogens (Types I and II)tend to produce oils, while kerogens of terrestrialorigin (Type III) produce gas. Intermediateblends of kerogens, especially Types II and III,are most common to marine shale facies.
A theme prevailing within this kerogenclassification pertains to hydrogen content.Hydrogen-rich kerogens play a greater role ingenerating oil. Conversely, kerogen with loweramounts of hydrogen will generate gas. Afterhydrogen is depleted from the kerogen,generation of hydrocarbons will cease naturally,regardless of the amount of available carbon.10
Kerogen MaturityGeological processes for converting organicmaterial to hydrocarbons require heat and time.Heat gradually increases over time as the organicmatter continues to be buried deeper underincreasing sediment load; time is measured overmillions of years. Through increasing temper -ature and pressure during burial, and possiblyaccelerated by the presence of catalyzingminerals, organic materials give off oil and gas.This process is complicated and not fullyunderstood; however, the conceptual model isfairly straightforward. Microbial activity convertssome of the organic material into biogenicmethane gas. With burial and heating, theremaining organic materials are transformedinto kerogen. Further burial and heat transformthe kerogen to yield bitumen, then liquidhydrocarbons, and finally thermogenic gas—starting with wet gas and ending at dry gas.11
The process of burial, conversion of organicmatter and generation of hydrocarbons cangenerally be summed up in three broad steps(above right).
Diagenesis begins the process. It is oftencharacterized by low-temperature alteration oforganic matter, typically at temperatures belowabout 50°C [122°F].12 During this stage, oxidationand other chemical processes begin to breakdown the material. Biological processes will alsoalter the amount and composition of organicmaterial before it is preserved. At this point,bacterial decay may produce biogenic methane.With increasing temperatures and changes in pH,the organic matter is gradually converted tokerogen and lesser amounts of bitumen.
During the early phases of diagenesis, sulfurmay be incorporated into the organic matter.Sulfates in seawater provide the oxidant sourcefor biodegradation of organic matter by sulfate-reducing bacterial colonies. These bacteriarelease polysulfides, hydrogen sulfide [H2S] and
native sulfur, which can later recombine withiron in clays to form pyrite [FeS2], or combinewith the organic matter to form otherorganosulfur compounds.13
Catagenesis generally occurs as furtherburial causes more pressure, thereby increasingheat in the range of approximately 50° to 150°C[122° to 302°F], causing chemical bonds to breakdown within the shale and the kerogen.14
Hydrocarbons are generated during this process,with oil produced by Type I kerogens, waxy oilproduced by Type II kerogens, and gas producedby Type III kerogens. Further increases intemperature and pressure cause secondarycracking of the oil molecules, resulting inproduction of additional gas molecules.15
Metagenesis is the last stage, in whichadditional heat and chemical changes result inalmost total transformation of kerogen intocarbon. During this stage, late methane, or drygas is evolved, along with nonhydrocarbon gasessuch as CO2, N2 and H2S. In basins where thesechanges take place, temperatures generallyrange from about 150° to 200°C [302° to 392°F].16
Overall, this process of kerogen alteration,commonly known as “maturation,” produces aseries of progressively smaller hydrocarbonmolecules of increasing volatility and hydrogencontent, eventually arriving at methane gas. Andas the kerogen evolves through thermal maturity,its chemical composition progressively changes,transforming into a carbonaceous residue ofdecreasing hydrogen content, eventually endingas graphite.17
The preservation and maturation of organicmatter are not unique to gas shales. The modelfor generating oil and gas is actually the same forconventional and unconventional resources. Thedifference, however, is location. In conventionalreservoirs, oil and gas migrate from the sourcerock to the sandstone or carbonate trap. Inunconventional shale-gas reservoirs, hydrocarbonsmust be produced straight from the source rock.
Evaluating Source-Rock PotentialSource-rock potential is primarily determinedthrough geochemical analysis of shale samples,often in conjunction with detailed evaluation oflogs from previously drilled wells. Geochemicaltesting is carried out on whole cores, sidewallcores, formation cuttings and outcrop samples.18
The primary aim of testing is to determinewhether the samples are organic-rich andwhether they are capable of generatinghydrocarbons. In general, the higher theconcentration of organic matter in a rock, the
better its source potential (above). A variety ofsophisticated geochemical techniques have beendeveloped to assess the total organic content(TOC) and maturity of samples.
TOC values can be obtained from 1-gram[0.0022-lbm] samples of pulverized rock that aretreated to remove contaminants, then com -busted at 1,200°C [2,192°F]. Carbon con tained
Total Organic Content,Weight %
KerogenQuality
Very poor
Poor
Fair
Good
Very good
Excellent
< 0.5
0.5 to 1
1 to 2
2 to 4
4 to 12
> 12
> Organic content of source rock. The minimumcutoff for shales is usually considered to be 0.5%total organic content (TOC). At the other extreme,some geoscientists assert that it is possible tohave too much organic matter. Excess kerogencan fill pore spaces that might otherwise beoccupied by hydrocarbons.
Biom
arke
rs
Oil
Wet gas
Dry gas
Graphite
Hydrocarbons generated
Biogenic methane
Incr
easi
ng d
epth
and
tem
pera
ture
Met
agen
esis
Cata
gene
sis
Diag
enes
is
Imm
atur
e zo
neOi
l win
dow
Gas
win
dow
> Thermal transformation of kerogen. Generationof hydrocarbons in source rocks is controlledprimarily by temperature, as the kerogen contentevolves from reactive carbon to dead carbon.Gas is given off during early diagenesis, primarilythrough biologic activity. Catagenesis takesplace with further burial, during which oil andgas are given off. With increasing depth andtemperature, any remaining oil is cracked, givingoff gas.
59100schD06R1.qxp:59100schD06R1 11/16/06 7:48 PM Page 39

in the kerogen is converted to CO2 or CO. Theevolved carbon fractions are measured in aninfrared cell, and converted to TOC, recorded as mass weight percent of rock. If this initialscreening test detects samples of sufficientorganic richness, they will be subjected toadditional testing.
To further characterize organic richness,many geochemical laboratories use aprogrammed pyrolysis technique developed bythe Institut Français du Pétrole.19 This method,which has become an industry standard forgeochemical testing of source rock, requires only50 to 100 mg [0.00011 to 0.00022 lbm] ofpulverized rock, and can be carried out in about20 minutes. Each sample is heated in controlledstages through a pyrolysis test. During the first
stage of heating to 300°C [572°F], freehydrocarbons in the rock are released from thematrix.20 As heat increases during the secondstage to 550°C [1,022°F], volatile hydrocarbonsformed by thermal cracking are released. Inaddition to hydrocarbons, the kerogen gives offCO2 as temperatures climb from 300°C to 390°C[572°F to 734°F].21 Organic compounds releasedthrough heating are measured by a flame-ionization detector.
These measurements, along with temperature,are recorded on a chart and show three distinctpeaks (above). These peaks give geochemistsinsight into the relative abundance of hydrogen,carbon and oxygen in the kerogen.22 With thisinformation, geochemists can determine kerogentype and potential for oil and gas generation.
The temperature at which the maximumrelease of hydrocarbons is detected correspondsto the tip of the S2 peak, and is called Tmax. Thethermal maturation of a sample can be tied tothe value of Tmax.
Vitrinite reflectance is another diagnostictool for assessing maturation. A key componentof kerogen, vitrinite is a shiny substance formedthrough thermal alteration of lignin andcellulose in plant cell walls. With increasingtemperature, vitrinite undergoes complex,irreversible aromatization reactions, resulting inincreased reflectance.23 Vitrinite reflectance wasfirst used to diagnose the rank, or thermalmaturity, of coals. This technique was latercarried over to evaluate thermal maturity ofkerogens. Because reflectance increases withtemperature, it can be correlated to temperatureranges for hydrocarbon generation. These rangescan be further divided into oil or gas windows.
Reflectivity (R) is measured through amicroscope equipped with an oil-immersionobjective lens and photometer.24 Vitrinite-reflectance measurements are carefullycalibrated against glass- or mineral-reflectancestandards, and reflectance measurementsrepresent the percentage of light reflected in oil(Ro). When a mean value of vitrinite reflectivityis determined from multiple samples, it isdesignated as Rm.
As an indicator of thermal maturity, Ro valuesvary from one organic type to another. Thismeans that the onset of hydrocarbon generationin Type I organic matter may be different than inType II organics. And because the temperaturerange of the gas window extends beyond that ofoil, Ro values for gas will show a correspondingincrease over those of oil. Thus, high maturationvalues (Ro>1.5%) generally indicate thepresence of predominantly dry gas; intermediatematuration values (1.1%<Ro<1.5%) indicate gaswith an increasing tendency toward oilgeneration at the lower end of the range. Wet gascan be found still lower in the range(0.8%<Ro<1.1%). Lower values (0.6%<Ro<0.8%)indicate predominantly oil, while Ro<0.6% pointsto immature kerogen.
By themselves, Ro values can sometimes bemisleading, and should be weighed along withother measurements. Other common indicatorsof maturity involve the thermal alteration index(TAI), based on microscopic examination ofspore color; pyrolysis temperature evaluation;and, to a lesser extent, conodont alteration index(CAI), based on examination of tiny fossilized
40 Oilfield Review
19. Espitalie J, Madec M, Tissot B, Mennig JJ and Leplat P:“Source Rock Characterization Method for PetroleumExploration,” paper OTC 2935, presented at the 9thAnnual Offshore Technology Conference, Houston,May 2–5, 1977.
20. Other variations on this method use slightly differenttemperature ranges.
21. Alixant J-L, Frewin N, Nederlof P and Al Ruwehy N:“Characterization of the Athel Silicilyte SourceRock/Reservoir: Petrophysics Meet Geochemistry,”Transactions of the SPWLA 39th Annual LoggingSymposium, Keystone, Colorado, May 26–29, 1998,paper LL.
22. Peters KE: “Guidelines for Evaluating Petroleum SourceRock Using Programmed Pyrolysis,” AAPG Bulletin 70,no. 3 (March 1986): 318–329.
23. Peters KE and Cassa MR: “Applied Source RockGeochemistry,” in Magoon LB and Dow WG (eds): The Petroleum System—From Source to Trap: AAPG Memoir 60. Tulsa: AAPG (1994): 93–120.
24. The terms reflectance and reflectivity tend to be usedinterchangeably, with the former being more common.
However, reflectivity is a measure of reflectance.Reflectance is a ratio of the light reflected from asurface to the light directed onto that surface—the ratioof reflected radiation to incident radiation. This valuecan change, up to a point, depending on the thickness,and hence, opacity, of a surface. If that surface is thickenough to prevent light from being transmitted throughthe surface, then reflectance reaches a maximum. Thisis the reflectivity of a surface.
25. For well over a century, tiny, cone-shaped fossils knownas conodonts were a mystery for paleontologists. Foundin Late Cambrian and Triassic formations, conodontswere long suspected of being teeth. In the early 1990s,this supposition was verified through the aid of electronmicroscopy. For more on conodont research: Zimmer C:“In the Beginning Was the Tooth,” Discover 14, no. 1(January 1993): 67–68.
26. For more on SpectroLith technology: Barson D,Christensen R, Decoster E, Grau J, Herron M, Herron S,Guru UK, Jordán M, Maher TM, Rylander E and White J:“Spectroscopy: The Key to Rapid, Reliable PetrophysicalAnswers,” Oilfield Review 17, no. 2 (Summer 2005): 14–33.
Gas
volu
me
S1 S2 S3
Tmax
• Production index (PI) S1/ (S1 + S2) Indicator of thermal maturity
• Hydrogen index (HI) S2/ (S1 + S2) Indicator of unoxidized hydrogen in the system
• Oxygen index (OI) S3/ (S1 + S2) Indicator of gas richness
• Tmax Temperature of maximum hydrocarbon generation
300°C 550°C
> Gas peaks versus temperature. Rock samples are heated in two stages. The S1peak represents milligrams of free hydrocarbons that can be thermally distilledfrom one gram of rock during the first stage of heating to about 300°C. The S2peak records hydrocarbons generated by thermal cracking of kerogen during thesecond stage of heating up to about 550°C. This curve represents the residualpetroleum potential of the rock, or the quantity of hydrocarbons that the rockcould still produce if burial and maturation continue. The S3 peak chartsmilligrams of CO2 produced by the kerogen as it is heated. Tmax values give anapproximate indication of source-rock maturity.
59100schD06R1.qxp:59100schD06R1 11/16/06 7:48 PM Page 40

Autumn 2006 41
teeth.25 Owing to the popularity of vitrinitereflectance, these other indicators are oftencorrelated to Ro values.
Other shale properties can be estimatedfrom well logs, which in some cases, producedistinctive signatures (above). High gamma rayactivity is thought to be a function of kerogen inthe shale. Kerogen generally creates a reductiveenvironment that drives the precipitation ofuranium, which influences the gamma raycurve. Resistivity may be high because of highgas saturations, but varies with fluid contentand clay type. Bulk densities are often lowbecause of clay content and the presence ofkerogen, which has a low specific gravity of 0.95to 1.05 g/cm3.
Well logs are also used to ascertain thecomplex mineralogy of a shale and to quantifythe amount of free gas in the pores of the sourcerock. Using a combination of conventional triple-combo and geochemical logs, Schlumbergerpetrophysicists can determine the organiccarbon content of the shale and calculate foradsorbed gas. Geochemical logs also enablepetrophysicists to differentiate types of clays andtheir respective volumes, information critical forcalculating producibility and for determiningwhich fluid to use during subsequent hydraulicfracturing treatments.
In the Barnett Shale and beyond to otherbasins, the ECS Elemental Capture Spectroscopysonde and Platform Express integrated wirelinelogging tool are being used in conjunction with
advanced interpretation techniques to calculategas saturations and gas in place, and tocharacterize lithology. The ECS sonde usesneutron-induced, capture gamma ray spectro -scopy to measure elemental concentrations ofsilicon, calcium, sulfur, iron, titanium, gadolinium,chlorine, barium and hydrogen (above).
These data are used with interpretationtechniques such as SpectroLith lithologyprocessing of spectra from neutron-inducedgamma ray spectroscopy tools. The SpectroLithtechnique generates a log that displays the clay,quartz-feldspar-mica, carbonate, and pyrite oranhydrite fractions of the formation.26 Theelements used in SpectroLith processing do notoccur in kerogen; hence, the lithology is
Washout
Gamma Ray
Bit Size
in.6.3 16.3
Caliper
6 16in.
0.2 2,000ohm.m
0.2 2,000ohm.m
0.2 2,000ohm.m
0.2 2,000ohm.m
0.2 2,000ohm.m
AIT Induction Resistivity 90*
0.4 –0.1ft3/ft3
Neutron Porosity
Density Porosity
0.4 –0.1ft3/ft3
Photoelectric Effect
0 20
Typicalshale
Organic-richgas shale
AIT Induction Resistivity 10
AIT Induction Resistivity 20
AIT Induction Resistivity 30
AIT Induction Resistivity 60
* Depth of investigation, inches
> Gas shale log. Gas shales are characterized by high gamma ray activity,high resistivity, low bulk density and low photoelectric effect comparedwith normal shales.
Acquisition cartridge
Bismuth-germanium-oxidecrystal and photomultiplier tube
Electronics
Heat sink
Americium-berylliumsource
> ECS Elemental Capture Spectroscopy tool. TheECS sonde records and analyzes the gamma rayspectra induced by neutron interactions with theformation. From these measurements, accurateestimations of formation components, includingclay, carbonate, anhydrite, quartz, feldspar andmica, can be obtained.
59100schD06R1.qxp:59100schD06R1 11/16/06 7:48 PM Page 41

accurately represented but does not include theorganic matter. By contrast, the logs measuredwith a Platform Express tool are affected bykerogen. For example, the gamma ray activity forkerogen is generally quite high because of thepresence of uranium in a reductive environment,as described previously. Relying only on thegamma ray log to quantify clay would result in anoverestimation of clay content. However, usingthe combination of ECS and Platform Expressinputs will limit the potential for lithologic errorsand allow for quantification of kerogen andporosity through differences between ECS andPlatform Express measurements (below).
The Barnett Shale montage shows theintegration of logging data, lithology andmineralogy interpretations and fluid evalua tions.This montage of ECS and Platform Expressmeasurements helps the operator to quantify gasin place and determine where to placeperforations based on mineralogy and perme -ability. The interpreted mineralogy and porosityare also helpful in planning where to land lateralwellbores. In some areas, operators use themineralogy curve to identify quartz, calcite ordolomite in the shale. These minerals increase
formation brittleness, thereby improvingfracture initiation in horizontal wells.
These analyses form the basis for mapsshowing stratigraphy, kerogen maturity, andtemperature versus depth. When complementedby mud-log evaluation and petrophysical analysis,this information helps geoscientists characterizevariability in kerogen maturity and explore forlocations where commercial gas accumulationsmay exist. After drilling begins, newly acquireddrill cuttings or cores are tested to evaluate shalemineralogy and organic content.
Evaluating Gas in Place Long-term shale-gas production at economicrates depends primarily on the volume of gas inplace, completion quality and matrix perme -ability. Gas in place is often the critical factor forevaluating the economics of a play, and can takeprecedence over matrix permeability andcompletion quality.
Extensively developed basins, in which shalegas represents the current endgame in produc -tion, usually offer a plethora of data from fieldstudies and previously drilled wells. Therefore,prior to drilling new wells, historical records such
as outcrop sections, geological field maps oforganic-rich shales and data from earlier wellscan be instrumental in developing prelim inaryestimates of shale gas in place. In particular, mudlogs from earlier wells point to gas showsencountered at depth and record chromato -graphic analysis and flame ionization detectorreadings of the gas, in addition to lithology.Formation cuttings, which are customarily sieved,washed and dried before being collected insample envelopes, are often retained for futureanalysis. When available, these cuttings can besent for laboratory analysis of organic content and maturity.
During the early stages of a gas shale drillingcampaign, coring will play a significant role in aformation-evaluation program. Shale coresprovide direct measurements that geoscientistsuse to determine gas in place.
Gas is contained within pore spaces andfractures, or attached to active surface sites onthe organic matter contained within a shale (nextpage). Together, this combination of interstitialgas and adsorbed gas make up the total gascontent of a shale. By ascertaining proportions ofinterstitial and adsorbed gas under reservoirconditions, geoscientists can calculate gas inplace using a variety of techniques.
Starting at the wellsite, freshly cut core isprepared for shipment to a core-analysislaboratory. Segments of this core may be sealedin canisters and sent to specially equippedlaboratories for canister desorption tests. Thesetests measure the volume and composition of gasreleased from the core as a function of time.Canister desorption measures total gas, but doesnot measure proportions of adsorbed andinterstitial components, or assess their pressuredependence. Therefore, other measurementsmust be brought into play.
Laboratory personnel place finely crushedshale into a sample chamber, then pressurize it.Holding the sample chamber at constantreservoir temperature, analysts can developadsorption isotherms that establish realistic PVTrelationships for the shale gas (see “TheLangmuir Isotherm,” page 44).
Another specialized technique for analyzinglow-permeability, low-porosity formation sampleswas developed by TerraTek, a Schlumbergercompany.27 The proprietary pyrolysis technique,
42 Oilfield Review
27. The TerraTek facility in Salt Lake City, Utah, has beenestablished as the Schlumberger GeomechanicsLaboratory Center of Excellence.
Kerogen
> Scanning electron microscope photograph of kerogen in shale. The presence of organic mattercontributes to the accumulation of hydrocarbons in shales in the form of adsorbed gas on surface-active sites within the porous organic matter. The kerogen also creates mixed-wettability conditions ofthe shale matrix, whereby shale regions close to kerogen sites are predominantly oil wet, and regionsaway from kerogen sites are water wet. (Photograph courtesy of Barbara Marin, TerraTek.)
59100schD06R1.qxp:59100schD06R1 11/16/06 7:48 PM Page 42

Autumn 2006 43
Caliper
4 14 0.2 2,000
Gamma Ray
0.2 2,000ohm.m
Resistivity Deep
0 150
150 300
in. ohm.m
Gamma Ray
gAPI
gAPI
Resistivity Shallow Density Porosity
0.4 -0.1ft3/ft3
0.4 -0.1ft3/ft3
Neutron Porosity
ELANPlus Volumes
1 0vol/vol
ChloriteIllite
MontmorilloniteBound Water
QuartzPyrite
KerogenCarbonate
CalciteDolomite
GasWater
Moved HydrocarbonMoved Water
0.2 0ft3/ft3
Total Porosity Water Saturation
HydrocarbonWater
Free Water0.2 0ft3/ft3
Effective Porosity
0.2 0ft3/ft3
Bound Water0.2 0ft3/ft3
Bound Water
Water
01 ft3/ft3 0 0.25g/g
ELANPlus TOC
Total OrganicCarbon (TOC)
Shale Permeability
1e-051 mD
0 400
Adsorbed Gas
0 400scf/tonUS
scf/tonUS
Total Gas
Free Gas0 150Bcf/mi2
Gas in Place
0 150Bcf
AdsorbedGas in Place
Washout
> Montage of Barnett Shale log data derived from Platform Express and ECS logs. The first three tracks present measurements from the PlatformExpress tool. Track 4 presents results of a generalized gas shale petrophysical model based on Platform Express and ECS data that have beenprocessed through ELANPlus advanced multimineral log analysis. This program helps to quantify mineralogy, kerogen and gas-filled and water-filled porosity. The remaining tracks quantify total and effective porosity, water saturation, TOC content, matrix permeability, gas in place andcumulative gas. Gas in place and cumulative gas values are calculated for both free and adsorbed gas. Track 4, in particular, illustrates some of the factors that underlie the success of this shale-gas play. In addition to kerogen content and gas-filled porosity, the Barnett Shale containssignificant amounts of quartz and carbonates, which make the formation more brittle, and thus easier to fracture. Clay mineralogy is alsodominated by illite, which tends to be relatively nonreactive to stimulation fluids.
59100schD06R1.qxp:59100schD06R1 11/16/06 7:48 PM Page 43
known as Tight Rock Analysis (TRA), providescomprehensive evaluation of gas shale samples(next page, top).
Adsorption isotherm measurements allow adirect evaluation of the maximum adsorption
capacity of gas by organic matter, as a function ofreservoir pressure.28 TRA gas-filled porositymeasurements provide a direct measurement ofinterstitial gas as a function of reservoir pressure.When combined with canister desorption
measurements, adsorption isotherms and TRAgas-filled porosity provide a complete descriptionof gas in place. This information provides criticalinputs for reservoir modeling, and indicates therelative contributions of interstitial and adsorbedgas to the induced-fracture system, as a functionof drawdown and depletion.
Experience gained through core analysis hasshown that mature, thermogenic shales arepredominantly saturated by interstitial gas, witha fraction of adsorbed gas that varies from 50% to10%. By contrast, immature, biogenic shales arepredominantly saturated by adsorbed gas withsmaller amounts of interstitial gas. Also, variousproportions of water, gas and mobile-oilsaturations occupy the pore spaces of shales.
The best reservoir-quality shales typicallycontain reduced oil and water saturations, highinterstitial gas saturation and thus higherrelative permeability to gas. Correspondingly,these shales have moderate to high organiccontent, a high degree of organic maturation,and texture that reflects a preservation ofporosity and permeability during burial. Thus, toevaluate gas in place, laboratory measurementsmust provide direct evaluation of gas and liquidsaturations, porosity, matrix permeability,organic content and maturation, as well as thecapacity of the organic matter to adsorb gas at aconstant reservoir temperature as a function ofreservoir pressure.
Finally, log analyses, particularly whencalibrated to actual measurements of reservoirproperties supplied through core analysis,provide the basis for reliable predictions of gas inplace through porosity and gas-saturationcalculations. Log-based models can also be usedto predict properties in adjacent wells acrossregions of limited lateral extent, thus facilitatingthe evaluation of basin-scale heterogeneity.
Evaluating Reservoir PotentialEvaluating the reservoir potential of a gas shaleinvolves weighing positive or negative contribu -tions from a variety of factors, including shalemineralogy and texture, clay maturity, kerogentype and maturity, fluid saturation, adsorbed andinterstitial storage mechanisms, burial depth,temperature and pore pressure. In particular,porosity, fluid saturation, perme ability andorganic content are important for determining
44 Oilfield Review
28. Measurements can be conducted with a single gas,usually methane, or with a gas mixture that isrepresentative of the mixture obtained by analysis of the produced gas.
29. Schenk, reference 2.
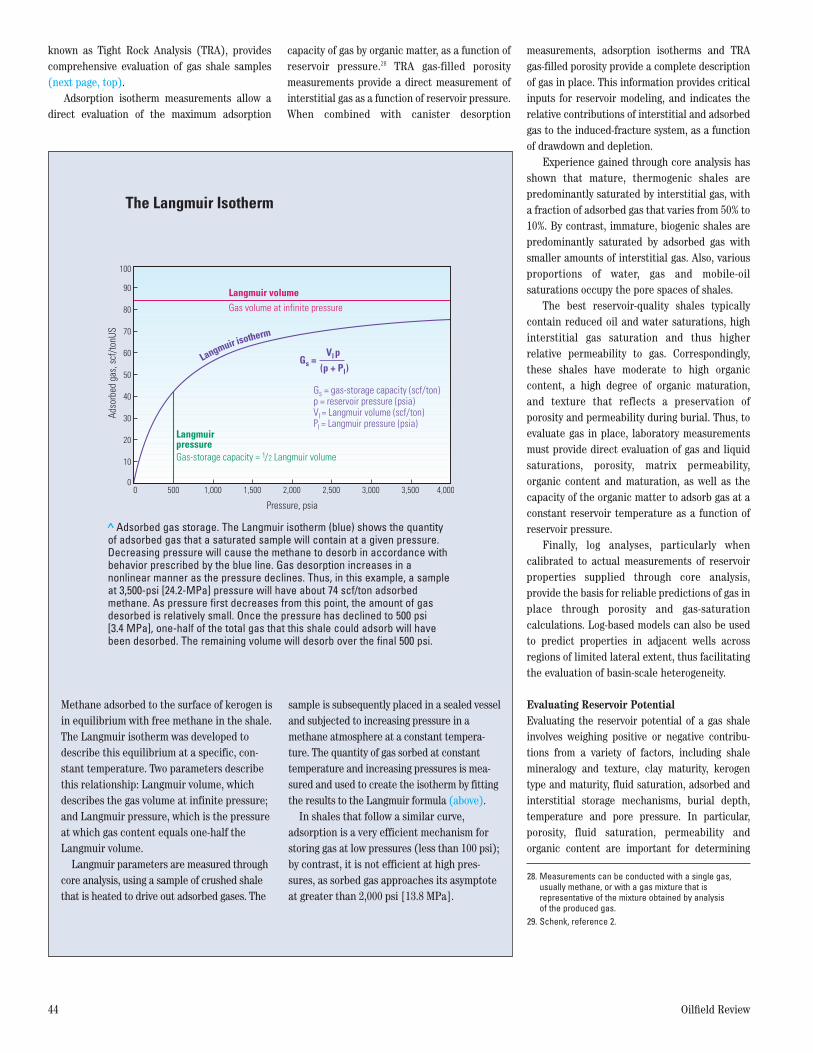
Methane adsorbed to the surface of kerogen isin equilibrium with free methane in the shale.The Langmuir isotherm was developed todescribe this equilibrium at a specific, con-stant temperature. Two parameters describethis relationship: Langmuir volume, whichdescribes the gas volume at infinite pressure;and Langmuir pressure, which is the pressureat which gas content equals one-half theLangmuir volume.
Langmuir parameters are measured throughcore analysis, using a sample of crushed shalethat is heated to drive out adsorbed gases. The
sample is subsequently placed in a sealed vesseland subjected to increasing pressure in amethane atmosphere at a constant tempera-ture. The quantity of gas sorbed at constanttemperature and increasing pressures is mea-sured and used to create the isotherm by fittingthe results to the Langmuir formula (above).
In shales that follow a similar curve,adsorption is a very efficient mechanism forstoring gas at low pressures (less than 100 psi);by contrast, it is not efficient at high pres-sures, as sorbed gas approaches its asymptoteat greater than 2,000 psi [13.8 MPa].
Gs =Vl p
(p + Pl)Langmuir isotherm
Adso
rbed
gas
, scf
/ton
US
100
90
80
70
60
50
40
30
20
10
00 500 1,000 1,500 2,000 2,500 3,000 3,500 4,000
Pressure, psia
Langmuirpressure
Langmuir volumeGas volume at infinite pressure
Gas-storage capacity = 1/2 Langmuir volume
Gs = gas-storage capacity (scf/ton) p = reservoir pressure (psia) Vl = Langmuir volume (scf/ton) Pl = Langmuir pressure (psia)
> Adsorbed gas storage. The Langmuir isotherm (blue) shows the quantityof adsorbed gas that a saturated sample will contain at a given pressure.Decreasing pressure will cause the methane to desorb in accordance withbehavior prescribed by the blue line. Gas desorption increases in anonlinear manner as the pressure declines. Thus, in this example, a sampleat 3,500-psi [24.2-MPa] pressure will have about 74 scf/ton adsorbedmethane. As pressure first decreases from this point, the amount of gasdesorbed is relatively small. Once the pressure has declined to 500 psi [3.4 MPa], one-half of the total gas that this shale could adsorb will havebeen desorbed. The remaining volume will desorb over the final 500 psi.
The Langmuir Isotherm
59100schD06R1.qxp:59100schD06R1 11/21/06 6:34 PM Page 44

Autumn 2006 45
whether a shale shows potential for furtherdevelopment (right).
Reservoir evaluation is complicated by thefact that shale gas is produced from formationsthat are notoriously heterogeneous. Shalequalities can vary abruptly in vertical and lateraldirections, with intervals of high reservoirpotential juxtaposed to sections of poorer quality.And reservoir-quality shales may expand or pinchout laterally, within relatively short distances,while gross shale thickness remains unchanged.Characterizing reservoir quality and under -standing the underlying depositional andenvironmental causes of local heterogeneity thuspose fundamental challenges to the explorationand production of shale-gas reservoirs.
Geologists evaluate heterogeneity at awellbore scale by analyzing cores and well logs.Shale typing by petrological analysis of drillcuttings, complemented by TOC measurementsand log analysis from multiple wells, allowspreliminary evaluation of reservoir potentialwithin a basin. Through analysis of thesemeasured data, geoscientists can determine gasin place, reservoir potential, and its variability as
a function of depth. These data form the basis forestimating the potential for economic production,identifying reservoir units to be targeted forcompletion, and developing cost-benefit assess -ments of lateral and vertical completions.
The greatest limit to gas production fromshale may lie in the pore throats of the rock.TerraTek researchers have compared wellproductivity to matrix-permeability values over avariety of shale types and basins. Empiricalevidence from these studies suggests thatpermeabilities below 100 nanodarcies define alower limit to economic production of shale-gasplays. This limit appears to be independent ofcompletion quality and gas content.
Ultimately, the key to finding gas shalereservoirs lies in pinpointing the concurrence offavorable geologic parameters such as thermalhistory, gas content, reservoir thickness, matrixrock properties and fractures.29
Developing the ReservoirTo produce gas to surface, rock must containpathways sufficient to promote migration of thegas into a wellbore. In shales, low permeability of
the rock matrix can be compensated somewhatthrough permeability caused by fractures in thesource rock. Operators who target shales forproduction must therefore consider systempermeability; that is, the combined permeabilityof a shale’s matrix and its natural fractures.
To expose more wellbore to the reservoir andtake advantage of natural fractures in a field,operators are turning increasingly to horizontaldrilling (below). This technique, though not new to the industry, has been instrumental in
123456
2.482.4362.482.3272.3732.461
g/cm3 g/cm3 g/cm3% of bulk
volume nD wt %
WaterSaturation
GasSaturation
Mobile OilSaturationPorosity
Dry GrainDensity
GrainDensity
BulkDensity
SampleNumber
Gas-FilledPorosity
BoundHydrocarbon
SaturationBound
Clay Water Permeability TOC
2.6222.5592.6332.4872.5392.605
2.6452.5842.6522.5092.5582.63
6.656.266.877.747.586.87
15.1618.515.4313.0911.1716.26
81.476.4483.983.0285.9280.42
3.435.050.663.872.93.32
5.424.795.776.436.525.53
0.51.290.50.730.340.99
6.217.036.86.672.637.19
270230270347359298
3.776.753.367.415.955.04
% of porevolume
% of porevolume
% of porevolume
% of bulkvolume
% of bulkvolume
% of bulkvolume
> TerraTek Tight Rock Analysis technique. Specialized core measurements characterize grain density, porosity, fluid saturations, permeability and TOC ofgas shales. In this particular dataset, gas saturation, porosity and permeability measurements indicate good reservoir potential.
Parameter Minimum Value
Porosity
<45%
<5%
>100 nanodarcies
>2%
> 4%
Water saturation
Oil saturation
Permeability
Total organic content
> Critical reservoir parameters. Experience inmultiple US shale-gas basins has shown thatshale-gas reservoirs must meet or exceed theseparameters to be commercially viable.
Bedded pyrite nodules
Transversely orienteddrilling-induced fractures
Bedding plane
Natural fractures traversingthe complete borehole
Bedded pyrite nodules
Bedding plane
> Drilling through fractures. The FMI Fullbore Formation MicroImager log shows fractures and bedding features encountered by a horizontal well. Drilling-induced fractures appear along the top and bottom of the well path, but stop along the sides of this wellbore, where stress is highest. Preexisting naturalfractures penetrated by the wellbore appear as vertical lines that cut across the top, bottom and sides of the wellbore. Darker pyrite nodules are quitedistinctive, and are seen running parallel to bedding planes.
59100schD06R1.qxp:59100schD06R1 11/16/06 7:48 PM Page 45

expanding the success of shale-gasdevelopments. The role of horizontal drilling isclearly demonstrated by the growth ofdevelopment in the Barnett Shale in the FortWorth basin of north central Texas. Starting witha vertical well drilled by Mitchell Energy in 1981,it took 15 years to surpass 300 wells in this play.In 2002, Devon Energy, after acquiring Mitchell,began drilling horizontal wells. By 2005, morethan 2,000 horizontal wells had been drilled.Furthermore, experience in the Barnett Shalehas shown that horizontal wells in this playattain approximately three times the EUR ofvertical wells, for only about twice the cost.30
Other technologies have been vital todeveloping the play. Using 3D seismicinterpretation, operators are better able to planhorizontal wellbore trajectories. This technologyhas helped operators expand the Barnett Shaleplay into areas previously thought unproductivedue to a water-bearing, karsted Ellenburgerdolomite that underlies the shale in many areas.
Operators generally seek to open up more ofthe shale surface area to production by drillingperpendicular to the direction of maximumhorizontal stress, thereby increasing thelikelihood of crossing fractures. However,conventional directional drilling techniques canbe hampered by torque and drag, which aregenerated by sliding and rotating as drillers buildinclination and azimuth in their wellbores. Inmore ambitious well trajectories, torque anddrag can limit lateral reach and make it difficultto log the well. Rotary steerable systems havebeen used to circumvent these problems whileproducing straighter, less tortuous wellbores.31 Insome cases, inclination varies by less than 0.5°from heel to toe.32
To address the problem of logging in horizontalwells, LWD assemblies, such as the geoVISIONimaging-while-drilling service, have beenemployed in some wells. This tool producesresistivity images and wellbore formation-dipanalysis along the length of the wellbore. Imaginglogs can provide structural, stratigraphic andmechanical-property information for opti mizingsubsequent well completions. For example,imaging enables comparison of natural formationfractures to drilling-induced fractures, helping theoperator determine optimal targets for perforatingand stimulating the well. In the Barnett Shale play,images from these logs are used to identifysubseismic faults and associated swarms of natural fractures known to produce water from the underlying karsted Ellenburger dolomite.33
For infill-drilling applications, boreholeimages are helpful in identifying hydraulicfractures from offset wells. This allows operatorsto focus stimulation treatments on parts of thereservoir that have not been fractured previously.The presence and orientation of drilling-inducedfractures, or the absence of such fractures, canprove useful in ascertaining variability in stressand mechanical properties along the length ofthe lateral wellbore. This information has helpedreduce completion difficulties and associatedcosts in the Barnett Shale.34
Shale Reservoir SimulationMost reservoir simulators model conventionalgas reservoirs, where gas is stored in a single-porosity system. Gas shales require a differentapproach. Finite-difference simulators, such asthe Shale Gas module in ECLIPSE reservoirsimulation software, consider the gas stored in
pore spaces within a tight shale matrix, the gasadsorbed on organics within a shale, and the freegas contained in natural fractures within theshale formation.
46 Oilfield Review
30. Waters G, Heinze J, Jackson R, Ketter A, Daniels J and Bentley D: “Use of Horizontal Well Image Tools to Optimize Shale Reservoir Exploitation,” paper SPE 103202, presented at the SPE Annual TechnicalConference and Exhibition, San Antonio, Texas,September 24–27, 2006.
31. For more on rotary steerable systems: Williams M:“Better Turns for Rotary Steerable Drilling,” OilfieldReview 16, no. 1 (Spring 2004): 4–9.
32. In a directional well, the heel is found between thevertical and horizontal sections of the well, while the toe lies at the other end of the horizontal section.
33. Waters et al, reference 30.34. Waters et al, reference 30.35. Slickwater treatments use a low-viscosity, water-base fluid
to transport proppant into hydraulically created fractures. 36. Waters et al, reference 30.
Gas
pres
sure
, psi
a
4,000
3,500
3,000
2,500
2,000
1,500
1,000
500
0
> ECLIPSE reservoir simulation. The modeled shale horizon is color-coded to show pressure-depletiontrends after 15 years of production from nine vertical gas wells. Hydraulically induced and naturallyoccurring fractures produce a web of interconnected pathways through which gas is produced fromthe formation to the wells.
59100schD06R1.qxp:59100schD06R1 11/16/06 7:48 PM Page 46

Autumn 2006 47
These reservoir simulators allow operators toincorporate everything they know about the rockas they build single-well and full-field models oftheir reservoirs. Reservoir characteristics suchas net-pay thickness, reservoir pressure,temperature, gas content, water saturation,natural fracture geometries, matrix porosity, TOCand methane adsorption isotherm functions canbe easily factored into the models. With thisinformation, operators can estimate gas in placefor their reservoirs.
Matrix permeability measurements andhydraulic-fracture geometries resulting frompost-stimulation modeling and microseismicinterpretation can also be incorporated into themodel. Bulk system permeability can beestimated by utilizing the model to calibrate toobserved gas and water production. By building amodel that accurately matches actual wellproduction performance, the operator canpredict estimated ultimate recovery for an area(previous page).
Reservoir simulation is particularly impor -tant for its capacity to perform various types ofsensitivity analyses. These analyses includeoptimal well design, weighing horizontal versusvertical trajectories; optimal stimulation design,regarding number and size of treatments; andoptimal drilling patterns, based on differentspacing scenarios. These analyses provideoperators with the opportunity to make futuredevelopment decisions on the basis of science,engineering and economics.
Shale StimulationNatural fractures, while beneficial, usually do notprovide permeability pathways sufficient tosupport commercial production in gas shales.Most gas shales require hydraulic fracturing.
Fracturing exposes more shale to thepressure drop provided by a wellbore. Withclosely spaced hydraulic fractures in the shalealong a horizontal lateral wellbore, gas can beproduced even faster.
Operators frequently pump low-viscosity,water-base slickwater fluid and proppanttreatments in moderately deep, high-pressure
shales, typically found at depths between 5,000to 10,000 ft [1,524 to 3,048 m].35 In shallowershales or those with low reservoir pressures,nitrogen-foamed fracturing fluids are commonlypumped. The fluid, pumped under high pressure,fractures the shale. These fractures can extendthrough the shale for a thousand or more feetbeyond the wellbore. In theory, the grains ofproppant wedge into the fractures, holding themopen once pumping has stopped.
In the Barnett Shale, stimulation treatmentshave evolved throughout the life of this play,starting with small CO2 or N2 foam treatmentsperformed on the lower Barnett until the mid-1980s.36 Operators then began employingmassive hydraulic fracturing treatments (below).These treatments averaged 600,000 galUS [2,270 m3] of crosslinked gel and 1,400,000 lbm[635,000 kg] of sand proppant. Despite boostingEUR, high completion costs and low gas pricesresulted in marginal economics for the play.Operators continued to perform massive fracsuntil 1997, when Mitchell Energy began
> Barnett Shale massive frac job. In this single-stage stimulation treatment, more than 100 frac tanks full of water have been trucked in and arrangedalong the perimeter of the wellsite. Pumping units, manifolds and monitoring equipment are placed around the wellhead near the center of the site. Ascompletion processes evolve, fewer resources are now required. The wellbore is now divided into small intervals and stimulated in multiple stages. Thenewer approach has improved well performance and reduced completion costs.
59100schD06R1.qxp:59100schD06R1 11/16/06 7:48 PM Page 47

evaluating slick water stimulation treatments.These treatments establish long and widefracture fairways using roughly twice the volumeof the massive cross linked fluid fracs, whilepumping less than 10% of the proppant volume.Though well performance was slightly betterthan that of massive frac treatments, thestimulation costs were reduced by about 65%.These treatments have become the norm in theBarnett Shale (above). Furthermore, thereduction in stimulation costs allowed operatorsto complete the Upper Barnett intervals wherepresent, thus improving EURs by roughly 20% or more.
Although water and sand are commonly usedin frac jobs in the Barnett Shale, some operatorsin other plays find that not enough proppant hasbeen transported into their induced fractures.During such fracturing jobs, the fluid might notcreate fractures wide enough to accommodatethe grains of proppant. In other cases, grainspumped into a fracture quickly settle out ofsuspension from the fluid that transported them.In either case, the result is a smaller fracturethat provides less permeability than intended.
To overcome these problems, some operatorsemploy ClearFRAC polymer-free frac fluid or FiberFRAC fiber-based fracturing fluid
tech nology to keep the proppants suspended forextended periods of time. ClearFRAC fluids areused to transport proppant deep into fractures.Except for the proppant itself, the ClearFRACfluid is free of solids that might reduce fracturepermeability, and has been shown to becompatible with organic-rich shales.37 Fiberscontained in the FiberFRAC fluid keep proppantgrains in suspension until the fracture closesonto the grains, locking them in place. The fiberseventually dissolve, increasing flow through thefracture. Both fluids keep proppant in thefractures as they slowly close down. Thusfractures stay open once the well is placed on production.
In the late 1990s, Mitchell began toexperiment with additional stimulation treat -ments. Refracturing has been most successful inwells that were originally completed with gelledfluids. Microseismic monitoring indicates thatthese treatments are activating natural fracturesnormal to maximum horizontal stress.38 Thisactivation does not occur as often with viscousfluids, and refracturing in wells initiallycompleted with slickwater treatments isgenerally less successful.
48 Oilfield Review
37. Fredd CN, Olsen TN, Brenize G, Quintero BW, Bui T,Glenn S and Boney CL: “Polymer-Free Fracturing FluidExhibits Improved Cleanup for Unconventional NaturalGas Well Applications,” paper SPE 91433, presented atthe SPE Eastern Regional Meeting, Charleston, WestVirginia, USA, September 15–17, 2004.
38. For more on fractures and microseismic technology formonitoring fracture propagation: Bennet L, Le Calvez J,Sarver DR, Tanner K, Birk WS, Waters G, Drew J,Michaud G, Primiero P, Eisner L, Jones R, Leslie D,Williams MJ, Govenlock J, Klem RC and Tezuka K: “The Source for Hydraulic Fracture Characterization,”Oilfield Review 17, no. 4 (Winter 2005/2006): 42–57.
39. Anderson BI, Barber TD, Lüling MG and Sen PN:“Observations of Large Dielectric Effects on InductionLogs, or, Can Source Rocks be Detected with Induction
Measurements?," Transactions of the SPWLA 47thAnnual Logging Symposium, Veracruz, Mexico, June 4–7, 2006, paper OOO.
40. Permittivity is the degree to which a medium resists theflow of electric charge.
41. Faraj B, Williams H, Addison G, McKinstry B,Donaleshen R, Sloan G, Lee J, Anderson T, Leal R,Anderson C, Lafleur C and Ahlstrom J: “Gas ShalePotential of Selected Upper Cretaceous, Jurassic,Triassic and Devonian Shale Formations, in the WCSB ofWestern Canada: Implications For Shale GasProduction,” Gas Research Institute Report GRI-02/0233,December 2002.
42. Curtis JB: “Fractured Shale-Gas Systems,” AAPGBulletin 86, no. 11 (November 2002): 1921–1938.
Gas
rate
, MM
cf/m
onth
45
5
10
15
20
25
30
35
40
50
00 200 400 600 800 1,000 1,200 1,400 1,600 1,800 2,000
Time, days
Slickwater fracs: vertical wells(after 1/1/1998)
Large crosslinked fracs: vertical wells(between 1/1/1991 and 1/1/1998)
Water fracs: horizontal wells(after 6/1/2003)
Small crosslinked or foam fracs: vertical wells(before 1/1/1991)
> Improved performance with evolving technology. As drilling and fracturing technology evolved over theyears, operators in the Barnett Shale saw dramatic improvements over previously employed techniques.
59100schD06R1.qxp:59100schD06R1 11/21/06 6:34 PM Page 48

Autumn 2006 49
In addition to rising gas prices and improvedhorizontal drilling techniques, the developmentof economic and efficient stimulation practiceswas key to the commercial success of gas shale wells.
Migration to Future BasinsNew technologies, or new applications of proventechnologies, will undoubtedly migrate from onebasin to the next as word of their successspreads. One such application under studyinvolves analysis of induction signals to findsource rock.
Schlumberger researchers are currentlyinvestigating voltage measurements of inductionlogging tools.39 One component of theconductivity signal, called the quadrature, or out-of-phase portion of the signal, is usually quitesmall. However, certain rock formations causesignificant changes to this quadrature signal.
Examining raw data from AIT Array InductionImager Tools, Schlumberger researchersobserved large negative quadrature signalsbeyond the range normally expected from shalezones in the area. By contrast, adjacentsandstones and shales exhibit small, positive
quadrature signals, typical of conductivitymeasurements in the area.
Testing and modeling of several possiblecontributors to quadrature-signal anomaliesrevealed that abnormally high dielectricpermittivity was the only effect that couldduplicate the large negative quadrature signalsseen in those shales.40
Certain shale formations, known to be sourcerocks in Texas, Oklahoma and Utah, exhibit highdielectric permittivities, and are surrounded bynonsource-rock shales with low permittivities.The size of the clay platelets, in combinationwith the presence of pyrite, causes anomalouslylarge dielectric permittivities and providesintergranular space for hydrocarbon generation.
Schlumberger researchers are investigatingthe extent to which these electrical character -istics vary between source and nonsource shales.With further testing and refinements, insightsfrom ordinary induction logs may prove useful in correlating the quadrature signals of shale formations to their hydrocarbon-generating capacity.
Beyond the Fort Worth basin, other shaleplays are found nearby in the Woodford and Caneyshales in Oklahoma and the Fayetteville shale in
Arkansas. Other organic-rich shales are scatteredaround the USA, and are being developed in themature Illinois, Michigan and Appalachianbasins, to name a few (above). As shale-gasproduction increases in the USA, operators inother countries will find analog basins that pavethe way for increasing shale-gas reserves.
Outside the USA, basin studies are beingconducted to look for similar potential. Inwestern Canada, geologists are taking a closerlook at the shale-gas potential of the UpperCretaceous Wilrich, Jurassic Nordegg/Fernie andTriassic Doig/Doig Phosphate/Montney forma -tions of Alberta and British Columbia.Geochemical studies of these formations showpotential for future development.41 Currently, thescarcity of shale-gas plays outside of the USA maybe due to uneconomical flow rates and extendedwell payouts rather than to an actual absence ofproductive shale-gas basins.42 However, theexperience gained in US basins will inevitablyhelp operators around the world exploit shaleresources as production from conventionalresources reaches maturity. –MV
Gammon
BakkenNiobrara
Green River
Monterey
McClure
Cane Creek
Lewis & Mancos
Penn
Barnett & Woodford
Excello/Mulky
Barnett Woodford
Caney & Woodford
Fayetteville
Neal/Floyd & Conasauga
New AlbanyAntrim
Devonian/Ohio& Marcellus
> Organic-rich source-rock basins. This map shows major shale-gas basins in the United States with total resourcepotential of 500 to 1,000 Tcf [14.16 to 28.32 trillion m3].
59100schD06R1.qxp:59100schD06R1 11/16/06 7:49 PM Page 49