producation of bacterial cellulose from coconut …
TRANSCRIPT

RESEARCH ARTICLE
1Chemical Engineering Department, Faculty of Engineering, El-Mergib University, Al-Khums, Libya
2School of Chemical and Process Engineering, National University of Malaysia, Selangor, Malaysia
[email protected] , [email protected],
Corresponding Author: [email protected]
HNSJ, 2021, 2(11); https://doi.org/10.53796/hnsj21 101
Published at 01/11/2021 Accepted at 05/10/2021
HNSJ
Humanitarian & Natural
Sciences Journal
ISSN: (e) 2709-0833
www.hnjournal.net
Peer-Reviewed Journal Indexed at: NSP - SJIF
Arabic Impact Factor 2020 = 0.44
PRODUCATION OF BACTERIAL CELLULOSE FROM
COCONUT WATWER AS A MEDIUM BY USING
ACETOBACTER XYLINUM STRAIN
21,Jmal Khlifa Alfeluo ,1 M. Alburki ., Salem2Mohd Sahaid Kalil , 1,2Adnan Omran Alsawehli
Abstract
Bacterial cellulose (BC) is a unique biopolymer with a high crystallinity, strength and high
purity which make it gaining extensive interesting and has a commercial applications in a
variety of industries. This study aims at investigation the potential of Acetobacter xylinum
to produce BC from the coconut water and the effects of initial pH, initial substrate
(glucose) concentration and incubation temperature were also studied the ability of coconut
water without additional substrate. All the fermentation processes were carried out in a
static culture. Besides that, the physical properties of the BC produced at the optimum
conditions from coconut medium were evaluated. Also, the structure and morphology of the
BC produced were evaluated using Scanning Electron Microscope (SEM). Results showed
that the initial pH, initial substrate concentration and incubation temperature to optimally
produce biocellulose were 4.0, 20.0 gL-1 and 30oC respectively and the maximum amount
of BC produced was 27.096 (gL-1). The highest amount of biocellulose produced by using
coconut water without additional substrate was 13.246 (gL-1). The thickness of biocellulose
pellicles varied from 0.1215 - 0.760 mm in the dry state and from 1.509 - 8.351 mm in wet
state. The diameter of the pellicles varied from 80-82 mm, this was dependent on the
surface of the medium. Water Holding Capacity (WHC) varied between 11% - 74% and
moisture content was in the range of 92–98%.
Key Words: Acetobacter xylinum, Bacterial cellulose, coconut water.

Humanitarian and Natural Sciences Journal Al Sawehli et al. November, 2021 www.hnjournal.net
Page | 126
Producation of Bacterial Cellulose from Coconut Watwer as a Medium HNSJ Volume 2. Issue 11
1- Introduction
The production of processed foods and the consequent demand for functional ingredients has
expanded dramatically in recent years. Cellulose and cellulose derivatives are versatile multi-
functional food ingredients. Wood pulp and cotton linters are the raw materials for the
production of microcrystalline cellulose and cellulose derivatives. The cellulose produced by
Acetobacter xylinum is an alternative source. Unlike the cellulose from wood pulp, bacterial
cellulose is devoid of other contaminating polysaccharides, and its isolation and purification
are relatively simple, not requiring energy- or chemical-intensive processes, Further,
environmental problems due to by-products of wood pulping given an added impetus to study
unexplored sources of cellulose (Embuscado et al., 1994). Bacterial cellulose produced by A.
xylinum has properties that make it suitable for use in different fields. When compared with
plant cellulose, its most striking features are its greater water-holding capacity, higher
crystallinity, tensile strength, and a good biocompatibility. These features are a result of the
nanostructurated network formed by its microfibrils (Goelzer et al 2008).
Acetobacter bacteria have been commonly found in symbiotic relationships with many
different plants such as sugarcane and coffee plants and consequently isolated. Acetobacter
xylinum is a gram-negative, aerobic bacterium that has long served as a model organism for
the study of bacterial cellulose synthesis; primarily because of the large quantities it produces.
A single A. xylinum cell is capable of polymerizing 200 000 glucose molecules per second
into β-1,4-glucan chains which are then excreted into the surrounding medium forming
ribbon-like bundles of microfibrils2. The produces crystalline fibers resemble in width and
structure average fibrils form many plants and algae (Ross, P at al 1991)and . (Ślusarska at al
2008)
2-MATERIALS & METHODS
2-1 Microorganism and culture media
Acetobacter xylinum obtained from the laboratory of Biotechnology, Chemical Engineering
Department (University Kebangsaan Malaysia). The culture was maintained on a coconut
water agar and stored in the refrigerator (4oC). The culture was transferred to coconut water
agar every 14 days. It was incubated at room temperature (about 30oC) for 3 days prior to
keeping in the refrigerator (4oC) (Phunsri et al 2003). The coconut water glucose medium
(CWG) consisted of 20.0 g glucose, 5.0 g (NH3)2 SO4, and 5.0 g glacial acetic acid dissolved
in 1.0 L of coconut water. Coconut water was obtained from coconut purchased locally from
Malaysia (Kagang). The initial pH was adjusted to 4, 5 and 6 with 0.1 M HCl or sterilized 1
M NaOH. The medium transferred to conical flasks 250 mL were autoclaved for 20 min at
121 oC and 15 psi, then the medium cooled to a required temperature for the fermentation
process or stored at 4 oC in the refrigerator. Table 1 presents chemicals and composition of
fermentation media used in this study.

Humanitarian and Natural Sciences Journal Al Sawehli et al. November, 2021 www.hnjournal.net
Page | 127
Producation of Bacterial Cellulose from Coconut Watwer as a Medium HNSJ Volume 2. Issue 11
Table 1. chemicals and composition of fermentation media used in this study
Material Manufacturer Composition of Solid Medium
Agar (Isawano et al 2002)
Composition of CWG Medium
(verschuren. et al 2000)
Glucose, C6H12O6 Chempur, Germany Glucose 20.0 g/L Glucose 20.0 g/L
Ammonium sulfate,
(NH3)2 SO4
R & M Marketing, Essex, United
Kingdom. Agar 20.0 g/L (NH3)2 SO4 5.00 g/L
Acetic acid,
CH3COOH
BDH Chemical Ltd Poole
England (NH3)2 SO4 5.00 g/L Acetic acid 5.00 g/L
Sodium hydroxide,
NaOH Progressive Co., Malaysia Acetic acid 5.00 g/L Coconut water 1.000 L
Bacteriological
agar
Becton, Dickinson and Company,
USA Coconut water 1.000 L Glucose 20.0 g/L
Sodium Bi-
phosphate,
Na2HPO4
Weifang Huabo Chemical Co.,
Ltd, China Glucose 20.0 g/L
Peptone Oxoid, England
Citric acid, C6H8O7 John Kollin Corporation, USA
Yeast extract Becton, Dickinson and Company,
USA
Coconut water Purchased locally from Malaysia
(Kagang)
2-2 Bacterial Growth Pattern and Fermentation Process
The Liquid media can be solidified with agar. Prepare solid media (Agar) by dissolving the
agar in the liquid medium, the composition of the medium . After dissolved the agar in the
medium, heated at a temperature from 70-90 oC until the homogenous, after that the medium
autoclaved at 121oC from 15-20 min and 15 psi to sterilize the medium, then Cool the agar to
about 50°C, at this temperature the medium will stay in liquid indefinitely, but it will rapidly
solidify if it temperature falls much below 45°C. Then Pour the medium into sterile
disposable Petri dishes (plates) and allow solidifies. Transferring the agar to the plates must
be achieved under the most sterile conditions we’re able to achieve. The next step was
achieved when the agar is completely frozen, after that transfer number of bacteria by using
inoculating Loop to the surface of agar, the loop sterilized by holding it in a Bunsen burner
flame until it is red hot. Cool the loop by touching it to a sterile portion of the surface of an
agar plate until it stops sizzling. After inoculating the plates are closed by wrapping the
parafilem around the plate. Finally, the plates incubated at 30 oC for 3 days, now the solid
medium ready for preparing the stock culture or kept in the cool room at 4 oC. The A.
xylinum produced is transferred to the liquid medium in 1:10, where each of 10 ml A.
xylinum was added to a 90 ml of sterile coconut medium. Then, the culture medium incubated
at 30 oC for 3 days. After that the bacteria is transferred into a Petri dish of coconut solid
medium under the most sterile conditions we’re able to achieve as outlined in the preparation
of solid medium. The stock culture prepared by transfer the colonies from the Petri dishes to

Humanitarian and Natural Sciences Journal Al Sawehli et al. November, 2021 www.hnjournal.net
Page | 128
Producation of Bacterial Cellulose from Coconut Watwer as a Medium HNSJ Volume 2. Issue 11
sterile liquid coconut medium and incubated at 30 oC for 3 days. Finally, the stock culture is
ready for the fermentation process.
3- ANALYSIS
The analysis procedure of bacterial cellulose production was summarized as shown in Figure
3.4. The analysis including: dry weight of bacterial cellulose, final pH value and final
substrate concentration (glucose). Moreover the bacterial cellulose produced was
characterized assuming the following criteria: the yield of the biosynthesis process in variable
conditions and the characteristics of bacterial cellulose, including a measure the water holding
capacity, moisture content, diameter and thickness of pellicles .
3-1 Determination of pH Values and Glucose Concentration
Determining the final pH value was determined using a pH meter (EUTECH, Singapore). The
pH meter calibrated with a standard buffer solution before being used to measure the pH
value of the sample.Glucose concentration was determined using Biochemistry Analyzer (YSI
Model 2700 SELECT, USA). Prior to the analysis, 1 ml from the medium was diluted ten
times with distilled water then the solution transfer to a microtube 1.5 mL (Eppendroff tube).
This tube was centrifuged using centrifuge machine (3000 rpm for 5 min). After that the
sample was detected by Biochemistry Analyzer as shown in figure 3.3.
Glucose concentration = reading × 10 = ( ) g/L, where 10 is the dilution factor.
Figure 3.3: Biochemistry Analyzer for Measure Glucose Concentration
3-2 Determination the Amount of Bacterial Cellulose Produced
During the breeding of Acetobacter xylinum bacteria in stationary conditions, bacterial
cellulose was produced and synthesized in the form of a pellicle on the surface of the nutrient
medium solution in flasks. The bacterial cellulose removed after the period of formation and
treated (Shezad et al 2010).
3-3 Treatment of Bacterial Cellulose
The obtained (bacterial cellulose pellicle) from the culture flask was purified by washing
repeatedly with large quantities of distilled water. Then the pellicle of biocellulose was
treated by immersion in a NaOH (a concentration of approx. 1%, for 20 min., temp = 100 °C)
in order to remove bacterial cells, residual medium from the inner layers of the bacterial
cellulose and other impurities (Phunsri et al 2003). Next, bacterial cellulose once again
washed with distilled water, and kept in distilled water in a refrigerator at 4 oC for the next
steps.
Humanitarian and Natural Sciences Journal Al Sawehli et al. November, 2021 www.hnjournal.net
Page | 129
Producation of Bacterial Cellulose from Coconut Watwer as a Medium HNSJ Volume 2. Issue 11
3-4 Determination Dry Weight of Bacterial Cellulose
The amount of bacterial cellulose in the pellicles was measured by boiling the harvested
pellicle in 0.1N NaOH for 20 minutes as outlined. Then the pellicles were soaked in water for
at least two hours and placed for drying in oven at a temperature of 70oC until the weight did
not change. The weight of dried pellicles was expressed as bacterial cellulose weight.
3-5 Measurement of Water Holding Capacity (WHC) of Bacterial Cellulose
The water holding capacity of the samples was measured using the shake method (Schrecker,
S. T et al 2005). Pellicles of bacterial cellulose were removed from the flasks by using
tweezers. The samples were shaken twice quickly and then weighed. Then, bacterial cellulose
samples were dried for 12h at 70◦C in order to completely remove water from them. Finally,
they were transferred quickly to the balance for weighing (Shezad et al 2010). The water
holding capacity was calculated using the following formula:
3-6 Measurement of Wet Weight and Moisture Content
The bacterial cellulose obtained was allowed to drip for 30 s and the wet weight was
determined (Watanabe, K et al 1995). Moisture content is the amount of the water in the
bacterial cellulose pellicle. The moisture content (%w/w) of bacterial cellulose was
determined based on the weight loss of the pellicle when dried in an oven at a temperature of
70oC until the weight did not change.
The moisture content is calculated by using this formula:
Where:
Mn = moisture content (%) of material n
Ww = wet weight of the sample
Wd = weight of the sample after drying.
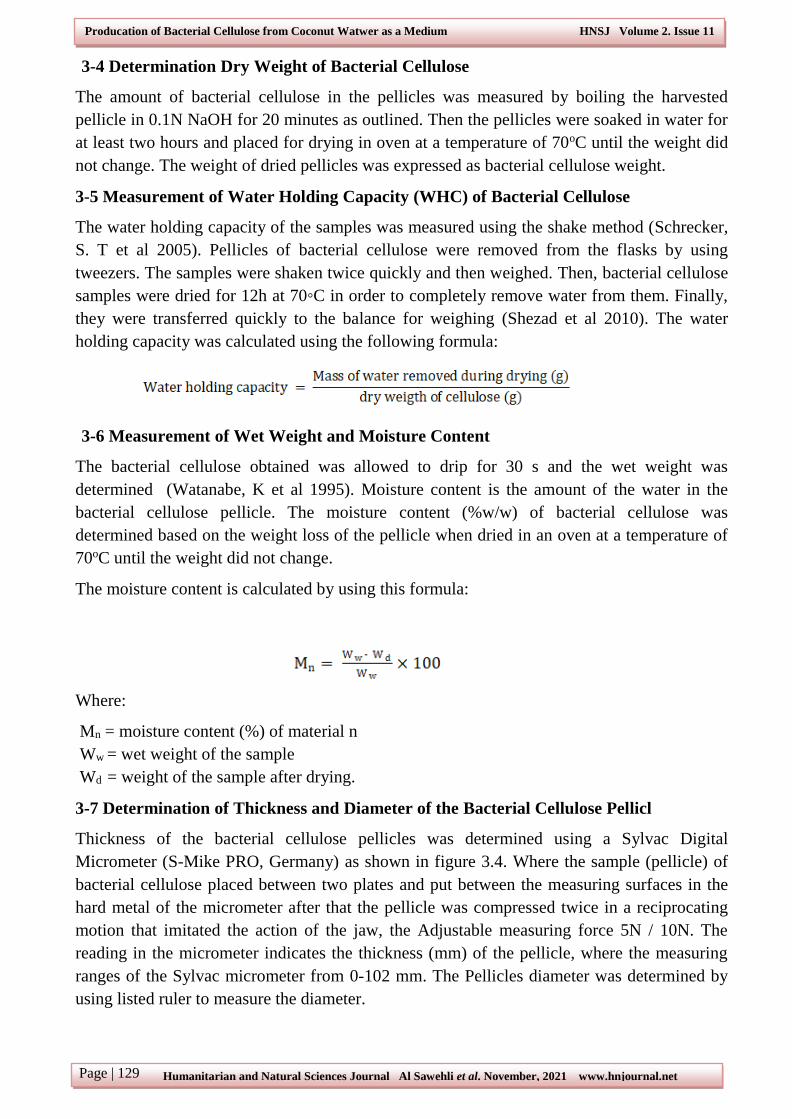
3-7 Determination of Thickness and Diameter of the Bacterial Cellulose Pellicl
Thickness of the bacterial cellulose pellicles was determined using a Sylvac Digital
Micrometer (S-Mike PRO, Germany) as shown in figure 3.4. Where the sample (pellicle) of
bacterial cellulose placed between two plates and put between the measuring surfaces in the
hard metal of the micrometer after that the pellicle was compressed twice in a reciprocating
motion that imitated the action of the jaw, the Adjustable measuring force 5N / 10N. The
reading in the micrometer indicates the thickness (mm) of the pellicle, where the measuring
ranges of the Sylvac micrometer from 0-102 mm. The Pellicles diameter was determined by
using listed ruler to measure the diameter.
Humanitarian and Natural Sciences Journal Al Sawehli et al. November, 2021 www.hnjournal.net
Page | 130
Producation of Bacterial Cellulose from Coconut Watwer as a Medium HNSJ Volume 2. Issue 11
Figure 3.4 Sylvac Digital Micrometers for Measure the Thickness (mm) of Bacterial Cellulose
Pellicles.
3-8 Bacterial Cellulose Scanning Electron Microscopy (SEM) Analysis
Scanning electron microscopy (SEM) images of bacterial cellulose was taken using SEM
(LEO 1450VP, LEO Co. LTD) to study the structure and the morphology of the bacterial
cellulose. The morphology of the samples was investigated for the bacterial cellulose pellicles
that produced at the optimum conditions, where 8 pellicles were collected. The sample was
taken each day for 8 days of the incubation. Prior to SEM analysis, the samples treated and
washed twice with distilled water to remove the impurities and the residual substrate. The
samples were prepared for the SEM in two cases. In the first case, after the bacterial cellulose
dried by oven at 70oC and in the second case, the samples were rinsed in distilled water after
treated and dehydrated by freeze-dryer (Alpha 1-4 LSC Freeze dryer, Germany) at −40 °C
and 0.050 mbar. All the samples that were prepared for the SEM were sputter coated with
gold and the cell morphology was examined using SEM.characterization analysis including
the scanning electron microscope (SEM).
4- Results and Discussion
4-1 Biocellulose production from coconut medium at different glucose concentration
Three different glucose concentrations were used 15, 20 and 25 g/L. The media was prepared
as outlined and transferred into conical flasks 250 mL, where 8 conical flasks for each
concentration was prepared and incubated at 30 oC and pH adjusted at 4.75. Each 24 h the
sample was taken and the period of fermentation was 8 days. Biocellulose and biomass
produced on the surface of the flask it was removed and treated to obtain pure biocellulose.
Figure 4.1 it shown the growth rate of biocellulose at different glucose concentrations in the
coconut medium. The pH was initially adjusted 4.75, where the period of fermentation of
coconut medium for biocellulose production was 8 days, where it was proved that the greatest
increase in the weight of bacterial cellulose takes place after 7 - 8 days of breeding
Acetobacter xylinum (Ślusarska et al 2008). The amount of biocellulose produced from the
fermentation of various sugar concentrations was increased with the time. The biocellulose
pellicles were collected for each day of fermentation.

Humanitarian and Natural Sciences Journal Al Sawehli et al. November, 2021 www.hnjournal.net
Page | 131
Producation of Bacterial Cellulose from Coconut Watwer as a Medium HNSJ Volume 2. Issue 11
Figure 4.1 Biocellulose Productions (g/L) at Different Glucose Concentrations Medium
The biocellulose productions were 18.389, 27.096 and 25.319 g/L biomass when the glucose
concentration was 15, 20 and 25 g/L, respectively. Besides that, in the coconut medium
without adding substrate (glucose), the biocellulose production was 13.425 g/L. It was
observed that the biomass produced effected by the concentration of the sugar (glucose). The
results showed that 20 g/L of glucose was the optimum concentration and gained the highest
production of biocellulose. Also, it was observed that the coconut medium without adding
glucose has the ability to produce biocellulose as 13.425 g/L dry weight after 8 days
fermentation.
The pH reading of the end of each day from the fermentation for different glucose
concentration medium is shown in Figure 4.2. It was observed that there is a decreasing in pH
value along with the incubation time regardless of the glucose concentration. The decreasing
pH values in the initial 15 g/L glucose concentration is less than in 20 g/L and 25 g/L glucose
medium. While the decreeing in pH at initial 20, 25 g/L of glucose is almost the same. The
pH decreases during fermentative production because of the accumulation of gluconic, acetic
or lactic acids in the culture broth, the conversion of glucose to gluconic acid led to a
significant drop in pH of the culture broth (Phunsri et al 2003). The bacteria consumed the
substrate (glucose) for built and produce a nanostructurated network (biocellulose) on the
surface of the broth, where the bacteria convert the glucose to gluconic acid which that leads
to decrease the concentration of glucose gradually as shown in figure 4.3. In a previous study
by Angkana, it was reported that the reducing sugar could be utilized for the production of
gluconic acid, which is the product of glucose oxidation by Acetobacter (Phunsri et al 2003).
Also it was reported that by Young kook yang (yang et al 1995), the A. xylinum oxidized a
portion of glucose to gluconic acid, with the accumulated gluconic acid lowering the pH of
the culture medium and inhibiting cellulose production.

Humanitarian and Natural Sciences Journal Al Sawehli et al. November, 2021 www.hnjournal.net
Page | 132
Producation of Bacterial Cellulose from Coconut Watwer as a Medium HNSJ Volume 2. Issue 11
Figure 4.2 Final pH values from Different Glucose Concentration in the Coconut Medium
Figure 4.3 Glucose Concentrations during the course of Fermentation of Coconut Medium
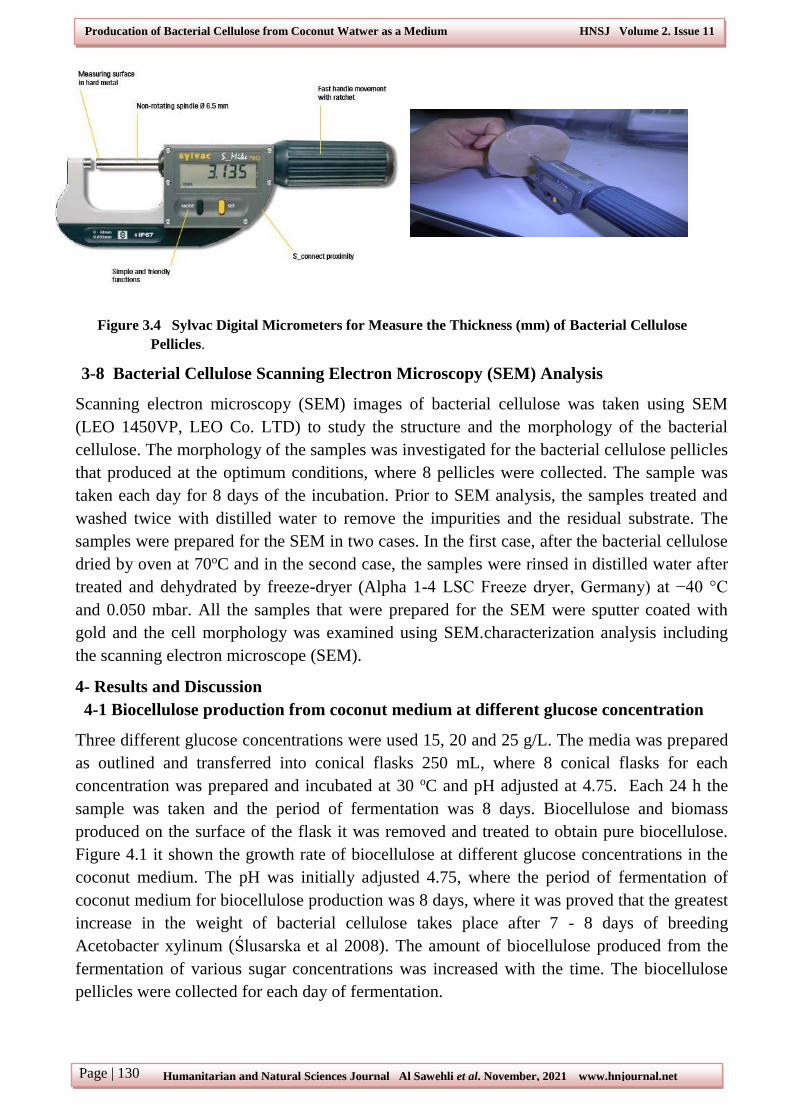
4-2 Influence of temperature on the biocellulose production
Four different temperatures were used, namely 25, 30, 35, and 40 oC. The optimum growth
parameters were used as pH 4.75 and 20 g/L glucose concentration. The experiments carried
out using conical flasks 250 mL with working volume of 100 mL and after the inoculation
(fresh inoculum of A. xylinum 10%) the flasks were incubated for 8 days at different
incubation temperatures.
From Figure 4.4, it was observe that for the breeding conducted at 30, 25, 35 and 40°C; it
clearly appears that the optimum temperature is 30 oC in which the maximum amount of
biocellulose was produced as 26.036 g/L. Also, it was observed that the biocellulose yield at
25 °C after 8 days was 20.902 g/L. It was approximately higher than the biosynthesis yield at
35 and 40 °C, where the yield was 18.74, 2.007 g/L, respectively.
Humanitarian and Natural Sciences Journal Al Sawehli et al. November, 2021 www.hnjournal.net
Page | 133
Producation of Bacterial Cellulose from Coconut Watwer as a Medium HNSJ Volume 2. Issue 11
Figure 4.4 Effects of the Temperature on the Biocellulose Production
Temperature is a crucial parameter that affects both growth and cellulose production. These
were in accordance with conditions determined in the preliminary studies. In the majority of
experiments, the maximal cellulose production was observed between 28 and 30 °C as
reported by Prashant (Prashant R et al 2009). Also it was proved that by Barbara (Ślusarska et
al 2008), the greatest increase in the weight of bacterial cellulose takes place after 7 - 8 days
of breeding Acetobacter xylinum at a temperature of 30 °C.
4-3 Effect of initial pH on the production of biocellulose
Three different initial pH were used, namely 4, 5, and 6. These experiments were conducted
at the optimum growth parameters, 30 oC and 20 g/L glucose concentration with change in
initial pH value only. The experiments were carried out for 8 days in an incubator without
shaking (statically).
The effect of pH on the production biocellulose was presented in figure 4.5. The amounts of
biocellulose were produced from the fermentation of various initial pH were collected. At the
initial 4.0 pH, the amount of biocellulose was produced as 26.139 g/L, while pH 5.0 was
resulted in 24.987 g/L and pH 6.0 was resulted in 16.703 g/L of biocellulose. In these
experiments it was observed that the change in the initial pH of the fermentation medium had
an effect on the growth of A. xylinum. The optimum pH for the production of biocellulose
was found to be 4.0. As reported by Peter, the pH for optimal cellulose production and
bacterial growth is between 4.0 and 5.0. Our results are in agreement with that reported
previously by Peter (Peter et al 2000). Furthermore, as reported by Masaoka (Masaoka et al
1993), the optimum pH of the Acetobacter xylinum was found to be 4.75 which are in the
range of 4-6.

Humanitarian and Natural Sciences Journal Al Sawehli et al. November, 2021 www.hnjournal.net
Page | 134
Producation of Bacterial Cellulose from Coconut Watwer as a Medium HNSJ Volume 2. Issue 11
Figure 4.5 The Effect of Initial pH Value on the Biocellulose Production
4-4 Effects of inoculum on the growth rate of acetobacter xylinum and the produceion of
biocellulose using coconut water medium
From Figure 4.6 it was observed that the change inoculum has a significant effect on the
growth rate of the bacterial cellulose especially in the first 24 h. From the Figure it can see
that when the inoculum was grown on HS medium and used to inoculate the coconut medium,
no product was appeared after 24 h. After 2 days the bacteria started to produce biocellulose
which was 2.643 g/L, while after 8 days from the fermentation, the maximum product was
17.050 g/L. On the other hand when the coconut medium was used to prepare the inoculum
and as a production medium, the product was appeared after 24 h as 0.567 g/L and after 2
days as 4.037 g/L. The maximum production was 27.096 g/L after 8 days. When HS was
used to develop the inoculum there is no apparent growth in the first 24 h because the bacteria
adapt themselves to new growth conditions. It is the period where the individual bacteria are
maturing and not yet able to divide. This period called lag phase. This period is reduced when
coconut inoculum used and the inoculum has the same composition of the medium then the
bacteria adapt directly with the new environment to produce Biocellulose. The previous
studies have been proved that there is no apparent net growth observed during the lag phase.
Figure 4.6 Effect Inoculum on the Coconut Water Medium Fermentation

Humanitarian and Natural Sciences Journal Al Sawehli et al. November, 2021 www.hnjournal.net
Page | 135
Producation of Bacterial Cellulose from Coconut Watwer as a Medium HNSJ Volume 2. Issue 11
4-5 Characterization of the biocellulose produced
This experiment conducted to characterize the pellicle of biocellulose produced in order to
identify the characteristics of the pellicle where the experiment carried out under the optimum
condition and parameters of growth.
Measurement the diameter and thickness of the biocellulose produced
The biocellulose was produced using the optimum conditions for the growth (20 g/L glucose,
4.75 pH and 30oC). The period of fermentation carried out for 8 days, and the sample was
taken each day were each flask present day and the day next. The sample was removed by
using tweezers, and treated the boiling in 0.1 NaOH, after that, the diameter measured by
using listed ruler (mm) and the thickness measured by using Sylvac Digital Micrometer. The
thickness was taken for the biocellulose pellicles in wet state and after the pellicle dried in the
oven until the weight didn’t change.
Figure 4.7 shows the change in the thickness and the diameter of the biocellulose pellicles for
8 days of the fermentation. From Figure 4.5, it was observed that there is obvious increasing
in the thickness of the cellulose pellicles along with the time, where the maximum thickness
reached to 0.76 mm in the dry state and 8.351 mm in the wet state. And the diameter of the
cellulose product as shown in Figure 4.5, there is no significant change in the diameter where
the diameter was about 80 mm after one day from the fermentation and after four days of
fermentation became 82 mm and continued to be constant until the end of fermentation. It is
important to be noticed that the diameter depends on the diameter of the flask was used,
because the cellulose product will be equal to the diameter surface of the medium as shown in
the figure 4.8
Figure 4.7 Thicknesses and Diameter of Biocellulose Pellicles

Humanitarian and Natural Sciences Journal Al Sawehli et al. November, 2021 www.hnjournal.net
Page | 136
Producation of Bacterial Cellulose from Coconut Watwer as a Medium HNSJ Volume 2. Issue 11
figure 4.8 biocellulose formed on the surface medium with diameter equal to surface medium
Measurement of the water holding capacity, and moisture content
The experiment carried out to determine the water holding capacity and moisture content of
the samples was measured using the shake method (Schrecker et al 2005). eight samples of
biocellulose were collected from 8 conical flasks 250 ml using tweezers and the samples was
taken every day, where each flask represents the day and the day next. the pellicle of cellulose
was allowed to drip for 30 sec and the wet weight was determined (Watanabe, K et al 1995).
the moisture content (% w/w) of the cellulose was determined based on the weight loss of the
cellulose when dried at 70 oc for 12 h under atmospheric pressure.
the water holding capacity was calculated using the following formula:
the moisture content is calculated by using this formula
table 2.2 shows that (whc) and moisture content obtained for the biocellulose produced from
the coconut medium. the samples that used to analyze the whc and the moisture content was
conducted using experiment at optimum conditions (20 g/l glucose, 4.75 initial ph and
autoclaved at the optimum temperature 30 oc). where 8 samples were used, and collected
every day for 8 days of incubation. the moisture content of cellulose for the samples in the
experiment was in the region of 92–96% and whc varied from 11% to 74%. the results
showed that the biocellulose is about 4.5% of the total weight.
Table 2.2 whc and moisture content of the biocellulose production
time (day) wet weight
(g/l )
biocellulose
( g/l )
moisture
content (%)
water holding
capacity (%)
0 0.00000 0.0000 0.000 0.000
1 18.5370 0.5670 96.94 31.69

Humanitarian and Natural Sciences Journal Al Sawehli et al. November, 2021 www.hnjournal.net
Page | 137
Producation of Bacterial Cellulose from Coconut Watwer as a Medium HNSJ Volume 2. Issue 11
2 154.183 2.0370 98.67 74.69
3 207.101 6.3070 96.95 31.83
4 210.557 10.026 95.23 20.00
5 275.064 11.662 95.76 22.58
6 288.961 20.082 93.05 13.38
7 332.506 25.686 92.27 11.94
8 386.500 27.096 92.98 13.26
Mcanning electron microscopy (SEM) analysis
The surface and cross-section of the samples were sputtered with gold and photographed. the
biocellulose membranes were biosynthesized in the coconut media from static fermentation.
The microfibrilar structure of microbial cellulose under the scanning electron microscope
(SEM) is shown in Figure 4.7. The samples were chosen for the SEM from the experiment
conducted by using the optimum conditions (20 g/L glucose, pH 4.75 and 30oC). 8 samples
were collected for SEM; each sample was taken after each day from the incubation for 8 days.
Figure 4.9 presents typical SEM images of freeze-dried biocellulose and oven dried
biocellulose composite. As seen from Fig. 4.7, biocellulose nanofibrils can be observed on the
surface. The mean diameter of the nanofibrils is about 60 nm. From cross sectional images it
was observed that these multiple layers structure have high aspect ratio. Evidently, the
biocellulose sample has porous morphology, and these micrographs clearly show the various
morphological features of these sheets. All samples showed a reticulated structure consisting
of ultra-fine cellulose. Jaehwan (Jaehwan Kim et al 2010) reported that the biocellulose,
which is synthesized by Acetobacter xylinum, consists of the biogenous nanofiber network
structure formed by self-assembling in an efficient way. The cellulose is crystallized outward
the organisms, particularly in Acetobacter xylinum that synthesizes cellulose chains by
introducing glucose units to the reducing ends of the polymer. The growth mechanism during
bacterial activity determines the morphology of the final cellulose.
Figure 4.10 present SEM images of the oven dried biocellulose; the biocellulose was dried at
70 oC until the weight remained constant. Through the images from figure 4.8, it was noted
that the surface morphology of biocellulose was changed. Biocellulose nanofibrils cannot be
observed due to the heat dryer. It is likely completely destroyed by the dry heat, which led to
a shift to of an opaque surface. From the comparison between the images after the oven and
freeze dry, there is a clear distinction and significant difference between the images after the
oven dry and the freeze dry. Based on that, to keep and protect the biological structure and
composition of biocellulose fibers, the process of drying by the freeze dryer is more efficient.
Freeze drying was proved to be a more considerate drying method relating to the maintenance
of pore structures (Klemm, D et al 2001).
During freeze drying the frozen water is removed by sublimation, thus reducing damage to
biological structures. However, the level of cell viability after freeze drying varies according

Humanitarian and Natural Sciences Journal Al Sawehli et al. November, 2021 www.hnjournal.net
Page | 138
Producation of Bacterial Cellulose from Coconut Watwer as a Medium HNSJ Volume 2. Issue 11
to numerous factors including the strain of microorganisms and also the efficacy of the
protective agents used. Several investigators have reported the effect of bacterial cell size on
survival during freeze drying and subsequent storage. Differences in the surface areas of
microorganisms and variations in cell wall and membrane composition affect the ability of the
cells to survive the freeze drying process (A. Jagannath et al 2010 ).
Figure 4.9 SEM images of freeze-dried biocellulose produced from a static culture from the
fermentation of coconut medium. The biocellulose collected through 8 days from the fermentation,
where the image (A) represent day 1 and the images B, C, D, E, F, G, and H represent days 2, 3, 4, 5, 6, 7
and 8 respectively.
Figure 4.10 SEM images of oven dried biocellulose produced from a static culture from coconut
medium. Where image (A) represent the biocellulose after 24h and (B) after 8 days from the
fermentation.
5 - CONCLUSION
The findings from this study have shown that Acetobacter xylinum has the ability to produce
biocellulose pellicles in the coconut medium. The results showed that the sugar
concentrations (glucose), pH and temperature affected the yield of biocellulose significantly.
The maximum biocellulose was produced by adding 20 g/L glucose to the coconut medium
and the yield of biocellulose after 8 days from the fermentation was 27.096 gram of dry
cellulose per liter of liquid medium. Among the three initial pH values studied (pH 4.0, 5.0
and 6.0), pH 4.0 was the best for bacterial growth and biocellulose production because it gave
the highest yield of 26.139 g/L. The production of biocellulose has been investigated at
different temperatures 25, 30, 35, 40oC. The highest yield of biocellulose was 26.036 g/L at
30oC. The optimum temperature was 30 oC for the production of biocellulose.
Humanitarian and Natural Sciences Journal Al Sawehli et al. November, 2021 www.hnjournal.net
Page | 139
Producation of Bacterial Cellulose from Coconut Watwer as a Medium HNSJ Volume 2. Issue 11
In addition, biocellulose has been characterized in order to evaluate the properties and the
characteristics of the biocellulose. The characteristics of biocellulose considered were:
thickness, diameter, water holding capacity and moisture content, besides that, SEM was
taken in order to investigate the structure and the morphology of the cellulose.
Characterization of biocellulose was conducted during the experiment and was carried out
under the optimum conditions (20g/L glucose concentration, pH 4.75 and 30oC). Samples
were taken each day for 8 days. The thickness of the biocellulose pellicles varied from 0.1215
- 0.760 mm in the dry state and from 1.509 - 8.351 mm in wet state. Also, it was observed that
the thickness has a direct effect on the amount of water that biocellulose can hold which in
turn affects the softness of the final product. Biocellulose has high and significant water
holding capacity, where the WHC was varied from 11% - 74%. The biocellulose is about
4.5% of the total weight. The moisture content of biocellulose was in the range of 92–96%
and the diameter of the pellicles was varied from 80-82 mm which was depends on the flask
diameter.
The SEM photographs showed the structure of biocellulose when the samples were dried by
the oven at 70oC until a constant weight was obtained; the surface morphology of biocellulose
changed and biocellulose nanofibrils could not be observed due to the heat dryer. It might
have been destroyed by the dry heat, which led to a shift to an opaque surface. While the
biocellulose nanofibrils could be observed on the surface and the mean diameter of the
nanofibrils is about 60 nm. Furthermore, all samples showed a reticulated structure consisting
of ultra-fine cellulose when the samples were dried by freeze-dryer at −40 °C. Based on that,
to keep and protect the biological structure and composition of biocellulose fibers, it is thus
recommended that drying should be through the freeze dryer.
6 - REFERENCES
1- Milda, E. Embuscado., Jay, S. Marks. & James, N. BeMiller. 1994. Bacterial cellulose
Factors affecting the production of cellulose by Acetobacter xylinum. Food Hydrocolloids
Vol.8 No.S pp.4l9-430 (1994), Department of Food Science, Purdue University, West
Lafayette.
2- F.D.E. Goelzer, P.C.S. Faria-Tischer, J.C. Vitorino, Maria, R. Sierakowski & C.A. Tischer.
2008. Production and characterization of nanospheres of bacterial cellulose from
Acetobacter xylinum from processed rice bark. Journal of Materials Science and
Engineering C 29: 546–551
3- Ross, P., Mayer, R. & Benziman, M. 1991. Cellulose biosynthesis and function in
bacterial. Journal of Microbiological Reviews 55(1): 35-58
4- Barbara Surma-Ślusarska, Sebastian Presler & Dariusz Danielewicz. 2008. Characteristics
of Bacterial Cellulose Obtained from Acetobacter Xylinum Culture for Application in
Papermaking. FIBRES & TEXTILES in Eastern Europe 2008, Vol. 16, No. 4 (69) pp. 108-
111
5- Angkana Phunsri, Pramote Tammarate, Warawut Krusong & Sumate Tantratian. 2003. The
Liquid/Air Interface Area and Depth of Liquid Medium Suitable for cellulose production
from Acetobacter TISTR 975. J. Sci. Res. Chula. Univ., Vol. 28, No. 1(2003).
6- Shin Isawano, Kenji Tajima, Hiroyuiu Kono, Tomoki Erata, Masanobu Munekata &
Mitsuo Takai. 2002. Effects of Endogenous Endo-P- 1,4-Glucanase on Cellulose

Humanitarian and Natural Sciences Journal Al Sawehli et al. November, 2021 www.hnjournal.net
Page | 140
Producation of Bacterial Cellulose from Coconut Watwer as a Medium HNSJ Volume 2. Issue 11
Biosynthesis in Acetobacter xylinum ATCC23769. Journal of Bioscience Bioengineering
Vol. 94, No. 3,275-28 1.2002
7- Peter, G. verschuren., Thomas d. cardona., z m. j. robert nout., kees, d. de gooijer., &
Johannes, c. van den heuvel. 2000. Location and limitation of cellulose production by
Acetobacter xylinum established from oxygen profiles. Journal of biosciencaen d
bioengineering Vol. 89, No. 5, 414-419
8- Omer Shezad, Salman Khan, Taous Khan & Joong Kon Park. 2010. Physicochemical and
mechanical characterization of bacterial cellulose produced with an excellent productivity
in static conditions using a simple fed-batch cultivation strategy. Journal of Carbohydrate
Polymers 82: 173–180
9- Angkana Phunsri, Pramote Tammarate, Warawut Krusong & Sumate Tantratian. 2003. The
Liquid/Air Interface Area and Depth of Liquid Medium Suitable for cellulose production
from Acetobacter TISTR 975. J. Sci. Res. Chula. Univ., Vol. 28, No. 1(2003).
10- Schrecker, S. T. & Gostomski, P. A. 2005. Determining the water holding capacity of
microbial cellulose. Journal of Biotechnology Letters, 27, 1435–1438
11- Watanabe, K. & Yamanaka, S. 1995. Effects of oxygen-tension in the gaseous-phase on
production and physical-properties of bacterial cellulose formed under static culture
conditions. J. Biosci Biotechnol Biochem. 59:65–68
12- young kook yang., sang hoon park., z jung wook hwang., yu ryang pyun. & yu sam kimit.
1998. Cellulose Production by Acetobacter xylinum BRCS under Agitated Condition.
Journal of fermentation and bioengineering. Vol. 85, No. 3, 312-317
13- Prashant R., Chawla Ishwar, B. B., Shrikant, A., Survase & Rekha S. Singhal. 2009.
Microbial Cellulose: Fermentative Production and Applications. J. Fermentative
Production of Microbial Cellulose, Food Technol. Biotechnol. 47 (2): 107–124.
14- Masaoka, S., Ohe, T. & Sakota, N. 1993. Production of cellulose from glucose by
Acetobacter xylinum, J. Ferment. Bioeng. 75(1), 18-22
15- Schrecker, S. T. & Gostomski, P. A. 2005. Determining the water holding capacity of
microbial cellulose. Journal of Biotechnology Letters, 27, 1435–1438
16- Watanabe, K. & Yamanaka, S. 1995. Effects of oxygen-tension in the gaseous-phase on
production and physical-properties of bacterial cellulose formed under static culture
conditions. J. Biosci Biotechnol Biochem. 59:65–68
17- Jaehwan Kim, Zhijiang Cai, Hyun Sook Lee, Gwang Seong Choi, Don Haeng Lee &
Chulhee Jo. 2010. Preparation and characterization of a Bacterial cellulose/Chitosan
composite for potential biomedical application. J. of Polym Res. DOI 10.1007/s10965-
010-9470-9
18- Klemm, D., Schumann, D., Udhart, U. & Marsch, S. 2001. Bacterial synthesized cellulose
artificial blood vessels for microsurgery. Progress in polymer Science 26: 1561-1603
19- A. Jagannath, P.S. Raju & A.S. Bawa. 2010. Comparative evaluation of bacterial cellulose
(nata) as a cryoprotectant and carrier support during the freeze drying process of probiotic
lactic acid bacteria. Journal of Food Science and Technology 43 (2010) 1197-1203