processing with topspin - department of chemistry | department … · apk,apks...
TRANSCRIPT

Processing With Topspin
Duncan HoweOctober 31, 2016
Department Of ChemistryUniversity Of Cambridge
1

Introduction

Topspin is a pretty vast piece of software and can do many,many things...
There’s not time to teach you everything!
2

The picture of your spectra is not your result…
• Well, at least from a certainperspective…
• You have to process your raw resultinto a picture you can interpret.
• There is not necessarily a single‘correct’ way to process your data…Which is one reason we don’t storethe processed data.
3
Topspins design
• Topspin is a Java application. It can be slow to start, as itis composed of many files and by default most virusscanners will scan them. I usually exclude the Topspindirectory from the scan.
• You’ll find there are multiple ways to do anything…• It has a command-line interface, this can be faster thanhunting through menus with the mouse.
• It can be programmed to automate tasks, via macros, or aform of the ’C’ programming language.
• It has a long history, going back to SGi unix days; whichgives it some quirks…
• …but at least it has a full set of manuals in electronicformat.
4

Here’s what it looks like.
5

Customise Topspin.This can be done by typing ’set’ at the command line.I do at a minimum :-
• Open last dataset used.• Uncheck ‘Automatic processing’.
This is somewhat optional; but it makes sense to have a look.Also I add my data directory to the internal browser (viaright-click).
6

Dealing With Data

Make a directory on your computer to copy data to.
• Topspin isn’t too fussy where.
With irreplacable data, work with a copy.
• It is possible to mess up the data, even on a processingstation.
7

Dealing With DataData structure

Topspins filesystem.Datasets consist of :-• Numbered experiments.
• The raw data is an fid or serfile.
• Within those, data can beprocessed in multiple ways.
• Contained in the pdatadirectory, in numbereddirectories.
• To send data, you need to sendthe whole tree.
Its worth spending a little timelooking for yourself.
Figure 1: Filetree
8
Dealing With DataNavigation
Opening data in Topspin.
• Drag and drop works.• Internal browser.• File menu.• Command line.
9

From the command line.
• re dataset expno procno, or a subset of that.• re 10 - will read exp. no. 10 of the dataset you are in.• dir - will show the datasets in the same directory as theone you’re looking at.
• dir *wc* - the command with ‘wildcards’, in this casematches all datasets with ‘wc’ somewhere in its filename.
10
1-dimensional NMR processing

1-dimensional NMR processingWorkflow
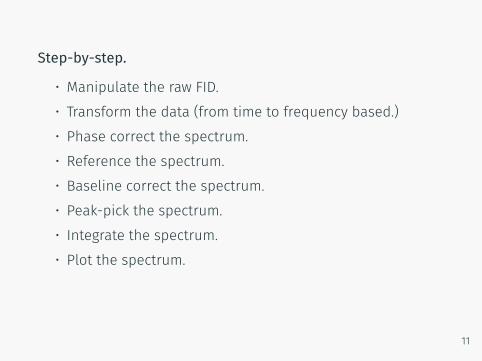
Step-by-step.
• Manipulate the raw FID.• Transform the data (from time to frequency based.)• Phase correct the spectrum.• Reference the spectrum.• Baseline correct the spectrum.• Peak-pick the spectrum.• Integrate the spectrum.• Plot the spectrum.
11

Commands to type.
Command Descriptionefp Takes you from a FID to a spectrumapk, apks Does automatic phase correctionabs, absn Does automatic baseline correctioncy, mi Sets maximum and minimum peak-picking heightppf, pps Peak-picking on full or visible spectrum.hr Shows you the whole spectrum.ph Enters manual phase correction.cal Enters spectrum referencing mode.int Enters manual integration
Table 1: Basic commands
12

1-dimensional NMR processingTransform the data
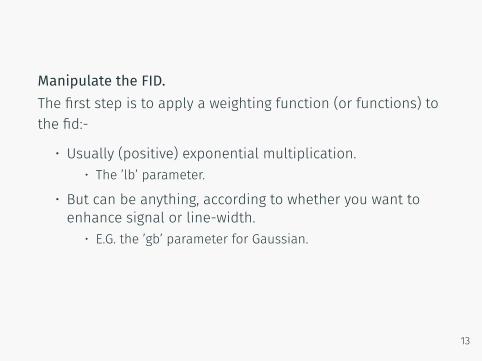
Manipulate the FID.The first step is to apply a weighting function (or functions) tothe fid:-
• Usually (positive) exponential multiplication.• The ’lb’ parameter.
• But can be anything, according to whether you want toenhance signal or line-width.
• E.G. the ’gb’ parameter for Gaussian.
13

Transform the FID.The next step is the fourier transform; to take the data fromthe time to frequency domain.Generally you type ’efp’ at the command line :-
• E – exponential multiplication.• F – fourier transform.• P – phase correction (apply dataset default.)
You should now see a picture of your result, which willprobably need further manipulation…
14

1-dimensional NMR processingPhase the spectrum

Why does the spectrum look wrong?The result so far is very unlikely to have the correct phase; youcan correct it automatically; or/and manually.
• Automatically via command line :-• apk• apk0• apks• apkm
• Manually, via the phase correction module (.ph fromcommand line)
• adjust ph0, (choose a large peak near one end)• adjust ph1• save and return (.sret from command line)
15

1-dimensional NMR processingReference the spectrum

Why are my peaks at the wrong ppm?When acquired, the instrument locks onto the deuterium inthe solvent; which is at a known frequency. You can referenceany peak to any frequency however.
• The calibration routine can be started by typing ‘.cal’.• choose a peak, click and type a value.
This gives you an ’sr’ value, which can be handy to know forreferencing 2d spectra.
16

1-dimensional NMR processingBaseline correction

Tidy the spectrum upAgain you can automatically or manually baseline correct yourspectrum. Automatically works in the majority of cases.
• Automatically via abs• ‘abs’ will also create new integral regions, or wipe existingones…
• ‘absn’ won’t wipe the integrate regions present.• Theshold dependent on ’ isen’ parameter.
• Manually via the correction module (basl from thecommand line)
• The aim of the game is to define your own polynomialfunction to subtract from your spectrum.
17

1-dimensional NMR processingPeak picking

Set the parametersAgain, this can be done automatically or manually. I usually doit automatically. There are several parameters that affect theoutput:-
• ’cy’ The height of the largest peak.• ’mi’ The minimum height of peak to be picked.• ’maxi’ The highest intensity of peaks to be picked; when Ihave probems, I set it to be about 10x ’cy’.
• ’pc’ The amount of noise rejected; low values pick morepeaks, especially on broad peaks.
• ’pscal’ Set this to ‘global’ if you have problems.
18
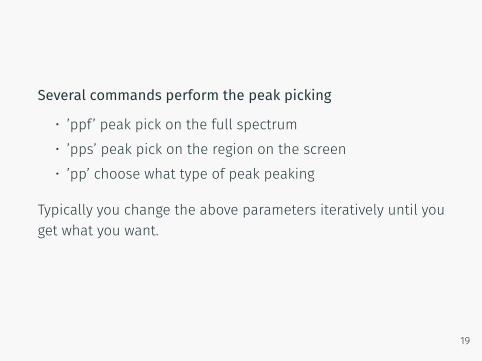
Several commands perform the peak picking
• ’ppf’ peak pick on the full spectrum• ’pps’ peak pick on the region on the screen• ’pp’ choose what type of peak peaking
Typically you change the above parameters iteratively until youget what you want.
19

Sometimes you won’t get what you want.For instance if there’s a region you don’t want to peak-pick.‘.pp’ from the command line starts the manual routine.
• Pick peaks by drawing boxes around peaks or interest.• Dependent on the peak picking parameters; ’pc’, ’maxi’ etc.
• You can also manually add a peak to the list.
20
1-dimensional NMR processingIntegration workflow

My workflow goes as follows :-
• .int to go into the routine…• cut the integrals into chunks.• delete the unwanted parts.• add other regions.• reference a known region.• .sret to save and return from the routine.
21

2-dimensional NMR processing

Into the n-th dimension…Topspin actually supports n-dimensional data; but really 2 isenough to be going on with.The workflow is pretty similar to 1-dimensional processing, butwith more degrees of freedom; there can be more to fix…
22
2-dimensional NMR processingTransformation
2d Transformation.n-d data is actually comprised of successive 1d experiments;from which the additional dimensions are derived.
• With 2d data ’xf2’ will transform all these 1d experimentsand ’xf1’ will derive the second dimension.
• The command ’xfb’ will do it all at once.
Processing parameters are perhaps more important than 1ddata. Your data acquired from our default experiments shouldgive valid results though.
23

2-dimensional NMR processingSome guidelines for processing parameters

Define the resolution.You will need to examine what the experimental conditionswere used to give some boundaries on what is possible.It is usual to interpolate the data up to a higher resolutionthan was acquired.
• 2048 x 2048 resolution is usually sufficient.• Forwards prediction in F1 is usually used :-
• Set ’Memod’ to ’LPfc’• Set ’NCOEF’ to 32 (Larger values don’t really seem to helpmuch; but you can try it)
24

Window functions.The ’window functions’ (WDW in the Procpars tab) used for thetransform, (or weighting function) are often sine or qsine.
• The ’ssb’ parameter affects how the sine functionoperates.
• SSB is often 2 or more.
Ultimate resolution.Sometimes I do change the F2 function to be ’em’; if I want toextract some high quality 1d data from the 2d dataset.You’ll need to type ’xfb’ after each adjustment to see the result.
25

2-dimensional NMR processingNon-uniform sampling

You don’t get something for nothing…If you think about a 2d spectrum, its mostly empty space, andit takes a lot of acquiring to see that. You might think there is abetter faster way. There is, with some proviso’s…
How it works.
• One way. You acquire a sub-set of the full sampling space.• You then do a lot of signal processing to reconstruct thespectrum…
• …this takes a lot of computation.
26

Processing an NUS spectrumThe latest version of Topspin will do this, earlier versions needa special license.
• Set the ‘mdd_mod’ flag to be ‘cs’ (‘Compressed-sensing’)• Unless its a 3d dataset or doesn’t work or gives a poorresult…Then set it to ‘mdd’ (‘Multi-dimensionaldeconvolution’)
• Type ‘xfb’• Wait…
27

There are processing software options…Other software may have algorithms that are faster; this is avery active area of scientific development.
• MNova.• NMRPipe–With qMDD and MDDNMR ‘plugins’
These either cost money, or are difficult to use/export datafrom.
28

2-dimensional NMR processing2d Phase correction

Now the tricky bit…A bit more complicated than 1d, but not every 2d needs to bephased; examine the pulseprogram.
• Choose a diagonal peak from one end; maybe one fromthe middle and then one from the other end of thespectrum.
• Choose the rows to phase first.• Choose the upper-most 1d spectrum (Somewhere towardsthe end of the spectrum)
• Adjust ’ph0’ so that the spectrum is phased under the redline.
• Adjust ’ph1’ so that the spectrum furthest in ppm from theone you just selected comes into phase.
• Now do the same for the columns.
29

2-dimensional NMR processing2d baseline correction
There’s not much to say, I’ve only ever used two commands…
• ’abs1’• ’abs2’
30

2-dimensional NMR processingIntegration and peak-picking

I find its somewhat unusual to do this, and its best donemanually.
• Automated peak-picking can produce thousands of peaks.
• The trick is to set the lowest level to that of the contours.
• It doesn’t always make sense to integrate 2d data anyway.
31

2-dimensional NMR processingFinishing touches
Now make it look pretty!There’s a couple more things to set up…
• Define 1d projections by right-clicking.• Define the number of contours used.
• Type ’nlev 32’ (32 contour levels are useful; more than 32aren’t…)
• Type ’clev’ to recalculate the levels.
The data should now be ready to plot!
32
Taking spectra out of Topspin

Taking spectra out of TopspinPlotting and printing

Plotting and printingClicking the ‘Plot’ tab or typing ’plot’ takes a layout defined inthe dataset (see the processing tab, automation section) andstarts the routine. This is really quite an in depth topic; but afew key points.
• The editor behaves a little like Powerpoint; in that thedocument is composed of objects; that can bemanipulated.
• These layouts can be saved and loaded from the editor.• The plot you’ve made can be exported to a variety offormats.
You can get a WYSIWYG print of the main work area by typing‘prnt’.
33

Taking spectra out of TopspinData backup

Processed data can be arbitrarily largeYou can fill up your hard-disk quite rapidly processing nD data.This is another reason we don’t save it.
• You may need to delete old processed data• Or archive your work
Open DataThe ‘Open Data’ initiative requires that the data be available.Although probably not strictly necessary, you may wish to :-
• Provide the processed data.• Convert the data to the ‘open-source’ JCamp format.
34

Taking spectra out of TopspinJCamp Data

The problem of propietry data.Brukers data is in a binary (non-ascii) format, that may changewith Topspin version; so there’s no guarantee that you’ll beable to:-
• Import it to other reprocessing software.• Import it to older versions of Topspin. (Particularly foracquisition.)
35

JCamp-DX
• The JCamp-DX format has been defined and designed byIUPAC committee to be an electronic data standard.
• There are definitions for NMR, IR, MS, IMS data; along withchemical structure.
• Bruker can export both your raw and processed data. Yourmileage on importing it to other software may vary…
36

The commands.To export to Jcamp, at the command line type :-
tojdx
For help type:-
tojdx?
You should regard this in the same way as you would any otherbackup. As with all backups, you should ensure its doing whatyou think its doing and that you can actually use the backupas you intended.
37

Optimising your work flow

Optimising your work flowParameter sets

Dictate your own conditions.You can save a default experiment type to a parameter set,then load them again for any experiment of that type.
• Type ’wpar par-name’ at the command line.• Choose a combination of ’proc’, ’outd’, ’title’ and ’clevels’.Warning! Writing ’ACQU’ parameters is probably not agood idea.
Writing ‘aqcu’ parameters.These are frequency dependent. So say you write parametersfrom a 500 MHz dataset; then load them into a 400 data set...You’ve just broken your 400 data!
38

To read a parameter set.• rpar par-name• Or rpar par-name par-part
• e.g. rpar proton.std proc — Will read in the processingparameters of the parameter set.
39

Optimising your work flowAutomation

…and now some clever bits…
• Macros• A list of commands. Type ’edmac’
• ’AU’ programs• ’C’ code. Type ’edau’• There are service programs on the server.
40

Using some of the service programs.
Command Descriptionservice-def-proc Does default processing on
the experiment no. you arein.
service-master-proc As above, but goes throughall the experiments.
service_nohump n Chops the baseline into nchunks and baselines cor-rects. If it looks wrong, do‘efp’ and use different n.
Table 2: Service AU programs
41

Other useful features

• Working with multiple windows.• Multiple display.
• Works within a 2d dataset also.• Load to portfolio in plot editor.
• Structure Editor.• Export peaks with multiplet information in journal format.
• ’managuide’ and ’mana’ (Multiplet Analysis)• ...see online help!
• Dynamics package.
42

Other useful featuresMultiplet analysis

Draw or load a .mol file.The multiplet analysis tool can annotate a stucture; Topspinhas a built in structure editor acessable from the ‘Structure’tab. This seems fairly standard to me, just takes a bit ofplaying with to get to work. Some points though…
• Topspin has a default directory for structures; find it viathe ‘set’ menu.
• The plot layout saves the location of the structure file.• The service plots have this set to ‘../structure.mol’• So to get these layouts to work do ‘save as…Choose currentEXPNO and the filename ../structure.mol’
43

Multiplet AnalysisThis tool aims to find multiplets; link them together, annotatea structure and then output a journal-ready report.. Started bytyping ‘mana’ or ‘managuide’ from the command line. The‘managuide’ tries to walk you through the process. But thebasic process is as follows…
• Make sure all the peaks in the multiplets you want toanalyse are picked.
• Define the multiplets.• Link the multiplets.• Annotate the spectrum.• Generate the report.
44

Other useful featuresThe analysis of things that change…

The ‘Dynamics Centre’ package.This is a separate program and reads in processed data fromTopspin. It can do a variety of analyses; for instance relaxation,kinetics and diffusion.
• The first time you run it, set the default directory in thepreferences.
• Process all your data correctly in Topspin first.• Click through the work-flow in the software.
45
(The END)

(The END)Send an email to [email protected] with any questions.