processed drug classification and temporal analysis by
TRANSCRIPT

Orbital: The Electronic Journal of Chemistry journal homepage: www.orbi ta l .ufms.br
e-ISSN 1984-6428 | Vol 10 | | No. 7 | | October-December 2018 |
FULL PAPER
*Corresponding author. E-mail: [email protected]
Processed Drug Classification and Temporal Analysis by Technical Chemometrics for Quality Controlling Using Spectroscopy of FT-IR and X-Ray Diffraction
Andressa Cristina De Rossi and Vanderlei Aparecido de Lima
Departamento de Química. Universidade Tecnológica Federal do Paraná – UTFPR, campus Pato Branco/PR. Via do Conhecimento, KM 01, s/n - Fraron, Pato Branco - PR, 85503-390, Brazil. Article history: Received: 12 January 2018; revised: 21 February 2018; accepted: 09 October 2018. Available online: 31 December 2018. DOI: http://dx.doi.org/10.17807/orbital.v10i7.1138 Abstract: The aim of the present study was to analyze samples of the industrialized drugs, topiramate and levothyroxine sodium by FT-IR and XRD for a period of five months. Cluster chemometrics and principal component analysis were used to plot the samples in this time series and to compare FT-IR and XRD techniques for drug classification. By means of the chemometric analyzes of the time series it was possible to separate the two drugs in different groups satisfactorily. The analysis of PCA showed great homogeneity between samples, explaining 99.8% of the variability of the data, confirming the integrity of the sample matrices during the period. The comparison between FT-IR and XRD techniques showed great efficiency for drug classification. The FT-IR technique explained 99.9% of the variability of the data from the sample set while the XRD technique explained 98.6%. Given the above, you can prove the integrity of topiramate medication and levothyroxine sodium over time by means of spectroscopic analyzes associated with chemometric analysis, as well as prove the efficiency of mid-infrared techniques, and diffraction X-ray coupled to chemometric analysis Quality control in the pharmaceutical segment. Keywords: cluster; levothyroxine sodium; PCA; quality control; topiramate
1. Introduction
The pharmaceutical industry has come up with the need to increase the life expectancy of the population. The drugs that were manufactured in a traditional manner and only supplied the family demand, are now produced on a large scale [1]. Currently pharmaceutical companies aim to research, produce, market and distribute medicines to the community. The pharmaceutical industry is one of the sectors that move the world market. In Brazil, the sector is in monopolized by large companies, which were the most foreign capital [2].
The levothyroxine sodium (C15H10I4NNaO4.H2O) is an odorless salt, its color varies from white and pale yellow, it is hygroscopic and can be amorphous or crystalline
powder. It is considered a synthetic levo-isomer and is used in hormone replacement therapy or supplementation in patients who have hypothyroidism [3;2]. The chemical structure of levothyroxine sodium is represented in FIGURE 1.
Figure 1. Levothyroxine Sodium chemical
structure.
Topiramate (Cl2H21NO8S) is other drug widely used in Brazil. It is derived from D-fructose and its first use was to combat diabetes. Because of
De Rossi & De Lima FULL PAPER
Orbital: Electron. J. Chem. 10 (7): 496-502, 2018 497
its multiple mechanisms of action, the drug can be used to control schizophrenic and seizures, has anticonvulsant properties and has use as a treatment for dependence disorders to drugs and alcohol as well, bipolar disorders. The topiramate chemical structure is shown in FIGURE 2 [5;6;7].
Figure 2. Topiramate Chemical Structure.
There are several techniques to characterize chemical compounds, among them, X-ray diffraction and mid-infrared spectroscopy. The X-ray Diffraction (XRD) provides the crystal structure of a compound using coherent scattering of radiation X. A crystalline compound is formed by highly ordered atoms. therefore, it is said that these atoms are uniformly and orderly distributed in a diffraction grating. Each atom or molecule has a specific place in diffraction grating, and the smallest unit of the crystal holding the symmetry of the molecule is called a cell unit. Through multiple copies of the unit cell, one can draw the geometry of the crystal. The distance between points in a lattice is in the range of 10-10 meters, which is the same spectral range of X-rays, it makes it possible to trace a noticeable diffraction pattern [8;9].
Diffuse Reflection Infrared Fourier Transform Spectroscopy (DRIFTS) has great application in both pharmaceutical research and in the chemical industry in general. This spectroscopic technique, the infrared beam strikes a small amount of sample, and after that being partially absorbed infrared radiation returns by multiple scattering. Its advantages are to obtain fast results with small amounts of samples, the minimum waste generation as well as the low cost of the analysis [10]. The result of this analysis is an infrared spectrum that provides absorbance intensity function against characteristic wave number for each functional group present in the analyte. It is, therefore,
widespread for the characterization of compounds by their chemical structure [11].
The interaction data from the chemical analysis with statistical techniques is called chemometrics [11]. There are several studies that use of chemometrics for relating the spectroscopic data provided by FT-IR, using multivariate statistical analysis, such as Principal Component Analysis (PCA), capable of determining the correlation between a data group, or cluster analysis, used to group data sets through similar characteristics [12].
Given the above the present study aimed to analyze samples of industrialized drugs, topiramate and levothyroxine, for mid-infrared through DRIFTS accessory, for five months, using the chemometric techniques of clustering and principal component analysis to draw profile samples in this time series.
2. Results and Discussion 2.1 Temporal Analysis
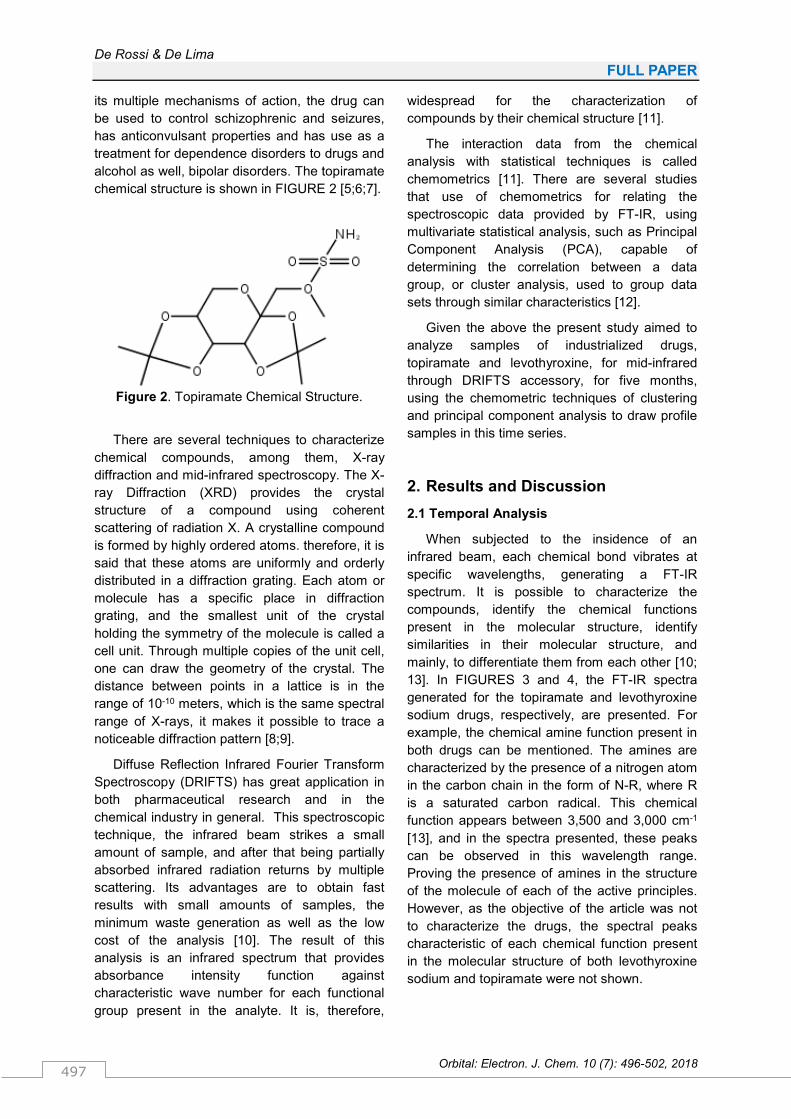
When subjected to the insidence of an infrared beam, each chemical bond vibrates at specific wavelengths, generating a FT-IR spectrum. It is possible to characterize the compounds, identify the chemical functions present in the molecular structure, identify similarities in their molecular structure, and mainly, to differentiate them from each other [10; 13]. In FIGURES 3 and 4, the FT-IR spectra generated for the topiramate and levothyroxine sodium drugs, respectively, are presented. For example, the chemical amine function present in both drugs can be mentioned. The amines are characterized by the presence of a nitrogen atom in the carbon chain in the form of N-R, where R is a saturated carbon radical. This chemical function appears between 3,500 and 3,000 cm-1 [13], and in the spectra presented, these peaks can be observed in this wavelength range. Proving the presence of amines in the structure of the molecule of each of the active principles. However, as the objective of the article was not to characterize the drugs, the spectral peaks characteristic of each chemical function present in the molecular structure of both levothyroxine sodium and topiramate were not shown.
De Rossi & De Lima FULL PAPER
Orbital: Electron. J. Chem. 10 (7): 496-502, 2018 498
Figure 3. Topiramate FT-IR spectrum, with their
replicates.
Figure 4. Levothyroxine Sodium FT-IR
spectrum, with their replicates.
Multivariate analysis of clustering and ACP were performed to analyze the data set pattern of these arrays in function of time to increase sensitivity and efficiency of classification techniques, spectral bands where there was no change in the respective signals have been excluded. Thus, three spectral tracks (called T1, T2 and T3) were removed: T1 from 4000.00 to 3764.00 cm-1, T2 from 2841.50 to 2401.00 cm-1 and T3 from 2246.00 to 1716.50 cm-1.
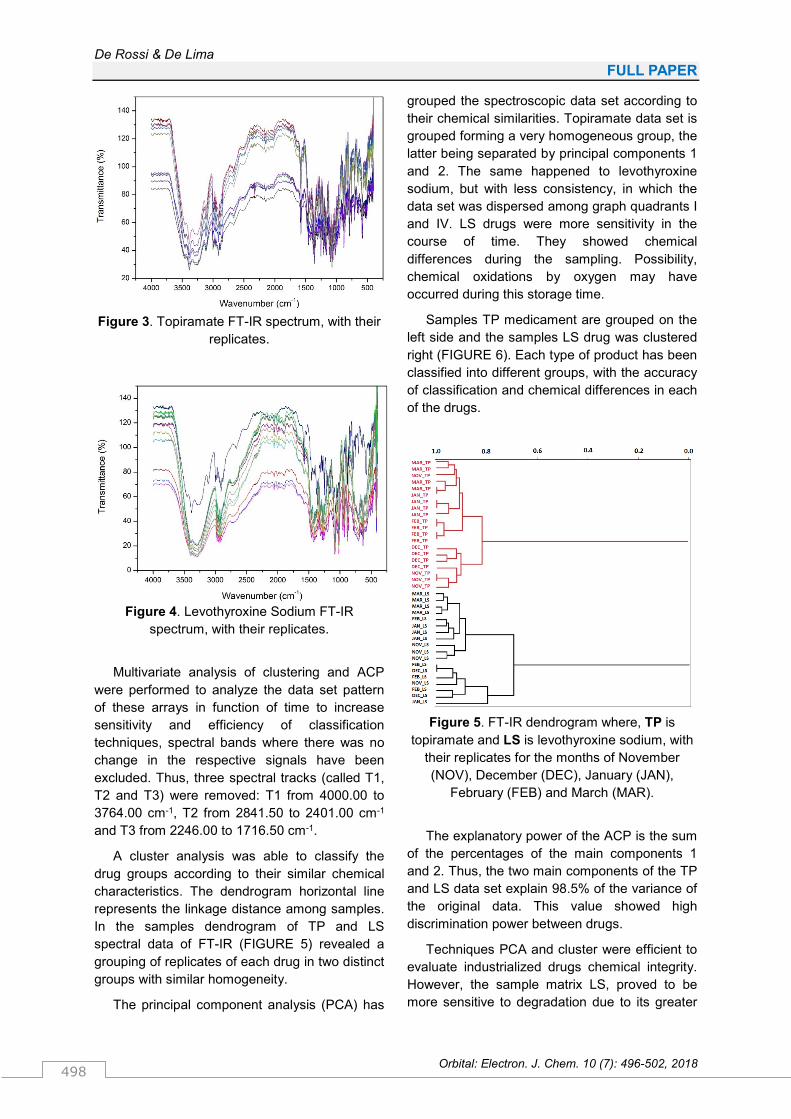
A cluster analysis was able to classify the drug groups according to their similar chemical characteristics. The dendrogram horizontal line represents the linkage distance among samples. In the samples dendrogram of TP and LS spectral data of FT-IR (FIGURE 5) revealed a grouping of replicates of each drug in two distinct groups with similar homogeneity.
The principal component analysis (PCA) has
grouped the spectroscopic data set according to their chemical similarities. Topiramate data set is grouped forming a very homogeneous group, the latter being separated by principal components 1 and 2. The same happened to levothyroxine sodium, but with less consistency, in which the data set was dispersed among graph quadrants I and IV. LS drugs were more sensitivity in the course of time. They showed chemical differences during the sampling. Possibility, chemical oxidations by oxygen may have occurred during this storage time.
Samples TP medicament are grouped on the left side and the samples LS drug was clustered right (FIGURE 6). Each type of product has been classified into different groups, with the accuracy of classification and chemical differences in each of the drugs.
Figure 5. FT-IR dendrogram where, TP is
topiramate and LS is levothyroxine sodium, with their replicates for the months of November (NOV), December (DEC), January (JAN),
February (FEB) and March (MAR).
The explanatory power of the ACP is the sum of the percentages of the main components 1 and 2. Thus, the two main components of the TP and LS data set explain 98.5% of the variance of the original data. This value showed high discrimination power between drugs.
Techniques PCA and cluster were efficient to evaluate industrialized drugs chemical integrity. However, the sample matrix LS, proved to be more sensitive to degradation due to its greater
De Rossi & De Lima FULL PAPER
Orbital: Electron. J. Chem. 10 (7): 496-502, 2018 499
dispersion in the sample set of PCA and the LS_DEC samples that were grouped with the sample set of TP. Even with this dispersion in the data set, the FT-IR technique combined with chemometric proved to be an important tool for monitoring during shelf-live drug.
Figure 6. PCA FT-IR scores graph of temporal
analysis where, TP is topiramate and LS is levothyroxine sodium, with their replicates for the
months of November (NOV), December (DE), January (JAN), February (FEB) and March
(MAR).
2.2 FT-IR and XRD Techniques comparison for Drug Classification
The data sets obtained by analysis of the FT-IR and XRD drugs are shown in FIGURE 7 and 8, respectively. However, the peaks characteristic of each chemical function were not described in this paper.
Figure 7. FT-IR spectrum of topiramate (TP) and levothyroxine sodium (LS), with their replicates.
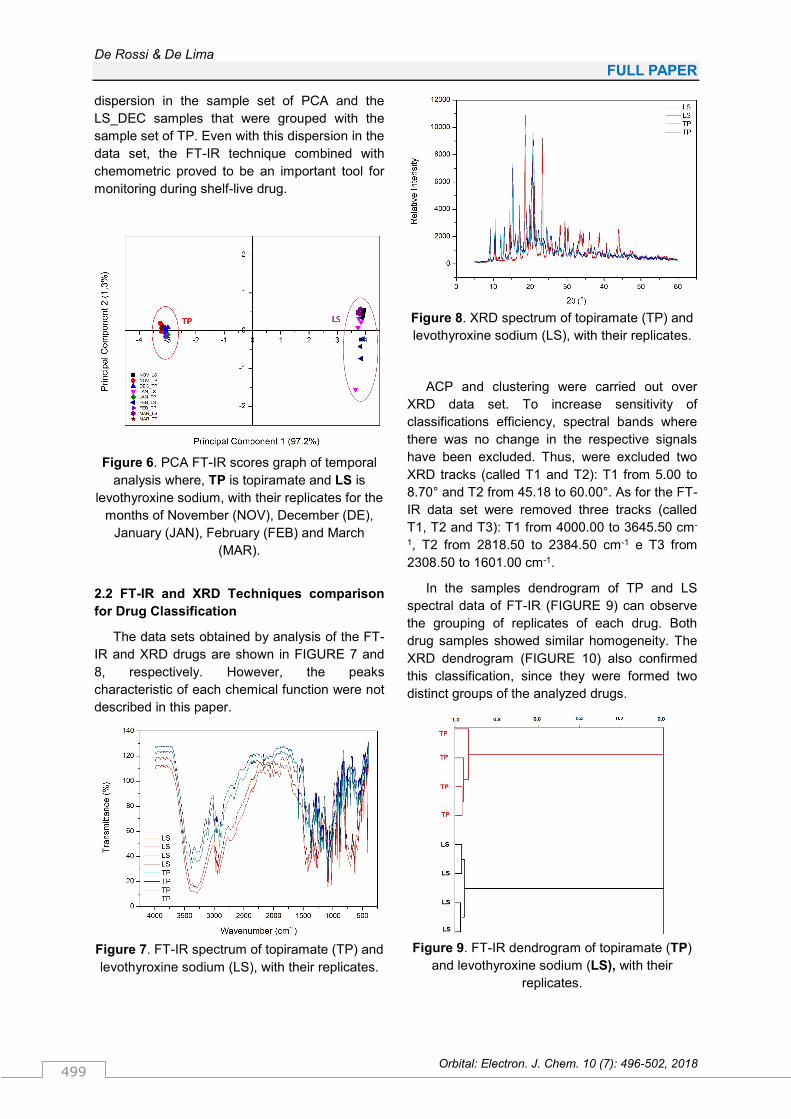
Figure 8. XRD spectrum of topiramate (TP) and levothyroxine sodium (LS), with their replicates.
ACP and clustering were carried out over XRD data set. To increase sensitivity of classifications efficiency, spectral bands where there was no change in the respective signals have been excluded. Thus, were excluded two XRD tracks (called T1 and T2): T1 from 5.00 to 8.70° and T2 from 45.18 to 60.00°. As for the FT-IR data set were removed three tracks (called T1, T2 and T3): T1 from 4000.00 to 3645.50 cm-
1, T2 from 2818.50 to 2384.50 cm-1 e T3 from 2308.50 to 1601.00 cm-1.
In the samples dendrogram of TP and LS spectral data of FT-IR (FIGURE 9) can observe the grouping of replicates of each drug. Both drug samples showed similar homogeneity. The XRD dendrogram (FIGURE 10) also confirmed this classification, since they were formed two distinct groups of the analyzed drugs.
Figure 9. FT-IR dendrogram of topiramate (TP)
and levothyroxine sodium (LS), with their replicates.

De Rossi & De Lima FULL PAPER
Orbital: Electron. J. Chem. 10 (7): 496-502, 2018 500
Figure 10. XDR dendrogram of topiramate (TP)
and levothyroxine sodium (LS), with their replicates.
When performing the principal component analysis (PCA) with data sets, both in FT-IR (FIGURE 11) and in the XRD (FIGURE 12) were grouped according to their chemical similarities. The data set of levothyroxine these two techniques were clustered, forming a very homogeneous group, the latter being separated by principal components 1 and 2. And the same happened to topiramate, but with less homogeneity. For ACP and FT-IR data set, the samples LS (red) were grouped on the right side and left side, the samples were TP (green). For the XRD data set of the samples LS (brown) were grouped on the left side and the right side, the samples were TP (red).
Figure 11. PCA FT-IR scores graph where,
MAR_TP is topiramate and MAR_LS is levothyroxine sodium, with their replicates.
Figure 12. PCA XDR scores graph where,
MAR_TP is topiramate and MAR_LS is levothyroxine sodium, with their replicates.
For PCA-IR, the sum of the principal component 1 and 2 explain 99.9% of the variance of the original data. Two main components of the XRD PCA are able to explain 98.6% of the data variability. And these values of high power of discrimination between drugs.
Both multivariate techniques ACP and cluster were efficient in the industrialized drugs topiramate and levothyroxine rating. However, the FT-IR technique was more sensitive as the classification of dragees that the technique XRD.
3. Material and Methods The samples consisted of industrialized drug
active principles: levothyroxine sodium and topiramate. Two dragees were used, the same batch and manufacturer for FT-IR analysis and a dragee from the same batch and manufacturer to XRD analysis.
The drugs were macerated with the aid of mortar and pestle and placed in eppendorf vials labeled with the number 1 and 2, corresponding to each dragee. The mass corresponding to dragee 1 had its mass divided between analyzes so that, of the mass of drug was used for FT-IR analysis, part of the mass to XRD analysis. Analyses occurred in duplicate to FT-IR and XRD.
IR spectra were obtained on Frontier spectrometer (Perkin Elmer®) Brand Fourier Transform, and DRIFTS accessory for diffuse reflectance. The parameters of analysis were:

De Rossi & De Lima FULL PAPER
Orbital: Electron. J. Chem. 10 (7): 496-502, 2018 501
spectral range used ranged from 400 to 4000 cm-1, resolution of 2 cm-1 and accumulation number of 32 scans per spectrum. Was used 5 mg of sample together with 95 mg of a non-absorbent matrix, potassium bromide (KBr). The blank, however, was performed only with KBr.
The X-ray diffraction patterns were obtained on a Rigaku diffractometer, model MiniFlex 600, using Cu Kα radiation (λ = 1.5406 Å). The default settings for the XRD analysis were: voltage of 40 kV, current of 15 mA, in a range of 3 to 60° in 2θ mode. Opening slit of divergence and receiving of 0.125° and 0.3°, respectively. It was used step of 0.02° and step scan mode with 4 second scan per step.
The data generated by FT-IR and XRD were subjected to multivariate analysis, Principal Component Analysis - PCA and Cluster, performed with the aid of Pirouette software version 4.5 with MSC transformation and preprocessing of centralization by mean.
4. Conclusions Through this study, it was confirmed that both
multivariate techniques, clustering and PCA, combined with spectroscopic technique of FT-IR, were effective for time series evaluation of drugs industrialized topiramate and levothyroxine.
The spectroscopic data set dendrogram of temporal analysis split into two separate groups the drugs, TP and LS. The samples from each group showing still high homogeneity. Spectroscopic data set PCA of temporal analysis formed two different groups too. Topiramate dataset formed a very homogeneous group. And the same, happened for levothyroxine sodium, but less homogeneity, because the samples were dispersed between the quadrants I and IV of scores graph.
The sample LS, proved to be more sensitive to degradation due to its greater dispersion in the sample set of ACP, while TP drug may have undergone chemical oxidation. Even with this dispersion in the data set, the FT-IR combined with chemometrics technique proved to be an important tool for quality control of drugs topiramate and levothyroxine sodium.
The study may also confirm the efficiency of the classification of TP and LS drugs from
pharmaceutical companies, through FT-IR techniques and XRD combined with chemometrics. The both dendrograms as FT-IR as XRD, separating the two drugs in different groups, because of their chemical characteristics. Introducing greater homogeneity for the set of FT-IR data. Identifications by ACP through FT-IR and XRD were efficient in the rankings of both drugs. However, the FT-IR technique was more sensitive as the classification for this type of matrices.
From the foregoing, the association of FT-IR techniques and DRX with the statistics technical, clustering and ACP, could be applied to assessment for industrialized drugs. In order to determine its quality and its similarity to drugs already standardized during time series. It is therefore a practical way to carry out quality control for industrial drugs.
Acknowledgments This work was carried out with the support of
the Araucaria Foundation FA - Paraná/Brazil.
References and Notes [1] Valduga, C. J. Revista de Pesquisa e Inovação
Farmacêutica 2009, 1, 40.
[2] Investe SP. Available at: [www.investe.sp.gov.br/setores-de-negocios/saude-e-ciencias-da-vida/farmaceutico/] Accessed May 13, 2016.
[3] ANVISA - Agência Nacional de Vigilância Sanitária. Levotiroxina Sódica. Available at: <http://www.anvisa.gov.br/datavisa/fila_bula/frmVisualizarBula.asp?pNuTransacao=5847622015&pIdAnexo=2717924> Accessed September 30, 2016.
[4] Cavalcanti, P. P. Estudo de biodisponibilidade comparativa entre duas formulações contendo levotiroxina sódica em voluntários sadios. 2005. 189 f. Dissertação (Mestrado em Farmacologia) - Universidade Federal do Ceará. Faculdade de Medicina, Fortaleza, 2005.
[5] Janssen-Cilag Farmacêutica Ltda. Topamax - Topiramato. Available at: <http://www.anvisa.gov.br/datavisa/fila_bula/frmVisualizarBula.asp?pNuTransacao=10586012013&pIdAnexo=1904295> Accessed October 18, 2016.
[6] Pedrazzoli Júnior, J.; Zanin, M.; Coelho, E. C.; Marchioretto, M.; Meurer, E. C.; Barros, F. A. P.; Calafatti, S. A.; Morais, D. C.; Lima, L. G. Rev. Bras. Med. 2014, 71, 251.
[7] Yacubian, E. M. T. Jornal de Pediatria 2002, 78.
[8] Porto, D. L. Contribuições Sobre Estudos Térmicos (TG/DTG, DTA, DSC e DSC-Fotovisual) da

De Rossi & De Lima FULL PAPER
Orbital: Electron. J. Chem. 10 (7): 496-502, 2018 502
Rifampicina e seus Principais Produtos de Degradação. 2014. 141 f. Dissertação (Mestrado em Bioanálises e Medicamentos) - Universidade Federal do Rio Grande do Norte, Natal, 2014.
[9] Fonseca Filho, H. D.; Lopes, G. A. C. Estação Científica, UNIFAP 2003, 3, 31.
[10] Parisotto, G.; Marques, M.; Hermes, A. L.; Flores, E. M. M.; Ferrão, M. F. Orbital: Electron. J. Chem. 2009, 1, 38. [Link]
[11] Souza, J. S.; Ferrão, M. F. Rev. Bras. Cienc. Farm. 2006, 42, 3.
[12] Sabin, J. G.; Ferrão, M. F.; Furtado, J. C. Rev. Bras. Cienc. Farm. 2004, 40, 3.
[13] Kriz, G. S.; Pavia, D. L.; Lampman, G. M. Introdução À Espectroscopia, 4th ed. São Paulo, SP: Cengage Learning, 2010.