process validation of perampanel tablet anti convulsant...
TRANSCRIPT

PROCESS VALIDATION OF PERAMPANEL TABLET
ANTI CONVULSANT DRUG
A dissertation submitted to
THE TAMILNADU Dr.M.G.R MEDICAL UNIVERSITY
CHENNAI- 600 032.
In partial fulfillment of the requirements for the award of Degree of
MASTER OF PHARMACY
IN
PHARMACEUTICS
Submitted
By
Sanneboyina Nagarjuna
(Reg No:261211162)
Under the guidance of
Mr.M.Pitchaipillai, M.Pharm.,
DEPARTMENT OF PHARMACEUTICS
EDAYATHANGUDY.G.S PILLAY COLLEGE OF PHARMACY
NAGAPATTINAM-611002
Prof.Dr.D.Babu Ananth,M.Pharm., Ph.D.,
Principal,
Edayathangudy.G.S.Pillay College of Pharmacy,
Nagapattinam – 611 002.
CERTIFICATE
This is to certify that the dissertation entitled “PROCESS
VALIDATION OF PERAMPANEL TABLET ANTI
CONVULSANT DRUG” submitted by SANNEBOYINA
NAGARJUNA (Reg No:261211162)in partial fulfillment for the award
of degree of Master of Pharmacy to the Tamilnadu Dr. M.G.R Medical
University, Chennai is an independent bonafide work of the candidate
carried out under the guidance of Mr.M.Pitchaipillai,M.Pharm.,
Assistant Professor, Department of Pharmaceutics,
Edayathangudy.G.SPillay College of Pharmacy during the academic year
2013-2014.
Place: Nagapattinam Prof.Dr.D.BabuAnanth,M.Pharm., Ph.D.,
Date:

ACKNOWLEDGEMENT
I would like to express profound gratitude to Chevalier
Thiru.G.S.Pillay, Chairman, E.G.S.Pillay College of Pharmacy, and
Thiru. S.Paramesvaran, M.Com., FCCA., Secretary, E.G.S.Pillay College
of Pharmacy.
I express my sincere and deep sense of gratitude to my guide
Mr.M.Pitchaipillai, M.Pharm., Assistant Professor, Department of
Pharmaceutics, E.G.S.Pillay College of Pharmacy, for his invaluable and
extreme support, encouragement, and co-operation throughout the course
of my work.
It is my privilege to express my heartfelt thanks to
Prof.Dr.D.Babu Ananth, M.Pharm, Ph.D., Principal, E.G.S.Pillay
College of Pharmacy, for providing me all facilities and encouragement
throughout the research work.
I wish to express my great thanks to Prof.Dr.M.Murugan,
M.Pharm.,Ph.D., Director cum Professor , Department of
Pharmaceutics, E.G.S.Pillay College of Pharmacy, for his support and
valuable guidance during my project work.
I wish to express my great thanks to Prof.K.Shahul Hameed
Maraicar, M.Pharm., (Ph.D), Director cum Professor , Department of
Pharmaceutics, E.G.S.Pillay College of Pharmacy, for his support and
valuable guidance during my project work.
I would like to extend my thanks to all the Teaching Staff and
Non Teaching Staff, who are all, supported me for the successful
completion of my project work.
Last but not least, I express my deep sense of gratitude to my
parents, family members and friends for their constant valuable blessings
and kindness.

INDEX
S.NO CONTENTS PAGE NO
1 INTRODUCTION 1
2 LITERATURE REVIEW 25
3 AIM & OBJECTIVE 28
4 PLAN OF WORK 29
5 DRUG PROFILE 30
6 MATERIALS & METHODS 33
7 RESULTS & DISCUSSION 45
8 SUMMARY & CONCLUSION 76
9 BIBLIOGRAPHY 77

INTRODUCTION
Validation is a subject that has grown in importance within the global healthcare industry
over the past 25 years. During that time period, it has perhaps resulted in more changes in
practices and methods.
One of the major concerns with any design whether it be for a facility , a piece
of equipment or a production process- is how its validation will be accomplished.
Validation programs must be established to facilitate the accomplishment of
that very goal. A clear line of communication must be established to ensure that the
operational objectives as implemented in the design can meet the validation requirements
for that design.1
HISTORICAL BACKGROUND:
The idea of process validation is not new and is common in many different fields of life;
one can find the need for process validation in almost any kind of process. Sharp
interpreted pharmaceutical process validation simply as a step in developing the
maintenance of the quality of manufactured medicines. Process validation has been
included in the first interpretations of good manufacturing practice (GMP) to ensure that
medicines are safe and have the identity and strength they are supposed to have.
US regulations. Bernard T. Loftus, a former director of FDA, previously described how
the principles of process validation evolved in the US from the first current
good manufacturing practice (cGMP) in 1963 to the first Guideline on General Principles
of Process Validation in 1987. Prior to 1963, the only way for FDA to prove that a
1

process had not done what it was designed to do was to take samples from the final
product, analyse them and show deviations from the specification.
From 1963, the law stated that a pharmaceutical manufacturer had to
follow cGMP regulations whilst FDA received authorization to inspect manufacturing
facilities. This was a direct consequence of a series of accidents in which people were
injured and even killed.
These incidents led to the evaluation of manufacturing processes, but it still took a long
time before the authorities could point out clear and serious production faults and demand
better procedures and processes.
Things began to change during the late 1960s and early 1970s when new types of
incidents, such as poorly mixed, highly potent tablets and insufficient sterilization
procedures for large volume parenterals caused serious patient disorders. Many speeches
pointing out the need for process validation were made by US authorities and the
expression "validated manufacturing process" was finally defined in the Drug Process
Inspections Compliance Program in 1978. The more precise definition and adjustment of
the concept for process validation was published in the Guideline on General Principles
of Process Validation in 1987 and, since then, exhaustive process inspections have been
routinely performed by FDA. It took a long time before process validation was directly
named in US cGMP regulations.2
2

On march 29, 1983 draft on guidelines entitled “Guidelines on General
principles of process validation” was made available & the same was finalized in may
1987 3
The finalized definition was as follows “A documented programme, which provides a
high degree of assurance that a specific process will consistently produce a product
meeting its predetermined specifications & quality attributes. 3,4
New definition of process validation as "the collection and evaluation of data, from the
process design stage through production, which establishes scientific evidence that a
process is capable of consistently delivering quality products". Thus, process validation is
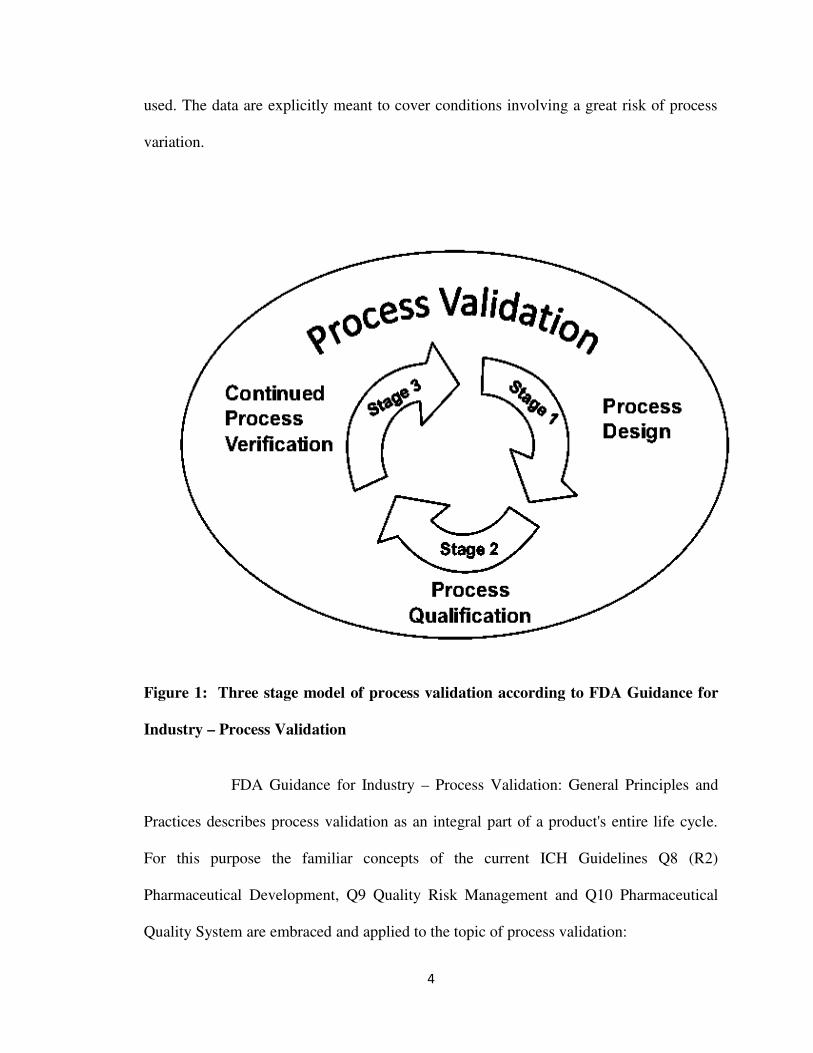
now split up into 3 stages shown in figure 1:
• Stage 1 "Process Design" (The commercial process is based on experiences
gained from development and scale-up)
• Stage 2 "Process Qualification" (During this stage, the reproducible, commercial
scale is confirmed on the basis of process design)
• Stage 3 "Continued Process Verification" (This stage is meant to show that the
process is in a state of control during routine production)
The text states expressly that in practice these 3 stages might overlap. With emphasis, it
urges manufacturers to prove with a high degree of assurance that the product can be
manufactured according to the quality attributes before a batch is placed on the market.
For this purpose, data from laboratory-, scale-up and industrial scale are meant to be
3
used. The data are explicitly meant to cover conditions involving a great risk of process
variation.
Figure 1: Three stage model of process validation according to FDA Guidance for
Industry – Process Validation
FDA Guidance for Industry – Process Validation: General Principles and
Practices describes process validation as an integral part of a product's entire life cycle.
For this purpose the familiar concepts of the current ICH Guidelines Q8 (R2)
Pharmaceutical Development, Q9 Quality Risk Management and Q10 Pharmaceutical
Quality System are embraced and applied to the topic of process validation:
4

Validation is an integral part of the quality assurance and its simple meaning is
‘action of proving’. It involves controlling the critical steps of a system, which results in
output of repeatable attributes validation itself does not improve the process but confirms
consistent output. 6
TYPES OF VALIDATION:
Following are the different types of validation.
∗ Process validation
∗ Analytical method validation
∗ Cleaning validation
∗ Water system validation
∗ Computer system validation
∗ Equipment qualification
∗ Facility qualification
Qualification is the subset of validation. Qualification and validation only appear
to be the beginning of a continues development process in the quality assurance of
the pharmaceutical industry. Equipment or equipment systems are qualified &
processes are validated.
WHY VALIDATION:
5

The prime objective of the pharmaceutical plant, whether in production or in quality
control is to manufacture consistently products of the requisite quality at the lowest
possible cost.
According to FDA, assurance of product quality is derived from careful and
systematic attention to a number of important factors, including selection of quality
components and materials, adequate product and process design and control of the
process through in-process and end-product testing.
Thus, it is through careful design (qualification) and validation of both the
process and its control systems that a high degree of confidence can be established that
all the individual manufacturing units of a given batch or succession of batches that meet
specifications will be acceptable.
GMPs and validation, two concepts that cannot be separated are essentially to quality
assurance. Frequently, the validation of a process will lead to quality improvement, in
addition to better quality consistency.
The reasons why pharmaceutical industry is concerned that their process performs
consistently as expected that is, they are validated. 6,12
Assurance of quality:
It is important for the well understanding that, the process is in a state of control and to get
confidence in the quality of the product manufactured.
Cost reduction:
Experience and common sense indicates that a validated process is a more efficient
process and a process that possesses less re-works, rejects, wastages and so on.
Regulatory requirement:
6

Validation is considered to be an integral part of GMPs. Worldwide compliance with
validation requirements is necessary for obtaining approval to manufacture and to
introduce new products.
Process optimization:
The optimization of a process for maximum efficiency, while maintaining quality
standards is a consequence of validation. The optimization of the facility, equipment,
systems and processes results in a product that meets quality requirements at the lowest
cost.
PRINCIPLES OF VALIDATION: The basic principles for validation was stated as follows
Quality, safety and effectiveness must be designed and built into the product.
Establish that the process equipment has the capability of operating within required
parameters.
Demonstrate that controlling, monitoring and/or measuring equipment and
instrumentation are capable of operating within the parameters prescribed for the
process equipment.
Perform replicate cycles (runs) representing the required operational range of the
equipment to demonstrate that the processes have been opted within the prescribed
parameters for the process and that the output or product consistently meets the
predetermined specifications for quality
Monitor the validated process during routine operation. As needed, re-qualify and
rectify the equipment.
Once the process has been completely defined, equipment usually will be required
to perform the actual processing of the product. It is collectively called “the
system”. The system and its operations can then be identified and defined.8
BENEFITS:
� Reduces the risk of regulatory non- compliance.
� Reduction in rejections & reworks.
� Reduces the chances of product recall from the market
7
� Reduction of quality costs namely
� Preventive costs
� Appraisal costs
� Internal failure costs
� External failure costs
� May require less in-process control and end product testing; parametric release of
batch can be done.
� More rapid & accurate investigations into process deviations.
� Assures smooth running of process.
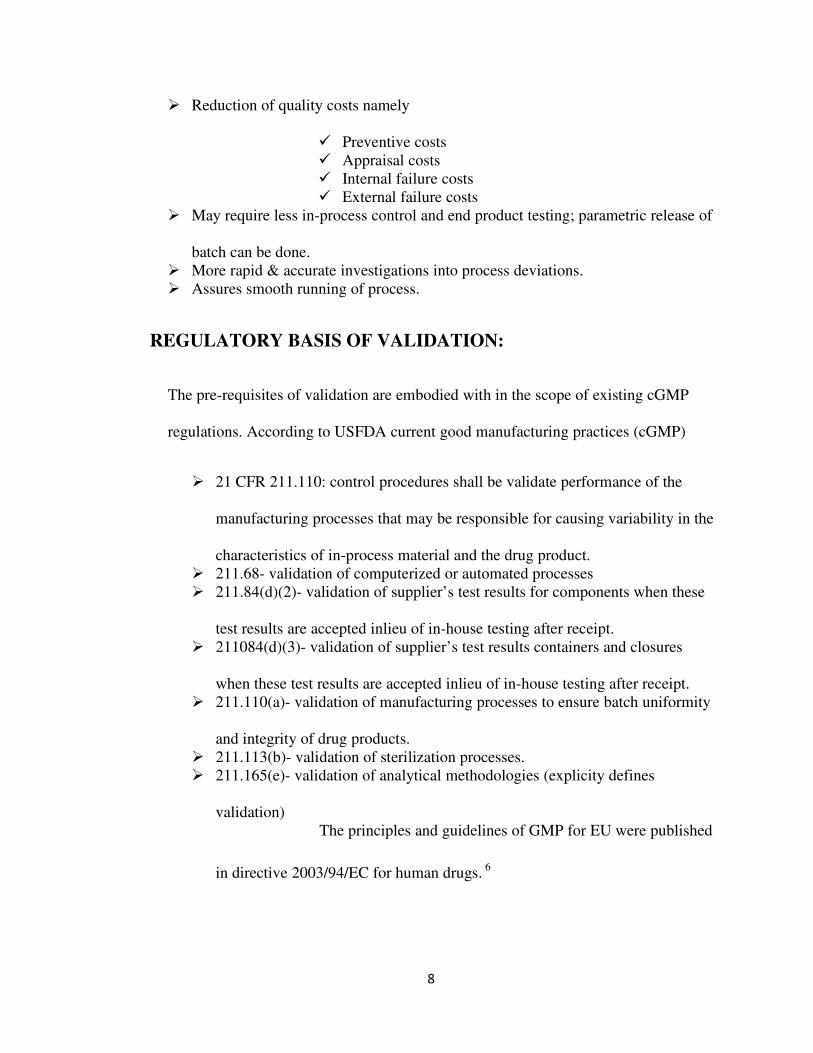
REGULATORY BASIS OF VALIDATION:
The pre-requisites of validation are embodied with in the scope of existing cGMP
regulations. According to USFDA current good manufacturing practices (cGMP)
� 21 CFR 211.110: control procedures shall be validate performance of the
manufacturing processes that may be responsible for causing variability in the
characteristics of in-process material and the drug product.
� 211.68- validation of computerized or automated processes
� 211.84(d)(2)- validation of supplier’s test results for components when these
test results are accepted inlieu of in-house testing after receipt.
� 211084(d)(3)- validation of supplier’s test results containers and closures
when these test results are accepted inlieu of in-house testing after receipt.
� 211.110(a)- validation of manufacturing processes to ensure batch uniformity
and integrity of drug products.
� 211.113(b)- validation of sterilization processes.
� 211.165(e)- validation of analytical methodologies (explicity defines
validation)
The principles and guidelines of GMP for EU were published
in directive 2003/94/EC for human drugs. 6
8

PROCESS VALIDATION:It has been said that there is no specific basis for requiring a separate set of process
validation guidelines, since the essentials of process validation are embodied with in the
purpose and scope of the present cGMP regulations. The specific term process
validation should be reserved for the final stages of the product/ process development
sequence. 7 The schematic picture of process validation for a new/existing process/
product is shown in figure 3.
Validation master plan: Validation master plan may be defined as internally approved document that describes in
clear, unambiguous and concise wording, the general expectations, inventions, methods
and approaches to be used during the entire validation effort.3,11
The ECE guide recommends the following contents in VMP
� Validation policy� Organizational structure of validation activities� Summary of facilities, systems, equipment and processes to be validated� Documentation format (format to be used for protocols & reports)� Planning & scheduling� Change control� Reference to existing documents. 4
Validation protocol:
After preparing VMP, the next step is to prepare validation protocol. There are atleast the
following contents in a validation protocol.
9

� Purpose and scope of validation� Responsibilities & functioning of persons/organizational units involved in
validation� Type of validation to be conducted� Number of process validation runs� Quality of materials used in the process� Description of process� All major equipments to be used, their type/design and their installation &
operational qualification� Critical process parameters & operating ranges� Sampling plans� Specifications & test data to be collected� Acceptance criteria to include that validation has been successful� Measures to be taken in the event of process validation failure.4
Validation protocols define the extent of verification, testing &
challenging activities along with their appropriate acceptance criteria, testing methods
& data recording methods. The validation program and its protocols are generally
divided into the following 4 phases.
� Design qualification (DQ) protocol:
This document generally provide the means to verify that the proper process
functional requirements have been incorporated into the basis for design for all
engineered systems and are included as part of performance criteria for system
hardware and software.
� Installation qualification (IQ) protocol:
This document provides basis for verifying the proper installation of the
designed system, in accordance with the design & engineering specifications.
� Operational qualification (OQ) protocol:
This document provides basis for testing the components of a installed system
to demonstrate conformance with the approved operational criteria.
� Performance qualification (PQ) protocol:
10
This document provides basis for challenging the proper performance of the
whole-total system while operating as an integral part of the process.
Validation report:
A written report should be available after completion of the validation. If found
acceptable, it should be approved and authorized. The report should include the
following
• Title and objective of the study
• References to protocols
• Details of materials
• Equipment
• Programme and cycles used
• Details of procedures and tested methods
• Results (compared with acceptance criteria), and
• Recommendation on the limit and criteria to be applied on future basis.
RESPONSIBILITIES OF EACH ORGANIZATIONAL STRUCTURE:
Department Responsibility
Engineering Installation qualification & certification of plant,
facilities, equipment & support system.
Development Design, optimization & qualification of
manufacturing process with in design limits,
specifications and/or requirement
Manufacturing Operation & maintenance of plant, facilities,
11

equipment, support system & specific
manufacturing process with in design limits,
specifications and/or requirements.
Quality Assurance Establishment of approvable validation protocols
& conducting process validation by monitoring,
sampling, testing, challenging and/or auditing
specific manufacturing process for compliance with
design limits, specifications and/or requirements. 6
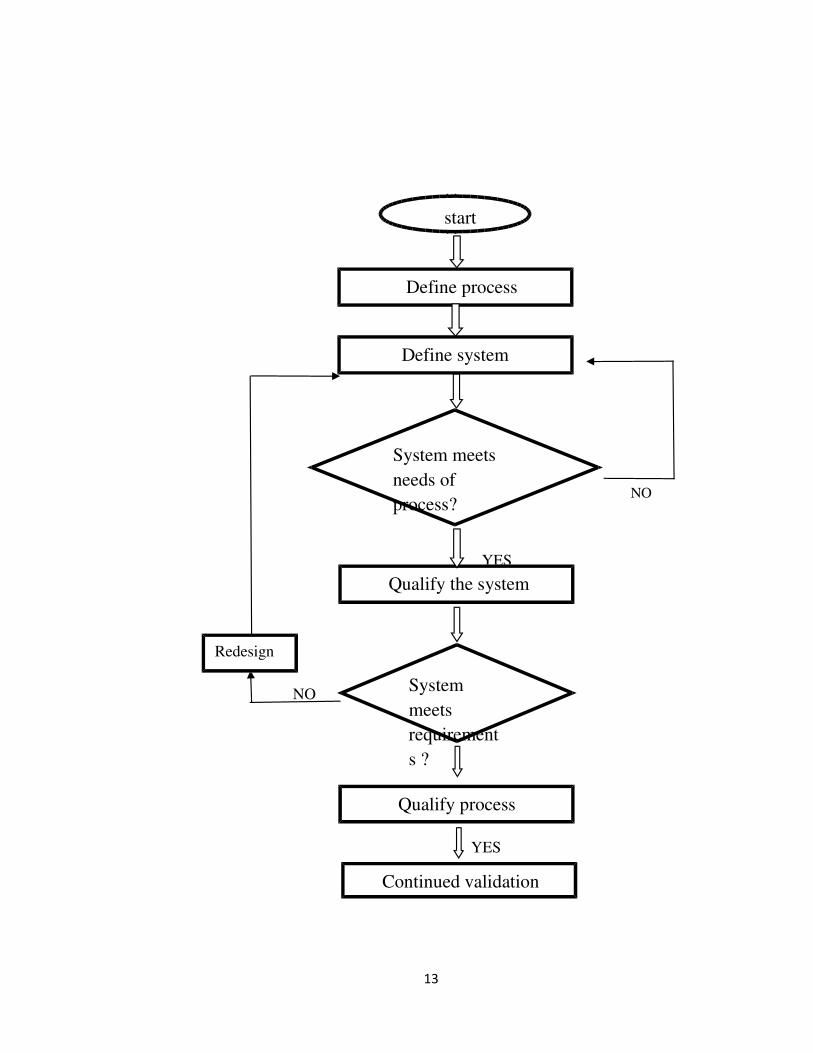
VALIDATION LIFE CYCLE:
process validation life cycle starts at the process design phase (process/product
development) and continues through process verification (monitoring & assessment of
process effectiveness) as stated by FDA’s new guideline on process validation activities
are carried out. Validation life cycle is shown in figure 2. 6,9
12
NO
YES
NO
YES
13
System meets
needs of
process?
Qualify the system
Define system
Define process
System
meets
requirement
s ?
Qualify process
Continued validation
Redesign
start
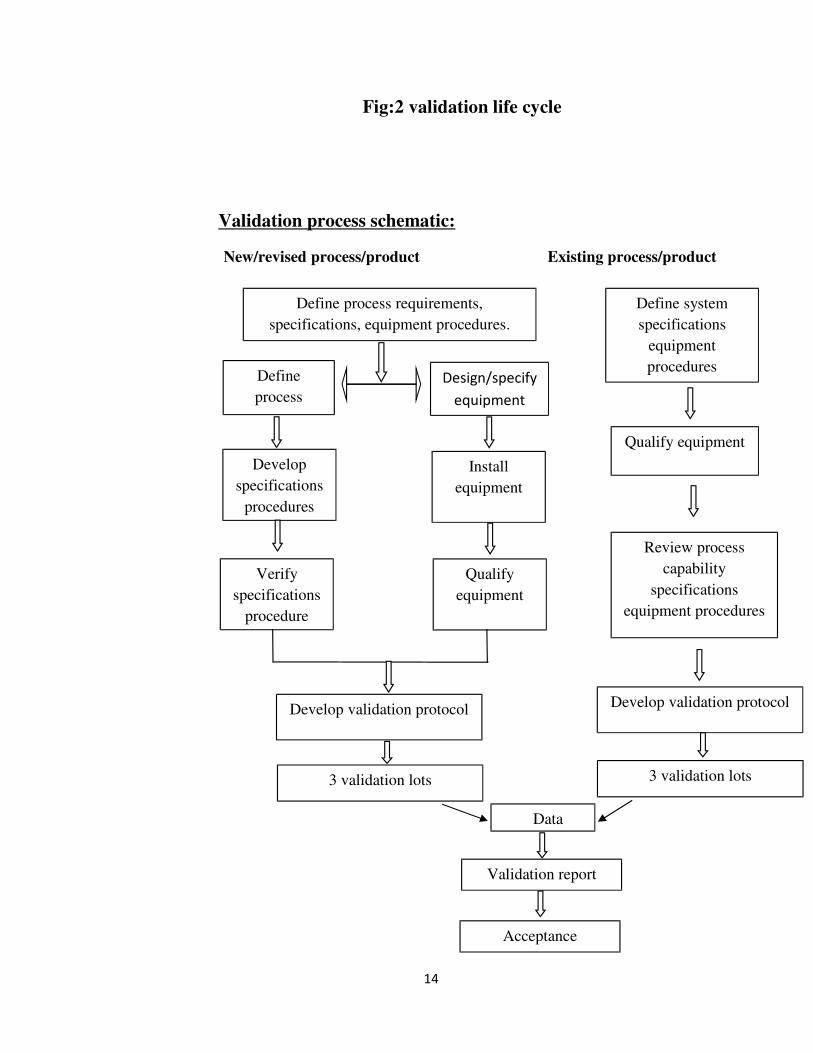
Fig:2 validation life cycle
Validation process schematic:
New/revised process/product Existing process/product
14
Define process requirements,
specifications, equipment procedures.
Define
process
Design/specify
equipment
Develop
specifications
procedures
Install
equipment
Verify
specifications
procedure
Qualify
equipment
Develop validation protocol
3 validation lots
Define system
specifications
equipment
procedures
Data
3 validation lots
Develop validation protocol
Review process
capability
specifications
equipment procedures
Qualify equipment
Validation report
Acceptance

Fig:3 validation process of new and existing product/process10
WHAT SHOULD BE VALIDATED?
Any aspect of operation, including significant changes to premises. Facilities, equipment
or processes, which may affect the quality of the product directly or indirectly should be
qualified and validated.
Laboratory scale batches:
These are produced at the research & early development laboratory stage; they may be of
very small size. These batches may find many uses, for example to support formulation &
packaging development, clinical and/or pre-clinical studies.
Data derived from these batches assist in the evaluation & definition of critical product
performance characteristics and there by enables the choice of appropriate manufacturing
process.
Pilot batches:
These may be used in the process development or optimization stage, may be used to
support formal stability studies and also to support pre-clinical & clinical evaluation.
Pilot batch size should correspond to atleast 10% of the production scale batch i.e such
that the multiplication factor for scale-up does not exceed 10.
15
Ongoing process
evaluation

For oral solid dosage forms this size should generally be 10% of the production scale or
1,00,000 units which ever is greater. The role of pilot scale batches is to provide data
predictive of the production scale product. It may be necessary to further develop &
optimize the manufacturing process using pilot scale batches. The pilot batch therefore
provides the link between process development and industrial production of product. The
purpose of the pilot batch is to challenge the method proposed for routine production i.e
to analyze and evaluate the difficulties and critical points of manufacturing process, the
apparatus and method most appropriate to large scale production.
Production scale batches:
These batches are of the size which will be produced during the routine marketing of the
product. Data on production scale batches may not always be available prior to granting
marketing authorization. Where production scale data are not available or presented at the
time of submission, the two stage approach outlined below should be followed.
First a thorough evaluation & characterization of the critical process parameters at
laboratory or pilot scale, followed by a formal validation programme on production scale
batches for which the scheme has been described to the regulatory authorities in the
dossier and for which the results can be subsequently verified by supervising authority
according to national procedure.
PROCESS VALIDATION PHASES:
Phase 1 (process capability design):
16
FDA in its process validation guidelines states that a manufacturer should evaluate all
factors that affect product quality when designing and undertaking a process validation
study.
Process capability is the carrying out of studies to determine 6
• The number & relative importance of critical process parameters that influence
process output
• The numerical values or ranges for each of the critical process parameters that
result in acceptable process output.
If the process capability is properly defined, the process should result into output of
consistent attributes when operated with in the defined limits of critical process
parameters.
Phase 2 (process validation phase or process qualification phase):
It is designed to verify that all established limits of the critical process parameters are
valid and that satisfactory products can be produced even under worst case conditions. It
represents the actual studies or trials conducted to show
• That all systems, sub-systems or unit operations of a manufacturing process
perform as intended
• That all critical parameters operate with in their assigned control limits
• That such studies & trials which form the basis of process capability design &
testing, are verifiable and certifiable through proper documentation.
Phase 3 (validation maintenance phase):
17

It requires frequent review of all process related documents, including validation audit
reports to assure that there have been no changes, deviations, failures, modifications to
the production process and that all SOPs have been followed including change control
procedures. At this stage the validation team also assures that there have been no
changes/deviations that should have resulted in re-qualification & re-validation.
TYPES OF PROCESS VALIDATION:
Depending on when it is performed in relation to production, validation can be
prospective, con-current, retrospective and revalidation. 6
� Prospective validation:Prospective validation is usually undertaken whenever a new formula, process
and/or facility need to be validated before routine pharmaceutical production starts.
It is also usually employed when sufficient historical data is either unavailable or
insufficient and in-process and final product testing is inadequate to ensure high
degree of confidence for quality characteristics and reproducibility. Regulatory
authorities favours prospective validation for obvious reason of higher degree of
confidence and minimal risk, as it ensures process to be under control and effective
prior to manufacture or release of product. Nevertheless, higher degree of confidence
is also associated with higher cost of operation. Therefore, a due consideration must
be given to regulatory authority’s preference and cost to benefit analysis (when
alternate type of validation is possible).
� Concurrent validation:Concurrent validation is appropriate when
18
� It is not possible to complete a validation programme before routine
manufacturing starts and it is known in advance that finished products will be for
sale.
� It is more appropriate to validate process during routine production due to well
understanding of process.
� Extensive testing and monitoring ensures the desired quality characteristics of
product with high degree of confidence.
Extensive testing and monitoring during concurrent validation may verify quality
attributes of the product of particular batch, but does not provide high degree of
assurance that subsequent batches processes under some condition and parameter
will attain same quality attributes.
� Retrospective validation:
There are many processes in use in many companies that have not undergone a
formally documented validation process. Validation of these processes is possible
provided sufficient historical data is available to provide documentary evidence that
various processes are considerably stable and are doing what they are believed to do.
A large historical data set available may provide higher confidence and better
picture than data generated from few trail runs in prospective validation. This type of
validation is acceptable only for well established processes and where quality
attributes and critical process parameters have been identified and documented.
Appropriate in-process specifications and controls have been established and
documented. And there have not been excessive process / product failures
attributable to causes other than operator error or equipment failure unrelated to
equipment suitability.
19
The number of batches to review will depend on the process but in general
data from 5 to 10 consecutive batches should be examined to assess process
consistency. The review should include any batches that failed to meet
specifications. However any discrepancies or failure in the historical data may be
excluded provided there is sufficient evidence that the failure was caused by isolated
occurrences.
The source of this validation may include batch documents, control charts,
maintenance log books, records of personnel changes, process capability studies,
finished product data including trend cards and storage stability studies.
� Revalidation:Re-validation is needed to ensure that the changes in the process and/or in the
process environment, whether intentional or unintentional, do not adversely affect
process characteristics and product quality.
Re-validation may be divided in to two broad categories:
� Re-validation after any change having a bearing on product quality.
� Periodic re-validation carried out at scheduled intervals.
Revalidation after changes:
Revalidation must be performed on introduction of any changes affecting a
manufacturing and/or standard procedure having a bearing on the established
product performance characteristics. Such changes may include those in starting
materials, packaging materials, manufacturing process, equipment, in-process
controls, manufacturing area or support systems (water, steam etc). Every such
change requested should be reviewed by a qualified validation group which will
decide whether it is significant enough to justify revalidation and if so, its extent.
Re-validation after changes may be based on the performance of the same
tests and activities as those used during the original validation including tests on sub
20

processes and on the equipment concerned. Some typical changes which require
revalidation include the following
∗ Changes in the starting materials:
Changes in the physical properties such as density, viscosity, particle size
distribution, crystal type and modification of the active ingredients or excipients
may effect the mechanical properties of the material, as a concequence they may
adversely affect the process or the product.
∗ Changes in the packaging material:
Example replacing plastics by glass may require changes in the packaging procedure
and therefore effect the product stability.
∗ Changes in the process:
Changes in the mixing time, drying temperature and cooling regime may effect
subsequent process steps and product quality.
∗ Changes in equipment:
Measuring instrument may effect both the process and the product. Repair and
maintenance work such as replacement of major equipment components may effect
the process.
∗ Changes in the production area and support system:
The rearrangement of manufacturing area and/or support systems may result in
changes in the process. The repair and maintenance of support systems such as
ventilation may change the environmental conditions and as a consequence
revalidation/requalification may be necessary mainly in the manufacture of sterile
products.
Periodic revalidation:
It is well known that process changes may occur gradually even if experienced
operators work correctly according to established methods. Similarly equipment wear
may also cause gradual changes. Consequently revalidation at scheduled times is
advisable even if no changes have been deliberately made.
21

The decision to introduce periodic revalidation should be based on a review of
historical data i.e data generated during in-process and finished product testing after
the latest validation, aimed at verifying that the process is under control.
2. LITERATURE REVIEW
Chawla Nirmaljot singh et-al 13 ; has overviewed role of process validation of
tablet manufacturing process. It often includes qualification of systems &
equipment. For each type of pharmaceutical dosage form there are various stages
in manufacturing process that need to be qualified inoder to validate the complete
process.
Rajkumar P.Patil 14; has explored the understanding of blend uniformity in the
manufacture of solid oral dosage forms under c GMP. He concluded that testing
final blend uniformity as a suitable in-process control may evaluate and highlight
22
the incoming ingredient batch to batch differences as well as the physical
variations in different lots of active materials.
Wayne A.Taylor 15 ; described the application of many statistical tools like
control charts, capability studies, designed experiments, tolerance analysis, robust
design methods, failure mode and effect analysis, sampling plans, mistake
proofing in validation.
Satyabrata Jena et-al 16; have done overview on the process validation of solid
dosage forms, protocol preparation and regulatory basis for process validation
with special emphasis on tablets in industry. It gives in detail the validation of
each step of the manufacturing process through wet granulation. They concluded
that Solid dosage form validation should be part of a comprehensive validation
program within an industry. The total program should begin with validation of the
active pharmaceutical ingredient (API) characteristics so that this material will be
uniform batch after batch, providing a solid footing upon which the dosage form
will be built. Continued awareness of validation requirements and a diligent
application of validation principles will thus help to ensure that pharmaceutical
products will be able to be developed and produced with the quality and
reproducibility required from regulatory agencies across the world.
Garg R et-al 17; has described guidance for validation of solid dosage forms,
sterile products, oral solutions and suspensions. They gave an overview on
aspects of validation in terms of pharmaceutical unit operations, i.e that individual
technical operation that comprises various steps involved in product design and
evaluation.
Beer TR et-al 18; studied a strategy to implement a Process Analytical
Technology (PAT) system in the blending step of tablet production system.
23
Raman spectroscopy was used as a PAT tool for end point control of powder
blending process. It was observed that the ratio between the blending times and
the measurement intervals should be sufficiently high to be able to study the
critical effects properly.
Chitlange S et-al 19; provided information on validation of granulation process
which involved validation of equipments utilized in manufacturing of granulation
and validation of operation carried out for granulation. It also validate final
product for bulk density, moisture content, particle size distribution etc.
successfully validating a process may reduce the dependence upon intensive
inprocess and finished product testing.
Elsie Jatto et.al 20; have done overview of pharmaceutical validation and process
controls in drug development. It has been known that facilities and processes
involved in pharmaceutical production impact significantly on the quality of the
products. The processes include raw material and equipment inspections as well
as in-process controls. Process controls are mandatory in GMP. The purpose is to
monitor the on-line and off-line performance of the manufacturing process and
hence, validate it. Thus validation is an integral part of quality assurance. This
overview examines the need for pharmaceutical validation, the various
approaches and steps involved and other pertinent considerations.
Andrew W. Jones 21 discussed how to validate a process by introducing some
basic statistical concepts to use when analyzing historical data from Batch
Records and Quality Control Release documents to establish specifications and
quality attributes for an existing process.
Dusel-RG et-al 22; performed food and drug administration requirements
regarding manufacturing process validation were discussed including examples of
24
different types of documentation to fulfill the requirements of minimal or
extensive records.
O’-shea-et-al 23; have done an overview of validation in the pharmaceutical
industry including legal, ethical, developmental & economic considerations and
also included validation process for granulating, blending and tableting a product.
Edwards-CM et al 24; have done process validation of the manufacturing of solid
dosage forms was discussed including protocols, records to be maintained,
suitability of raw materials, equipment performance qualification, the number of
validation runs required and acceptance criteria.
3. AIM & OBJECTIVE OF STUDY
� The present study is carried out at Orchid Healthcare, Irrungattukottai. The
company is involved in the manufacturing and distribution of wide range of
pharmaceutical products.
� The aim of the present work is to define the validation process for an Anti
convulsant tablet 750mg and to manufacture 3 validation batches of 3,00,000
tablets as per the approved batch manufacturing record.
� To evaluate and qualify the consistency of Anti convulsant tablet 750mg
� The objective in process validation was to validate critical processes like
granulation, drying, blending, compression & coating and to establish
documented evidence that product when manufactured at production scale
operation meets all the quality and design specifications.
25
4. PLAN OF WORK
Process validation is carried for the following product.
Anti convulsant tablet 750mg
Three consecutive batches should be manufactured for the validation of anti convulsant
tablet 750mg.
The following plan of work is designed based on Master Manufacturing formula
1. Literature review
2. Preparing process flow chart
3. Preparing the validation protocol which include
• Review of qualification status of equipment & facility
• Identification of CCPs & CQAs
• Preparation of sampling plan
• Acceptance criteria
4. Execution of validation
5. Compilation & evaluation of the results.
5. DRUG PROFILE
The present drug of study is an anti convulsant tablet
26

Description:
This anti convulsant drug is a white to off-white crystalline powder with a faint odor and
a bitter taste.
Solubility:
� It is very soluble in water (104.0 g/100 mL).
� It is freely soluble in chloroform (65.3 g/100 mL) & in methanol (53.6 g/100 mL)
� soluble in ethanol (16.5 g/100 mL)
� sparingly soluble in acetonitrile (5.7 g/100 mL).
� practically insoluble in n-hexane.
(Solubility limits are expressed as g/100 mL solvent.)
Indications and usage:
� indicated as adjunctive therapy in the treatment of partial onset seizures in
adults and children 1 month of age and older with epilepsy.
� indicated as adjunctive therapy in the treatment of myoclonic seizures in
adults and adolescents 12 years of age and older with juvenile myoclonic
epilepsy.
� indicated as adjunctive therapy in the treatment of primary generalized tonic-
clonic seizures in adults and children 6 years of age and older with idiopathic
generalized epilepsy.
Available strengths:
The present drug of study is available in 250mg, 500mg, 750mg & 1000mg strengths.
Mechanism of action:
27

Mechanism unknown; may selectively prevent hypersynchronization of epileptiform
burst firing and propagation of seizure activity ; thought to stimulate synaptic vesicle
protein 2A (SV2A), inhibiting neurotransmitter release.
Pharmacokinetics
Absorption
T max is 1 h. Oral bioavailability is 100%. Food does not affect the extent of absorption,
but it can decrease C max 20% and delay T max 1.5 h. Steady state is achieved after 2 days
of multiple, twice-daily dosing.
Distribution
Less than 10% is protein bound. Vd is close to the volume of intracellular and
extracellular water.
Metabolism
Not extensively metabolized. Major metabolic pathway is the enzymatic hydrolysis of the
acetamide group, which produces the carboxylic acid metabolite ucb L057.
Elimination
Plasma half-life is approximately 7 h. It is eliminated from the systemic circulation by
renal excretion as unchanged drug, which represents 66% of dose.
Drug interactions:
Carbamazepine
Increased risk of carbamazepine toxicity, unrelated to elevated plasma concentrations,
has been reported.
28
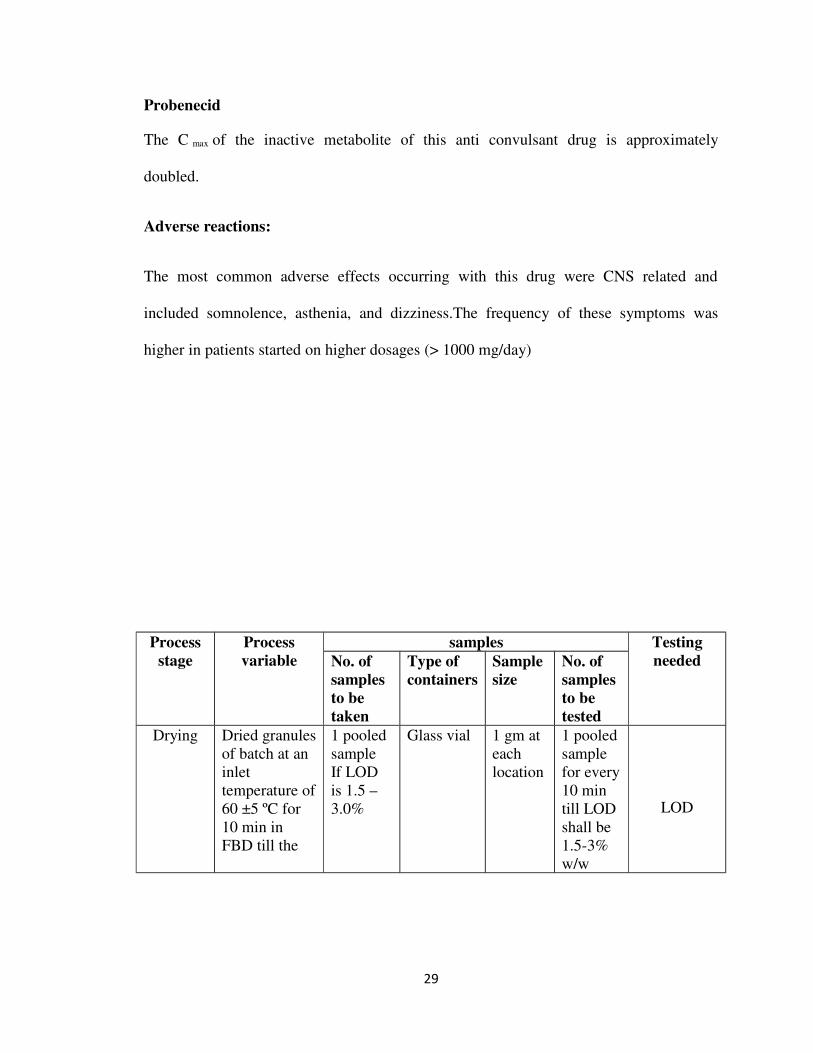
Probenecid
The C max of the inactive metabolite of this anti convulsant drug is approximately
doubled.
Adverse reactions:
The most common adverse effects occurring with this drug were CNS related and
included somnolence, asthenia, and dizziness.The frequency of these symptoms was
higher in patients started on higher dosages (> 1000 mg/day)
Process
stage
Process
variable
samples Testing
neededNo. of
samples
to be
taken
Type of
containers
Sample
size
No. of
samples
to be
tested
Drying Dried granules
of batch at an
inlet
temperature of
60 ±5 ºC for
10 min in
FBD till the
1 pooled
sample
If LOD
is 1.5 –
3.0%
Glass vial 1 gm at
each
location
1 pooled
sample
for every
10 min
till LOD
shall be
1.5-3%
w/w
LOD
29
LOD shall be
1.5 – 3%
5
samples
If LOD
is 1.5 –
3.0%
1 gm at
each
location
5
samples
after
attaining
LOD
shall be
1.5-3%
w/w
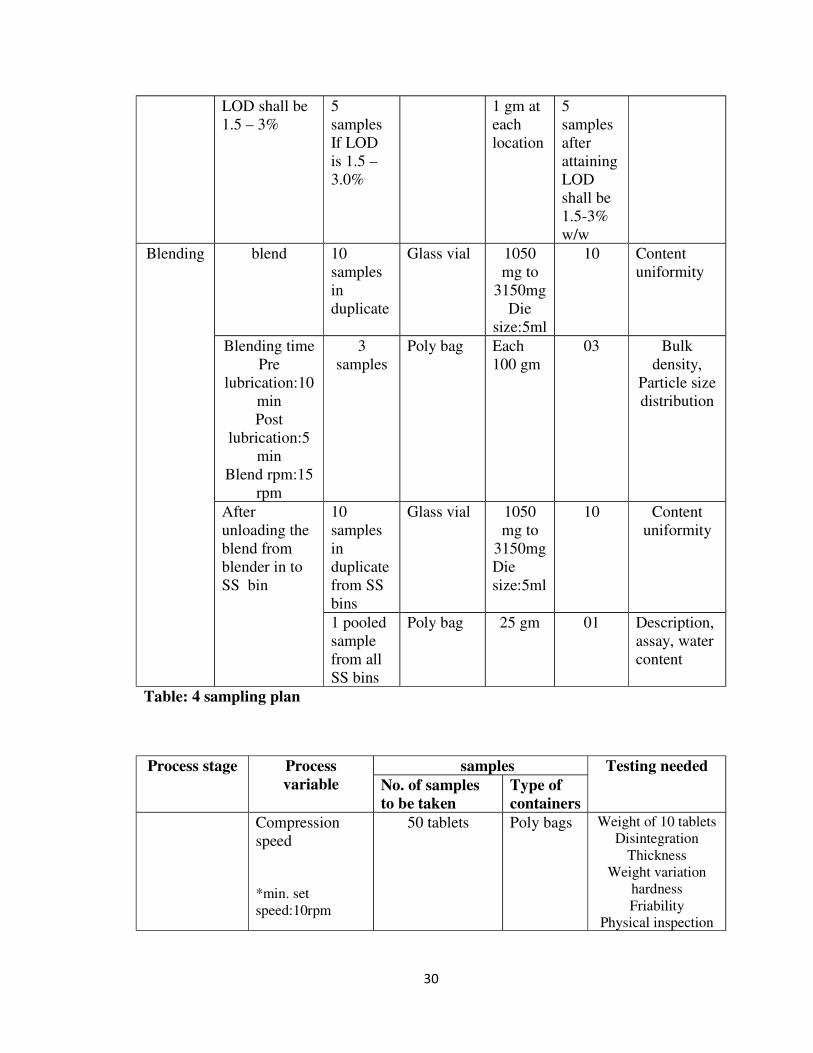
Blending blend 10
samples
in
duplicate
Glass vial 1050
mg to
3150mg
Die
size:5ml
10 Content
uniformity
Blending time
Pre
lubrication:10
min
Post
lubrication:5
min
Blend rpm:15
rpm
3
samples
Poly bag Each
100 gm
03 Bulk
density,
Particle size
distribution
After
unloading the
blend from
blender in to
SS bin
10
samples
in
duplicate
from SS
bins
Glass vial 1050
mg to
3150mg
Die
size:5ml
10 Content
uniformity
1 pooled
sample
from all
SS bins
Poly bag 25 gm 01 Description,
assay, water
content
Table: 4 sampling plan
Process stage Process
variable
samples Testing needed
No. of samples
to be taken
Type of
containers
Compression
speed
*min. set
speed:10rpm
50 tablets Poly bags Weight of 10 tablets
Disintegration
Thickness
Weight variation
hardness
Friability
Physical inspection
30

Compression
Compress about
30,000 tabletsPooled sample of
50 tablets from
the containers
Poly bags Dissolution
UOD
*Max. set
speed:18rpm
Compress about
30,000 tablets
50 tablets Poly bags Weight of 10 tablets
Disintegration
Thickness
Weight variation
hardness
Friability
Physical inspection
Pooled sample of
50 tablets from
the containers
Poly bags Dissolution
UOD
*Optimum
speed:15rpm
Pooled sample of
50 tablets shall
be collected from
corresponding
IPC during 1/3rd
to 2/3rd level of
hopper
Poly bags Weight of 10 tablets
Disintegration
Thickness
Weight variation
hardness
Friability
Physical
inspection
Pooled sample of
50 tablets from
the containers
Poly bags Dissolution
UOD
Table: 4 sampling plan ( contd…)
31

Process stage Process
variable
samples Testing needed
No. of samples
to be taken
Type of
containers
compression
*Optimum
speed:15rpm
Pooled sample
of 50 tablets
shall be
collected from
corresponding
IPC during
2/3rd to end
level of hopper
Poly bags Weight of 10 tablets
Disintegration
Thickness
Weight variation
hardness
Friability
Physical
inspection
Pooled sample
of 50 tablets
from the
containers
Poly bags Dissolution
UOD
coating
Description Pooled sample Poly bags Physical appearance
Weight build up 50 tablets Poly bags Weight build up
Spary gun angle NA NA NA
Pooled sample
of 50 tablets
from all the
containers
Poly bags Dissolution profile
on 12 tablets
Pooled sample
of 250 tablets
from all the
containers
Poly bags Description
Identification by
HPLC, IR, chiral
HPLC
Water content
Avg weight
Uniformity of
dosage units by wt.
variation
Dissolution
Assay
Related substances
*samples shall be taken from both the sides & tested atleast for two time intervals
Process stage Process
variable
samples Testing needed
No. of
samples to
be taken
Type of
containers
Tablet
counting/filling
Minimum speed
Maximum speed
Target set speed
10 HDPE
containers
120s count
Verification of fill
bottle count
32
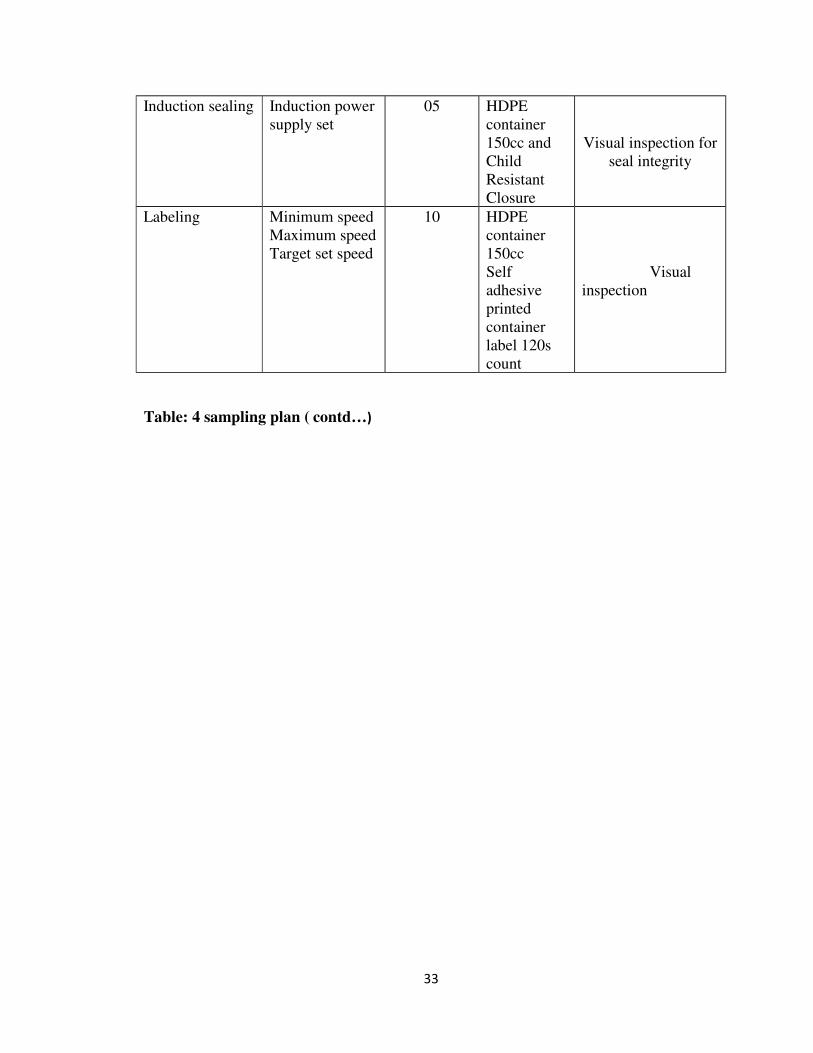
Induction sealing Induction power
supply set
05 HDPE
container
150cc and
Child
Resistant
Closure
Visual inspection for
seal integrity
Labeling Minimum speed
Maximum speed
Target set speed
10 HDPE
container
150cc
Self
adhesive
printed
container
label 120s
count
Visual
inspection
Table: 4 sampling plan ( contd…)
33

6.2.5 SAMPLING PROCEDURE AT DIFFERENT STAGES:
� Drying:
Moisture content of the dried granules has to be established during the validation
of drying process. One pooled sample was taken for every 10min till the LOD shall
be 1.5% -3.0%. 5 samples were taken from 5 different locations in FBD after
attaining the desired LOD to determine the moisture content.
Fig: 6 Side View of Fluid Bed Dryer (FBD)
34
2
5
4
1 3
2
5
4
31

Fig: 7 Top View of Fluid Bed Dryer (FBD)
Location 1 : Left side of the FBD
Location 2 : Rear side of the FBD
Location 3 : Right side of the FBD
Location 4 : Front side of the FBD
Location 5 : Center of the FBD
� Blending:
Content uniformity of the blend has to be established during the validation of
blending process. 10 samples in duplicate were taken from different locations in
the octagonal blender and tested for the content uniformity. Sample size (1050mg-
3150mg) is average weight of each tablet to thrice of the average tablet weight. 3
samples were collected from right, middle & left sides of the octagonal blender for
determination of bulk density and particle size distribution.
Sampling in SS bins: After loading the blend in to SS bins from the blender 10 samples
in duplicate were taken to determine the content uniformity and 1 pooled sample from all
the bins was taken for description, assay and water content.
10 samples in duplicate (20 samples) for Content uniformity
35
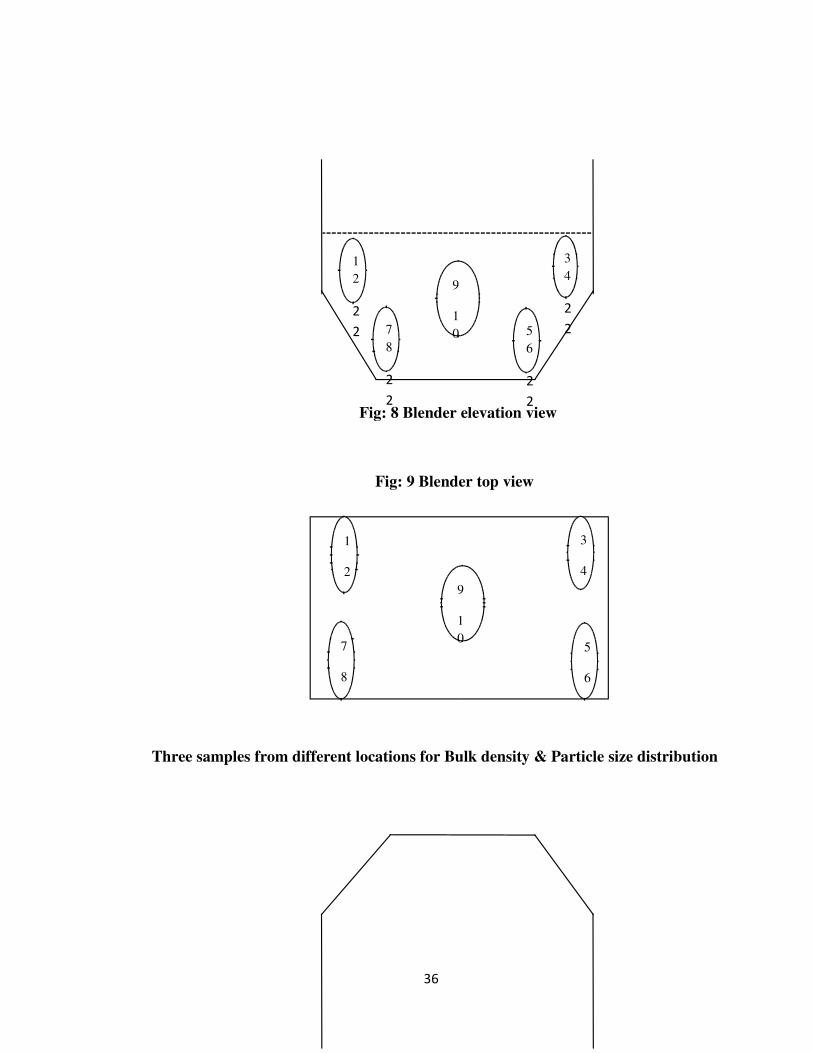
Fig: 8 Blender elevation view
Fig: 9 Blender top view
Three samples from different locations for Bulk density & Particle size distribution
36
1
2
2
2
3
4
2
27
8
2
2
5
6
2
2
9
1
0
9
1
0
1
2
3
4
7
8
5
6

Fig: 10 Blender elevation view
Fig: 11Blender top view
Location 1 : Left side of the Octagonal blender
Location 2 : Middle of the Octagonal blender
Location 3 : Right side of the Octagonal blender
Sampling plan - SS Bin
10 samples in duplicate (20 samples) for Content uniformity
37
1 3
2
2
2
1 32
1 4 8
2 5 9
3 6 1
0
7

Fig: 12 Bin elevation view
One pooled sample for Description, Assay & Water content
Fig: 13 Bin plain view
Compression:
Compression of 30,000 tablets each were carried out at minimum (10 rpm) and
maximum (18 rpm) speeds.50 tablets at each speed were sampled from both the
sides and tested for physical inspection, weight of 10 tablets, weight variation,
thickness, hardness, friability & disintegration. Dissolution & UOD was carried
out for pooled sample of 50 tablets from different containers. Machine speed was
optimized at 15 rpm and pooled sample of each 50 tablets were collected from the
38
1 32

corresponding in-process container during 1/3rd to 2/3rd level of hopper & 2/3rd to
end level of the hopper; tested for physical inspection, weight of 10 tablets, weight
variation, thickness, hardness, friability & disintegration. Dissolution & UOD was
also carried out for pooled sample of 50 tablets from the containers.
Coating:
Coating was carried out for three lots of compressed tablets to achieve the weight
build up of 2.0%–3.0%. 50 coated tablets were sampled and tested for physical
description, weight build up. Pooled sample of 50 coated tablets were collected
from different containers and dissolution profile on 12 tablets was carried out.
Similarly pooled sample of 250 tablets were collected and finished product
analysis (description, identification, water%, average weight, uniformity of dosage
units by weight variation, dissolution, assay, related substances) was carried out.
Packing:
Tablet counting & filling:
120 tablets were counted and filled in HDPE containers 150 cc at three different
speeds; minimum (20 containers/min), maximum (40 containers/min), optimum (30
containers/min) speed. 10 containers were collected at each speed for verification of
fill bottle count.
Induction sealing:
Induction sealing of HDPE 150 cc containers with CR closures were carried out with
induction power supply was set at 70%. 5 bottles were sampled and checked for seal
integrity
� Labeling:
Labeling of HDPE containers 150cc containing 120 tablets were carried out at
minimum (20 containers/min), maximum (40 containers/min), optimum (30
containers/min) speeds. 10 bottles were collected at each speed for physical
inspection.
6.2.6 JUSTIFICATION FOR SAMPLING POINTS:
39

Fluid bed dryer:
During the drying process hot air will be blown from the bottom and there may not be
uniform flow of air due to which improper drying may occur. Hence samples will be
taken at 5 different locations to check the moisture content
Octagonal blender:
Sampling points 1,2,3,4,5,6,7,8 are considered as dead spots in the octagonal blender as
the baffle will not be in the contact with the blend at those points hence samples were
taken to check the content uniformity. Sampling points 9, 10 are in direct contact with the
baffle hence samples were taken to check the content uniformity as over mixing may lead
to segregation of the particles.
Three samples were taken at middle, right and left sides of the blender to check the
bulk density & particle size distribution as there may be segregation of particles during
mixing.
SS BIN:
After blending, blend was transferred from octagonal blender in to SS bins. During the
transfer more denser particles may settle at the bottom of the bin and also particles may
segregate. Hence samples were taken at various locations from the SS bins to check the
content uniformity
Pooled samples were taken to represent all the layers of the blend and tested for
description, assay and water content.
Duplicate samples were taken to rule out the analytical variations.
40
Sample size is twice the quantity required for testing.
7. RESULTS
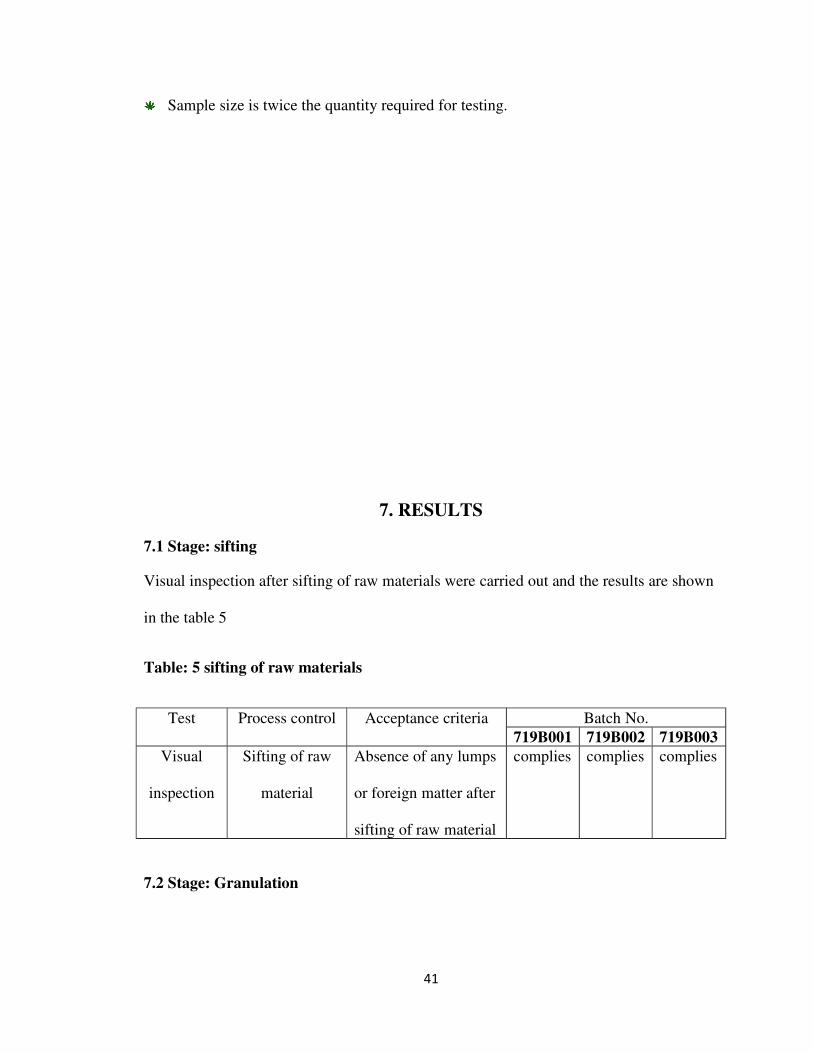
7.1 Stage: sifting
Visual inspection after sifting of raw materials were carried out and the results are shown
in the table 5
Table: 5 sifting of raw materials
Test Process control Acceptance criteria Batch No.
719B001 719B002 719B003
Visual
inspection
Sifting of raw
material
Absence of any lumps
or foreign matter after
sifting of raw material
complies complies complies
7.2 Stage: Granulation
41
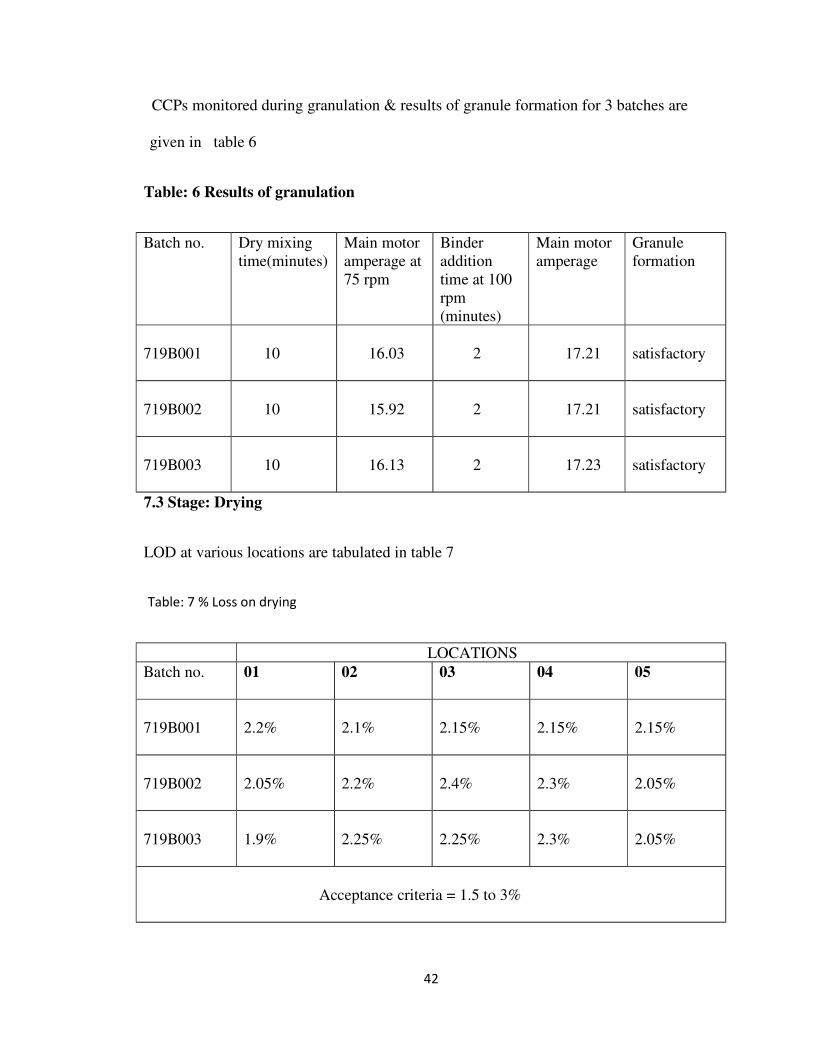
CCPs monitored during granulation & results of granule formation for 3 batches are
given in table 6
Table: 6 Results of granulation
Batch no. Dry mixing
time(minutes)
Main motor
amperage at
75 rpm
Binder
addition
time at 100
rpm
(minutes)
Main motor
amperage
Granule
formation
719B001 10 16.03 2 17.21 satisfactory
719B002 10 15.92 2 17.21 satisfactory
719B003 10 16.13 2 17.23 satisfactory
7.3 Stage: Drying
LOD at various locations are tabulated in table 7
Table: 7 % Loss on drying
LOCATIONS
Batch no. 01 02 03 04 05
719B001 2.2% 2.1% 2.15% 2.15% 2.15%
719B002 2.05% 2.2% 2.4% 2.3% 2.05%
719B003 1.9% 2.25% 2.25% 2.3% 2.05%
Acceptance criteria = 1.5 to 3%
42

% LOD from 3 batches is shown graphically in fig 14
Figure: 14 % Loss on drying in different batches
7.4 Stage: BLENDING
7.4.1Sampling location: Octagonal blender
Results of content uniformity at various locations in the blender are given table 8 and
it is represented graphically in fig 15
Table: 8 % Content uniformity from octagonal blender
Locations Batch no. Acceptance
criteria719B001 719B002 719B003
1. 100.2 99.2 100.6
2. 101.5 99.2 101.7
3. 100.0 98.7 101.9
4. 100.6 99.2 100.9
5. 99.9 99.2 102.2
6. 100.6 99.2 100.5
43

NLT 90.0 % to
NMT 110.0 % of
the labeled
amount.
7. 100.2 99.2 101.5
8. 99.9 98.8 100.9
9. 102.7 98.3 100.9
10. 100.2 98.1 100.1
99.9 98.1 100.1
Max. 102.7 99.2 102.2
Average 100.58 98.91 101.12
RSD 0.9 0.3 0.6 RSD: NMT 5%
44
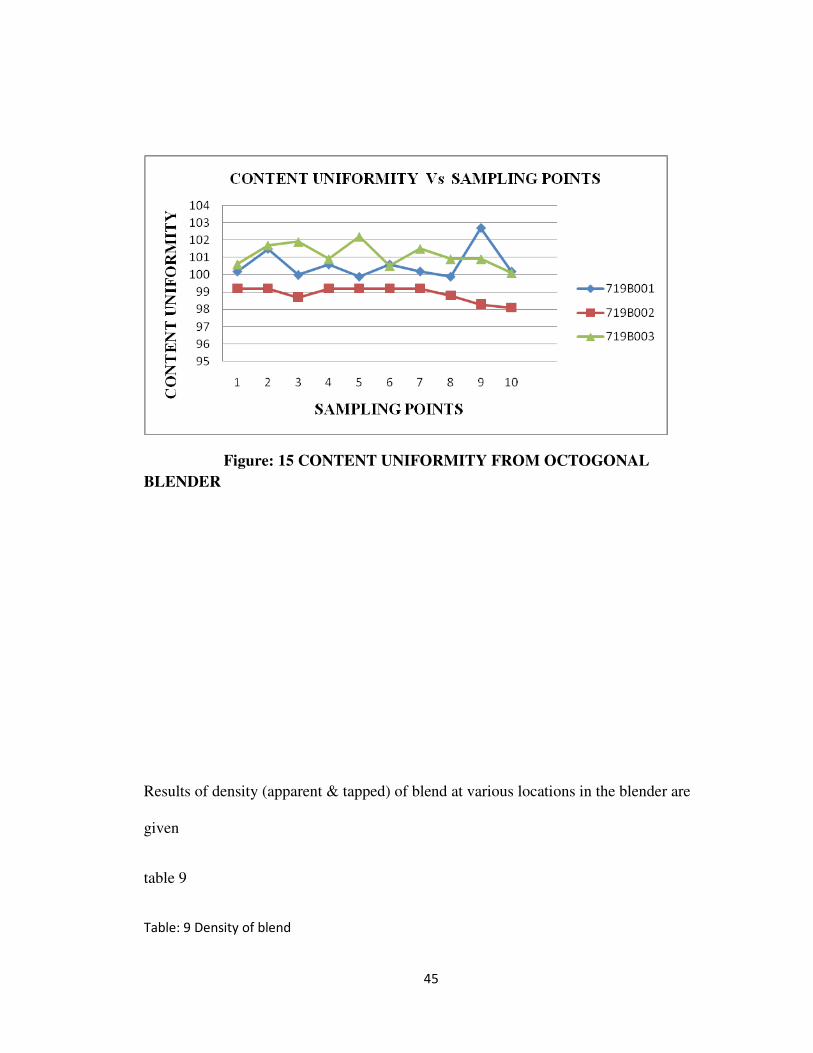
Figure: 15 CONTENT UNIFORMITY FROM OCTOGONAL
BLENDER
Results of density (apparent & tapped) of blend at various locations in the blender are
given
table 9
Table: 9 Density of blend
45
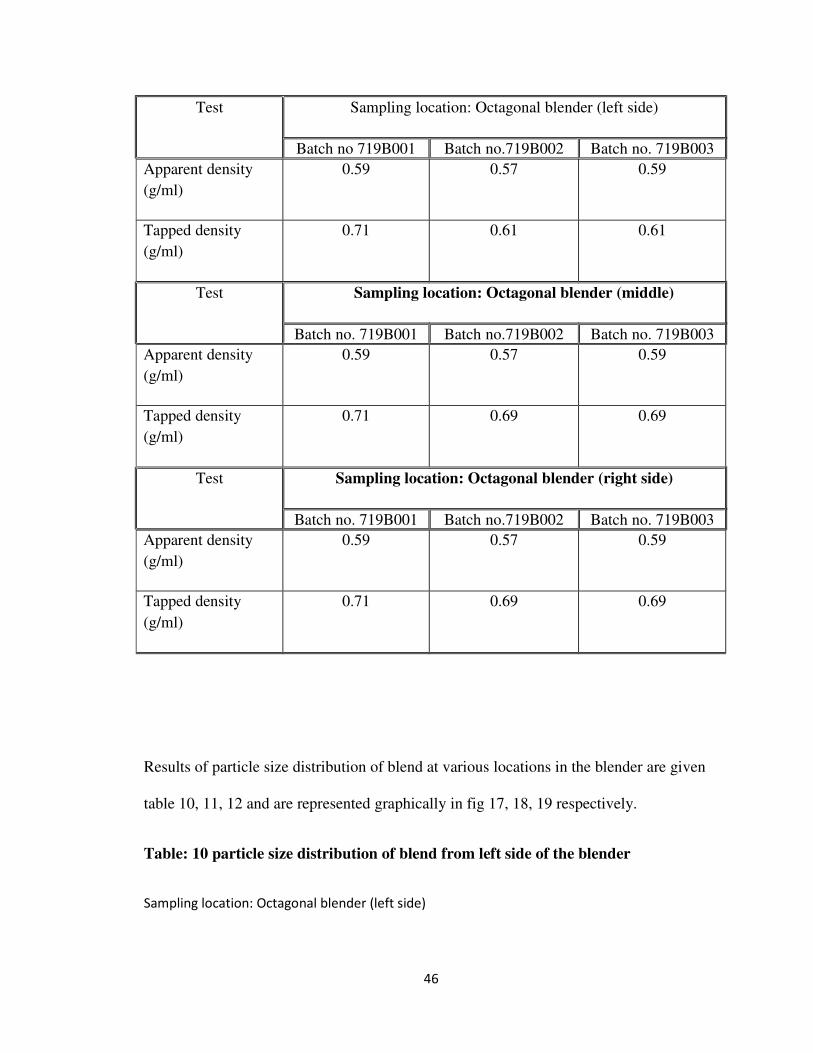
Test Sampling location: Octagonal blender (left side)
Batch no 719B001 Batch no.719B002 Batch no. 719B003
Apparent density
(g/ml)
0.59 0.57 0.59
Tapped density
(g/ml)
0.71 0.61 0.61
Test Sampling location: Octagonal blender (middle)
Batch no. 719B001 Batch no.719B002 Batch no. 719B003
Apparent density
(g/ml)
0.59 0.57 0.59
Tapped density
(g/ml)
0.71 0.69 0.69
Test Sampling location: Octagonal blender (right side)
Batch no. 719B001 Batch no.719B002 Batch no. 719B003
Apparent density
(g/ml)
0.59 0.57 0.59
Tapped density
(g/ml)
0.71 0.69 0.69
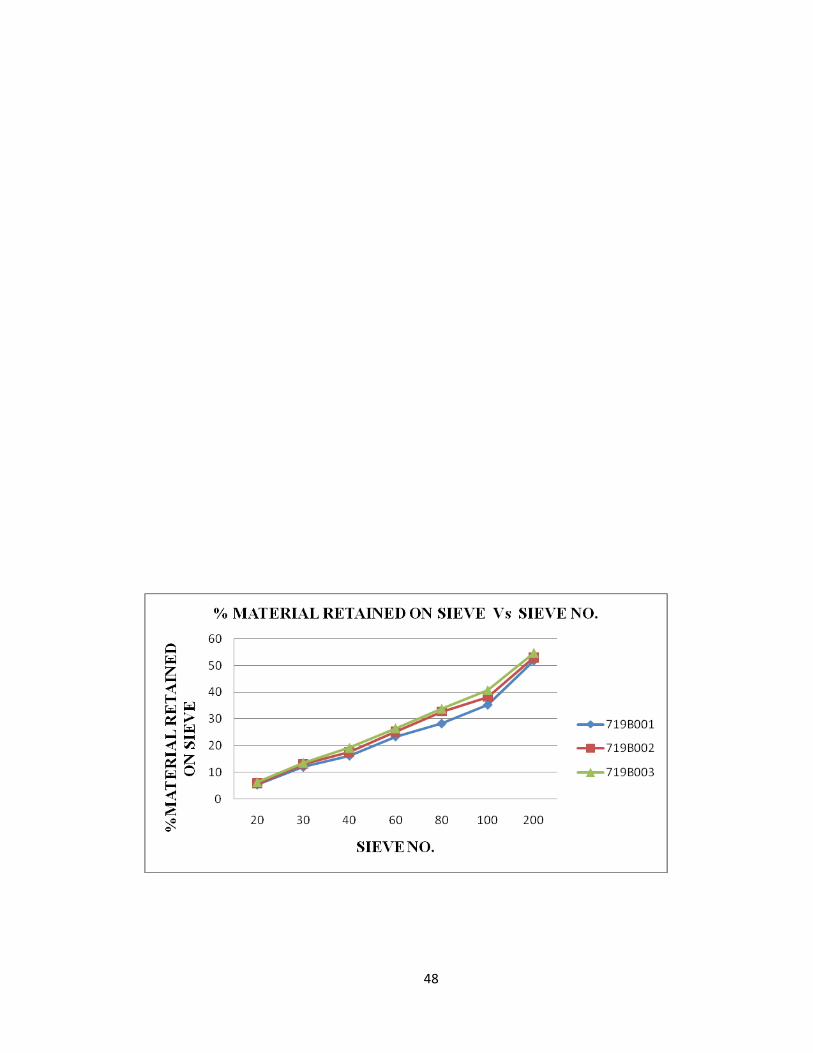
Results of particle size distribution of blend at various locations in the blender are given
table 10, 11, 12 and are represented graphically in fig 17, 18, 19 respectively.
Table: 10 particle size distribution of blend from left side of the blender
Sampling location: Octagonal blender (left side)
46

Sieve ID no. % of material retained on ASTM sieve
Batch no. 719B001 Batch no. 719B002 Batch no. 719B003
#20 5.30 6.35 6.24
#30 11.59 13.44 13.79
#40 15.89 18.94 19.18
#60 22.94 26.44 26.57
#80 28.59 33.48 33.27
#100 36.38 39.49 39.46
#200 53.02 54.07 54.15
Cumulative material
collected 99.50 99.90 99.70
Table: 11 particle size distribution of blend from middle of the blender
Sampling location: Octagonal blender (middle)
Sieve ID no. % of material retained on ASTM sieve
Batch no. 719B001 Batch no. 719B002 Batch no. 719B003
#20 5.50 5.69 6.35
#30 12.39 13.04 13.59
#40 17.09 17.53 19.19
#60 23.79 25.02 26.54
#80 29.54 32.67 33.83
#100 36.03 38.51 40.18
#200 52.32 53.40 54.77
Cumulative material
collected
99.55 99.50 99.65
47
48

Fig: 17 PARTICLE SIZE DISTRIBUTION FROM LEFT SIDE OF
BLENDER
Fig: 18 PARTICLE SIZE DISTRIBUTION FROM MIDDLE OF
BLENDER
Table: 12 particle size distribution of blend from right side of the blender
Sampling location: Octagonal blender (right side)
49
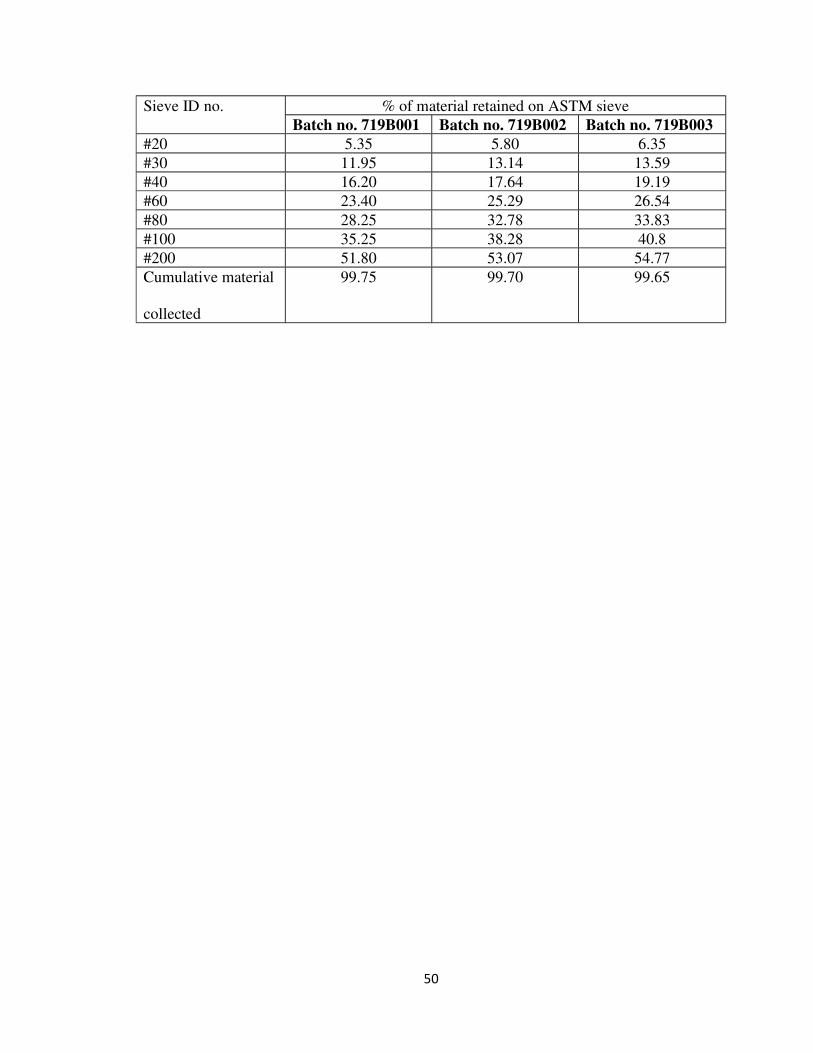
Sieve ID no. % of material retained on ASTM sieve
Batch no. 719B001 Batch no. 719B002 Batch no. 719B003
#20 5.35 5.80 6.35
#30 11.95 13.14 13.59
#40 16.20 17.64 19.19
#60 23.40 25.29 26.54
#80 28.25 32.78 33.83
#100 35.25 38.28 40.8
#200 51.80 53.07 54.77
Cumulative material
collected
99.75 99.70 99.65
50
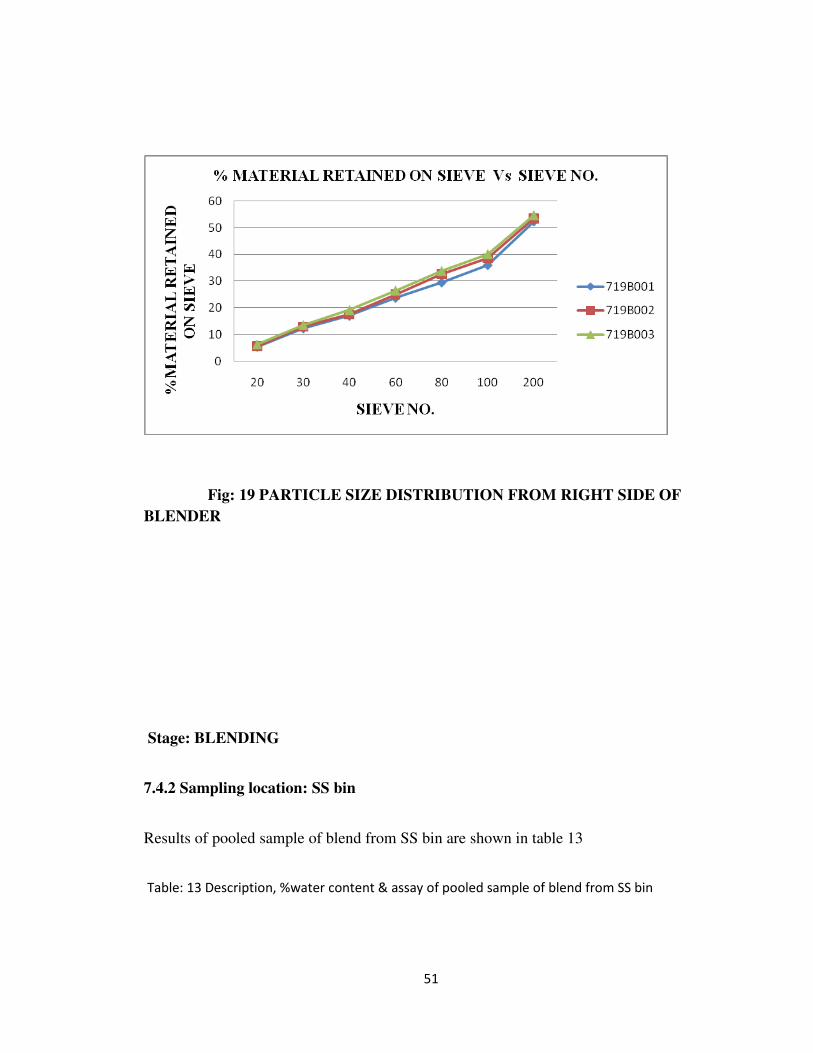
Fig: 19 PARTICLE SIZE DISTRIBUTION FROM RIGHT SIDE OF
BLENDER
Stage: BLENDING
7.4.2 Sampling location: SS bin
Results of pooled sample of blend from SS bin are shown in table 13
Table: 13 Description, %water content & assay of pooled sample of blend from SS bin
51

Test Acceptance criteria Batch No.
719B001 719B002 719B003
Description White to off white granular
powder
White
granular
powder
White
granular
powder
White
granular
powder
Water content by
KF (%w/w)
NMT 3% 2.0% 1.6% 2.0%
Assay Tablet blend contains the
equivalent of NLT 95% and
NMT 105% of the labeled
amount
98.9% 99.6% 99.3%
Stage: BLENDING
Sampling location: SS bin
Results of content uniformity of blend from SS bin are tabulated in table 14 & shown
graphically in fig 16
Table: 14 % Content uniformity of blend from SS bin
Locations Batch no. Acceptance
criteria719B001 719B002 719B003
1. 100.2 99.4 100.6
52

NLT 90.0 % to
NMT 110.0 % of
the labeled
amount.
2. 99.9 99.3 100.9
3. 103.0 99.0 101.5
4. 101.0 99.1 101.3
5. 101.1 100.4 100.6
6. 100.9 99.7 100.0
7. 100.1 98.8 100.9
8. 100.5 99.0 100.9
9. 100.4 99.3 99.1
10. 100.2 99.8 101.3
99.9 98.8 99.1
Max. 103.0 100.4 101.5
Average 100.73 99.38 100.71
RSD 0.9 0.5 0.7 RSD: NMT 5%
53

FIG: 16 CONTENT UNIFORMITY FROM SS BIN
7.5 Stage: COMPRESSION
54

Weight of 10 tablets from each validation batch at three different speeds are given in
table 15
Table: 15 Weight of 10 tablets from each batch at minimum, maximum & optimum speeds.
Batch No. Process
variable
Acceptance criteria Sample No./Description
Left Right
719B001 Compression
machine at
minimum
speed (10rpm)
Min:10.29g
Target:10.50g
Max:10.71g
10.55 10.53
719B002 10.79-10.54 10.53-10.57
719B003 10.52-10.53 10.52-10.54
719B001 Compression
machine at
maximum
speed (18rpm)
10.50-10.51 10.49-10.52
719B002 10.50-10.53 10.50-10.52
719B003 10.54 10.53
719B001 Compression
machine at
optimum
speed (15rpm)
First half
stage
10.49-10.59 10.51-10.62
719B002 10.50-10.60 10.49-10.60
719B003 10.49-10.54 10.52-10.54
719B001 Compression
machine at
optimum
speed (15rpm)
second half
stage
10.52-10.54 10.50-10.52
719B002 10.51-10.56 10.49-10.55
719B003 10.49-10.54 10.49-10.54
Stage: COMPRESSION
Disintegration time of sampled tablets from each validation batch at three different
speeds are given in table 16
55
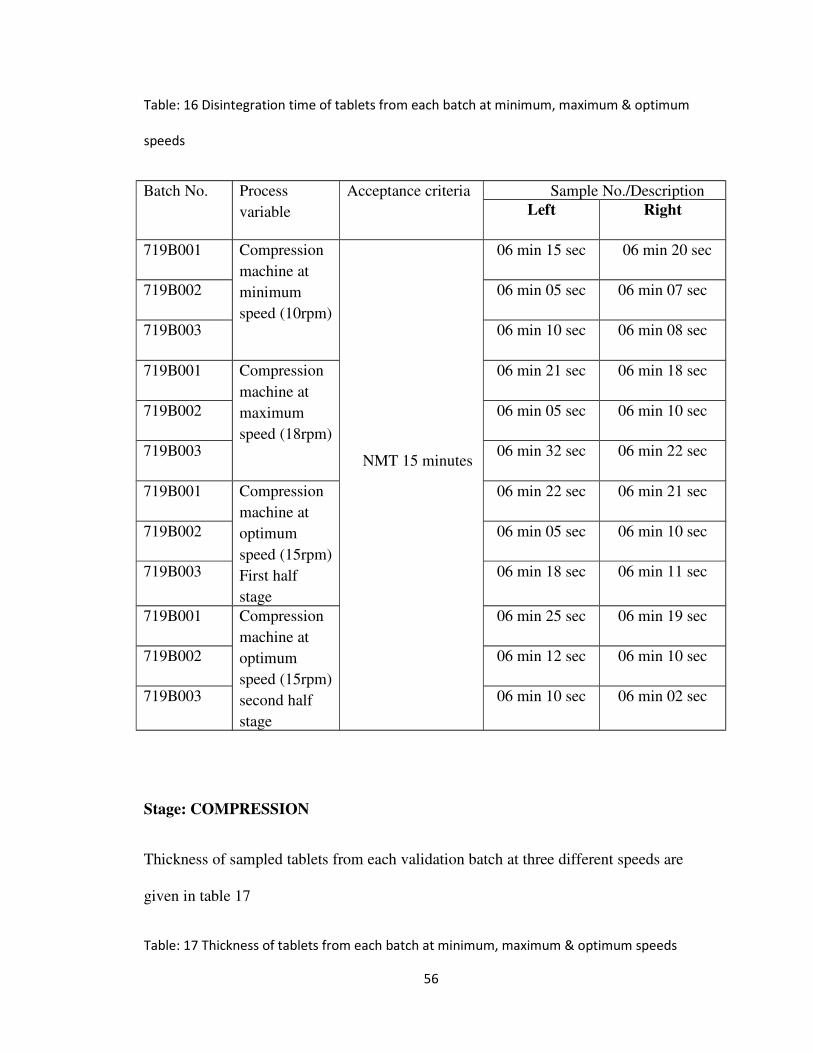
Table: 16 Disintegration time of tablets from each batch at minimum, maximum & optimum
speeds
Batch No. Process
variable
Acceptance criteria Sample No./Description
Left Right
719B001 Compression
machine at
minimum
speed (10rpm)
NMT 15 minutes
06 min 15 sec 06 min 20 sec
719B002 06 min 05 sec 06 min 07 sec
719B003 06 min 10 sec 06 min 08 sec
719B001 Compression
machine at
maximum
speed (18rpm)
06 min 21 sec 06 min 18 sec
719B002 06 min 05 sec 06 min 10 sec
719B003 06 min 32 sec 06 min 22 sec
719B001 Compression
machine at
optimum
speed (15rpm)
First half
stage
06 min 22 sec 06 min 21 sec
719B002 06 min 05 sec 06 min 10 sec
719B003 06 min 18 sec 06 min 11 sec
719B001 Compression
machine at
optimum
speed (15rpm)
second half
stage
06 min 25 sec 06 min 19 sec
719B002 06 min 12 sec 06 min 10 sec
719B003 06 min 10 sec 06 min 02 sec
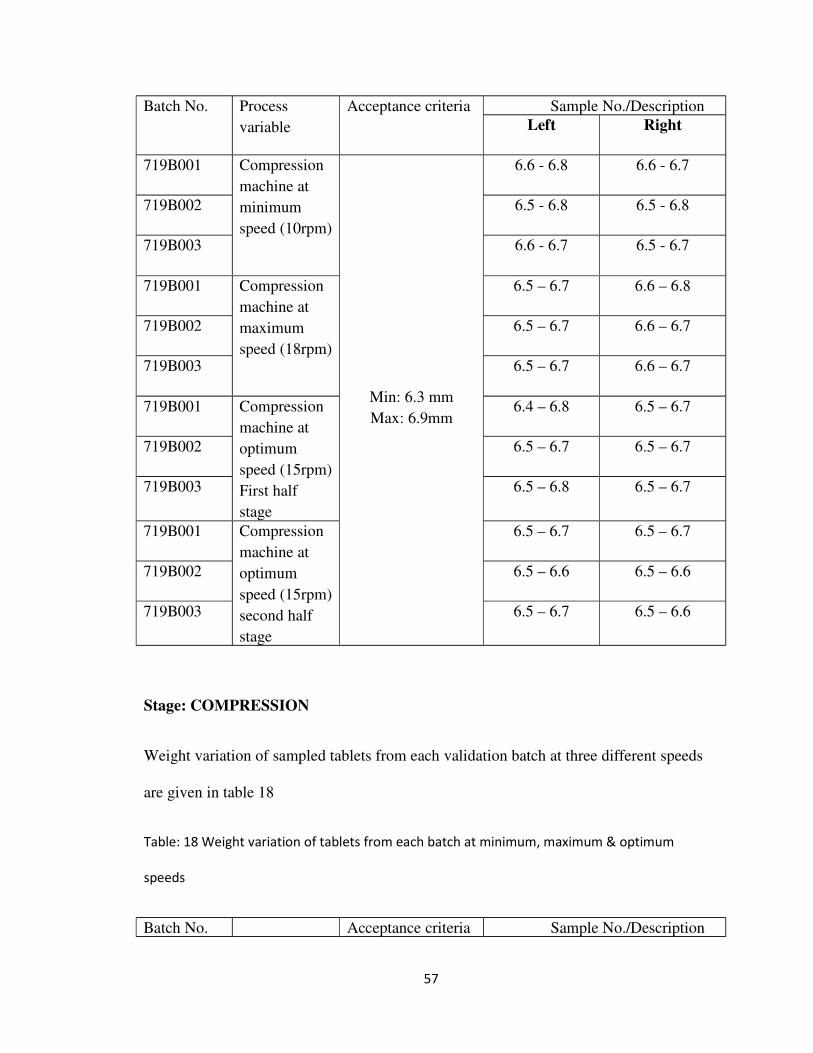
Stage: COMPRESSION
Thickness of sampled tablets from each validation batch at three different speeds are
given in table 17
Table: 17 Thickness of tablets from each batch at minimum, maximum & optimum speeds
56
Batch No. Process
variable
Acceptance criteria Sample No./Description
Left Right
719B001 Compression
machine at
minimum
speed (10rpm)
Min: 6.3 mm
Max: 6.9mm
6.6 - 6.8 6.6 - 6.7
719B002 6.5 - 6.8 6.5 - 6.8
719B003 6.6 - 6.7 6.5 - 6.7
719B001 Compression
machine at
maximum
speed (18rpm)
6.5 – 6.7 6.6 – 6.8
719B002 6.5 – 6.7 6.6 – 6.7
719B003 6.5 – 6.7 6.6 – 6.7
719B001 Compression
machine at
optimum
speed (15rpm)
First half
stage
6.4 – 6.8 6.5 – 6.7
719B002 6.5 – 6.7 6.5 – 6.7
719B003 6.5 – 6.8 6.5 – 6.7
719B001 Compression
machine at
optimum
speed (15rpm)
second half
stage
6.5 – 6.7 6.5 – 6.7
719B002 6.5 – 6.6 6.5 – 6.6
719B003 6.5 – 6.7 6.5 – 6.6
Stage: COMPRESSION
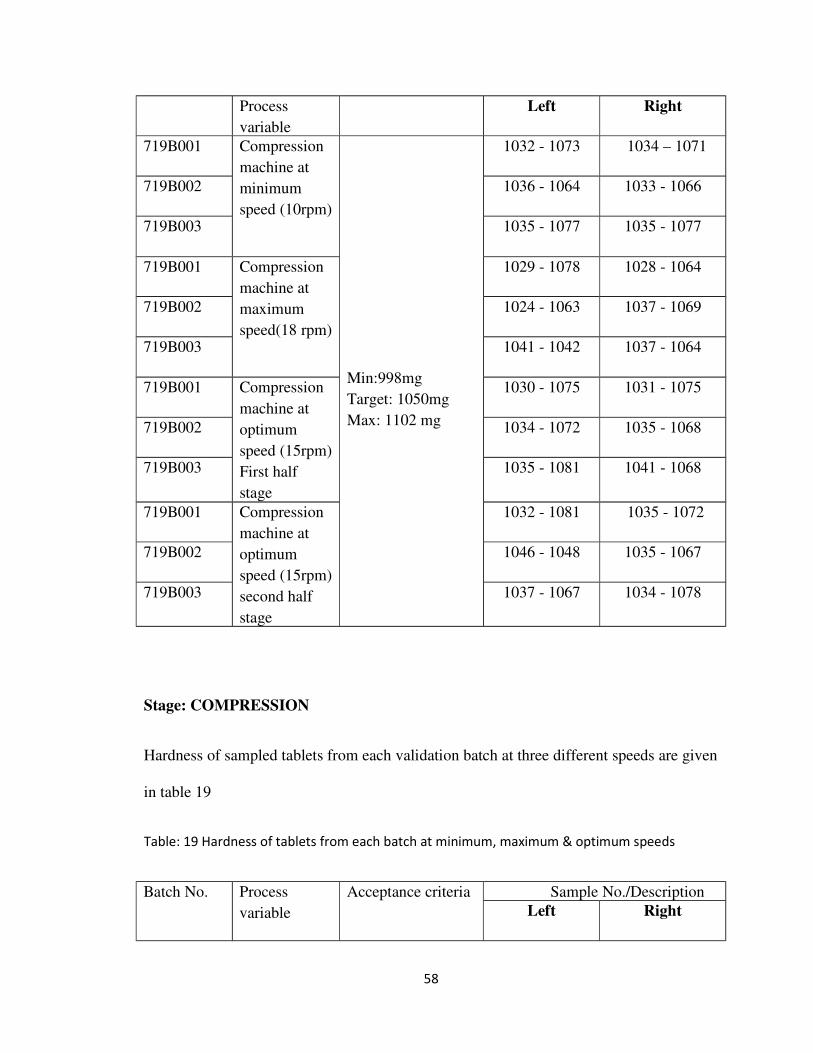
Weight variation of sampled tablets from each validation batch at three different speeds
are given in table 18
Table: 18 Weight variation of tablets from each batch at minimum, maximum & optimum
speeds
Batch No. Acceptance criteria Sample No./Description
57
Process
variable
Left Right
719B001 Compression
machine at
minimum
speed (10rpm)
Min:998mg
Target: 1050mg
Max: 1102 mg
1032 - 1073 1034 – 1071
719B002 1036 - 1064 1033 - 1066
719B003 1035 - 1077 1035 - 1077
719B001 Compression
machine at
maximum
speed(18 rpm)
1029 - 1078 1028 - 1064
719B002 1024 - 1063 1037 - 1069
719B003 1041 - 1042 1037 - 1064
719B001 Compression
machine at
optimum
speed (15rpm)
First half
stage
1030 - 1075 1031 - 1075
719B002 1034 - 1072 1035 - 1068
719B003 1035 - 1081 1041 - 1068
719B001 Compression
machine at
optimum
speed (15rpm)
second half
stage
1032 - 1081 1035 - 1072
719B002 1046 - 1048 1035 - 1067
719B003 1037 - 1067 1034 - 1078
Stage: COMPRESSION
Hardness of sampled tablets from each validation batch at three different speeds are given
in table 19
Table: 19 Hardness of tablets from each batch at minimum, maximum & optimum speeds
Batch No. Process
variable
Acceptance criteria Sample No./Description
Left Right
58

719B001 Compression
machine at
minimum
speed(10 rpm)
Min:16 kp
Max: 25 kp
16 – 23 18 - 25
719B002 18 - 23 17 - 23
719B003 19 - 24 18 - 23
719B001 Compression
machine at
maximum
speed (18rpm)
17 - 24 17 - 24
719B002 17 - 22 17 - 24
719B003 17 - 20 20 - 23
719B001 Compression
machine at
optimum
speed (15rpm)
First half
stage
17 - 25 19 - 25
719B002 17 - 21 17 - 24
719B003 19 - 24 20 - 24
719B001 Compression
machine at
optimum
speed (15rpm)
second half
stage
19 – 25 19 - 25
719B002 17 - 23 17 - 25
719B003 20 - 24 18 - 23
Stage: COMPRESSION
Physical inspection of sampled tablets from each validation batch at three different
speeds are given in table 20
Table: 20 Physical inspection of tablets from each batch at minimum, maximum & optimum
speeds
Batch No. Acceptance criteria Sample No./Description
59

Process
variable
Left Right
719B001 Compression
machine at
minimum
speed(10 rpm)
Free from physical
defects
complies complies
719B002 complies complies
719B003 complies complies
719B001 Compression
machine at
maximum
speed (18rpm)
complies complies
719B002 complies complies
719B003 complies complies
719B001 Compression
machine at
optimum
speed (15rpm)
First half
stage
complies complies
719B002 complies complies
719B003 complies complies
719B001 Compression
machine at
optimum
speed (15rpm)
second half
stage
complies complies
719B002 complies complies
719B003 complies complies
Stage: COMPRESSION
Friability of sampled tablets from each validation batch at three different speeds are given
in table 21
Table: 21 Friability of tablets from each batch at minimum, maximum & optimum speeds
Batch No. Process
variable
Acceptance criteria Sample No./Description
Left Right
60
719B001 Compression
machine at
minimum
speed(10 rpm)
NMT 1%
0.2 – 0.3 % 0.3 %
719B002 0.2 – 0.3 % 0.2 %
719B003 0.2 % 0.2 %
719B001 Compression
machine at
maximum
speed (18rpm)
0.3 % 0.2 – 0.3 %
719B002 0.2 – 0.3 % 0.2 %
719B003 0.2 % 0.2 %
719B001 Compression
machine at
optimum
speed (15rpm)
First half
stage
0.2 – 0.3 % 0.2 %
719B002 0.3 % 0.2 – 0.3 %
719B003 0.2 – 0.3 % 0.2 – 0.3 %
719B001 Compression
machine at
optimum
speed (15rpm)
second half
stage
0.3 % 0.3 %
719B002 0.2 – 0.3 % 0.2 %
719B003 0.3 % 0.3 %
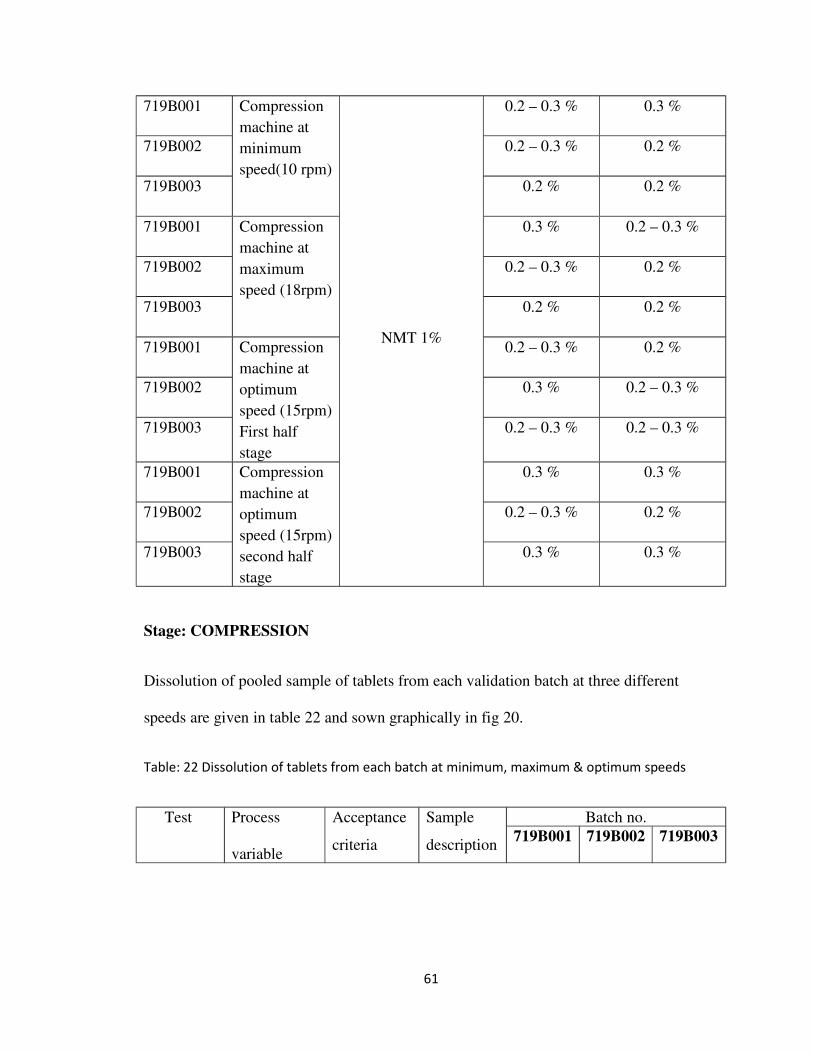
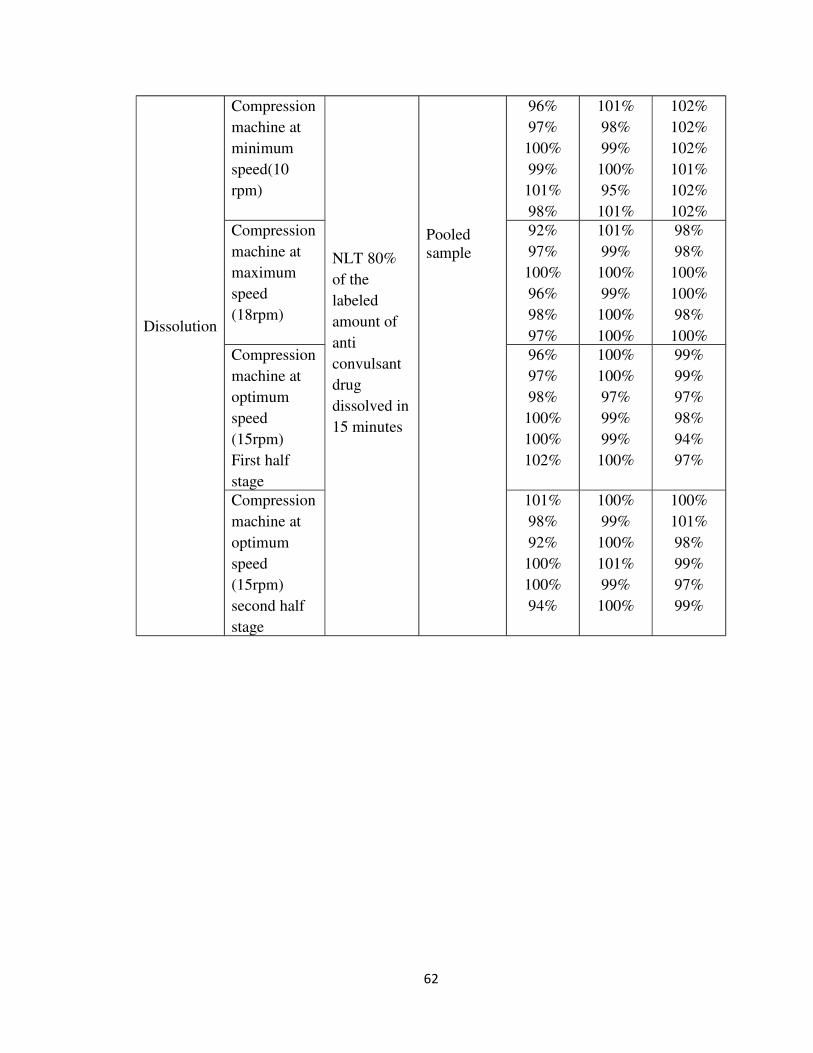
Stage: COMPRESSION
Dissolution of pooled sample of tablets from each validation batch at three different
speeds are given in table 22 and sown graphically in fig 20.
Table: 22 Dissolution of tablets from each batch at minimum, maximum & optimum speeds
Test Process
variable
Acceptance
criteria
Sample
description
Batch no.
719B001 719B002 719B003
61
Dissolution
Compression
machine at
minimum
speed(10
rpm)
NLT 80%
of the
labeled
amount of
anti
convulsant
drug
dissolved in
15 minutes
Pooled
sample
96%
97%
100%
99%
101%
98%
101%
98%
99%
100%
95%
101%
102%
102%
102%
101%
102%
102%
Compression
machine at
maximum
speed
(18rpm)
92%
97%
100%
96%
98%
97%
101%
99%
100%
99%
100%
100%
98%
98%
100%
100%
98%
100%
Compression
machine at
optimum
speed
(15rpm)
First half
stage
96%
97%
98%
100%
100%
102%
100%
100%
97%
99%
99%
100%
99%
99%
97%
98%
94%
97%
Compression
machine at
optimum
speed
(15rpm)
second half
stage
101%
98%
92%
100%
100%
94%
100%
99%
100%
101%
99%
100%
100%
101%
98%
99%
97%
99%
62

Fig: 20 DISSOLUTION AT DIFFERENT SPEEDS
63
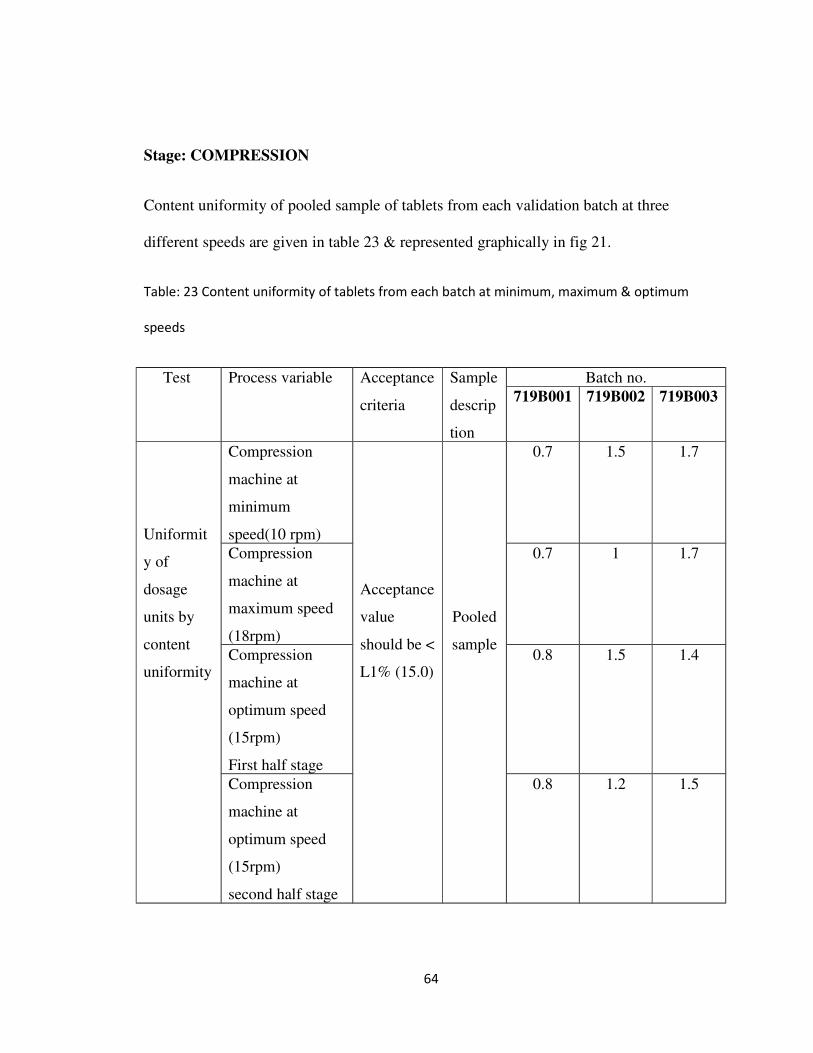
Stage: COMPRESSION
Content uniformity of pooled sample of tablets from each validation batch at three
different speeds are given in table 23 & represented graphically in fig 21.
Table: 23 Content uniformity of tablets from each batch at minimum, maximum & optimum
speeds
Test Process variable Acceptance
criteria
Sample
descrip
tion
Batch no.
719B001 719B002 719B003
Uniformit
y of
dosage
units by
content
uniformity
Compression
machine at
minimum
speed(10 rpm)
Acceptance
value
should be <
L1% (15.0)
Pooled
sample
0.7 1.5 1.7
Compression
machine at
maximum speed
(18rpm)
0.7 1 1.7
Compression
machine at
optimum speed
(15rpm)
First half stage
0.8 1.5 1.4
Compression
machine at
optimum speed
(15rpm)
second half stage
0.8 1.2 1.5
64

Fig: 21 UNIFORMITY OF DOSAGE UNITS BY CONTENT
UNIFORMITY AT DIFFERENT SPEEDS
65

7.6 Stage: COATING
Dissolution profile of pooled sample of tablets from each validation batch at different
time intervals are given in table 24 & shown graphically in fig 22.
Table: 24 Dissolution profile on 12 tablets
Test Process
variable
Acceptance
criteria
Sample
No./description
Batch No.
719B001 719B002 719B003
Dissolution
profile on
12 tablets
coating
For
reference
purpose
05 minutes
Avg % of drug
dissolved
22.7 32.6 29.7
% RSD 31.9 24.5 22.3
10 minutes
Avg % of drug
dissolved
64.0 72.9 72.2
% RSD 16.3 12.0 14.1
15 minutes
Avg % of drug
dissolved
90.3 94.7 94.4
% RSD 7.5 5.4 6.1
30 minutes
Avg % of drug
dissolved
101.4 102.9 103.0
% RSD 0.9 0.5 1.2
66

Fig: 22 DISSOLUTION PROFILE ON 12 TABLETS
67

Stage: COATING
Results of finished product testing of pooled sample of tablets are tabulated in table 25
Table: 25 Finished product testing
Test Specifications Batch No.
719B001 719B002 719B003
Description Blue coloured film coated
tablets
Blue
coloured film
coated tablets
Blue
coloured film
coated tablets
Blue coloured
film coated
tablets
Identification
a) By HPLC
The retention time of the
major peak in the
chromatogram of the assay
preparation corresponds to
that in the chromatogram of
the standard preparation, as
obtained in the assay
complies complies complies
b) By IR The IR spectrum of sample
should match with that of
standard
complies complies complies
c) By chiral
HPLC
The retention time of the
major peak should correspond
to the retention time of anti
convulsant drug peak obtained
in the chromatogram of
standard solution
complies complies complies
68

Table: 25 Finished product testing (contd…)
Test Specifications Batch No.
719B001 719B002 719B003
Water (%W/W)
by KF
NMT 3.0 2.3 2.5 2.1
AVG weight (mg) 1076.3±3% 1080.5 1079.2 1075.7
Uniformity of
dosage units by
weight variation
Acceptance value
should be less than or
equal to L1%(15.0)
2.0 1.6 0.6
Dissolution NLT 80% (Q) of the
labeled amount of anti
convulsant tablet is
dissolved in 15 minutes
100%
94%
102%
102%
99%
96%
102%
102%
99%
95%
100%
93%
102%
100%
92%
99%
94%
99%
Dissolution of finished product is represented graphically in fig 23.
69
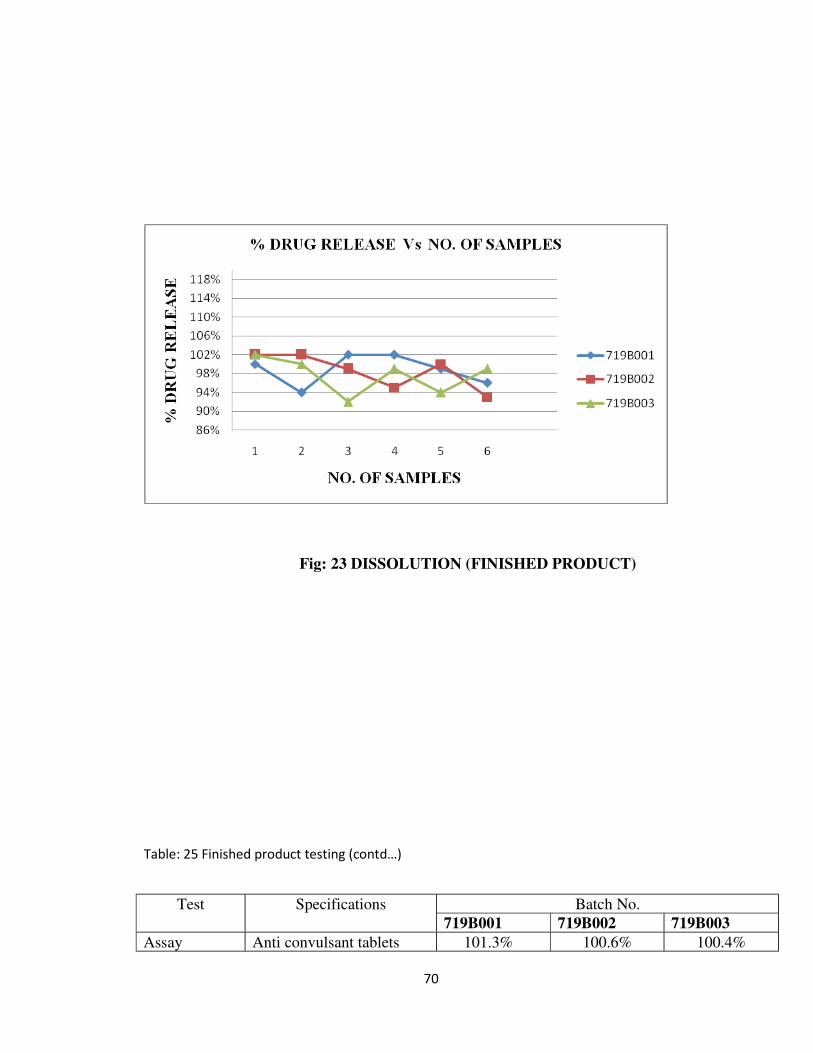
Fig: 23 DISSOLUTION (FINISHED PRODUCT)
Table: 25 Finished product testing (contd…)
Test Specifications Batch No.
719B001 719B002 719B003
Assay Anti convulsant tablets 101.3% 100.6% 100.4%
70

contain the equivalent of
NLT 90.0% and NMT
110.0% of the labeled
amount of anti convulsant
drug
Related
substances
(%W/W)
Impurity A: NMT 0.2
Impurity B: NMT 0.05
Highest unknown impurity:
NMT 0.1
Total impurities: NMT0.5
<LOQ(LOQ=
0.008)
Not detected
0.01%
0.01%
<LOQ(LOQ=
0.008)
Not detected
0.01%
0.02%
<LOQ(LOQ=
0.008)
Not detected
0.01%
0.01%
7.7 Stage: PACKING
Results of packing operations for 120’s count are given table 26
Table: 26 Results of packing
Process
stage
Test Acceptance
criteria
Batch No.
719B001 719B002 719B003
71
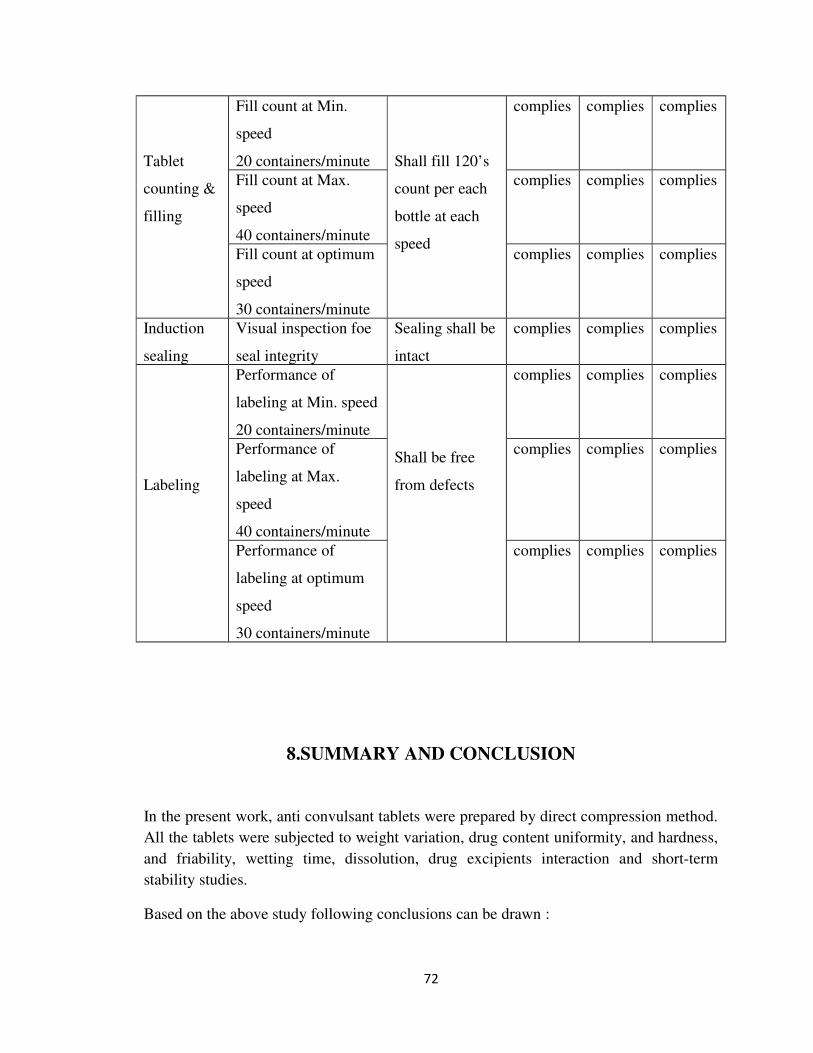
Tablet
counting &
filling
Fill count at Min.
speed
20 containers/minute Shall fill 120’s
count per each
bottle at each
speed
complies complies complies
Fill count at Max.
speed
40 containers/minute
complies complies complies
Fill count at optimum
speed
30 containers/minute
complies complies complies
Induction
sealing
Visual inspection foe
seal integrity
Sealing shall be
intact
complies complies complies
Labeling
Performance of
labeling at Min. speed
20 containers/minute
Shall be free
from defects
complies complies complies
Performance of
labeling at Max.
speed
40 containers/minute
complies complies complies
Performance of
labeling at optimum
speed
30 containers/minute
complies complies complies
8.SUMMARY AND CONCLUSION
In the present work, anti convulsant tablets were prepared by direct compression method.
All the tablets were subjected to weight variation, drug content uniformity, and hardness,
and friability, wetting time, dissolution, drug excipients interaction and short-term
stability studies.
Based on the above study following conclusions can be drawn :
72
• Tablets prepared by direct compression method were found to be good without
any chipping, capping and sticking.
• The hardness of the prepared tablets was found to be in the range of 3.2 to 4.1kg/
cm2.
• The friability values were found to be in the range of 0.41 to 0.49%.
• Disintegration time was found to be in the range of 84sec to 131sec.
9. BIBLIOGRAPHY
1. Andrew A. Signore, Terry Jacobs, Good Design Practices for GMP
pharmaceutical Facilities, special edn; vol 146, Informa Healthcare, New York,
pg no. 184
73

2. Marjo-Riitta Helle, Jouko Yliruusi, Jukka-Pekka Mannermaa, A Literature
Review of Pharmaceutical Process Validation, www.pharmatech.com, March 1,
2003.
3. Manohar A Potadar , Current Good Manufacturing Practices for Pharmaceuticals,
2nd edn;pharmaMed press, Delhi, 2008, pg no. 413- 425.
4. P.P Sharma, How to practice GMPs: A Guide for cGMP Compliance with PAT
and HACCP, 5th edn; Vandana publications Pvt Ltd. Delhi, 2005, pg no. 59
5. Dr Christine Oechslein, Max S Lazar, Process Validation from the view Point of
the FDA, www.gmp-publishing.com , Feb 2012.
6. N.K Jain, Pharmaceutical Product Development, 1st edn; C.B.S Publishers &
Distributors, New Delhi, 2005, pg no. 524-537.
7. Robert. A. Nash, Alfred. H. Wachter, Pharmaceutical Process Validation, Marcel
Dekker, Inc, USA, 3rd edn; vol 129, pg no. 1-29, 167-183
8. FDA, Draft Guidance for Industry – Process Validation: General Principles and
Practices, Rockville, MD, Nov, 2008.
9. Process Validation for drugs & biologics www.cfpie.com
10. James. P. Agalloco, Frederick. J. Carleton, Validation of Pharmaceutical
Processes, 3rd edn; , Informa Healthcare, New York, 2008, pg no. 3, 709.
11. Rules and Guidance for Pharmaceutical Distributors, MHRA, Pharmaceutical
press, London, 2007, pg no. 179.
12. James. P. Agalloco, Frederick. J. Carleton, Validation of Pharmaceutical
Processes- Sterile Products, 2nd edn; , Informa Healthcare, New York, 2008, pg
no.233, 234.
13. Chawla Nirmaljot Singh, Rana AC, Saini Seema, Singh Gurpreet, An Over view:
Role of Process Validation in Tablets, International Research Journal Of
Pharmacy, www.irjponline.com 3(1), 2012.
14. Raj Kumar P. Patil, Blend Uniformity in Pharmaceutical Solid Dosage forms,
www.askaboutvalidation.com , Feb 10th 2011.
15. Dr. Wayne A. Taylor, Methods and tools for process validation,
www.variation.com , 2011
74
16. Satyabrata Jena*, G. Arjun, N. V. Anil Kumar Ravipati, D.Satish kumar,
Vinod.K.R, David Banji, Industrial Process Validation of Solid Dosage forms- An
Overview, International Journal of Pharmaceutical Sciences Review and
Research, www.globalresearchonline.net , vol 4, Issue 2, 2010, pg no. 145-153.
17. Garg R, Gupta G, Agarwal S, Guidelines on General Principles of Validation:
solid, liquid and sterile dosage forms, www.pharmainfo.net, vol.6, Issue 1, 2008
18. Beer TR, Bodson C, Dejaegher B, Walczak B, Vercruysse P, Burggraeve A.
Raman spectroscopy as a process analytical technology (PAT) tool for the in-line
monitoring and understanding of a powder blending process. J Pharm Biomed
Anal 2008;48, pg no.772-9.
19. Chitlange S.S, Pawar H.I, Bhujbal S.S, Kulkarni A.A, Validation http// www.
Pharmainfo.net/ review validation, vol 4, Issue 6, 2006.
20. Elsie Jatto, Augustine O, Okhamafe, An Overview of Pharmaceutical Validation
and Process Controls in Drug Development, Tropical Journal of Pharmaceutical
Reaserch, Dec 2002, vol 1, Issue 2, pg no. 115–122.
21. Andrew W. Jones Process Validation of Existing Processes and Systems Using
Statistically Significant Retrospective Analysis - Parts One of Three,
www.ispeboston.org, 2001.
22. Dusel RG, Validation: Too much or not enough, STP Pharma Pratiques 1997, 7
(5), pg no. 392-397
23. O’- shea E. Aspects of Process Validation in the Manufacturing Industry, Irish
Pharmacy Journal 1995, April, vol 73 Issue 4, pg no. 107-112.
24. Edward CM, Validation of solid dosage forms: FDA review, Drug Development
& Industrial Pharmacy 1989, 15(6-7), pg no. 1119-1133.
75

76