process parameters optimization of thin-wall machining for
TRANSCRIPT
applied sciences
Article
Process Parameters Optimization of Thin-WallMachining for Wire Arc Additive Manufactured Parts
Niccolò Grossi * , Antonio Scippa , Giuseppe Venturini and Gianni Campatelli
Department of Industrial Engineering, University of Firenze, 50139 Firenze, Italy; [email protected] (A.S.);[email protected] (G.V.); [email protected] (G.C.)* Correspondence: [email protected]
Received: 14 October 2020; Accepted: 23 October 2020; Published: 27 October 2020�����������������
Featured Application: This work aims at supporting process parameter selection for machiningthin-walled components made by additive manufacturing. Machining industries, especially theones performing both additive and milling, could benefit from the potential application of suchan approach.
Abstract: Additive manufacturing (AM) is an arising production process due to the possibility toproduce monolithic components with complex shapes with one single process and without the needfor special tooling. AM-produced parts still often require a machining phase, since their surfacefinish is not compliant with the strict requirements of the most advanced markets, such as aerospace,energy, and defense. Since reduced weight is a key requirement for these parts, they feature thin wallsand webs, usually characterized by low stiffness, requiring the usage of low productivity machiningparameters. The idea of this paper is to set up an approach which is able to predict the dynamicsof a thin-walled part produced using AM. The knowledge of the workpiece dynamics evolutionthroughout the machining process can be used to carry out cutting parameter optimization withdifferent objectives (e.g., chatter avoidance, force vibrations reduction). The developed approachexploits finite element (FE) analysis to predict the workpiece dynamics during the machining process,updating its changing geometry. The developed solution can automatically optimize the toolpathfor the machining operation, generated by any Computer Aided Manufacturing (CAM) softwareupdating spindle speed in accordance with the selected optimization strategies. The developedapproach was tested using as a test case an airfoil.
Keywords: additive manufacturing; thin walled machining; dynamics; machining cycle optimization
1. Introduction
Lightweight constructions are becoming more and more important for many industries, such aspower generation, aerospace, automotive and medical technology. The functional requirements ofthese parts often lead to the inclusion of thin-walled features in the design of such components. Dueto the strict strength and fatigue requirements, such structures are often machined from the bulk asmonolithic components, removing a large amount of material to create the final product. Usually thisis achieved through intensive milling operations, removing up to 95% of the stock volume, to createthe final geometry [1].
An arising trend in thin-walled parts manufacturing is the introduction of additive manufacturing(AM) in the process chain. Indeed, AM allows one to deposit only the material needed for thethin-walled structures, considerably reducing the material waste. This is a critical issue, especiallywhen high cost materials are used, such as titanium or nickel-based alloys. Nowadays, many differentAM processes are available on the market [2]: powder bed fusion processes such as electron beam
Appl. Sci. 2020, 10, 7575; doi:10.3390/app10217575 www.mdpi.com/journal/applsci

Appl. Sci. 2020, 10, 7575 2 of 13
melting or selective laser melting enable the manufacturing of extremely complex geometries, buthave strict limitations on the part size [3]; on the other hand, directed energy deposition processessuch as laser deposition [4] or wire-arc-additive-manufacturing (WAAM) [5] enable the manufacturingof large parts with a limited features resolution. Despite the great advancements undergone bythe AM processes in terms of material quality [6] and repeatability, these technologies often do notmeet the dimensional and surface finishing requirements prescribed by the applications [7]. For thisreason, milling operations are usually carried out after AM, to correct inaccuracies and improve thesurface quality [8]. Therefore, including AM in the process chain requires carrying out machiningof thin-walled components. This is a critical operation due to the low stiffness of such workpieces,making them prone to forced vibrations, chatter [9], and deflection issues [10], being responsible forsurface location errors [11] and poor surface finish [12,13].
The general approach used to prevent these issues is to limit the material removal rate (MRR)by means of conservative machining parameters. This generates a reduction in the cutting forces,hence limiting workpieces’ vibrations at the expense of reduced productivity. Counteracting processvibrations without affecting the productivity requires the knowledge of workpiece dynamic behavior,i.e., the frequency response functions (FRFs), at each driving point triggered during the millingcycle [14,15]. This is hardly practicable through experimental techniques, such as impact testing, sincethe workpiece FRFs change during the milling operation, due to the material removal process [16].Moreover, in a thin-walled workpiece, the driving points’ FRFs are strongly dependent on the excitationpoint, resulting in a different dynamic behavior over the component. Finite element (FE) models are aconvenient way of overcoming these issues, enabling a virtual identification of workpiece dynamicbehavior at different driving points [17].
This paper proposes an innovative approach to identify the dynamic behavior of thin-walledworkpieces during milling operations. The basis of the proposed technique is the identification of theworkpiece dynamics through FE modelling using 2D shell elements [18]. This approach enables anefficient and accurate description of thin-walled structures’ dynamics. Moreover, the generation of ashell model could be easily automated exploiting AM deposition path, since it provides the informationconcerning the workpiece skeleton surface.
The proposed technique is divided into three main stages: (i) AM stock modelling, (ii) stockthickness updating and (iii) FRF identification. In the first step, a shell FE model of the deposed materialis created. Then, the machine tool numerical control (NC) programming language, known as G-code,is analyzed through an automated algorithm that identifies the position of the tool–workpiece contactpoint and updates the stock geometry, modifying the shell element’s thickness. This information allowsthe system to generate an updated FE model of the workpiece that takes the material removal effect intoaccount, enabling the accurate identification of its dynamic behavior. In the final step, the workpieceFRFs are calculated at the driving points (i.e., the tool–workpiece contact point) for every step of themachining process. This provides all the required information to optimize the milling process.
To prove the effectiveness and accuracy of the proposed dynamics identification technique, twospecimens of a test case thin-walled component were manufactured through the WAAM process. Inthis work, the WAAM process was selected because its high productivity has the drawback of lowaccuracy and the need for an extensive subtractive process to realize the final product. However, theproposed approach could be applied to other directed energy deposition processes. A five-axis millingcycle was defined and analyzed using the proposed technique, identifying the evolution of workpiecedynamics. Then, the machining parameters (i.e., spindle speed and feed rate) were adjusted followingtwo different optimization techniques. The two specimens were machined, interrupting the process toperform modal analysis, required to verify the accuracy of the proposed modelling technique. At theend of the milling process, both specimens were analyzed through surface measurements.
Appl. Sci. 2020, 10, 7575 3 of 13
2. Additive Production of Thin Walled Component
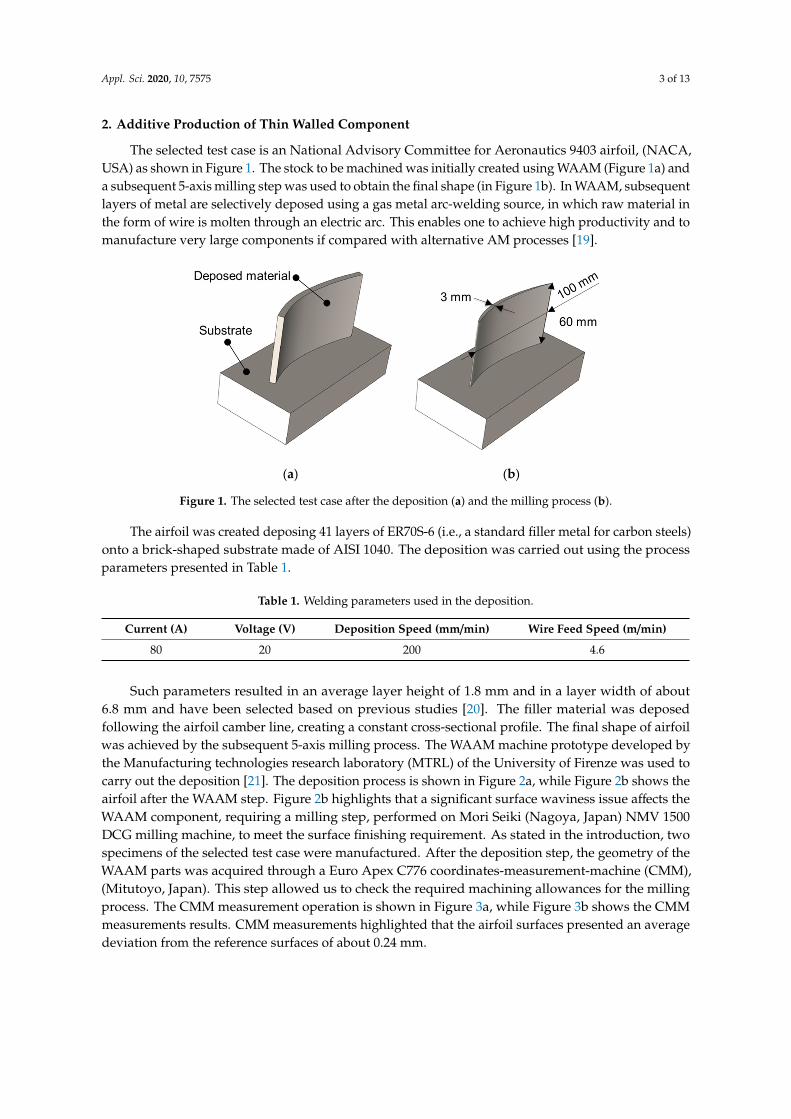
The selected test case is an National Advisory Committee for Aeronautics 9403 airfoil, (NACA,USA) as shown in Figure 1. The stock to be machined was initially created using WAAM (Figure 1a) anda subsequent 5-axis milling step was used to obtain the final shape (in Figure 1b). In WAAM, subsequentlayers of metal are selectively deposed using a gas metal arc-welding source, in which raw material inthe form of wire is molten through an electric arc. This enables one to achieve high productivity and tomanufacture very large components if compared with alternative AM processes [19].
Appl. Sci. 2020, 10, x FOR PEER REVIEW 3 of 13
2. Additive Production of Thin Walled Component
The selected test case is an National Advisory Committee for Aeronautics 9403 airfoil, (NACA, USA) as shown in Figure 1. The stock to be machined was initially created using WAAM (Figure 1a) and a subsequent 5-axis milling step was used to obtain the final shape (in Figure 1b). In WAAM, subsequent layers of metal are selectively deposed using a gas metal arc-welding source, in which raw material in the form of wire is molten through an electric arc. This enables one to achieve high productivity and to manufacture very large components if compared with alternative AM processes [19].
(a) (b)
Figure 1. The selected test case after the deposition (a) and the milling process (b).
The airfoil was created deposing 41 layers of ER70S-6 (i.e., a standard filler metal for carbon steels) onto a brick-shaped substrate made of AISI 1040. The deposition was carried out using the process parameters presented in Table 1.
Table 1. Welding parameters used in the deposition.
Current (A) Voltage (V) Deposition Speed (mm/min) Wire Feed Speed (m/min) 80 20 200 4.6
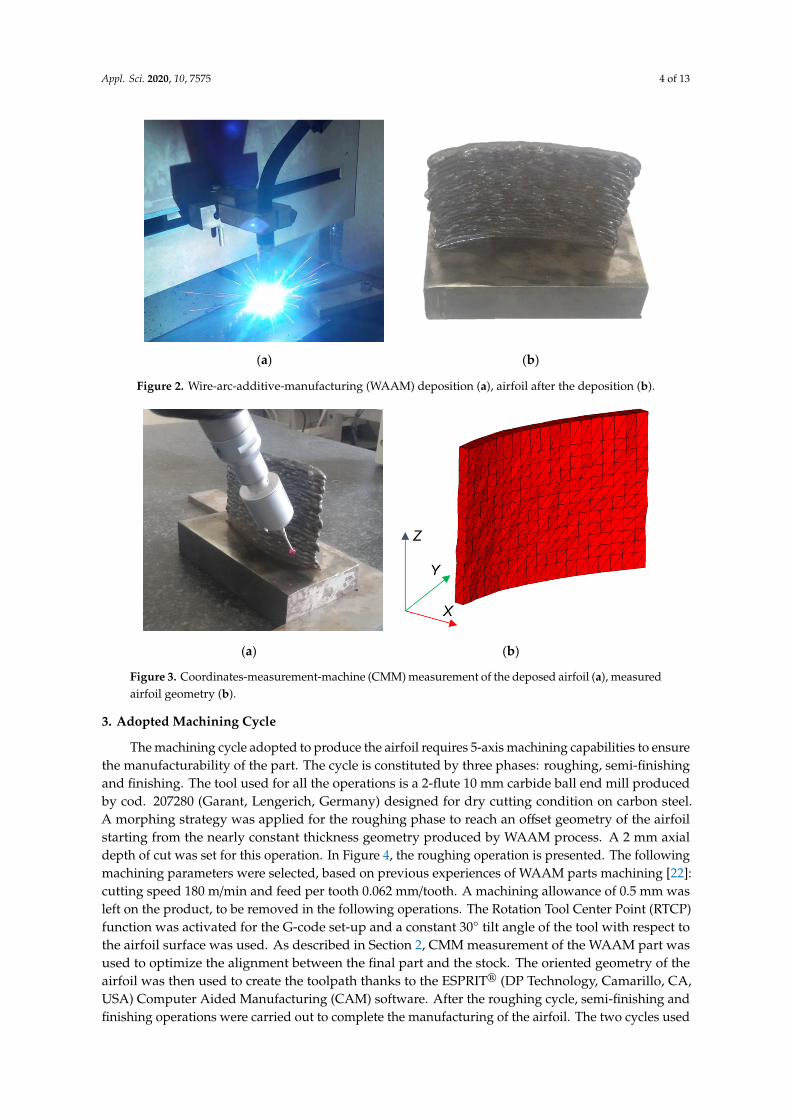
Such parameters resulted in an average layer height of 1.8 mm and in a layer width of about 6.8 mm and have been selected based on previous studies [20]. The filler material was deposed following the airfoil camber line, creating a constant cross-sectional profile. The final shape of airfoil was achieved by the subsequent 5-axis milling process. The WAAM machine prototype developed by the Manufacturing technologies research laboratory (MTRL) of the University of Firenze was used to carry out the deposition [21]. The deposition process is shown in Figure 2a, while Figure 2b shows the airfoil after the WAAM step. Figure 2b highlights that a significant surface waviness issue affects the WAAM component, requiring a milling step, performed on Mori Seiki (Japan) NMV 1500 DCG milling machine, to meet the surface finishing requirement. As stated in the introduction, two specimens of the selected test case were manufactured. After the deposition step, the geometry of the WAAM parts was acquired through a Euro Apex C776 coordinates-measurement-machine (CMM), (Mitutoyo, Japan). This step allowed us to check the required machining allowances for the milling process. The CMM measurement operation is shown in Figure 3a, while Figure 3b shows the CMM measurements results. CMM measurements highlighted that the airfoil surfaces presented an average deviation from the reference surfaces of about 0.24 mm.
Figure 1. The selected test case after the deposition (a) and the milling process (b).
The airfoil was created deposing 41 layers of ER70S-6 (i.e., a standard filler metal for carbon steels)onto a brick-shaped substrate made of AISI 1040. The deposition was carried out using the processparameters presented in Table 1.
Table 1. Welding parameters used in the deposition.
Current (A) Voltage (V) Deposition Speed (mm/min) Wire Feed Speed (m/min)
80 20 200 4.6
Such parameters resulted in an average layer height of 1.8 mm and in a layer width of about6.8 mm and have been selected based on previous studies [20]. The filler material was deposedfollowing the airfoil camber line, creating a constant cross-sectional profile. The final shape of airfoilwas achieved by the subsequent 5-axis milling process. The WAAM machine prototype developed bythe Manufacturing technologies research laboratory (MTRL) of the University of Firenze was used tocarry out the deposition [21]. The deposition process is shown in Figure 2a, while Figure 2b shows theairfoil after the WAAM step. Figure 2b highlights that a significant surface waviness issue affects theWAAM component, requiring a milling step, performed on Mori Seiki (Nagoya, Japan) NMV 1500DCG milling machine, to meet the surface finishing requirement. As stated in the introduction, twospecimens of the selected test case were manufactured. After the deposition step, the geometry of theWAAM parts was acquired through a Euro Apex C776 coordinates-measurement-machine (CMM),(Mitutoyo, Japan). This step allowed us to check the required machining allowances for the millingprocess. The CMM measurement operation is shown in Figure 3a, while Figure 3b shows the CMMmeasurements results. CMM measurements highlighted that the airfoil surfaces presented an averagedeviation from the reference surfaces of about 0.24 mm.
Appl. Sci. 2020, 10, 7575 4 of 13Appl. Sci. 2020, 10, x FOR PEER REVIEW 4 of 13
(a) (b)
Figure 2. Wire-arc-additive-manufacturing (WAAM) deposition (a), airfoil after the deposition (b).
(a) (b)
Figure 3. Coordinates-measurement-machine (CMM) measurement of the deposed airfoil (a), measured airfoil geometry (b).
(a) (b)
Figure 4. (a) Roughing cycle, (b) finished part.
Figure 2. Wire-arc-additive-manufacturing (WAAM) deposition (a), airfoil after the deposition (b).
Appl. Sci. 2020, 10, x FOR PEER REVIEW 4 of 13
(a) (b)
Figure 2. Wire-arc-additive-manufacturing (WAAM) deposition (a), airfoil after the deposition (b).
(a) (b)
Figure 3. Coordinates-measurement-machine (CMM) measurement of the deposed airfoil (a), measured airfoil geometry (b).
(a) (b)
Figure 4. (a) Roughing cycle, (b) finished part.
Figure 3. Coordinates-measurement-machine (CMM) measurement of the deposed airfoil (a), measuredairfoil geometry (b).
3. Adopted Machining Cycle
The machining cycle adopted to produce the airfoil requires 5-axis machining capabilities to ensurethe manufacturability of the part. The cycle is constituted by three phases: roughing, semi-finishingand finishing. The tool used for all the operations is a 2-flute 10 mm carbide ball end mill producedby cod. 207280 (Garant, Lengerich, Germany) designed for dry cutting condition on carbon steel.A morphing strategy was applied for the roughing phase to reach an offset geometry of the airfoilstarting from the nearly constant thickness geometry produced by WAAM process. A 2 mm axialdepth of cut was set for this operation. In Figure 4, the roughing operation is presented. The followingmachining parameters were selected, based on previous experiences of WAAM parts machining [22]:cutting speed 180 m/min and feed per tooth 0.062 mm/tooth. A machining allowance of 0.5 mm wasleft on the product, to be removed in the following operations. The Rotation Tool Center Point (RTCP)function was activated for the G-code set-up and a constant 30◦ tilt angle of the tool with respect tothe airfoil surface was used. As described in Section 2, CMM measurement of the WAAM part wasused to optimize the alignment between the final part and the stock. The oriented geometry of theairfoil was then used to create the toolpath thanks to the ESPRIT® (DP Technology, Camarillo, CA,USA) Computer Aided Manufacturing (CAM) software. After the roughing cycle, semi-finishing andfinishing operations were carried out to complete the manufacturing of the airfoil. The two cycles used

Appl. Sci. 2020, 10, 7575 5 of 13
the same tilt angle of the roughing phase. The axial depth of cut adopted for the machining operationswas 1 mm for semi-finishing and 0.5 mm for finishing. These steps were selected considering theexpected surface finish.
Appl. Sci. 2020, 10, x FOR PEER REVIEW 4 of 13
(a) (b)
Figure 2. Wire-arc-additive-manufacturing (WAAM) deposition (a), airfoil after the deposition (b).
(a) (b)
Figure 3. Coordinates-measurement-machine (CMM) measurement of the deposed airfoil (a), measured airfoil geometry (b).
(a) (b)
Figure 4. (a) Roughing cycle, (b) finished part.
Figure 4. (a) Roughing cycle, (b) finished part.
4. Thin-Walled Dynamics Prediction
Thin wall dynamics can be proficiently estimated using finite element analysis. To increasemodelling reliability and to reduce the computational effort, shell elements were considered. Moreover,considering the application of the proposed technique to the WAAM process, the deposition path canbe used to automatically generate the shell FE mesh. Each point of the NC code generated to create thedeposition toolpath can be used to become a node of the FE model, where only the properties andthickness of the shell elements shall be adjusted to create a realistic model. This enables a fast andautomatic mesh and model creation starting from the simple G-code of the deposition process (seeFigure 5). To take the material removal into account, the FE model must be continuously updated,according to the tool position along to the CAM generated toolpath. For this reason, a general algorithmwas developed to modify the nodal thicknesses, according to the tool engagement obtained by apost-processing of the G-code (Figure 6).
Appl. Sci. 2020, 10, x FOR PEER REVIEW 5 of 13
The two cycles used the same tilt angle of the roughing phase. The axial depth of cut adopted for the
machining operations was 1 mm for semi-finishing and 0.5 mm for finishing. These steps were
selected considering the expected surface finish.
(a) (b)
Figure 4. (a) Roughing cycle, (b) finished part.
4. Thin-Walled Dynamics Prediction
Thin wall dynamics can be proficiently estimated using finite element analysis. To increase
modelling reliability and to reduce the computational effort, shell elements were considered.
Moreover, considering the application of the proposed technique to the WAAM process, the
deposition path can be used to automatically generate the shell FE mesh. Each point of the NC code
generated to create the deposition toolpath can be used to become a node of the FE model, where
only the properties and thickness of the shell elements shall be adjusted to create a realistic model.
This enables a fast and automatic mesh and model creation starting from the simple G-code of the
deposition process (see Figure 5). To take the material removal into account, the FE model must be
continuously updated, according to the tool position along to the CAM generated toolpath. For this
reason, a general algorithm was developed to modify the nodal thicknesses, according to the tool
engagement obtained by a post-processing of the G-code (Figure 6).
(a) (b)
Figure 5. (a) Traditional shell element representation, (b) 3D element representation, showing the
nodal thickness.
Figure 5. (a) Traditional shell element representation, (b) 3D element representation, showing thenodal thickness.

Appl. Sci. 2020, 10, 7575 6 of 13Appl. Sci. 2020, 10, x FOR PEER REVIEW 6 of 13
Figure 6. Roughing cycle toolpath post-processing.
(a) (b)
Figure 7. Finite element (FE) model updating phase: (a) FE model (b) tooltip position.
For each node of the FE model, the corresponding block of the G-code is determined, computed as the minimum distance between the tooltip and the node considered. The nodal thickness is then updated considering the intersection of the tooltip geometry (a ball nose mill for the considered test case) with the external surface of the machined component (Figure 7). The predicted frequency response (FR) of the machined part can thus be easily obtained, performing a numerical frequency response analysis. For the test case considered, a modal frequency response was preferred. A unit force was applied to the node closest to the tool-tip position (obtained by G-code), directed normal to the surface. Linear behavior was assumed, and dynamic compliance in the other direction was neglected. This allows for obtaining a good description of thin wall dynamics in a wide frequency range using a limited number of excitation frequencies, notably reducing the computational effort: a FR analysis took about 3 s on a PC using a commercial FE solver (MSC Nastran 2014.1, Swedish Hexagon AB, Newport Beach, USA). The accuracy of the FE model was tested after the roughing machining phase, considering the FE model, updated according to the aforementioned algorithm (Figure 8). The following mechanical characteristics were considered: elastic modulus: 200 GPa, density: 7850 kg/m3, Poisson’s ratio: 0.31, structural damping: 0.005. According to the results in Error! Reference source not found., the proposed approach allows for predicting the changing of workpiece dynamics along the toolpath, taking the material removal into account at the same time.
Figure 6. Roughing cycle toolpath post-processing.
For each node of the FE model, the corresponding block of the G-code is determined, computedas the minimum distance between the tooltip and the node considered. The nodal thickness is thenupdated considering the intersection of the tooltip geometry (a ball nose mill for the consideredtest case) with the external surface of the machined component (Figure 7). The predicted frequencyresponse (FR) of the machined part can thus be easily obtained, performing a numerical frequencyresponse analysis. For the test case considered, a modal frequency response was preferred. A unit forcewas applied to the node closest to the tool-tip position (obtained by G-code), directed normal to thesurface. Linear behavior was assumed, and dynamic compliance in the other direction was neglected.This allows for obtaining a good description of thin wall dynamics in a wide frequency range using alimited number of excitation frequencies, notably reducing the computational effort: a FR analysistook about 3 s on a PC using a commercial FE solver (MSC Nastran 2014.1, Swedish Hexagon AB,Newport Beach, CA, USA). The accuracy of the FE model was tested after the roughing machiningphase, considering the FE model, updated according to the aforementioned algorithm (Figure 8). Thefollowing mechanical characteristics were considered: elastic modulus: 200 GPa, density: 7850 kg/m3,Poisson’s ratio: 0.31, structural damping: 0.005. According to the results in Figure 1, the proposedapproach allows for predicting the changing of workpiece dynamics along the toolpath, taking thematerial removal into account at the same time.
Appl. Sci. 2020, 10, x FOR PEER REVIEW 6 of 13
Figure 6. Roughing cycle toolpath post-processing.
For each node of the FE model, the corresponding block of the G-code is determined, computed
as the minimum distance between the tooltip and the node considered. The nodal thickness is then
updated considering the intersection of the tooltip geometry (a ball nose mill for the considered test
case) with the external surface of the machined component (Figure 7). The predicted frequency
response (FR) of the machined part can thus be easily obtained, performing a numerical frequency
response analysis. For the test case considered, a modal frequency response was preferred. A unit
force was applied to the node closest to the tool-tip position (obtained by G-code), directed normal
to the surface. Linear behavior was assumed, and dynamic compliance in the other direction was
neglected. This allows for obtaining a good description of thin wall dynamics in a wide frequency
range using a limited number of excitation frequencies, notably reducing the computational effort: a
FR analysis took about 3 s on a PC using a commercial FE solver (MSC Nastran 2014.1, Swedish
Hexagon AB, Newport Beach, CA, USA). The accuracy of the FE model was tested after the roughing
machining phase, considering the FE model, updated according to the aforementioned algorithm
(Figure 8). The following mechanical characteristics were considered: elastic modulus: 200 GPa,
density: 7850 kg/m3, Poisson’s ratio: 0.31, structural damping: 0.005. According to the results in Figure
1, the proposed approach allows for predicting the changing of workpiece dynamics along the
toolpath, taking the material removal into account at the same time.
(a) (b)
Figure 7. Finite element (FE) model updating phase: (a) FE model (b) tooltip position. Figure 7. Finite element (FE) model updating phase: (a) FE model (b) tooltip position.

Appl. Sci. 2020, 10, 7575 7 of 13
Appl. Sci. 2020, 10, x FOR PEER REVIEW 7 of 13
Simulated workpiece FRFs can be then composed, according with the orientation of the tool (lead and tilt angle) with the tooltip FRFs (experimentally determined), to obtain the dynamics of the system (tool + workpiece), changing with respect to the cutting point (see Figure 9). Combination of tool–workpiece compliance was used in the optimization strategy.
(a) (b)
Figure 8. Workpiece driving point frequency response functions (FRFs): (a) experimental setup (b) comparison with numerical FRF.
Figure 9. Compliance at the tip of the blade moving from the trailing to the leading edge.
5. Optimization Strategy
The proposed approach allows for identifying the dynamics of the tool–workpiece system during the whole machining cycle and could be coupled with any optimization strategy to achieve different goals, computing an optimized machining cycle.
Two main dynamic phenomena could arise in machining thin-walled components: forced vibrations and chatter vibrations. Both the effects are minimized by increasing the stiffness of the system or reducing the MRR (i.e., depth of cut). The first approach is hard to follow since workpiece shape and tooling system are generally fixed. The second one affects the productivity of the process.
Therefore, optimization strategies are generally based on the selection of spindle speed [23], which governs the frequency content of the cutting forces and thus could reduce vibration levels, without affecting productivity or altering system layout. However, the selection of spindle speed has conflicting requirements for forced and chatter vibrations. Indeed, to reduce forced vibrations, the
Figure 8. Workpiece driving point frequency response functions (FRFs): (a) experimental setup (b)comparison with numerical FRF.
Simulated workpiece FRFs can be then composed, according with the orientation of the tool(lead and tilt angle) with the tooltip FRFs (experimentally determined), to obtain the dynamics of thesystem (tool + workpiece), changing with respect to the cutting point (see Figure 9). Combination oftool–workpiece compliance was used in the optimization strategy.
Appl. Sci. 2020, 10, x FOR PEER REVIEW 7 of 13
Simulated workpiece FRFs can be then composed, according with the orientation of the tool (lead and tilt angle) with the tooltip FRFs (experimentally determined), to obtain the dynamics of the system (tool + workpiece), changing with respect to the cutting point (see Figure 9). Combination of tool–workpiece compliance was used in the optimization strategy.
(a) (b)
Figure 8. Workpiece driving point frequency response functions (FRFs): (a) experimental setup (b) comparison with numerical FRF.
Figure 9. Compliance at the tip of the blade moving from the trailing to the leading edge.
5. Optimization Strategy
The proposed approach allows for identifying the dynamics of the tool–workpiece system during the whole machining cycle and could be coupled with any optimization strategy to achieve different goals, computing an optimized machining cycle.
Two main dynamic phenomena could arise in machining thin-walled components: forced vibrations and chatter vibrations. Both the effects are minimized by increasing the stiffness of the system or reducing the MRR (i.e., depth of cut). The first approach is hard to follow since workpiece shape and tooling system are generally fixed. The second one affects the productivity of the process.
Therefore, optimization strategies are generally based on the selection of spindle speed [23], which governs the frequency content of the cutting forces and thus could reduce vibration levels, without affecting productivity or altering system layout. However, the selection of spindle speed has conflicting requirements for forced and chatter vibrations. Indeed, to reduce forced vibrations, the
Figure 9. Compliance at the tip of the blade moving from the trailing to the leading edge.
5. Optimization Strategy
The proposed approach allows for identifying the dynamics of the tool–workpiece system duringthe whole machining cycle and could be coupled with any optimization strategy to achieve differentgoals, computing an optimized machining cycle.
Two main dynamic phenomena could arise in machining thin-walled components: forcedvibrations and chatter vibrations. Both the effects are minimized by increasing the stiffness of thesystem or reducing the MRR (i.e., depth of cut). The first approach is hard to follow since workpieceshape and tooling system are generally fixed. The second one affects the productivity of the process.
Therefore, optimization strategies are generally based on the selection of spindle speed [23], whichgoverns the frequency content of the cutting forces and thus could reduce vibration levels, withoutaffecting productivity or altering system layout. However, the selection of spindle speed has conflicting

Appl. Sci. 2020, 10, 7575 8 of 13
requirements for forced and chatter vibrations. Indeed, to reduce forced vibrations, the spindle speedshould be far from the resonance frequencies of the system, hence reducing the relative tool–workpiecedisplacements during the cycle. On the contrary, for chatter avoidance, the optimal spindle speedsexcite the resonance frequency of the dominant mode [24].
According to these considerations, the machining cycle optimization strategy should be tailoredfor the specific application. In this work, two simple optimization strategies were applied, with theaim of showing the potential applications of the proposed approach.
• Strategy A: ensuring chatter-free machining by selecting a spindle speed, exciting the resonanceof the dominant mode
• Strategy B: minimizing forced vibrations by selecting spindle speeds far from the resonances ofthe systems
Both the strategies were applied to the test case, starting from the dynamic behavior of the systemat the cutting point computed by the proposed technique, presented in the previous section.
For strategy A, the dominant mode of the system was identified in the different steps of themachining cycle and a single optimized spindle speed was selected, ensuring the excitation of thedominant mode with one of the tooth pass frequency (ftp) harmonics. The procedure is exemplified inFigure 10, where FRFs of system during the machining cycle at the trailing edge are presented. Thefigure shows the dominant mode of the system around 1300 Hz. A single spindle speed equal to 5580rpm (ftp = 186 Hz) was selected to ensure the system to work close to the dominant mode resonancefrequency with one of the ftp harmonics (7th).
Appl. Sci. 2020, 10, x FOR PEER REVIEW 8 of 13
spindle speed should be far from the resonance frequencies of the system, hence reducing the relative tool–workpiece displacements during the cycle. On the contrary, for chatter avoidance, the optimal spindle speeds excite the resonance frequency of the dominant mode [24].
According to these considerations, the machining cycle optimization strategy should be tailored for the specific application. In this work, two simple optimization strategies were applied, with the aim of showing the potential applications of the proposed approach.
• Strategy A: ensuring chatter-free machining by selecting a spindle speed, exciting the resonance of the dominant mode
• Strategy B: minimizing forced vibrations by selecting spindle speeds far from the resonances of the systems
Both the strategies were applied to the test case, starting from the dynamic behavior of the system at the cutting point computed by the proposed technique, presented in the previous section.
For strategy A, the dominant mode of the system was identified in the different steps of the machining cycle and a single optimized spindle speed was selected, ensuring the excitation of the dominant mode with one of the tooth pass frequency (ftp) harmonics. The procedure is exemplified in Figure 10, where FRFs of system during the machining cycle at the trailing edge are presented. The figure shows the dominant mode of the system around 1300 Hz. A single spindle speed equal to 5580 rpm (ftp = 186 Hz) was selected to ensure the system to work close to the dominant mode resonance frequency with one of the ftp harmonics (7th).
For strategy B, machining parameters were selected to minimize the relative displacement of the tool–workpiece under the effect of cutting force (i.e., force vibrations). These vibrations were assessed by computing the system compliance at the ftp and harmonics (till 12th).
Figure 10. Optimization strategy A applied to the airfoil. Figure 10. Optimization strategy A applied to the airfoil.
For strategy B, machining parameters were selected to minimize the relative displacement of thetool–workpiece under the effect of cutting force (i.e., force vibrations). These vibrations were assessedby computing the system compliance at the ftp and harmonics (till 12th).
The harmonics were weighted based on the results of a preliminary analysis in which cuttingforces were simulated in the finishing cutting conditions (i.e., radial depth of cut (ae) 0.2 mm, axialdepth of cut (ap) 0.5 mm).Fast Fourier Transform (FFTs) of the cutting force and weights adopted arepresented in Figure 11. This approach allows for identifying the relative displacement of the tool andworkpiece in the case of stable cutting (i.e., without chatter) and, based on this information, selectingthe optimal speed in a defined range (in this case, 140 to 235 m/min). The interesting advantage ofsuch approach is not considering a cutting force model and the consequently need of cutting force

Appl. Sci. 2020, 10, 7575 9 of 13
coefficients [25]—this allows us to perform the proposed optimization but not to predict the actualdynamic deflection.Appl. Sci. 2020, 10, x FOR PEER REVIEW 9 of 13
Figure 11. Harmonics weights for optimization strategy B.
The harmonics were weighted based on the results of a preliminary analysis in which cutting forces were simulated in the finishing cutting conditions (i.e., radial depth of cut (ae) 0.2 mm, axial depth of cut (ap) 0.5 mm).Fast Fourier Transform (FFTs) of the cutting force and weights adopted are presented in Figure 11. This approach allows for identifying the relative displacement of the tool and workpiece in the case of stable cutting (i.e., without chatter) and, based on this information, selecting the optimal speed in a defined range (in this case, 140 to 235 m/min). The interesting advantage of such approach is not considering a cutting force model and the consequently need of cutting force coefficients [25]—this allows us to perform the proposed optimization but not to predict the actual dynamic deflection.
To effectively minimize the forced vibrations, this procedure was repeated for each step of the cycle, and with respect to the previous strategy, the spindle speed was changed continuously during the machining cycle. Feed rate was changed accordingly to keep feed per tooth constant (0.062 mm/tooth). The optimal cutting speeds trend for the finishing of the airfoil, using strategy B, is presented in Figure 12.
Figure 12. Optimal spindle speeds for optimization strategy B.
6. Results and Discussion
The two strategies were tested on the finishing phase of the test-case to assess their performances. During strategy B machining, chatter occurred, as was clear from the sound during cutting and the surface quality of the product. Strategy B was defined to minimize forced vibrations assuming a chatter-free condition; however, adopting such a solution leads to the selection of spindle speeds more prone to chatter vibrations, as explained in the previous section. On the contrary, no chatter was detected during the strategy A machining cycle: the selection of the suitable spindle speed avoided the occurrence of the phenomenon.
0 500 1000 1500 2000Frequency (Hz)
0
0.2
0.4
0.6
0.8
1
Forc
e FF
T (N
)
0 2 4 6 8 10 12ftp harmonics
00.5
1
Wei
ghts
Figure 11. Harmonics weights for optimization strategy B.
To effectively minimize the forced vibrations, this procedure was repeated for each step of thecycle, and with respect to the previous strategy, the spindle speed was changed continuously during themachining cycle. Feed rate was changed accordingly to keep feed per tooth constant (0.062 mm/tooth).The optimal cutting speeds trend for the finishing of the airfoil, using strategy B, is presented inFigure 12.
Appl. Sci. 2020, 10, x FOR PEER REVIEW 9 of 13
Figure 11. Harmonics weights for optimization strategy B.
The harmonics were weighted based on the results of a preliminary analysis in which cutting forces were simulated in the finishing cutting conditions (i.e., radial depth of cut (ae) 0.2 mm, axial depth of cut (ap) 0.5 mm).Fast Fourier Transform (FFTs) of the cutting force and weights adopted are presented in Figure 11. This approach allows for identifying the relative displacement of the tool and workpiece in the case of stable cutting (i.e., without chatter) and, based on this information, selecting the optimal speed in a defined range (in this case, 140 to 235 m/min). The interesting advantage of such approach is not considering a cutting force model and the consequently need of cutting force coefficients [25]—this allows us to perform the proposed optimization but not to predict the actual dynamic deflection.
To effectively minimize the forced vibrations, this procedure was repeated for each step of the cycle, and with respect to the previous strategy, the spindle speed was changed continuously during the machining cycle. Feed rate was changed accordingly to keep feed per tooth constant (0.062 mm/tooth). The optimal cutting speeds trend for the finishing of the airfoil, using strategy B, is presented in Figure 12.
Figure 12. Optimal spindle speeds for optimization strategy B.
6. Results and Discussion
The two strategies were tested on the finishing phase of the test-case to assess their performances. During strategy B machining, chatter occurred, as was clear from the sound during cutting and the surface quality of the product. Strategy B was defined to minimize forced vibrations assuming a chatter-free condition; however, adopting such a solution leads to the selection of spindle speeds more prone to chatter vibrations, as explained in the previous section. On the contrary, no chatter was detected during the strategy A machining cycle: the selection of the suitable spindle speed avoided the occurrence of the phenomenon.
0 500 1000 1500 2000Frequency (Hz)
0
0.2
0.4
0.6
0.8
1
Forc
e FF
T (N
)0 2 4 6 8 10 12
ftp harmonics0
0.51
Wei
ghts
Figure 12. Optimal spindle speeds for optimization strategy B.
6. Results and Discussion
The two strategies were tested on the finishing phase of the test-case to assess their performances.During strategy B machining, chatter occurred, as was clear from the sound during cutting and thesurface quality of the product. Strategy B was defined to minimize forced vibrations assuming achatter-free condition; however, adopting such a solution leads to the selection of spindle speeds moreprone to chatter vibrations, as explained in the previous section. On the contrary, no chatter wasdetected during the strategy A machining cycle: the selection of the suitable spindle speed avoided theoccurrence of the phenomenon.
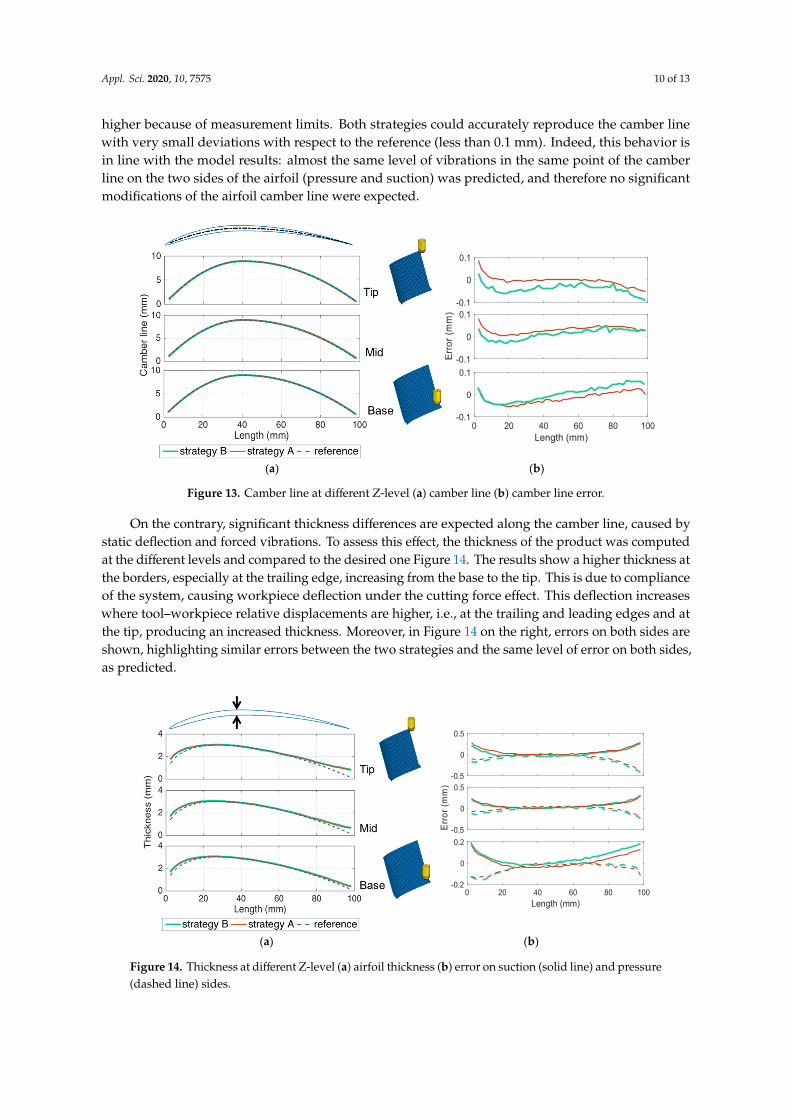
To further investigate the results, airfoils surfaces were acquiring by the CMM and analyzed. Bothpressure and suction sides were scanned using a 2 mm spatial step along length and height. First, formerrors of the surfaces respect to the nominal NACA 9403 were studied. Mid-surfaces were computedand compared with the reference camber line and results are shown at three heights (Figure 13): Tip isclose to the upper part of the airfoil, Mid is in the middle and Base is close to the fixed root part but
Appl. Sci. 2020, 10, 7575 10 of 13
higher because of measurement limits. Both strategies could accurately reproduce the camber linewith very small deviations with respect to the reference (less than 0.1 mm). Indeed, this behavior isin line with the model results: almost the same level of vibrations in the same point of the camberline on the two sides of the airfoil (pressure and suction) was predicted, and therefore no significantmodifications of the airfoil camber line were expected.
Appl. Sci. 2020, 10, x FOR PEER REVIEW 10 of 13
To further investigate the results, airfoils surfaces were acquiring by the CMM and analyzed. Both pressure and suction sides were scanned using a 2 mm spatial step along length and height. First, form errors of the surfaces respect to the nominal NACA 9403 were studied. Mid-surfaces were computed and compared with the reference camber line and results are shown at three heights (Figure 13): Tip is close to the upper part of the airfoil, Mid is in the middle and Base is close to the fixed root part but higher because of measurement limits. Both strategies could accurately reproduce the camber line with very small deviations with respect to the reference (less than 0.1 mm). Indeed, this behavior is in line with the model results: almost the same level of vibrations in the same point of the camber line on the two sides of the airfoil (pressure and suction) was predicted, and therefore no significant modifications of the airfoil camber line were expected.
(a) (b)
Figure 13. Camber line at different Z-level (a) camber line (b) camber line error.
(a) (b)
Figure 14. Thickness at different Z-level (a) airfoil thickness (b) error on suction (solid line) and pressure (dashed line) sides.
On the contrary, significant thickness differences are expected along the camber line, caused by static deflection and forced vibrations. To assess this effect, the thickness of the product was computed at the different levels and compared to the desired one Figure 14. The results show a higher thickness at the borders, especially at the trailing edge, increasing from the base to the tip. This is due to compliance of the system, causing workpiece deflection under the cutting force effect. This
-0.1
0
0.1
-0.1
0
0.1
Erro
r (m
m)
0 20 40 60 80 100Length (mm)
-0.1
0
0.1
-0.5
0
0.5
-0.5
0
0.5
Erro
r (m
m)
0 20 40 60 80 100Length (mm)
-0.2
0
0.2
Figure 13. Camber line at different Z-level (a) camber line (b) camber line error.
On the contrary, significant thickness differences are expected along the camber line, caused bystatic deflection and forced vibrations. To assess this effect, the thickness of the product was computedat the different levels and compared to the desired one Figure 14. The results show a higher thickness atthe borders, especially at the trailing edge, increasing from the base to the tip. This is due to complianceof the system, causing workpiece deflection under the cutting force effect. This deflection increaseswhere tool–workpiece relative displacements are higher, i.e., at the trailing and leading edges and atthe tip, producing an increased thickness. Moreover, in Figure 14 on the right, errors on both sides areshown, highlighting similar errors between the two strategies and the same level of error on both sides,as predicted.
Appl. Sci. 2020, 10, x FOR PEER REVIEW 10 of 13
To further investigate the results, airfoils surfaces were acquiring by the CMM and analyzed. Both pressure and suction sides were scanned using a 2 mm spatial step along length and height. First, form errors of the surfaces respect to the nominal NACA 9403 were studied. Mid-surfaces were computed and compared with the reference camber line and results are shown at three heights (Figure 13): Tip is close to the upper part of the airfoil, Mid is in the middle and Base is close to the fixed root part but higher because of measurement limits. Both strategies could accurately reproduce the camber line with very small deviations with respect to the reference (less than 0.1 mm). Indeed, this behavior is in line with the model results: almost the same level of vibrations in the same point of the camber line on the two sides of the airfoil (pressure and suction) was predicted, and therefore no significant modifications of the airfoil camber line were expected.
(a) (b)
Figure 13. Camber line at different Z-level (a) camber line (b) camber line error.
(a) (b)
Figure 14. Thickness at different Z-level (a) airfoil thickness (b) error on suction (solid line) and pressure (dashed line) sides.
On the contrary, significant thickness differences are expected along the camber line, caused by static deflection and forced vibrations. To assess this effect, the thickness of the product was computed at the different levels and compared to the desired one Figure 14. The results show a higher thickness at the borders, especially at the trailing edge, increasing from the base to the tip. This is due to compliance of the system, causing workpiece deflection under the cutting force effect. This
-0.1
0
0.1
-0.1
0
0.1
Erro
r (m
m)
0 20 40 60 80 100Length (mm)
-0.1
0
0.1
-0.5
0
0.5
-0.5
0
0.5
Erro
r (m
m)
0 20 40 60 80 100Length (mm)
-0.2
0
0.2
Figure 14. Thickness at different Z-level (a) airfoil thickness (b) error on suction (solid line) and pressure(dashed line) sides.

Appl. Sci. 2020, 10, 7575 11 of 13
The thickness error along the entire surface is presented in Figures 15 and 16. The results presentthe thickness error trend, higher at the two edges and increasing the height. It is interesting to pointout that the thickness error is very similar between the two strategies. This could be explained by thefact that strategy A allowed us to avoid chatter vibrations at the price of working at the resonance ofthe system, thus increasing forced vibrations and causing thickness errors. Strategy B was selected toreduce forced vibrations, but chatter vibration occurred, leading to a significant increase in cuttingforces, which cancelled the optimized speed selection benefits. Moreover, static deflection is notaffected by the two strategies and could be the main factor responsible for the deviations that increaseat the leading and trailing edge because of structural stiffness reduction. The main difference betweenthe two thickness error maps is roughness: strategy A produced a smoother surface, while strategy Bpresents higher waviness and roughness caused by the occurrence of chatter.
Appl. Sci. 2020, 10, x FOR PEER REVIEW 11 of 13
deflection increases where tool–workpiece relative displacements are higher, i.e., at the trailing and leading edges and at the tip, producing an increased thickness. Moreover, in Figure 14on the right, errors on both sides are shown, highlighting similar errors between the two strategies and the same level of error on both sides, as predicted.
The thickness error along the entire surface is presented in Figures 15 and 16. The results present the thickness error trend, higher at the two edges and increasing the height. It is interesting to point out that the thickness error is very similar between the two strategies. This could be explained by the fact that strategy A allowed us to avoid chatter vibrations at the price of working at the resonance of the system, thus increasing forced vibrations and causing thickness errors. Strategy B was selected to reduce forced vibrations, but chatter vibration occurred, leading to a significant increase in cutting forces, which cancelled the optimized speed selection benefits. Moreover, static deflection is not affected by the two strategies and could be the main factor responsible for the deviations that increase at the leading and trailing edge because of structural stiffness reduction. The main difference between the two thickness error maps is roughness: strategy A produced a smoother surface, while strategy B presents higher waviness and roughness caused by the occurrence of chatter.
Figure 15. Airfoil thickness error for strategy A.
Figure 16. Airfoil thickness for strategy B.
-0.260
0
0.2
Thic
knes
s er
ror (
mm
)
0.4
10040
0.6
80
Height (mm)
0.8
60
Length (mm)
20 40200 0
0
0.1
0.2
0.3
0.4
0.5
0.6strategy Areference
-0.260
0
0.2
Thic
knes
s er
ror (
mm
)
0.4
10040
0.6
80
Height (mm)
0.8
60
Length (mm)
20 40200 0
0
0.1
0.2
0.3
0.4
0.5
0.6strategy Breference
Figure 15. Airfoil thickness error for strategy A.
Appl. Sci. 2020, 10, x FOR PEER REVIEW 11 of 13
deflection increases where tool–workpiece relative displacements are higher, i.e., at the trailing and leading edges and at the tip, producing an increased thickness. Moreover, in Figure 14on the right, errors on both sides are shown, highlighting similar errors between the two strategies and the same level of error on both sides, as predicted.
The thickness error along the entire surface is presented in Figures 15 and 16. The results present the thickness error trend, higher at the two edges and increasing the height. It is interesting to point out that the thickness error is very similar between the two strategies. This could be explained by the fact that strategy A allowed us to avoid chatter vibrations at the price of working at the resonance of the system, thus increasing forced vibrations and causing thickness errors. Strategy B was selected to reduce forced vibrations, but chatter vibration occurred, leading to a significant increase in cutting forces, which cancelled the optimized speed selection benefits. Moreover, static deflection is not affected by the two strategies and could be the main factor responsible for the deviations that increase at the leading and trailing edge because of structural stiffness reduction. The main difference between the two thickness error maps is roughness: strategy A produced a smoother surface, while strategy B presents higher waviness and roughness caused by the occurrence of chatter.
Figure 15. Airfoil thickness error for strategy A.
Figure 16. Airfoil thickness for strategy B.
-0.260
0
0.2
Thic
knes
s er
ror (
mm
)
0.4
10040
0.6
80
Height (mm)
0.8
60
Length (mm)
20 40200 0
0
0.1
0.2
0.3
0.4
0.5
0.6strategy Areference
-0.260
0
0.2
Thic
knes
s er
ror (
mm
)
0.4
10040
0.6
80
Height (mm)
0.8
60
Length (mm)
20 40200 0
0
0.1
0.2
0.3
0.4
0.5
0.6strategy Breference
Figure 16. Airfoil thickness for strategy B.
7. Conclusions
In this paper, a novel integrated approach to predict the changing dynamic behavior of a thinwalled component is presented. The thin-walled test case, a NACA 9403 airfoil, was initially createdusing WAAM, an arising technology to produce low buy-to-fly ratio components. The developedsystem was able to correctly simulate both the material removal process on an initial stock and its
Appl. Sci. 2020, 10, 7575 12 of 13
dynamic behavior during the machining cycle. The results show that the proposed method can beproficiently applied for AM products thanks to the automatic FE mesh generation and updating.
Based on the simulation results, two different optimization strategies were applied, confirmingthe importance of the right spindle speed selection. In this work, milling of an additive manufacturedcomponent has been optimized based only on the dynamic behavior of the thin-walled part. In thefuture, a more comprehensive approach, including cutting force and tool wear, could be implemented.In that case, the process parameters of the additive manufacturing step should be taken into accountsince they affect the proprieties of the part [26]. The idea underpinning this work is investigatinghybrid additive-subtractive manufacturing; in this work, the approach was applied using to twoseparated machines, and in the future the combination of milling and WAAM on the same machinewill be investigated.
Author Contributions: Methodology and conceptualization, N.G. and A.S., investigation and validation, N.G. andG.V.; data curation and writing—original draft preparation, N.G.; supervision, A.S. and G.C.; project administrationand funding acquisition, G.C. All authors have read and agreed to the published version of the manuscript.
Funding: This research received no external funding.
Acknowledgments: The authors would like to thank Machine Tool Technology Research Foundation (MTTRF)and its supporters for the loaned machine tool (Mori Seiki NMV1500DCG) and CAM Software (ESPRIT), bothused to carry out this research activity.
Conflicts of Interest: The authors declare no conflict of interest. The funders had no role in the design of thestudy; in the collection, analyses, or interpretation of data; in the writing of the manuscript, or in the decision topublish the results.
References
1. Oliveira, D.; Calleja, A.; López de Lacalle, L.N.; Campa, F.; Lamikiz, A. Flank milling of Complex Surface. InMachining of Complex Sculptured Surfaces; Davim, J.P., Ed.; Springer: London, UK, 2012.
2. Frazier, W.E. Metal Additive Manufacturing: A Review. J. Mater. Eng. Perform. 2014, 23, 1917–1928.[CrossRef]
3. Sing, S.L.; Yeong, W.Y. Laser powder bed fusion for metal additive manufacturing: Perspectives on recentdevelopments. Virtual Phys. Prototyp. 2020, 15, 359–370. [CrossRef]
4. Guo, C.; He, S.; Yue, H.; Li, Q.; Hao, G. Prediction modelling and process optimization for forming multi-layercladding structures with laser directed energy deposition. Opt. Laser Technol. 2021, 134, 106607, in press.[CrossRef]
5. Montevecchi, F.; Venturini, G.; Grossi, N.; Scippa, A.; Campatelli, G. Heat accumulation prevention inWire-Arc-Additive-Manufacturing using air jet impingement. Manuf. Lett. 2018, 17, 14–18. [CrossRef]
6. Wächter, M.; Leicher, M.; Hupka, M.; Leistner, C.; Masendorf, L.; Treutler, K.; Kamper, S.; Esderts, A.;Wesling, V.; Hartmann, S. Monotonic and Fatigue Properties of Steel Material Manufactured by Wire ArcAdditive Manufacturing. Appl. Sci. 2020, 10, 5238. [CrossRef]
7. Li, F.; Chen, S.; Shi, J.; Tian, H.; Zhao, Y. Evaluation and Optimization of a Hybrid Manufacturing ProcessCombining Wire Arc Additive Manufacturing with Milling for the Fabrication of Stiffened Panels. Appl. Sci.2017, 7, 1233. [CrossRef]
8. Flynn, J.M.; Shokrani, A.; Newman, S.T.; Dhokia, V. Hybrid additive and subtractive machine tools—Researchand industrial developments. Int. J. Mach. Tools Manuf. 2016, 101, 79–101. [CrossRef]
9. Puma-Araujo, S.D.; Olvera-Trejo, D.; Martínez-Romero, O.; Urbikain, G.; Elías-Zúñiga, A.; López deLacalle, L.N. Semi-Active Magnetorheological Damper Device for Chatter Mitigation during Milling ofThin-Floor Components. Appl. Sci. 2020, 10, 5313. [CrossRef]
10. Grossi, N.; Scippa, A.; Croppi, L.; Morelli, L.; Campatelli, G. Adaptive toolpath for 3-axis milling of thinwalled parts. MM Sci. J. 2019, 2019, 3378–3385. [CrossRef]
11. Ning, H.; Zhigang, W.; Chengyu, J.; Bing, Z. Finite element method analysis and control stratagem formachining deformation of thin-walled components. J. Mater. Process. Technol. 2003, 139, 332–336. [CrossRef]

Appl. Sci. 2020, 10, 7575 13 of 13
12. Lin, Y.-C.; Wu, K.-D.; Shih, W.-C.; Hsu, P.-K.; Hung, J.-P. Prediction of Surface Roughness Based on CuttingParameters and Machining Vibration in End Milling Using Regression Method and Artificial Neural Network.Appl. Sci. 2020, 10, 3941. [CrossRef]
13. Grossi, N.; Scippa, A.; Sallese, L.; Montevecchi, F.; Campatelli, G. On the generation of chatter marks inperipheral milling: A spectral interpretation. Int. J. Mach. Tools Manuf. 2018, 133, 31–46. [CrossRef]
14. Arnaud, L.; Gonzalo, O.; Seguy, S.; Jauregi, H.; Peigné, G. Simulation of low rigidity part machining appliedto thin-walled structures. Int. J. Adv. Manuf. Technol. 2011, 54, 479–488. [CrossRef]
15. Scippa, A.; Grossi, N.; Campatelli, G. FEM based Cutting Velocity Selection for Thin Walled Part Machining.Procedia CIRP 2014, 14, 287–292. [CrossRef]
16. Thevenot, V.; Arnaud, L.; Dessein, G.; Cazenave-Larroche, G. Influence of Material Removal on the DynamicBehavior of Thin-walled strucutres in Peripheral Milling. Mach. Sci. Technol. 2006, 10, 275–287. [CrossRef]
17. Tuysuz, O.; Altintas, Y. Frequency Domain Prediction of Varying Thin-Walled Workpiece Dynamics inMachining. J. Manuf. Sci. Eng. 2017, 139, 071013. [CrossRef]
18. Zienkiewicz, O.C.; Taylor, R.L. The Finite Element Method-The Basis, 5th ed.; Butterworth-Heinemann: Woburn,UK, 2000.
19. Ding, D.; Pan, Z.; Cuiuri, D.; Li, H. Wire-feed additive manufacturing of metal components: Technologies,developments and future interests. Int. J. Adv. Manuf. Technol. 2015, 81, 465–481. [CrossRef]
20. Campatelli, G.; Campanella, D.; Barcellona, A.; Fratini, L.; Grossi, N.; Ingarao, G. Microstructural, mechanicaland energy demand characterization of alternative WAAM techniques for Al-alloy parts production. CIRP J.Manuf. Sci. Technol. 2020, in press. [CrossRef]
21. Montevecchi, F.; Venturini, G.; Scippa, A.; Campatelli, G. Finite Element Modelling ofWire-arc-additive-manufacturing Process. Procedia CIRP 2016, 55, 109–114. [CrossRef]
22. Montevecchi, F.; Grossi, N.; Takagi, H.; Scippa, A.; Sasahara, H.; Campatelli, G. Cutting forces analysis inadditive manufactured AISI H13 alloy. Procedia CIRP 2016, 46, 476–479. [CrossRef]
23. Bolsunovskiy, S.; Vermel, V.; Gubanov, G.; Kacharava, I.; Kudryashov, A. Thin-Walled Part Machining ProcessParameters Optimization based on Finite-Element Modeling of Workpiece Vibrations. Procedia CIRP 2013, 8,276–280. [CrossRef]
24. Montevecchi, F.; Grossi, N.; Scippa, A.; Campatelli, G. Improved RCSA technique for efficient tool-tipdynamics prediction. Precis. Eng. 2016, 44, 152–162. [CrossRef]
25. Grossi, N. Accurate and fast measurement of specific cutting force coefficients changing with spindle speed.Int. J. Precis. Eng. Manuf. 2017, 18, 1173–1180. [CrossRef]
26. Tan, J.H.K.; Sing, S.L.; Yeong, W.Y. Microstructure modelling for metallic additive manufacturing: A review.Virtual Psysical Prototyp. 2020, 15, 87–105. [CrossRef]
Publisher’s Note: MDPI stays neutral with regard to jurisdictional claims in published maps and institutionalaffiliations.
© 2020 by the authors. Licensee MDPI, Basel, Switzerland. This article is an open accessarticle distributed under the terms and conditions of the Creative Commons Attribution(CC BY) license (http://creativecommons.org/licenses/by/4.0/).