process improvement calculations and tools - index /...
TRANSCRIPT

Process Improvement Calculations & Tools
Quick Reference
Last updated: 12/14/2010 1 of 12
Process Improvement Calculations & Tools
Steps to Lean Improvement 1. Identify the customers and determine how the process provides value to them 2. Reduce obvious waste with layout, better information-sharing, smaller batches, 5S, visual management, &
scheduling 3. Separate repetitive processes from unique processes and find ways to make unique processes repetitive 4. Map the process flow to determine value-added and non-value-added activities 5. Identify bottlenecks and causes of variability 6. Focus Kaizen projects on processes that cause bottlenecks and variability 7. Identify opportunities for cross-training to improve process performance
Hierarchy of Process Discovery This is the evolution of detail of analysis:
1. SIPOC—to provide high-level scoping of the process 2. Swimlane Diagram—to document process steps, and illustrate wastes of hand-offs 3. Value Stream Map—to identify product, process, and information flows with value-add percentage 4. Process Map—to illustrate key inputs needed for detailed problem-solving
Name Description When to Use
Process Discovery
SIPOC A diagram that provides high-level scoping of the process.
Suppliers—provide inputs to the process Input—required resources Process—transforms inputs to outputs Outputs—delivered products or services. Customers—stakeholders; identify what the process provides and delivers to the customer.
Example:
Start with this diagram to determine the process scope and stakeholders. Reference and update throughout the process maturity states.

Information and Technology Services Process Improvement Calculations & Tools
Quick Reference
2 of 12 Last updated: 12/14/2010
Swimlane Diagram Create a flow chart of activities that includes roles. Example:
Use during process discovery to understand how things currently operate. It provides the foundation for the future state.
Value Stream Mapping A technique of diagramming the flow of information and materials representing a process to provide a product or service to identify product, process, and information flows with value-add percentage. [run on sentence; break up sentence] Use to visually illustrate waste and apply costs to the process. Example:
Start with this diagram to determine flow. Reference and update throughout the process maturity states.
Process Mapping The activity of representing processes so that the current process may be analyzed and improved. Example:
Develop a process map to capture the current state. Reference throughout the process maturity states.

Information and Technology Services Process Improvement Calculations & Tools
Quick Reference
Last updated: 12/14/2010 3 of 12
Selecting Process Metrics Select the metrics that best help visualize a process and address the specific issues of interest.
• While documenting the current state, quantify cost, service, and quality. • Highlight areas of value, waste, and bottlenecks. • Consider metrics that are relevant to the specific business process. • Consider establishing simple, quick ways to collect performance data on an ongoing basis.
Operational Measures Customer Priorities Financial Measures • Flow time • Throughput • Inventory • Process cost • Quality • Utilization
• Price • Quality • Time • Variety
• Profits (absolute) • ROI, ROA (relative) • Cash flow (survival)
Name Description When to Use
Selected Process Improvement Tools—There are many tools and measurements you may use to analyze process performance and identify issues. This is a selected list of tools and calculations we are likely to use. 5S Method for organizing the workplace
1. Sort—get rid of anything unnecessary
2. Set-in-Order—make important items visible and self-explanatory
3. Shine—clean the work space and equipment
4. Standardize—establish guidelines for sorting, ordering, and shining.
5. Sustain—adhere to these rules. Develop an audit system or rating system if needed.
This is one of the first steps of continuous improvement. It is useful from initial process improvement throughout the life of a process.
5 Whys Ask “Why?” until you get to the root cause. Five iterations of questioning usually achieve identification of the root cause. This could be conducted by one person who is knowledgeable about the process or among a team.
Use during the early stages of process maturity.
Analysis of Variance (ANOVA)
A statistical test to determine if the means of several groups are equal. Use to analyze variability.
Available Time
The amount of time an organization is open for business and able to process the work. Remove time dedicated to other processes and break time.
Collect during process discovery. This is a common value stream metric.
Information and Technology Services Process Improvement Calculations & Tools
Quick Reference
4 of 12 Last updated: 12/14/2010
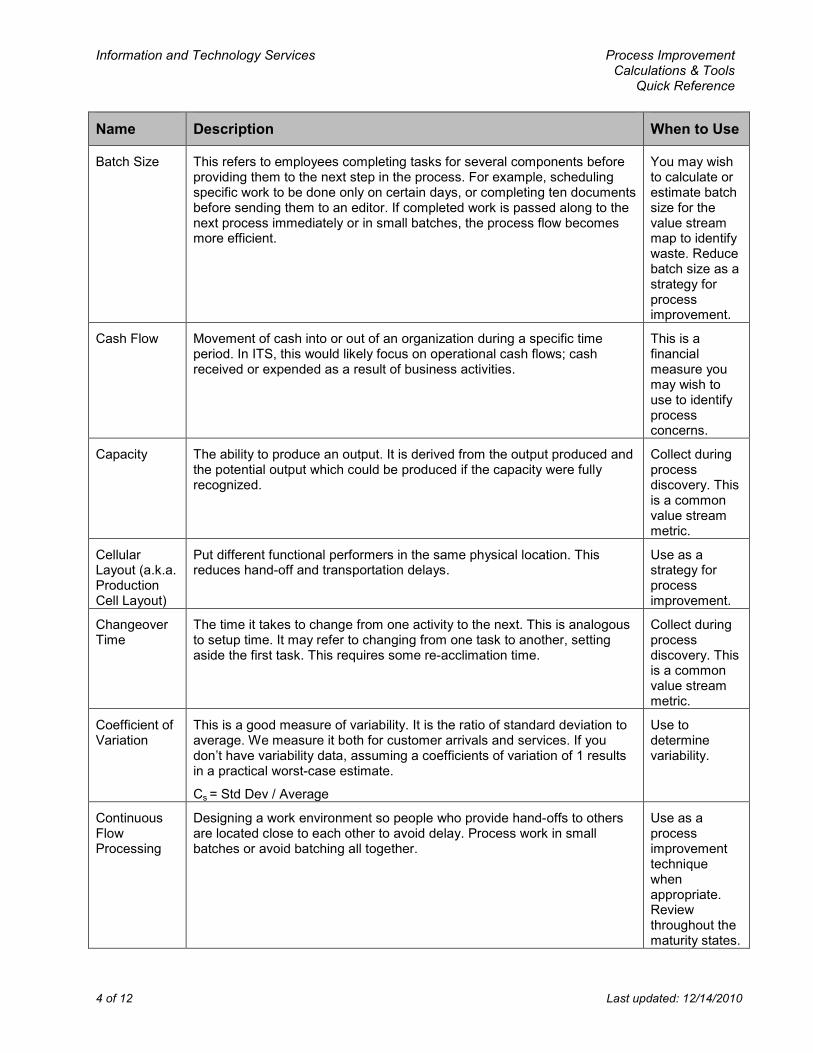
Name Description When to Use
Batch Size This refers to employees completing tasks for several components before providing them to the next step in the process. For example, scheduling specific work to be done only on certain days, or completing ten documents before sending them to an editor. If completed work is passed along to the next process immediately or in small batches, the process flow becomes more efficient.
You may wish to calculate or estimate batch size for the value stream map to identify waste. Reduce batch size as a strategy for process improvement.
Cash Flow Movement of cash into or out of an organization during a specific time period. In ITS, this would likely focus on operational cash flows; cash received or expended as a result of business activities.
This is a financial measure you may wish to use to identify process concerns.
Capacity The ability to produce an output. It is derived from the output produced and the potential output which could be produced if the capacity were fully recognized.
Collect during process discovery. This is a common value stream metric.
Cellular Layout (a.k.a. Production Cell Layout)
Put different functional performers in the same physical location. This reduces hand-off and transportation delays.
Use as a strategy for process improvement.
Changeover Time
The time it takes to change from one activity to the next. This is analogous to setup time. It may refer to changing from one task to another, setting aside the first task. This requires some re-acclimation time.
Collect during process discovery. This is a common value stream metric.
Coefficient of Variation
This is a good measure of variability. It is the ratio of standard deviation to average. We measure it both for customer arrivals and services. If you don’t have variability data, assuming a coefficients of variation of 1 results in a practical worst-case estimate.
Cs = Std Dev / Average
Use to determine variability.
Continuous Flow Processing
Designing a work environment so people who provide hand-offs to others are located close to each other to avoid delay. Process work in small batches or avoid batching all together.
Use as a process improvement technique when appropriate. Review throughout the maturity states.

Information and Technology Services Process Improvement Calculations & Tools
Quick Reference
Last updated: 12/14/2010 5 of 12
Name Description When to Use
Defects Per Million Opportunities (DPMO)
Identify specific opportunities for defects in order to eliminate defects. In an office environment, this can apply to deliverables that require correction or rework.
DPMO=Total Number of Defects/Total Number of Opportunities for a Defect, then multiply by 1 million.
Use this to measure process performance.
Demand Rate The number of transactions or outputs per a specified time period. For example, 500 items per year. You may also provide this as an average on a value stream map.
Demand Rate = 1 / Takt Time
Collect during process discovery. Re-evaluate throughout the process lifecycle.
First Pass Yield (FPY)
Multiply the individual quality measures for each process. This represents the likelihood that a deliverable will go through all process steps without a quality-related problem.
Collect during process discovery. This is a common value stream metric.
Flow Time It is the sum of all process time. Collect the actual time it takes a performer or process to complete an activity, and total the activity times for the critical path.
Use to determine the effects of variation and operational performance.
Gantt Charts A bar chart that illustrates a project schedule.
Use to illustrate time performance.
Information Technology Used
This describes the software tools needed to process information at each process box in a value stream map. Record this in a lower corner of the process box.
Collect during process discovery. This is a common value stream metric.
Inventory In an office environment, this can refer to queues of information, paperwork, electronic files, or project work in-development. On a financial report, you can use Accounts Receivable to indicate inventory. In inventory was sold, you have to look at actual revenue rather than Cost Of Goods Sold.
Inventory = Throughput x Flow Time
Inventory Turns = Throughput / Inventory
Collect during process discovery. This is a common value stream metric.

Information and Technology Services Process Improvement Calculations & Tools
Quick Reference
6 of 12 Last updated: 12/14/2010
Name Description When to Use
Kaizen Events
In the service industry, it refers to activities that continually improve business functions. This is often executed as a meeting with key participants in a particular process to brainstorm improvements.
Use throughout the process maturity states.
Kanban A scheduling system that prescribes what to produce, when, and how much. You may use kanban cards to indicate what supplies to reorder. A kanban card is a physical card that contains product details that can be used to order more materials when needed. Constant awareness of the demand rate is critical to this approach.
Use when implementing a pull system.
Lead Time (L/T)
The amount of time between the completion of one activity and the start of another. It often represents waiting time.
Collect during process discovery. This is a common value stream metric.
Leveling Balancing workload among different employees or over time. This may require cross-training.
Use as a strategy for process improvement.
Multi Vari Represent variability in a visual way with a series of charts. [I don’t recall this one. any opportunity for an example?]
Use during process discovery and redesign.
Number of People
This may represent the number of people who are capable and trained to do the work, or the number of FTEs needed to perform the process.
Collect during process discovery. This is a common value stream metric.
Takt Time Expected rate of demand (customer need). It is the rate of completing work based on customer need.
Takt Time=Effective Working Time per specified time period / Requirement per specified time period
Effective working time refers to the time of availability and resources that can be dedicated to producing the customer requirement. The time period you specify can be whatever is appropriate for that process.
Use when planning the future state.

Information and Technology Services Process Improvement Calculations & Tools
Quick Reference
Last updated: 12/14/2010 7 of 12
Name Description When to Use
Pareto Charts Chart based on Pareto’s Law: 20% of the causes contribute to 80% of the problems. A graphical technique used to quantify problems. Used to identify the “vital few” problems causing the greatest impact, so that correction effort can be focused at these, as opposed to fixing the “trivial many”.
Percent Complete and Accurate (%C&A or %C/A)
This metric reflects the frequency of complete and accurate information received for processing. Calculate this as simple percent of total.
% C&A = (# Complete & Accurate / Total) * 100
Collect during process discovery. This is a common value stream metric.
Pitch The duration of schedule we release to our system. Schedule work in short durations and check status at the end of the scheduled timeframe. Address workflow problems.
Identify during process discovery. Use when planning the future state. Reference and monitor throughout the process maturity stages.
Poka Yoke Mistake-proofing. Example: designing a software screen or field so users cannot enter invalid information.
Use as a strategy for process improvement.
Price Compensation in return for goods or services. This is a measure used to indicate customer priorities.

Information and Technology Services Process Improvement Calculations & Tools
Quick Reference
8 of 12 Last updated: 12/14/2010
Name Description When to Use
Process Cost Total the direct and indirect costs incurred during a process. This is an operational measure that can indicate operational performance and in planning improvements.
Process Time (P/T)
This is a measure of the actual time to complete or process an activity. It is the amount of time required for one person to complete and review an activity or process. This may be presented as a range to indicate variation, along with a description of variation causes.
Collect during process discovery. This is a common value stream metric.
Profits Revenue that exceeds input costs:
Profit = Revenue - Cost
Use as a financial metric where these measures are relevant process improvement drivers.
Project Tracking Center
A board in a visible area close to the work that is used to record progress. Include metrics such as lead time, complete and accurate results, rework, time, etc.
Implement as a process improvement strategy, and review throughout the process.
Pull System A system of producing outputs based on customer requests. Execute work according to first-in/first-out prioritization.
Use when there is a high degree of demand variability. Implement to reduce inventory.
Push System Produce according to forecasting needs. This may lead to large inventories. In an office environment, this would refer to scheduling work according to due dates, monetary value, or some specific criteria.
Use when demand is fairly predictable and production variability is low.
Quality A measure of correctness. Quality may have some objective measures, such as delivering a product or service accurately according to specifications. There may also be subjective measures due to comparison to other products and services. Compare outputs or services to specification guidelines, and survey customers or end users as appropriate.
This is an operational measure that can be used throughout the process.

Information and Technology Services Process Improvement Calculations & Tools
Quick Reference
Last updated: 12/14/2010 9 of 12
Name Description When to Use
Reliability The percentage of time that equipment is available when needed. For example, the percentage of time that the network is available or the computer is functioning properly.
Collect during process discovery. This is a common value stream metric.
Return on Assets (ROA)
A measure of how profitable an organization is in relation to total assets.
ROA = Net Income / Total Assets
Use as a financial measure to determine value.
Return on Investment (ROI)
The ratio of gain or loss relative to the investment, usually expressed as a percentage.
ROI = (gains – costs) /costs x 100
Use as a financial measure to determine value.
Standard Deviation
A measure of variability. It indicates the range variation from the average.
Calculate the mean, then the difference of each data point from the mean, then compute the average of the difference values and calculate the square root.
Use to determine variability.
Standardized Work
Develop job aids and support materials to establish standard procedures Use throughout the evolution through process maturity.
Throughput The rate of good products or services produced per unit time that the customer is willing to invest time, money, or resources to obtain.
Throughput = Inventory / Flow Time
Collect during process discovery.
Time Collect time measurements for value-added time as well as queue time for activities within a process.
This is an operational measure that can indicate areas to target for improvement.
Time in Queue (CTq)
CTq depends on:
Cd=Coefficient of variation of customer arrivals
Cs=Coefficient of variation of service
u=Utilization of the servers
m=Number of servers
ts=Average service time
CTq = approx. V x U x T
CTq = approx. ((Cd2 + Cs
2)/2) (u�2(m+1)−1m(1−u)
) ts
Determine wait time.

Information and Technology Services Process Improvement Calculations & Tools
Quick Reference
10 of 12 Last updated: 12/14/2010
Name Description When to Use
Trend Charts A chart that reveals performance trends as you can draw a line between two or more pivot points.
Illustrates performance over time. Use during process discovery and evaluation.
Utilization The percentage of time that the process is busy doing value-added work. Processes with high utilization indicate bottlenecks.
Utilization = Demand Rate / Capacity
Collect during process discovery. This is a common value stream metric.
Value-Added Time
Process time that is spent on value-added activities. Collect during process discovery. This is a common value stream metric.
Variability Utilization Time (VUT)
This is a tool to relate capacity, variability, and inventory or delays and understand waiting times, capacity pooling and investment decisions. Utilization Formula=Rate of demand/Rate of service Utilization = Rd / Rs
Use to determine variability.
Variety This refers to customer priorities and demands. The more variety in demand, the more variety in the process. This information can enable educated decisions for process improvement, such as limiting variety, allocating resources to accommodate the customer needs, or establishing a pull system.
This is a potential customer priority measure. Use this information to determine process needs.
Visual Control Establish visual signals in the workplace to control an activity or process. Signals can take many forms:
• Outlines for locations of tools or equipment
• Status indicator lights
• Display boards with metrics
• Direction indicators
Implement during the early stages of process maturity. Use throughout a process lifecycle.
Voice of the Customer (VOC)
Capture customer’s needs, and preferences. Organize and prioritize these to guide work production. You can obtain this information by conducting individual interviews, focus groups, surveys, etc.
Use throughout the process lifecycle.

Information and Technology Services Process Improvement Calculations & Tools
Quick Reference
Last updated: 12/14/2010 11 of 12
Name Description When to Use
X/Y Diagram (a.k.a. Scatter chart)
A chart that compares pairs of values for two separate measurements.
Use as a visual representation of variables to identify performance issues.
Y = f (X) Calculate expected yield. Outputs are a function of the inputs.
Y = f (X1, X2, …Xn)
Use during process discovery.
Conclusions from Data Analysis • If throughput is less than the demand rate, all customer demand is not being met! • The capacity of the process is defined by the rate of the process with the smallest capacity. • To measure variability, you need to know average and standard deviation. • Coefficient of Variation is a good measure of variability. It is the ratio of standard deviation to average.
We measure it both for customer arrivals and services. So Cs=Std Dev/Average • Systems with variability must be buffered by:
o Inventory o Capacity o Time
• If you can’t reduce variability, you’ll pay in high inventory, under-utilized capacity, or reduced service
Identifying Process Improvements: • Identify all process improvements that will be necessary to implement the future state • Create a list of Kaizen opportunities and annotate the map with them (Kaizen bursts) • Prioritize the process improvement opportunities • Implement strategies that have immediate impact first • Track significant efforts as projects • Consider Six Sigma strategies for projects with unknown solutions and root cause unidentified
Time and Little’s Law Inventory = Throughput x Flow Time Inventory Turns = Throughput / Inventory
Information and Technology Services Process Improvement Calculations & Tools
Quick Reference
12 of 12 Last updated: 12/14/2010
Future State Questions • What is the customer need and how are we doing in serving this need? • Which steps create value and which are waste? • How can we maintain work flow with fewer interruptions/handoffs? • How can we manage prioritization and control interruptions and handoffs? • How can a process team balance the work load and/or different activities? • What pitch would be most effective? (duration of schedule) • What process improvements and reviews will be necessary?
References • Metrics for IT Service Management—A book by the IT Service Management Forum that considers the
design and implementation of metrics in service organizations. • Duenyas & Lynch, 2008, Lean Office Certificate Program course materials, The University of
Michigan • Keyte & Locher, 2004, The Complete Lean Enterprise, New York, NY • http://www.wikipedia.org/