process evaluation of the north st. louis county drug...
TRANSCRIPT

Process Evaluation of the North St. Louis County Drug Court
by
Robert R. Weidner, Ph.D. (Principal Investigator)
& Kathryn M. Zafft, B.A.
University of Minnesota Duluth
April 2009 This research was made possible by a grant from the Center for Community & Regional Research at the University of Minnesota Duluth and funding from Arrowhead Regional Corrections. Views expressed in this report are those of the authors and do not necessarily reflect the views of the Center for Community & Regional Research, the University of Minnesota Duluth or Arrowhead Regional Corrections.

~i~
ACKNOWLEDGEMENTS
We would like to thank current and past members of the North St. Louis County Drug
Court team – including those at Arrowhead Regional Corrections, the Sixth Judicial
District, and treatment providers – for their cooperation in this research project. Special
thanks to Kelly Emmons, ARC research analyst, for her assistance with retrieving data and
answering technical questions. We would also like to thank Nicole Gosling and Dave
Swenson for their patience and cooperation. This project also benefitted from Erin
Wojciechowski’s careful analysis of the participant survey data. Finally, we wish to thank
Arrowhead Regional Corrections and the University of Minnesota Duluth’s Center for
Community and Regional Research for their financial support.

~ii~
~iii~
TABLE OF CONTENTS
Acknowledgements ……………………………………..…………………………... iList of Tables & Figures ……………………………..……………………………... ivExecutive Summary with Recommendations ……...……………………………… vIntroduction …………………………………………………………………………. 1 The North St. Louis County Drug Court …………………………………….. 1 This Research ……………………………………………………………….... 3Drug Court Participant Characteristics …..………………………………………. 5 Demographic Characteristics ………………………………………………… 5 Instant Charge, Criminal History & Risk ……………………………………. 7 Substance Problems ………………………………… 9Drug Court Process: Treatment, Supervision, Rewards & Sanctions ………..…. 11 Treatment – Substance Abuse & Cognitive Skills …………………………… 11 Level of Supervision: Probation Contacts, Court Appearances & Drug Tests 12 Probation Officer Contacts ………………………………………………… 13 Court Appearances ……………………………………………………….… 14 Drug Tests ………………………………………………………………..… 14 Rewards and Sanctions …………………………………………………….… 15Participants’ Progress through the Program & Court Caseload Volume ...…….. 19 Screening Participants into the Court ……………………………………...… 19 Court Caseload Volume ……………………………………………………… 20 Participants’ Progress through the Court …………………...………………... 21 Relationship between Stay Type & Likelihood of Termination ……………... 23 Intermediate Outcomes – Examination of Drug Court
Graduates……………………………………………..………….…………… 24Drug Court Participants’ Attitudes Toward the Court ………………………….. 25 Differences between the Sexes ………………………………………………. 30Appendix: Drug Court Participants Relative to an Historical Comparison Group ……..…………………………………………………………………………. 31

~iv~
LIST OF TABLES & FIGURES
Table 1. Demographic Characteristics of Participants ……………………………... 6Figure 1. Type of Drug Offense …………………………………………………….. 7Figure 2. Felony Level of Instant Offense ………………………………………….. 8Table 2. Criminal History & Risk of Participants ………………………………….. 8
Figure 3. LSI-R Risk Classification of Drug Court Participants ……………………. 9Table 3. Substance Problems of Participants ………………………………………. 10Table 4. Drug Court Treatment Information ……………………………………….. 11Table 5. Prescribed & Observed Number of Weekly Probation Contacts, by Phase 13Table 6. Prescribed & Observed Frequency of Drug Testing, by Phase …………... 14
Table 7a. Distribution of Types of Sanctions ……………………………………….. 16Table 7b. Types of Sanctioned Behavior ……………………………………………. 16
Table 8. Average Length of Time to Screen Participants into Drug Court ………... 20Figure 4. Status of Drug Court Participants as of March 2008 ……………………... 21Table 9. Average Number of Days in Each Phase of Drug Court …………………. 22
Table 10. Mean LSI-R Scores for Drug Court Graduates (N=3) ……………………. 24Figure 5. Respondents’ Overall Perceptions of Drug Court …………...…………… 25Figure 6. Respondents’ Overall Perceptions of Drug Court, by Phase ……………... 26Figure 7. Respondents’ Perceptions of Drug Court Judges & Probation Officers ….. 27Figure 8. Percentage of Respondents Indicating a Feature of the Court was Helpful.. 28Figure 9. Percentage of Respondents Indicating a Feature of the Court was Helpful,
by Phase…………………………………………………………………… 29Table A1. Selected Demographic Characteristics: Drug Court Participants vs.
Historical Comparison Group …………………………………………….. 31Table A2. Criminal History & Risk: Drug Court Participants vs. Historical
Comparison Group ………………………………………………………... 32Table A3. Substance Abuse & Charge Information: Drug Court Participants vs.
Historical Comparison Group …………………………………………….. 33

~v~
EXECUTIVE SUMMARY WITH RECOMMENDATIONS
This executive summary offers a synopsis of the major findings from a process
evaluation of the North St. Louis County Drug Court for the first 16 months of its
operation. Most of the findings are based on analyses of all 43 individuals who made at
least one appearance in the drug court during the 16-month period from its inception in
December 2006, through March 2008. This report addresses fundamental issues pertaining
to the Court’s caseload and operation, including:
A profile of drug court participants – in terms of their substance problems, charge that led to their drug court referral, criminal history and risk;
The court’s efficacy in linking participants with treatment and its level of supervision of participants;
Whether participants are screened into the court in a timely fashion, and progress through the three phases of the program in accordance with the drug court’s protocol; and
Drug court participants’ attitudes toward the court, based on findings from a survey.
At the outset of this report, it is important to emphasize that the North St. Louis County
Drug Court is too new to address outcome-related questions (e.g., Are drug court graduates
continuing to abstain from substance use and avoiding contact with the criminal justice
system?). While passage of time is necessary to determine whether the court has lasting
effects on its participants, the findings presented herein could serve as the foundation for
an eventual outcome evaluation in the future.
We now turn to a discussion of the major findings from this research. We present
the findings by posing and answering key research questions. Where applicable, we make
recommendations that are informed by the research findings.
What are the characteristics of drug court participants, in terms of demographic factors, their criminal history and risk, and their instant charge and substance-related issues?
The typical drug court participant was a 31-year-old white male with a poor work history, although females comprised a substantial proportion (42%) of the court’s caseload. While only 14% of participants were racial minorities, the sample of drug court participants was more racially diverse than an historical comparison group of potentially drug court-eligible cases, which was 89% white.

~vi~
Almost half of the sample (46%) did not have a valid driver’s license, and 18 of these 20 individuals were from outside of Virginia, as far as 52 miles away. We recommend that the drug court team consider ways to mitigate long-distance participants’ transportation issues.
Regarding criminal history, participants averaged 2.5 prior adult convictions, and
46% of the sample had been incarcerated in the past. The typical participant was classified as a moderate risk, based on his LSI-R score (mean = 27). These statistics are comparable to those of the historical comparison group, indicating that low-risk or otherwise “easy” cases were not being selectively targeted for drug court.
Regarding substance use issues, most participants (93%) were classified as
substance dependent, while the balance were classified as abusing. The majority of participants (53%) were charged with an offense involving methamphetamine; marijuana and prescription drugs were the next largest drug categories (14% each). Meth was also the substance that was most likely mentioned (44%) as one’s “problem” drug in the LSI-R; marijuana (26%) was second. These statistics are similar to those of the historical comparison group.
What type of treatment do drug court participants receive?
The vast majority of participants (93%) received residential treatment, outpatient treatment, or both. Most successfully completed the treatment program in which they were enrolled. While the median number of days in outpatient drug treatment was 110.5, the median time in residential treatment was only 28 days. We recognize that the relatively short duration of inpatient treatment might be the product of fiscal necessity (i.e., insurance may cover only a month’s worth of treatment). However, in light of research indicating that at least 90 days of treatment is more likely to be effective: We recommend that the duration of residential treatment be increased to at least 90 days, if possible.
What level of supervision (i.e., drug tests, court appearances and probation contacts) do drug court participants receive?
Except during Phase 1, the number of drug tests recorded in the data exceeded the drug court’s protocols. There is the distinct possibility that this lower number observed for Phase 1 is the product of an undercount of drug tests that participants received while in treatment (which always occurred in Phase 1).
Participants were attending court reviews at rates consistent with the protocol (e.g.,
weekly during Phase 1). However, observed probation contacts in Phases 1 and 2 were slightly lower than prescribed in the protocol. We recommend that steps be taken to increase slightly the frequency of probation contacts in the earlier phases of the court. Alternatively, if there is consensus among the drug court team that the observed frequencies of probation officer contacts are adequate, then the court’s protocol should be revised accordingly.

~vii~
Are participants progressing through the drug court according to court protocol?
All indications are that participants are completing each of the court’s three phases, and graduating, in a manner that is consistent with the court’s protocol.
What proportion of the caseload is active, graduated, terminated?
As of the end of this research’s observation period (March 2008), 67% (29) of the sample was active (currently in one of the court’s three phases), three had graduated, and 26% (11) had been terminated. While there was no apparent relationship between the severity of a participant’s substance problem and the likelihood of program success or failure, analyses revealed a markedly lower rate of termination among those receiving a stay of adjudication compared to those receiving a different type of suspended sentence. In light of the apparent relationship between stay type and likelihood of termination: We recommend that individuals referred to the drug court receive stays of adjudication (which offer the greatest incentive to participants) whenever possible.
What are drug court participants’ attitudes toward the court and its key actors, including judges and probation officers?
Overall, respondents had positive perceptions of the drug court and its actors, including judges and probation officers. Moreover, there is a positive relationship between phase and positive reactions to the court, suggesting that drug court participants tend to “buy in” to the program over time. For example, respondents in successive phases tended to more strongly agree with the statement “I have been personally helped through drug court.”
There were some key differences between the sexes in perceptions of the court.
Males were much more likely than females to report that home visits were helpful (55% versus 25%), office visits were helpful (55% versus 0%), incentives were helpful (55% versus 25%) and that treatment was helpful (64% versus 13%). We recommend that the drug court team explore what might be explaining these gender differences in attitudes toward the court.

~viii~

~1~
INTRODUCTION
This report presents findings from a process evaluation of the North St. Louis
County Drug Court for the first 16 months of its operation, from December 2006, through
March 2008. It is based on data gathered by researchers at the University of Minnesota
Duluth, with the assistance of drug court staff. It addresses whether the court is operating
as intended. The presentation and discussion of findings are divided into four sections,
each of which addresses fundamental questions pertaining to the Court’s operation. The
first section offers a profile of drug court participants – in terms of their substance
problems, charge that led to their drug court referral, criminal history and risk – and
addresses the degree to which participants’ characteristics fit the target-population criteria
set forth by the court’s planners. The second section answers questions pertaining to
participants’ experience with the court, including: its efficacy in linking participants with
treatment, observed level of supervision (i.e., probation contacts, court appearances and
drug tests), and the court’s use of rewards and sanctions. The third section addresses
whether participants are screened into the court in a timely fashion, and progress through
the three phases of the program in accordance with the drug court’s protocol. This section
includes a brief profile of the three individuals who graduated from the program during
this study’s observation period. Finally, the fourth section of this report presents findings
from a survey administered to drug court participants to learn their attitudes toward the
court.
The North St. Louis County Drug Court
The North St. Louis County Drug Court is a post-conviction adult drug court
located in Virginia, Minnesota. Its geographic catchment area is Northern St. Louis
County, including the service areas of the Hibbing and Virginia court operations. It is a
collaborative effort of Minnesota’s Sixth Judicial District, the offices of the St. Louis
County Attorney and St. Louis County Public Defender, Arrowhead Regional Corrections,
local treatment professionals and area law enforcement agencies.
As of this writing, the North St. Louis County Drug Court is one of four operational
specialty courts in St. Louis County. Planning for the court began in 2004, and the first
court proceeding was held in December 2006. The stated mission of the North St. Louis County
Drug Court program, according to a court planning document, is “to create a safer community by
reducing repeat offenders and drug-related activities.” Like all drug courts – including the South St.
~2~
Louis County Drug Court in Duluth – the primary goal of the North St. Louis County Drug Court is
to divert from the traditional criminal justice system offenders who are chemically dependent or
abusing drugs into treatment, so that they stop committing crimes and can live sober and productive
lives. This treatment, whether residential or outpatient, is provided by private vendors.
Each participant in the drug court is monitored by the drug court team, which
consists of a judge, probation officers, prosecuting and defense attorneys, treatment staff
and law enforcement officers. The drug court team meets every Thursday before that
week’s court session to review cases in order to make recommendations to the judge.
Drug Court protocols stipulate that the North St. Louis County Drug Court program be
mandatory for fourth- and fifth-degree controlled substance crimes charged on or after
October 1, 2006, for participants who meet the eligibility criteria.1 Initial screening for
acceptance into the program is conducted by probation officers. Factors that disqualify one
from participation in the program include being a non-resident, having a serious and
persistent mental illness, and having a prior conviction for a violent offense.2 Individuals
who pass this initial screening are then interviewed by the designated Rule 253 Assessor, a
member of the drug court team who is employed by the St. Louis County Public Health
and Human Services Department. Those who the assessor determines meets the criteria for
“chemical dependency” or “chemical abuse” are eligible to be admitted into the North St.
Louis County Drug Court program.
The North St. Louis County Drug Court employs a post-conviction model. That is,
participants are required to plead guilty to the felony charge that led to their referral to drug
court, and their sentence is suspended in lieu of their participation in the drug court
program. There are three means of suspending sentences, each with very different
ramifications for those participants who successfully complete the drug court program.
Successful completion of all conditions of a stay of adjudication will result in dismissal of
the felony charge at the end of the stay period, without conviction. Individuals who
successfully complete the drug court program would have no conviction of any kind as a
1 Third-degree controlled substance cases are to be referred to the drug court team and reviewed for acceptance on a case by case basis, with the County Attorney’s office having final veto power on acceptance. 2 For a more detailed description of the drug court program, including a complete list of disqualifying factors, refer to the Drug Court Planning Initiative Policies and Procedures Manual. 3 In Minnesota, offenders are eligible for public funding for substance abuse if they meet the criteria, established by an assessor, for “chemical dependency” or “chemical abuse.” Rule 25 refers to the legislation that authorizes this funding.

~3~
result of the felony charge that led to their referral to drug court. By comparison, “if a stay
of imposition is granted, the imposition … of a prison sentence is delayed to some future
date, provided that until that date the offender comply with conditions established by the
court. If the offender does comply with those conditions until that date, the case is
discharged, and for civil purposes (employment applications, etc.) the offender has a
record of a misdemeanor rather than a felony conviction…. If a stay of execution is
granted, a prison sentence is pronounced, but the execution… is delayed to some future
date, provided that until that date the offender comply with conditions established by the
court. If the offender does comply with those conditions, the case is discharged, but the
offender continues to have a record of a felony conviction.” 4 In the North St. Louis
County Drug Court for this study’s observation period, 24 (55.8%) participants received
stays of adjudication, while five (11.6%) received stays of imposition and 14 (32.6%)
received stays of execution.
The drug court program consists of three phases, where restrictions, judicial
reviews, and drug testing become less frequent from Phase 1 to Phase 3. For example,
whereas in Phase 1 participants are required to appear in court to be reviewed every week,
in Phase 2 the reviews are biweekly, and in Phase 3 they are monthly. The drug court
program requires a minimum of 12 months of documented sobriety in order for a
participant to graduate. Thus, the bare minimum duration in the program is one year, or
365 days. Court planners anticipated that the typical duration for graduates would be 400
days. Upon successful completion of Phase 3 (graduation from the program), participants
remain on probation.
This Research
Most of the findings presented herein were based on analyses of all 43 individuals
who made at least one appearance in the drug court during the 16-month period from its
inception in December 2006, through March 2008. Twenty-three of the 43 cases in this
sample were first docketed in Virginia’s courthouse, while the 20 first appeared at the
Hibbing courthouse (28 miles from Virginia).
This research uses several sources of data, including information from the Court
Services Tracking System (CSTS) database, vendor records of drug tests, weekly drug
4 Information pertaining to this discussion was retrieved March 20, 2009, from the Web site of the Minnesota Sentencing Guidelines Commission: http://www.msgc.state.mn.us/msgc5/faqs.htm

~4~
court team meeting agendas, Level of Supervision Inventory-Revised (LSI-R, an
interview-based risk assessment instrument) scores, and findings from a survey of active
drug court participants. Also, where applicable, it utilizes data from an historical
comparison group.
At the outset of this report, it is important to emphasize that the North St. Louis
County Drug Court is too new to address outcome-related questions (e.g., Are drug court
graduates continuing to abstain from substance use and avoiding contact with the criminal
justice system?). While passage of time is necessary to determine whether the court has
lasting effects on its participants, the findings presented herein could serve as the
foundation for an eventual outcome evaluation in the future.

~5~
DRUG COURT PARTICIPANT CHARACTERISTICS
This report first addresses whether drug court participants fit the target-population
criteria set forth by the court’s planners, in terms of participants’ demographic
characteristics, their criminal history and risk, and their instant charge and substance-
related issues.5
Demographic Characteristics
In regard to demographic characteristics of the court’s caseload, according to the
North St. Louis County Drug Court Planning Initiative Policies and Procedures Manual
(PPM), the court’s planning team anticipated that the typical drug court participant would
be an adult male from North St. Louis County (the Hibbing/Virginia courts service area)
who was unemployed, poorly educated (i.e., had not graduated high school), without a
driver’s license, with financial problems and with possible mental health issues.
Research on adult drug courts indicates that drug court participants are typically
male, unmarried, in their late 20s – early 30s, have a long history of drug use, prior
treatment, and previous arrests, low educational level and poor work history, and have a
need for additional physical and mental health services. Table 1 shows that the court’s
caseload was, in some ways, more diverse than court planners anticipated.
The typical drug court participant was male (58.1% of cases), white (86.0% of
cases), in his early 30’s. That said, females comprised a significant portion of the court’s
caseload – more than two of every five participants. Participants in general also were better
educated than was expected: although 14% did not have a high school diploma, 51.2% did
have a high school or GED degree, and 34.9% were educated beyond high school.
Consistent with planners’ expectations, participants had poor work histories: 55.8% of the
sample were currently and frequently unemployed, and about one third (30.2%) had never
been employed for a full year. More than half of participants had some form of mental
health issue, and almost half (20 of 43) lacked a valid driver’s license.
5 Refer to the appendix for a discussion of how the drug court’s caseload compares – in terms of key demographic, criminal history and risk, charge, and substance variables – to an historical comparison group comprised of cases originating from Hibbing and Virginia that could have been drug court-eligible had the court been in existence.

~6~
Table 1. Demographic Characteristics of Participants
Variable Category N % or Mean
Age 43 30.9 Sex Female 18 41.9% Male 25 58.1% Race White 37 86.0%
Native American 4 9.3% African American 2 4.7%
Education No high school
diploma 6 14.0%
H.S. diploma / GED 22 51.2%
Post high school 15 34.9%
Employment Currently
unemployed 24 55.8%
Frequently
unemployed 24 55.8%
Never employed for full year
13 30.2%
Rely on public social assistance
17 39.5%
Mental health issue
22 51.2%
Valid Driver’s License
20 46.5% City of Residence Virginia 9 20.9% Hibbing 12 27.9% Eveleth 7 16.3% Chisholm 6 14.0% Other 9 20.9%
Eighteen of the 20 participants without a valid driver’s license were from outside of
Virginia, from as far away as Babbitt (45 miles away) and Ely (52 miles). All participants
met the criterion of being residents of Northern St. Louis County; that said, given the
limited transportation options in the rural towns that the court serves, and the fact that
court participants are required to make weekly appearances in the court when in their first
phase, transportation issues pose a potential impediment to successful participation in the
program. Aside from the issue of a valid driver’s license, an out-of-town participant needs
access to a reliable automobile, and to be capable of paying for travel-related expenses,

both monetary (i.e., for gasoline) and in terms of time. In response to a survey question
soliciting participants’ views on what they liked least about the drug court, one participant
wrote: “Paying for gas – lost my license and trying to get here. Trying to work around this
insane schedule.” The wide geographic distribution of participants also makes their
supervision challenging for their probation officers. We recommend that the drug court
team consider ways to mitigate long-distance participants’ transportation issues.
Instant Charge, Criminal History & Risk
The PPM prescribes that drug court participants be charged with a non-violent
third-6, fourth-, or fifth-degree offense that does not entail sale for profit; those charged
with gross misdemeanors and weapons offenses are ineligible, as are those with a prior
felony conviction for a crime of violence.
Figures 1 and 2 illustrate that the vast majority of drug court participants were
charged with fifth degree felony possession. While the court’s protocol does not preclude
third-and fourth-degree drug offenders from the program, in practice only two of the 43
participants (4%) in the sample were charged with something more severe than a fifth-
degree offense.
Figure 1. Type of Drug Offense
Possession91%
Theft controlled substance
2%
Sale2%
Fraudulent procurement
5%
~7~6 On a case-by-case basis, subject to the approval of the County Attorney.

Figure 2. Felony Level of Instant Offense
Regarding criminal history, Table 2 shows that participants averaged 2.5 prior adult
convictions, with individuals ranging from zero to eight prior convictions. Almost half
(46.3%) of the sample had been incarcerated in the past.
Table 2. Criminal History & Risk of Participants
~8~
Variable N % or Mean (Median)
LSI-R total score 41 26.6 (28.0)
Number prior adult convictions
43 2.5 (2.0)
Prior incarceration 19 46.3%
In regard to risk, Figure 3 shows the distribution of participants’ risk classification,
based on Level of Service Inventory-Revised (LSI-R) risk classification tool. One can see
that two-thirds of participants (67%) fell into the Moderate or Moderate/High risk

Figure 3. LSI-R Risk Classification of Drug Court Participants
category, while the other third (33%) were categorized as Low/Moderate or Low risk. The
mean LSI-R total score for this sample was 26.6, with scores ranging from 7 to 40.7
Substance Problems
To determine the nature of participants’ drug involvement, we used several
indicators, including information from participants’ LSI-R, their chemical health
assessments before admission, and the type of drug involved in the felony charge that led
to their admittance to drug court. A criterion for entry into the program is a determination
of substance dependence or abuse, based on the “Rule 25” chemical health assessment. As
Table 3 shows, the vast majority of participants (93%) were assessed as being substance
dependent, and the balance were assessed as abusing. The sample’s mean score for the
LSI-R instrument’s nine-point substance problem score was 6.2, with a range of 3-9.
7 Another factor disqualifying one from drug court participation is the presence of serious/persistent mental illness. According to their LSI-R results, none of the sample had “severe interference, active psychosis.”
~9~

~10~
Table 3. Substance Problems of Participants
Variable Category N % or Mean
Chemical assessment classification
Abusing
3
7.0%
Dependent
40 93.0%
Substance use in past yeara Cocaine / crack 11 25.6% Methamphetamine 32 74.4% Marijuana 36 83.7% Unauthorized
prescription
10
23.3% Number of the above 4 categories used
2.1
LSI-R substance score
41 6.2
“Problem” drug (LSI-R) Cocaine / crack 2 4.7% Marijuana 11 25.6% Methamphetamine 19 44.2% Other synthetic
narcotic 2 4.7%
Other 4 9.4% Missing 5 11.6% Type of drug involved in charge leading to drug court
Cocaine / crack
3
7.0%
Marijuana 6 14.0% Methamphetamine 23 53.5% Prescriptionb 6 14.0% Missing 5 11.6% a Based on participants’ chemical health assessments. No participants reported using heroin, inhalants or over-the-counter drugs. b Including Aderall, Ambien and Lortab.
While in general there is no clear drug of choice for drug court clients across
jurisdictions nationally, in the North St. Louis County Drug Court planning materials,
methamphetamine was highlighted as a substance that was prevalent, and meth-involved
individuals were expected to make up a significant part of the North St. Louis County
Drug Court’s caseload. This expectation proved to be accurate. For more than half the
sample (53.5%), methamphetamine was the substance that was involved in the charge
resulting in referral to drug court. Meth was also the most commonly identified “problem”
drug in the LSI-R (44.2% of participants), and 74.4% of participants in their chemical
health assessments reported using meth in the year prior to their admittance to court,
second only to marijuana (83.7%).

~11~
DRUG COURT PROCESS: TREATMENT, SUPERVISION, REWARDS & SANCTIONS
Treatment – Substance Abuse & Cognitive Skills
Drug courts’ function of linking substance abusing and substance dependent
offenders to treatment in lieu of incarceration is at the core of their mission. Through
successful treatment, an individual’s criminal behavior can be reduced to the extent that
her criminal acts are motivated or otherwise influenced by her substance problems.
Analyses show that the North St. Louis County Drug Court Does the drug court – via its
community partners, including private treatment providers – has largely succeeded in
providing ready access to a continuum of substance abuse treatment and other related
treatment and rehabilitation services.
Table 4. Drug Court Treatment Information Type of Treatment
N
Percent
Mean
Median
Std.Dev.
Range
Residential drug treatment
Attendeda
23
53.5%
Treatment progress Successful completion 22 95.7%
Termination 1 4.3% In progress 0 0%
Days in treatment (successes)
38.2
28.0
20.8
26-90
Outpatient drug treatment
Attended
19
44.2%
Treatment progress Successful completion 16 84.2%
Termination 1 4.7% In progress 2 10.5%
Days in treatment (successes)
111.7
110.5
50.4
35-191
Any residential or out-patient drug treatment
Neither
4
9.3%
One, but not the other 36 83.7% Both 3 7.0% Cognitive skills Attended 35 81.4%
Treatment progress Successful completion 25 71.4% Termination 5 14.3% In progress 5 14.3% Attended aftercare 19 44.2% aSeven individuals were admitted to inpatient treatment a second time; one was admitted a third time.

~12~
Table 4 shows that 23 of the 43 participants in the sample (53.5%) received
residential drug treatment soon after their admittance into the program (i.e., in Phase 1). Of
those receiving residential treatment, 95.7% successfully completed it, with a median
treatment duration of 28 days. With one exception, outpatient treatment always began in
Phase 1. In ten cases, it began and ended in Phase 1; in eight cases, it began in Phase 1 and
continued into Phase 2; and in one case it began in Phase 2 and continued into Phase 3. Of
the 19 participants placed into outpatient treatment during this study’s observation period,
16 (84.2%) completed it successfully, two were still in treatment at the end of the
observation period, and only one (4.7%) was terminated. Table 5 shows that the median
time in outpatient treatment for those who successfully completed it was 110.5 days. Most
of those receiving outpatient treatment received it from Arrowhead Health Center (13) or
Range Mental Health Center in Hibbing (4).
Table 4 also shows that the vast majority of drug court participants received
residential treatment, outpatient treatment, or both; only 9.3% of the sample received
neither. Finally, Table 4 reveals that more than four out of five (81.4%) participants
received cognitive skills training (which occurs in Phase 2). Of the 35 who attended 25
(71.4%) successfully completed, five were terminated and another five were still in
cognitive skills at the end of this study’s observation period. All told, only one of 43
participants did not get any form of treatment (residential, outpatient or cognitive skills).
While it is encouraging that most drug court participants are successfully linked to
treatment via the drug court program, time spent in residential treatment (about a month,
on average) might be too brief. We recognize that the relatively short duration of inpatient
treatment might be the product of fiscal necessity (i.e., insurance may cover only a month’s
worth of residential treatment). However, in light of research indicating that at least 90
days of treatment is more likely to be effective,8 we recommend that participants’ duration
of residential treatment be increased to at least 90 days.
Level of Supervision: Probation Contacts, Court Appearances & Drug Tests
The degree to which drug court personnel, including probation officers and judges,
maintain an active role in monitoring participants is addressed by examining information
from the Court Services Tracking System (CSTS) database. In addition, to determine
8 See Simpson, D, Joe, G. & Brown, B. (1997). “Treatment Retention and Follow-Up Outcomes in the Drug Abuse Treatment Outcome Study.” Psychology of Addictive Behaviors, 11(4), 294-307.

~13~
frequency of drug testing (e.g., urinalysis), we relied on information from both CSTS and
the primary drug testing private vendor, Arrowhead Health Center.
Probation Officer Contacts. First, we compare the number of probation officer
contacts that are prescribed in the court’s protocol to the number of observed contacts –
including office, field, and (successful) phone contacts – for each phase. Table 5 illustrates
that for Phase 1 the drug court protocol is at least three probation officer contacts per week.
Based on the best available information, the observed average number of contacts (1.58) is
about half of what was prescribed. That said, it is important to note that almost all
participants are placed in treatment in Phase 1; contacts might be lower for this reason,
especially for those participants who receive residential treatment. For Phase 2 the
prescribed number of contacts per week is a minimum of two; Table 5 shows that the
average number of observed contacts per week was 0.8. Regarding Phase 3, the court’s
protocol specifies only that there will be “random” contacts. The data indicate that the
average observed for this phase was 0.60, or approximately one every other week.
Table 5. Prescribed & Observed Number of Weekly Probation Contacts, by Phase Phase 1
Protocol Observed (N=43)
Contact with a probation officer a minimum of 3 times/week at the office, in the field (home, at work, in the community or at treatment) or by phone.
Office Field Phone
Range:a 0-2 Mean: 0.23
Range: 0-4 Mean: 0.93
Range: 0-7 Mean: 0.51
Overall average: 1.58
Phase 2Protocol Observed (N=31)
Contact with a drug court team member a minimum of 2 times/week at the office, in the field (home, at work, in the community or at treatment) or by phone.
Office Field Phone
Range: 0-2 Mean: 0.11
Range: 0-4 Mean: 0.44
Range: 0-4 Mean: 0.25
Overall average: 0.80
Phase 3Protocol Observed (N=15)
Random home and work checks by probation officer.
Office Field Phone
Range: 0-1 Mean: 0.06
Range: 0-3 Mean: 0.33
Range: 0-3 Mean: 0.21
Overall average: 0.60 a All ranges are across weeks and individuals.

~14~
Court Appearances. It is worthy of mention that monitoring by the judge (i.e., via
data on the frequency appearances before the judge in court) occurred exactly according to
protocol: Participants in Phase 1 appeared weekly, those in Phase 2 appeared biweekly,
and those in Phase 3 appeared every month. Of course, probation officers also attend the
weekly court sessions. Were court appearances counted as probation officer contacts, the
average number of contacts for Phases 1-3 would be, respectively, 2.58, 1.30 and 0.85.
We recommend that steps be taken to increase slightly the frequency of probation contacts
in Phases 1 and 2. Alternatively, if there is consensus among the drug court team that the
observed frequencies of probation officer contacts are adequate (because treatment
precludes contacts and/or because in-court judicial reviews could also be seen as probation
officer contacts), then the court’s protocol should be revised accordingly.
Drug Tests. Data to address whether participants were monitored for abstinence
according to established protocols are from both the CSTS and the court’s primary vendor,
the Arrowhead Health Center’s Wintox database. Reliable information on drug test results
from this latter source proved to be unavailable for the first half of the observation period
(December 2006 through July 2007); therefore, we focused our analyses of drug test
information only on the months for which this information was available (August 2007 –
March 2008).9
Table 6. Prescribed & Observed Frequency of Drug Testing, by Phase
Phase 1 Protocol Observed (N=30)
A minimum of 3 random urinalysis tests (UA’s) weekly
Mean: 2.43a
Phase 2 Protocol Observed (N=29)
A minimum of 2 random UA’s weekly Mean: 2.33b Phase 3
Protocol Observed (N=15)
A minimum of 1 random UA weekly Mean: 1.63c a Range is 1-6. UA’s account for 97.5% of all drug tests; breath analyses (BA’s) and saliva tests account for the other 2.5%. b Range is 0-5. UA’s account for 94.4% of all drug tests; BA’s and saliva tests account for the other 5.6%. c Range is 0-4. UA’s account for 93.9% of all drug tests; BA’s and saliva tests account for the other 6.1%.
9 As a result, there was no drug test information for 13 of the 43 participants in Phase 1 and two of 31 participants who advanced into Phase 2. By comparison, there was complete drug testing information for all 15 participants who were in Phase 3 during the observation period.

~15~
Table 6 shows that, except during Phase 1, the number of drug tests recorded in the
data exceeded the drug court’s protocols. For Phase 1, the observed mean number of drug
tests per week (2.43) was below the protocol of three or more. There is the distinct
possibility that this lower number is the product of an undercount of drug tests that
participants received while in treatment (which always occurred in Phase 1).
Rewards & Sanctions
Incentives and sanctions are an integral part of the drug court process. The
operation of drug courts is based on the reality that for most, the path to long-term sobriety
is not without its setbacks. Intermittent progress, interrupted by relapse, is the norm. The
drug court’s sanctioning and rewards scheme is designed to offer immediately reward good
behavior and sanction the participant for bad behavior. Regarding the latter, under the drug
court model, rather than dismiss a participant who has a positive drug test or other
violation of court protocol, lesser sanctions are meted out instead. Detrimental behaviors
such as evidence of drug use (based on a positive UA), failure to report to a probation
officer, or a curfew violation could result in gradated sanctions such as admonishment by
the drug court judge, jail time, community service, or extending the participant’s stay in
one phase of the court, or having her return to an earlier phase, where monitoring is more
intense and freedoms are more restricted (e.g., getting “bumped” from Phase 3 back to
Phase 2).
By contrast, good behavior is rewarded with incentives such as the judge’s praise
during the court session, applause from court session attendees, gift cards to local retailers,
and forgiveness of court fines. Rewards for phase advancement include a certificate of
completion; rewards for graduation include, in addition to court recognition, a diploma,
cake, a picture with the Drug Court Judge, and the opportunity to address drug court
participants.
Table 7a illustrates the type of consequences imposed by the drug court including
the frequency with which they were used. Typically, the judge specified a time frame for
completion of the punishment; however, such time frames were only recorded in the
Sanctions Log for community service, jail time, and treatment. About two-thirds (68%) of
the sanction consequences consisted of time in the county jail or community service. The
number of days in jail ranged from one to 45 days, with an average stay of ten days.
Community service consequences averaged two days, ranging from one to eight days.

~16~
Table 7a. Distribution of Types of Sanctions Duration in Days
Type of Sanction Na Percent Mean Range County Jail
47
39%
10
1-45
STS (community service) 35 29% 2 1-8 Treatment or halfway house 12 10% 50 8-90 Phase penalty (restart current phase or begin again at Phase 1)
8 6%
Restart sobriety date 6 5% Attend extra aftercare or cognitive skills 3 2% Termination from drug court 3 2% Attend extra drug court 2 2% Attend AA or equivalent meetings 1 1% Electronic monitoring 1 1% Increase drug testing 1 1% Restricted curfew 1 1% Verbal reprimand in court 1 1% Total 121 100% a Mean number of sanctions for full group: 2.6; mean number of sanctions for graduates: 1.3.
The types of behaviors that prompted drug court sanctions are presented in Table
7b. The most frequent (28%) reason for sanctioning was evidence of drug use (positive
UA, admitted use, or other evidence of use). Combined, missing a UA call or missing other
drug court programming (e.g., cognitive skills, a court appearance, a treatment session)
comprised 31% of behaviors that caused sanctioning. Other reasons for sanctions included
new crimes (13%), curfew violations (11%), and termination from treatment or other
programming (5%). Three percent of participants were sanctioned for driving without a
license.
Table 7b. Types of Sanctioned Behavior
Reason for Sanction N Percent Positive UA or other evidence of use
34
28%
Missed UA call or refusal 21 17% Missed court review, cog. skills, staff appointment, or treatment programming 17 14% New crime 16 13% Curfew violation or overnight/extra night without permission 13 11% Terminated from treatment or other programming 6 5% Absconded 5 4% Contact with felon 3 3% Driving without valid license 3 3% Disrespectful to drug court or treatment staff 1 1% Lake of progress in drug court
1 1%
Total 120 100%

~17~
Another way to consider the sanctions data is to discuss how often drug court
participants are sanctioned. Drug court participants receive an average of 2.6 sanctions as
they progress through the program. This is compared to an average of 1.3 sanctions for
drug court graduates (N = 3). This comparison follows expectations that graduates would
typically do better, but comes with the caveat that a low number of individuals have
graduated from the North St. Louis County Drug Court thus far.

~18~

~19~
PARTICIPANTS’ PROGRESS THROUGH THE PROGRAM & COURT CASELOAD VOLUME
This section begins by addressing whether participants are screened into the drug
court in a timely fashion. It then offers a “snapshot” profile of drug court participants’
status as of the last full week of this study’s observation period. It also reports the average
length of time in each phase of the court, and compares observed duration in the program
to times set forth in the court’s protocol. This section concludes with brief discussions of
the relationship between stay type and the likelihood of termination from the program, and
of the progress made by the three individuals who graduated from the program during the
observation period of this research.
Screening Participants into the Court
To address whether participants were screened into the drug court program in a
timely fashion, we utilized five pertinent dates: date of arrest, date of referral to the court,
date of acceptance into the court, date of first court services and first court appearance
date.10
The time between date of arrest and date of first court services would be the logical
period on which to focus, were the North St. Louis County Drug Court a pre-adjudicatory
court, in which cases are diverted into the program after arrest and in lieu of conviction.
This drug court model has an advantage over traditional criminal justice sanctions in terms
of case processing speed; to the extent that arrest is a moment of crisis in an individual’s
life, the drug court offender might be more amenable to change if she is quickly placed in
the drug court program. However, given that it is a post-conviction or post-adjudicatory
court – that is, it does not accept cases before a case has resulted in conviction – the span
between arrest date and receipt of first drug court services is less relevant.11
Thus, for purposes of this study, the initial date of focus is the date that a case is
referred to the court by the court administrator’s office and/or the probation department;
the next step in the process is the drug court team’s decision to accept a case into the
program.
10 We also had access to sentence date, but this information was essentially moot, as all but one drug court participant was formally sentenced after their acceptance into the drug court program. Refer to the appendix for a discussion of the court’s case processing speed relative to the historical comparison group’s. 11 That said, the median time between arrest and first drug court appearance was 94 days, or about 13 weeks, with a wide range of 42-230 days.

~20~
Table 8. Average Length of Time to Screen Participants into Drug Court
Lag in Days between… N Mean Median
Std.Dev.
Range
Referral to drug court & acceptance in drug court
42 28.6 20.5 28.4 1-133
Acceptance into drug court & first drug court services
42 15.4 14.0 8.5 3-47
First drug court services & first appearance in drug court
42 10.1 5.5 15.6 1-73
Analyses reveal that, typically, there was a three-week lag (median = 20.5 days)
between referral to drug court and acceptance in drug court (Table 8). On average,
treatment services under the auspices of the drug court were administered two weeks later
(median = 14 days). Finally, on average, participants had their initial drug court
appearance less than a week after receiving services (median = 5.5 days). In sum then, the
typical drug court participant received drug court services within five weeks of being
referred to court, and made her first appearance within six weeks of referral.12
Court Caseload Volume
Court planners originally anticipated that roughly 50 would be accepted into the
program annually. Approximately one year into the court’s operation, there was consensus
among drug court team members that a caseload of about 40 was more feasible, due in part
to the large geographic area that the court serves. For the first 12 months in which the court
was in session (December 2006 – November 2007), 42 participants began the drug court
program. Over the whole observation period (16 months), 43 individuals entered the
program. This averages to about 2.7 court first appearances per month; as many as seven
individuals started in a given month, while in four other months, no one made an initial
appearance. As of the last full week of this study’s observation period – the week of March
20, 2008 – 29 participants’ status was active, while three had graduated and 11 others had
been terminated from the program. Among the 29 participants with an active status, six
were in Phase 1, 12 were in Phase 2 and 11 were in Phase 3 (Figure 4). 12 Referral to the drug court was slightly more likely to happen before conviction (46.5% of the sample) than after conviction (41.9%). Five participants (11.6%) were referred to drug court on the same day that they were convicted. The median value for the number of days between these two dates was zero, with about two-thirds of referrals happening within one month before or after date of conviction. Given this variation in the relationship between referral and conviction (i.e., one date did not consistently precede another) we focused on referral date in lieu of conviction date, based on the rationale that referral is more integral to the drug court screening process.

Figure 4. Status of Drug Court Participants as of March 2008
Participants’ Progress through the Court
The North St. Louis County Drug Court program requires a minimum of 12
months of documented sobriety in order for a participant to graduate from the program.
Thus, the bare minimum duration in the program (i.e., a tenure with no positive drug tests)
is one year, or 365 days. Court planners anticipated that the typical duration for graduates
would be 400 days, broken down by phase as follows: Phase 1, a minimum of three months
(recall this is the phase in which participants are to complete primary treatment; the
participant graduates from this phase after 90 days of documented sobriety); Phase 2,
anticipated to last three months; and Phase 3, anticipated to last six months. In light of
these benchmarks, Table 9 reports the summary statistics for length of time in each phase.
As Table 9 shows, the median time in Phase 1, anticipated to last at least three
months, was about four months (126 days); the mean duration (154.7) is higher as the
result of some high outlying values, for example the 294-day duration at the top of the
range. Regarding length of time in Phase 2, one can see that the observed average duration
~21~

~22~
Table 9. Average Number of Days in Each Phase of Drug Court
Number of Days to …a N Mean Median Std. Dev.
Range
Complete Phase 1
31
154.7
126.0
61.3
84-294
Complete Phase 2
15 91.9 98.0 16.7 56-126
Complete Phase 3 3 184.3 182.0 4.0 182-189
Graduate (from date of first appearance)
3
401.7
399.0
38.1
365-441
Be terminated (from date of first appearance)
11
201.6 189.0 96.5 63-399
aParticipants who did not complete a given phase by the end of the study observation period are excluded from these calculations.
(e.g., mean = 91.9 days) is very close to the protocol’s three months. The same is true for
Phase 3. Although only three individuals graduated from the program during this study’s
observation period (and thereby completed Phase 3), one can see that the average time in
Phase 3 (182-189 days) for these three participants was consistent with the prescribed six-
month duration for this phase. Likewise, the overall time in the program for the three
graduates was, on average, essentially exactly according to protocol (400 days).
Finally, Table 9 also shows the average number of days in the program for those 11
participants who were ultimately terminated. As the wide range of values indicates, some
of the terminated participants made it beyond Phase 1 – three were in Phase 2 and two
made it to Phase 3.13 There are several characteristics of the terminated participant group
that are worth noting. Approximately one-quarter of the terminated participants requested
their sentence to be executed rather than complying with an imposed sanction. In most
cases, the imposed sanction would have been some form of drug treatment. At the time of
termination (whether requested or imposed), 73% of the participants were in Phase 1 of
drug court programming. Termination was most often due to non-compliance with drug
court rules (91% of terminated cases). In almost all cases, the reason for non-compliance
was persistent evidence of new drug or alcohol use, manifested as a failure to either
comply with or go to drug treatment. For example, several participants were terminated 13 At least one individual who was facing a stay of execution (i.e., her felony drug conviction would appear in her criminal record even if she successfully completed drug court) requested that her prison sentence be executed in lieu of their drug court participation. Since she took this step before ever appearing in drug court, this case was not included in the analyses herein.

~23~
from drug court because they had either absconded from or were terminated by halfway
houses and treatment facilities. Only one participant was terminated from the drug court
due to a new drug charge.14
Relationship between Stay Type & Likelihood of Termination
Under the post-conviction model that the North St. Louis County Drug Court
employs, the prospect of prison time if terminated from the drug court program provides
the court with significant leverage; all participants face the “stick” of prison time if they
were to be terminated. By contrast, the “carrots” awarded for successful completion of the
program vary greatly according to stay type – from an expunged record (stay of
adjudication) to a misdemeanor conviction instead of a felony conviction (stay of
imposition), to no carrot at all (just avoidance of prison) for a stay of execution. Given that
stays of adjudication offer the greatest reward for program completion, perhaps it is not
surprising that those receiving stays of adjudication were less likely to be terminated than
those receiving other stay types. While overall 25.6% of participants were terminated from
the program, termination was lower among those receiving a stay of adjudication (4 of 24,
or 16.7%) than among those receiving a stay of execution (4 of 14, or 28.6%) or imposition
(3 of 5, or 60%).15 (Two of the three graduates received stays of adjudication, while one
received a stay of execution.)
Moreover, there were geographic patterns in the type of stays used: stays of
execution were more likely for cases originating at the Hibbing court (eight of 20 cases, or
40%) than at Virginia’s court (6 of 23 cases, or 26%). Conversely, stays of adjudication
were more likely to originate in Virginia (61% of cases) than Hibbing (50% of cases).
Depending on an individual’s criminal history and/or the severity of his instant charge,
Minnesota Sentencing Guidelines may stipulate that the judge employ a stay of execution
or a stay of imposition. Yet it is also the case that deviation from sentencing guidelines
occurs regularly, and the likelihood of deviating can vary across judges and, in turn, courts.
Especially in light of the apparent relationship between stay type and likelihood of
14 The data indicate that there was no apparent relationship between the severity of a participant’s substance problem and his likelihood of program success or failure. Two examples underscore this point. First, scores on LSI-R’s subscale for drugs were higher among active participants (mean = 6.25) than those terminated from the program (6.1). Second, regarding the relationship between use of methamphetamine (recognized to be an especially addictive and detrimental substance, relative to other drugs such as marijuana) and program outcome: All three graduates reported using meth in the year before their entry into the court; by comparison, only 63.6% of those terminated from the program reported meth use in the year before court entry. 15 Given the relatively small sample size, none of these relationships is statistically significant.

termination, we recommend that individuals referred to the drug court receive stays of
adjudication (the biggest “carrot”, offering the greatest incentive to participants) whenever
possible.
Intermediate Outcomes – Examination of Drug Court Graduates
It is worthwhile to consider the intermediate outcomes of those who have
graduated from the North St. Louis County Drug Court. Due to the infancy of the drug
court itself, these findings are tempered by a very small sample size. Nonetheless, this
analysis can offer a preliminary glimpse at whether the drug court indeed reduces the risk
of recidivism for successful participants (i.e. graduates).
A major objective of the drug court is to reduce or eliminate the use of illicit
substances among participants. Protocol states that drug court participants must have clean
UA’s for at least one year. All drug court graduates exceeded the required 365 days of
sobriety; two of the three graduates did not have a single positive drug test.
Another way to gauge success amongst the drug court graduates is to measure
changes in LSI-R scores. Given the nature of the LSI-R, we can assess whether the
graduates obtained a reduction not only in their total LSI-R score, but also assess
reductions in several subscales (i.e., drug and alcohol scale, attitudes and orientations
scale, employment scale).
Table 10. Mean LSI-R Scores for Drug Court Graduates (N = 3)
Total Score Drug Score Attitude Score Employment Score
Drug Court Entry
27.0 6.0 2.7 5.0
At Drug Court Exit
9.3 1.3 0 3.7
Difference in Mean Scores 17.7 4.7 2.7 1.3
Table 10 illustrates that, as expected, the average total LSI-R score and LSI-R drug
score were markedly lower at graduation than when assessed upon entry. Further, the
subscale that assesses participants’ attitudes toward crime and criminal justice supervision
also shows a marked improvement upon graduation. The employment subscale (i.e.
employment stability and education) also shows a reduction, indicating greater stability
and educational achievement upon graduation than at entry.
~24~

DRUG COURT PARTICIPANTS’ ATTITUDES TOWARD THE COURT
To learn drug court participants’ perceptions about various features of the North St.
Louis County Drug Court program and its key actors, including judges and probation
officers, a written survey was administered at two separate court sessions in June 2008 –
June 5, and June 12.16 Overall, respondents had positive perceptions of the drug court. For
example, the open-ended survey item, “Is there anything else you would like to say about
your experience [with the drug court]?” elicited responses such as: “I appreciate all the
efforts provided and the consistency of the program. My experience has been well worth
the hard work. So much so that I am enlightened to a better life.” As Figure 5 shows,
analyses of responses to Likert-type items (with answers ranging from 1 [strongly
disagree] to 5 [strongly agree]) revealed average scores of 4.1 in response to the statements
“I have been personally helped through drug court” and “Drug court will help me avoid
drug use in the future.” On the other end of the spectrum, on average, survey respondents
disagreed (average = 2.0) with the statement “Drug court is easier than regular probation.”
Figure 5. Respondents’ Overall Perceptions of Drug Court
~25~
16 The response rate to this survey was excellent: 21 out of 25 (84%) participants whom were administered the survey completed at least part of it. Of these 21, 38.1% were females and 52.4 % were males. Eighty-one percent were white, and the median age for the sample was 32 years. Among the participants who completed the survey, eight were in Phase 1 of the drug court, five were in Phase 2, and eight were in Phase 3. The mean number of months of drug court involvement of those surveyed was 7.7.

Figure 6. Respondents’ Overall Perceptions of Drug Court, by Phase
Figure 6 breaks down reactions to these statements by respondents’ phase in the
court. Across survey items, there is a positive relationship between phase and positive
reactions to the court, suggesting that drug court participants tend to “buy in” to the
program over time. For example, respondents in successive phases tended to more strongly
agree with the statement “I have been personally helped through drug court,” as they
advanced through the program; whereas the average for this item among Phase 1
respondents was 3.6, among Phase 2 respondents it was 4.0, and among Phase 3
respondents it was 4.6 (i.e., between “agree” and “strongly agree”). The statement “Drug
court will help me avoid drug use in the future,” elicited a similar pattern, with the average
among Phase 1 respondents being 3.6, compared to an average of 4.5 among respondents
in Phase 3. Given that restrictions, reviews and drug testing become less frequent from
Phase 1 to Phase 3, it is understandable that agreement with the statement “Drug court is
~26~
easier than regular probation,” trended upwards by phase (from an average of 1.6, to 1.8, to
2.5, for Phases 1, 2 and 3, respectively). By contrast, agreement with the “negative”
statement “Some clients seem to get special treatment in regard to consequences,” was
weaker among respondents in Phase 3 (2.88) than among those in Phase 1 (3.57).
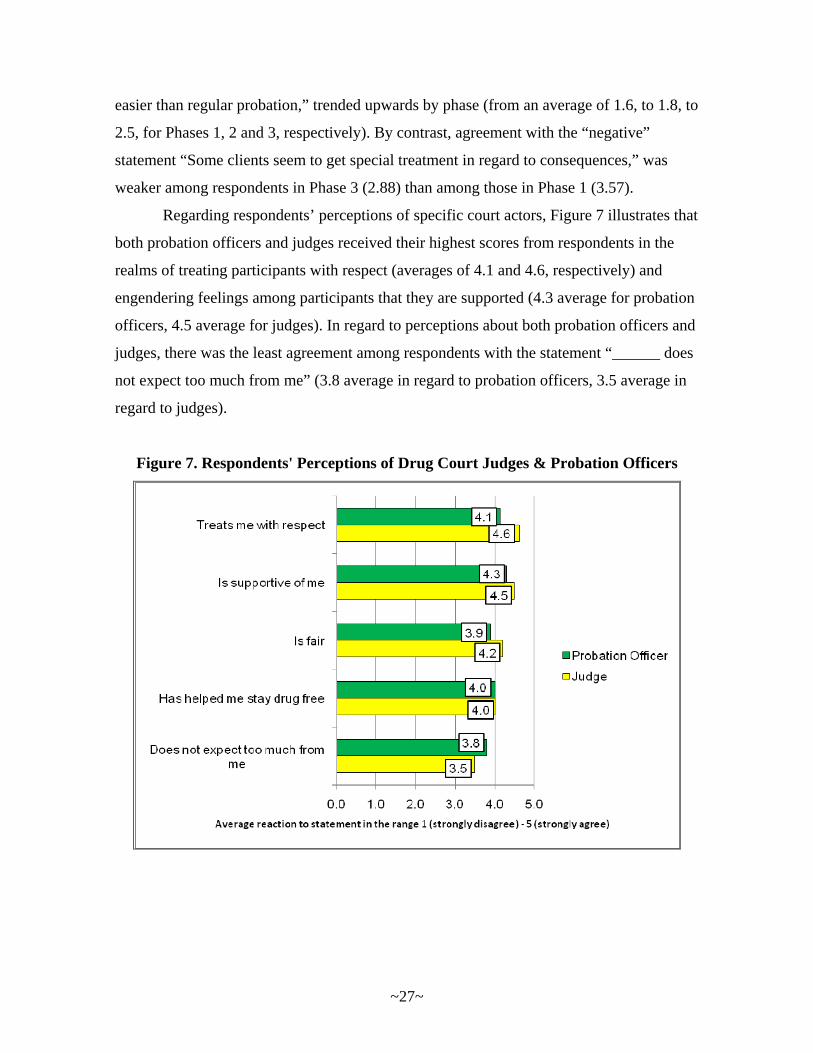
Regarding respondents’ perceptions of specific court actors, Figure 7 illustrates that
both probation officers and judges received their highest scores from respondents in the
realms of treating participants with respect (averages of 4.1 and 4.6, respectively) and
engendering feelings among participants that they are supported (4.3 average for probation
officers, 4.5 average for judges). In regard to perceptions about both probation officers and
judges, there was the least agreement among respondents with the statement “______ does
not expect too much from me” (3.8 average in regard to probation officers, 3.5 average in
regard to judges).
Figure 7. Respondents' Perceptions of Drug Court Judges & Probation Officers
~27~

Figure 8. Percentage of Respondents Indicating a Feature of the Court was Helpful
Figure 8 shows that, in regard to the helpfulness of various features of the court,
more respondents (71.4%) reported that regular drug testing was helpful to them than any
other listed feature. By comparison 57.1% of respondents reported “threat of jail” being
helpful, and 52.4% reported that “judicial reviews/accountability to judge” was helpful. At
the other end of the spectrum, less than 40% of respondents reported court incentives or
meetings with probation officers as being helpful. The interesting finding that the
“accountability” features of the court (e.g., the prospect of going to jail, regular drug
testing) were valued more than its “helping” aspects (e.g., incentives) was consistent with
one response to the open-ended survey item, What do you like most about drug court?:
“Being hold accountable, frequent UA’s.”
~28~

Figure 9. Percentage of Respondents Indicating a Feature of the Court was Helpful, by Phase
Figure 9 provides further evidence that respondents’ perceptions of the drug court
tended to improve by phase. For example, regarding regular drug testing, while only 50%
of respondents in Phase 1 considered drug testing to be helpful, 80% of those in Phase 2,
and 88% of those in Phase 3, found it helpful. Similar patterns can be seen for the items
“Threat of jail” and “Treatment,” both of which 75% of respondents in Phase 3 reported as
being helpful. Although in general, visits with probation officers were ranked lowest in
terms of their helpfulness (see Figure 8), the likelihood that respondents would deem them
helpful increased with successive phases. For example, whereas none of the respondents
reported home visits by probation officers to be helpful, 40% of respondents in Phase 2
considered them to be helpful, as did 75% of those in Phase 3.
~29~

~30~
Differences between the Sexes
Finally, there were some noteworthy findings in regard to differences between the
sexes in perceptions of the court. Males were much more likely than females to report that
home visits were helpful (55% versus 25%), office visits were helpful (55% versus 0%),
incentives were helpful (55% versus 25%) and that treatment was helpful (64% versus
13%). By comparison, there were essentially no gender differences regarding the perceived
helpfulness of threat of jail (64% of males and 63% of females reported it to be helpful)
and regular drug testing (75% and 73%, respectively). Although the number of surveyed
individuals (21) is relatively small, some of these gender differences in regard to
perceptions of the court are stark. We recommend that the drug court team consider what
might be explaining these gender differences (e.g., in regard to perceptions of treatment).

~31~
APPENDIX: DRUG COURT PARTICIPANTS RELATIVE TO AN HISTORICAL COMPARISON GROUP
This appendix examines the drug court’s caseload characteristics and case
processing speed relative to an historical comparison group comprised of third-, fourth-
and fifth-degree drug cases originating in Virginia and Hibbing for the two years prior to
the date at which the court was to begin accepting cases. Eligible drug cases with offenses
occurring from October 1, 2004, through September 30, 2006, were included in this
comparison group.17 Comparisons of these two groups reveal a lot of similarities between
the two groups, in terms of their demographic characteristics, criminal history and risk, and
substance use issues. These similarities, in turn, suggest that the drug court accepted
typical non-sale-for-profit cases that originated in North St. Louis County; it did not
“cherry-pick” low-risk or otherwise “easy” cases for inclusion in the program.
Table A1. Selected Demographic Characteristics: Drug Court Participants vs. Historical Comparison Group
Drug Court Comparison Group
Variable Category N % or mean N % or mean
Age 43 30.9 243 33.5
Sex Female 18 41.9% 73 30.0% Male 25 58.1% 170 70.0%
Race White 37 86.0% 219 89.4% Native American 4 9.3% 12 4.9% African American 2 4.7% 7 2.9% Missing 7 2.9%
Table A1 shows that, in terms of demographic characteristics, the drug court
sample and comparison group are remarkably similar. Members of the comparison group
17 To match court eligibility criteria as closely as possible, cases in which sale (or intent to sell) was indicated in the charge description were excluded from this comparison group. Also excluded were cases in which a drug charge was accompanied by a charge of violence or a weapons-related offense. We also deleted duplicate cases in this time span involving the same individual. For the 14 times this occurred, we opted for the charge that happened earlier in the two-year period, excluding the latter case. The resultant sample contained 245 cases; LSI-R information was available for 181 (73.9%) of these. Note that, even with these multiple selection criteria, this data set does not offer a strict “apples-to-apples” comparison. Most importantly, these data do not contain information on whether an individual was assessed as substance abusing or dependent (a requirement for drug court admission). These data also lack detailed information on whether an individual had a violent criminal record (a factor that would disqualify one from consideration for drug court).

~32~
were, on average, slightly older (33.5 versus 30.9 years), somewhat more likely to be male
(70.0% versus 58.1%) and slightly more likely to be white (89.4% versus 86.0%).
Based on this information, it is apparent that females and racial minorities were not
underrepresented in the North St. Louis County Drug Court program.
Table A2 shows that the two groups are comparable in terms of criminal history
and risk. Whereas the drug court sample’s average LSI-R total score were a few points
higher than the comparison group’s, the comparison group’s median number of prior adult
convictions (3) was higher than the drug court’s (2), and those in the comparison group
were slightly more likely to have been incarcerated before (49.7% versus 46.3%).
Table A2. Criminal History & Risk:
Drug Court Participants vs. Historical Comparison Group
Drug Court Comparison Group
Variable
N
% or mean (median)
N
% or mean (median)
LSI-R total score 41 26.6 (28.0) 181 23.9 (24.0)
Number prior adult convictions
43 2.5 (2.0) 169 6.4 (3.0)
Prior incarceration
19 46.3% 181 49.7%
The sample of drug court participants is also very similar to the historical
comparison group in terms of both degree of felony charge and substance abuse issues.
Table A3 shows that the percentage of defendants with a fifth degree felony charge was
95.3% for the drug court sample compared with 95.1% for the comparison group. For both
groups, methamphetamine was most likely identified in LSI-Rs as individuals’ “problem”
drug (44.2% for the drug court sample, compared to 44.6% for the comparison group);
marijuana had the second highest percentage for both groups (25.6% for the drug court
sample, compared to 23.2% for the comparison group). Meth was the drug that was most
frequently involved in individuals’ drug charges (53.5% for the drug court sample,
compared to 60.5% for the comparison group), followed (again) by marijuana for both
groups. In terms of scores on the LSI-R drug subscale (possible range: 0-9), drug court
participants’ average (6.1) was somewhat higher than the comparison group’s (5.0).

~33~
Table A3. Substance Abuse & Charge Information: Drug Court Participants vs. Historical Comparison Group
Drug Court Comparison Group
Variable
Category
N
% or mean (median)
N
% or mean (median)
Degree of felony charge
5th degree 4th degree 3rd degree
41 1 1
95.3% 2.3% 2.3%
231 1 11
95.1% 0.4% 4.5%
“Problem” drug (LSI-R)
Cocaine / crack Marijuana Methamphetamine Other synthetic narcotic Other Missing
2 11 19
2 4 5
4.7% 25.6% 44.2%
4.7% 9.4% 11.6%
4 42 81
20 10 24
2.2% 23.2% 44.6%
11.0% 5.5% 13.3%
Type of drug involved in charge
Cocaine / crack Marijuana Methamphetamine
3 6 23
7.0% 14.0% 53.5%
7 26 147
2.9% 10.7% 60.5%
Prescription 6 14.0% 28 11.5% Other
Missing
0 5
0% 11.6%
8 29
3.2% 11.8%
LSI-R drug score
41 6.1 (6.0) 181 5.0 (5.0)
Case Processing Speed
Since the North St. Louis County Drug Court is a post-conviction court, there is not
a strong reason to believe that case processing time – defined here as days between arrest
and conviction18 – would be faster in the drug court. Yet the median time between arrest
date and conviction date was five weeks shorter (57 days) than that of the historical
comparison group (92 days).19 That said, for drug court participants, there was on average
a lag of approximately five weeks between date of conviction and first appearance in drug
court. Thus, net case processing time between the two groups seemingly is, not
surprisingly, essentially equivalent.
18 This is the most apt comparison that can be made, given the fact that there is no referral date for the comparison group. Recall that drug court participants’ referral to the court was about as likely to occur before as after their conviction date (refer to the discussion following Table 8 in the body of this report). 19 We are unsure what might account for this disparity, apart from proffering the hypothesis that the existence of the North St. Louis County Drug Court served as sort of an “express lane” that served to speed the processing of one particular type of case (i.e., primarily fifth-degree drug cases).