proceedings of the international collaborative effort on
TRANSCRIPT
,,
I Proceedings of the‘ International Collaborative
Effort on PerinataI andInfant Mortality, Volume II
U.S. DEPARTMENT OF HEALTH AND HUMAN SERVICES ● Public Health Service ● Centers for Disease Control ● National Center for Health Statistics
Proceedings of theinternational CollaborativeEffort on Peritiatal andinfant Mortality, Vohme II
Papers presented at theAmerican Public Health Association,1985, Washington, D. C., sponsoredby the National Center for Health Statistics
U.S. DEPAFITME!dT Qp ligALTtl AND HUMAN SERVICESI%blic Health %Wviae -Centers for Disease CcmtWNational Center for H&3kh StdtiktitS
Hyattsville, Meryland
October 1988

National Center for Health Statistics
,“
.
MANNINGFEINLEIB,
KUtkKl A. l>KAEL,
JACOBL. FELDMAN,and Epidemiology
M. D., Dr.P.H. , Director
Deputy Director
Ph.D. , Associate Director for Analysis
GEORGE A. SCHNACK, Associate Director for Data Processingand Services
STEPHEN E. NIEBERDING,Associate Director for Management
GAIL F. FISHER, Ph.D. ,Associate Director for Planning andExtramural Programs
MONROEG. SIRKEN, Ph.D. ,Associate Director for Researchand Methodology
PETER L. HURLEY, Associate Director for Vital and Health -Statistics Systems
SANDRASMITH, Information Officer
Office of PI arming and Extramural Programs
GAIL F. FISHER, Ph.D., Associate Director for Planning andExtramural Programs
ALVAN O. ZARATE, Ph.D., Chief, International Statistics Staff
ROBERT B. HARTFORD, Ph.D.y Deputy Chief, InternationalStatistics Staff, and Chairman~ International CollaborativeEffort on Perinatal andhzfant Mortality Planning Group ..
+,-“ .
PREFACE
On November 18, 1985, members of the International Collaborative Effort (ICE) onPerinatal and Infant Mortality participated in an American Public HealthAssociation (APHA) session (at the request of the National Center for HealthStatistics) for the purpose of presenting papers reflecting the status of theirresearch. Subsequent to the APHA conference, the members convened a seminar todetail their various research perspectives and to discuss their currentmethodologies.
The ICE is a continuing effort. Through these shared activities of the members,the ICE is providing knowledge and valuable insight into perinatal and infantmortality. Through this dialogue, it is “possible to examine internationalcomparisons, to follow trends, and to gain insight into successfulinterventions, as well as to recognize national gains that have been realized..The goals of this effort are to identify,risk factors, to enhance knowledgegained from experiences in intervention programs, and to disseminate data inorder to reduce perinatal and infant mortality. In the United States, specialattention is directed to the differences in infant mortality rates among variousethnic, racial, and socioeconomic groups in the population.
The ICE Planning Group is comprised of two eminent researchersfrom each of ninecountries: Denmark, England, the Federal Republic of Germany, Israel, Japan,Norway, Scotland, Sweden, and Wales. This group also includes representativesfrom the National Center for Health Statistics and the Center for .EnvironmentalHealth and Injury Control of the Centers for Disease Control; the Division ofMaternal and Child Health of the Health Resources and Services Administration;the National Institute of Child Health and Human Development”of the NationalInstitutes of Health; and the Association for Vital Records and HealthStatistics. The participants in this effort represent a diversity of scientificdisciplines: physicians, epidemiologicsts, medical researchers’, biostatisti-cians, and health planners.
The P1arming Group’s papers and discussions entailed a review of the complex andcomprehensive issues in the health field which are critical with respect toperinatal and infant mortality.” The presentations are grouped into four .generalcategories:
Risk Factor/Outcome AssessmentMethodologyComparisons of Trends and Data on Perinatal and Infant MortalityComparative Health Care Systems
TheCol“Aug[mecl
presentations published in this volume demonstrate the continuingaboration which was initiated when this group of individuals first met inst 1984. “The material included in this publication may be viewedas aanism for concentrating attention on certain methodologies, models, and
schemata, which may be of ‘great value in terms of helping ihe group focus onfuture areas of interest and in facilitating the process of comparison from onecountry to another. Eventually, a number of models may evolve from thisprocess, which will then be adopted with appropriate variation by a number ofnations in an effort to reduce their perinatal and infant mortality rates.
. . .111
..-.

This volume offers a number of insights and approaches for enhancing perinataland infant health. The research, the methodologies, the risk assessment, andthe prevention efforts suggest certain strategies that, if utilized, may reducepe’rinataland infant mortality. A number of the papers in this report offerevidence of successful interventions which certainly hold promise for othernations to emulate.
The Japanese experience with respect to infant mortality is significant. TheJapanese attribute their success in this area of health to a concerted nationaleffort of providing both prevention and education programs, as well as maternaland infant health care services. The population appears to have historicallyembraced the government’s goals, and it continues to support,these efforts byactive participation in and by compliance with the required health practices.The outcome assessment from the Japanese Government indicates that theirinnovative and far-reaching approach has achieved the goal of reducing maternaland infant mortality.
The methodology undertaken in Sweden appears to have also been successful inachieving a low perinatal and infant mortality rate. As with the Japaneseconcept, the methodology employed in Sweden is comprehensive and national innature. Both nations have not only ensured that the population accepts thecritical importance of infant and maternal health care but have also succeededin instilling in the population the conviction that this type of health care isreasonable, necessary, and obligatory. These two nations with their diversehistory, customs, and 1ifestyle have managed to encourage a policy of reasonableand sound maternal and infant health that has become inherent in”the cultureitself.
Their programs suggest that their accomplishments can be applied to maternal andchild health in other countries. In a similar manner, other papers included inthis volume offer perspectives that can help guide, foster an awareness, andestablish a foundation for implementing various innovations and programs whichmeet the needs of the population in many different nations.
These papers have been prepared and included in this volume as evidence of theprogress of the continuous cooperation of the International Collaborative Efforton Perinatal and -InfantMortality. Me look forward to further participation inthis project and to the ensuing research rewards of this shared endeavor.
iv

ACKNOWLEDGMENTS
Overall responsibility for planning and coordinating the content of this reportrested with the International Statistics Staff, Office of Planning andExtramural Programs, National Center for Health Statistics, under thesupervision of Jane Anne Mehargue.
Special appreciation is expressed to Katherine Taylor Jones who typed themanuscripts for publication.
Publications management and editorial review were provided by Klaudia M. Cox.Graphics were produced under the supervision of Steven L. S1oan; the cover wasdesigned by Sarah Hinkle. Final production was accomplished by Sharon L.Saylor, and pri,ntingcoordination was managed by Naomi M. Forester.
The substantial contributions made by the authors of the papers, printed in thispublication, are gratefully acknowledged.
. .

Symbols
--- Data not available
. . . Category not applicable
. Quaniii zero
0.0 Quantity more than zero but lessthan0.05
z Quant”~ more than zero but lessthan500 where numbers are rounded tothousands
* Figure does not meet standard ofreliabilityor precision(more than30-percent relativestandard error innumeratorof percent or rate)
# Figure suppressedto comply withconfidentialityrequirements
vi

CONTRIBUTORS
Eva D. Alberman, M.D.Professor of Clinical EpidemiologyLondon Hospital Medical CollegeTurner StreetLondon E12AD, ENGLAND
LeivS. Bakketeig, M.D.Director, Department of EpidemiologyNational Institute of Public HealthGeitmyrsveien 75O462OS1O4, NORWAY
Ms. Vita BarellHead, Health Services Research UnitDepartment of Clinical EpidemiologyChaim Sheba Medical CenterTel--Hashhomer 52-621ISRAEL
Per Bergsjd, M.D.Professor and ChairmanDepartment of Obstetrics andGynecology
School of Medicine, University ofBergen
KvinneklinikkenHaukeland Sykehus5021 Bergen, NORWAY
;.Susan K. Cole, M.D.Information Services Division ‘Common Service AgencyTrinity Park HouseS. Trinity RoadEdinburgh EH5 3SQSCOTLAND
Daniel W. Denman, III, M.A.Biometry Branch, Prevention ResearchProgram
National Institute of Child Health andHuman Development
National In$itutes of HealthExecutive Plaza NorthRoom 6-30-SBethesda, Maryland 20892, USA
Anders Ericson, M.SC.Swedish National Board of Health andWelfare
Stockholm, SWEDEN
Stephen J. W. Evans,M.S.London Hospital Medical CollegeTurner StreetLondon E12 AD, ENGLAND
J.G. Fryer, Ph.D.Departmentof Mathematical
, ,’ Statistical and O~erational-.
.1:Research
University of ExeterExeter, ENGLAND
Howard”J. Hoffman, M.A.Chief, Biometry Branch, PreventionResearch Program -
National Institute of Child Healthand+Human Development
National Institutes of HealthExecutive Plaza NorthRoom6--3O-SBethesda, Maryland 20892, USA
........R.G.;.Hunt,,Ph.D.Department of MathematicalStatistical and OperationalResearch
University of ExeterExeter, ENGLAND
P. Karlberg, M.D.Department of Pediatrics IUniversity of GothenburgEast HospitalS-41685 Gothenburg, SWEDEN
Takefumi Kondo, M.D.Director, Maternal and Child HealthDivision
Children and Families BureauMinistry of Health and Welfare
1-2-2, KasumigasekiChiyoda-ku, Tokyo 100JAPAN
-“.
vii
Y-
Karl-Erik Larssen, M.D. Marsden Wagner, M.D., M.P.H.Assistant Professor Regional OfficerDepartment of Pediatrics Maternal and Child Health, RegionalUniversity Hospital Office for Europe7000 Trondheim, NORWAY World Health Organization
8, ScherfigsvejC. J. Lawrence, Ph.D. DK-21OO Copenhagen, DENMARKDepartment of Mathematical Statisticaland Operational Research
University of ExeterExeter, ENGLAND
Gunilla Landmark, M.D., Ph.D.Department of Social MedicineUniversity Hospital IS-75014 Uppsala, SWEDEN
Eikichi Matsuyama, M.D.Executive Board of Japan Associationfor Maternal Welfare
Director, Department of Obstetrics andGynecology
Tokyo Kosei Nenkin Hospital23 Tsukuda-cho, Shinjuku-kuTokyo, 162, JAPAN
Olav Meirik, M.D., Ph,D.HRPWorld Health OrganizationCH-1211Geneva, SWITZERLAND
A. G. Munford, Ph.D.Department of Mathematical Statisticaland Operational Research
University of ExeterExeter, ENGLAND
A. Niklasson, M.D.Department of Pediatrics IUniversity of GothenburgEast HospitalS-41685 Gothenburg, SWEDEN
Patricia W. Potrzebowski, Ph.D.Director, Division of HealthStatistics and Research
Department of HealthP.O. Box 90Harrisburg, Pennsylvania 17108, USA
. . .Vlll
PARTICIPANTS
Eva D. Alberman. M.D.Professor of Cl~nical EpidemiologyLondon Hospital Medical CollegeTurner StreetLondon E12 AD, ENGLAND
Leiv S. Bakketeig, M.D.Director, Department of EpidemiologyNational Institute of Public HealthGeitmyrsveien 750462 OS1O 4, NORWAY
Ms. Vita BarellHead, Health Services Research UnitDepartment of Clinical EpidemiologyChaim Sheba Medical CenterTel--Hashhomer 52-621ISRAEL
Per Bergsj#, M.D.Professor and ChairmanDepartment of Obstetrics andGynecology
School of Medicine, University ofBergen
KvinneklinikkenHaukeland Sykehus5021 Bergen, NORWAY
James Buehler, M.D.De~:;:c~hief, Pregnancy Epidemiology
Division of Reproductive HealthCenter for Health Promotion andEducation
CDC Building 1, Room 44-191600 Clifton RoadAtlanta, Georgia 30333, USA
Susan K. Cole, M.D.Information Services DivisionCommon Service AgencyTrinity Park HouseS. Trinity RoadEdinburgh EH5 3SQSCOTLAND
Stephen J. M. Evans, M.S.London Hospital Medical CollegeTurner StreetLondon E12AD, ENGLAND
J.G. Fryer, Ph.D.Department of MathematicalStatistical and OperationalResearch
University of ExeterExeter, ENGLAND
Robert B. Hartford, Ph.D.Deputy ChiefInternational Statistics StaffOffice of Plqnning and ExtramuralPrograms
National Center for HealthStatistics
3700 East-West Highway, Room 2-12Hyattsville, Maryland 20782, USA
R.G. Hunt, Ph.D.Department of MathematicalStatistical and OperationalResearch
University of ExeterExeter, ENGLAND
P. Karlberg, M.D.Department of Pediatrics IUniversity of GothenburgEast HospitalS-41685 Gothenburg, SWEDEN
Samuel S. Kessel, M.D.Chief, Research and Training BranchDivision of Maternal and ChildHealth
Health Resources and ServicesAdministration
5600 Fishers Lane, Room 6-17Rockville, Maryland 20857, USA
ix
Joel C. Kleinman, Ph.D.Deputy DirectorOf~:::rec#Analysis and Epidemiology
National Center for Health ““””Statistics
3700 East-West Highway, Room 2-27Hy,attsville,Maryland 20782, USA
Karl-Erik Larssen, M.D.Assistant ProfessorDepartment of Pediatrics ~University Hospital7000,Trondheim, NORWAY
C.,J, Lawrence, Ph.D,Department of MathematicalStatistical and OperationalResearch
University of ExeterExeter, ENGLAND ,,
Eikichi Matsuyama;,M.D.. -Executive Board of Japan Associationfor Maternal Welfare
Director, Department of Obstetricsand Gynecology
Tokyo Kosei Nenkjn.,Hospital. :.23.Tsukuda-,Gho,,Shinjuku-ku ;Tokyo, 162, JAPAN
.. . ,.Brian McCarthy: M.D.”’Me@jcal Epidemiologist,Birth Defects BranchCenter for Environmental HealthCenters for Disease Control ,, .Chamblee Building5-1600 Clifton RoadAtlanta, Georgia =30333, USA ““
Olav Meirik, M.D., Ph.D.HRPWor~d,HealthOrganizationCH-1211Geneva, SWITZERLAND
.-,..
. . . . .
. . . .
.,.. ,...
A. G. Munford, Ph.D.Department of MathematicalStatistical and OperationalResearch
Universit of ExeteriExeter, E GLAND
A. Niklasson, M.D.Department of Pediatrics IUniversity of GothenburgEast HospitalS-41685 Gothenburg, SWEDEN
Francis C. NotzonInternational Statistics StaffOffice of Planning and ExtramuralPrograms
National Center for HealthStatistics
3700 East-West Highway, Room 2-12Hyattsville, Maryland 20782, USA
Paul Placek, Ph.D.Survey Statistician, Natality BranchDivision of Vital StatisticsNational Center for Health;Statistics
3700 East-West Highway, Room 1-60 ,Hyattsville, Maryland 20782, USA
Patricia W. Potrzebowski, Ph.D.Director, Division of Health-Statistics and Research
Department of HealthP.O. Box 90Harrisburg, Pennsylvania 17108, USA
Marsden Wagner, M.D., M.P.H.“ Regional Officer
Maternal and Child Health, RegionalOffice for Europe
World Health Organization8, ScherfigsvejDK-2100 Copenhagen, DENMARK
Ms. Pnina ZadkaCentral Bureau of StatisticsHakirya--RomenaP.O. Box 13015Jerusalem, ISRAEL 92230
x
TABLE OF CONTENTS-. ..,
Preface...
.............................● .● .....*● ...● .....● .......● .● O● ● 111 ~
Acknowledgments,,
● ....● ● .● ...● ● .● ....*O● .● .● ● .● ..● .*.....● 0.● ..● .*..... v’
Contributors...............,..............*..................*..*.● .. vii
Participants............*..,..........● ...● . . . ● . ● . . ● . ., . . . , , . ● . ...*.. ix.
Risk Factor/Outcome Assessment. .
Recent Progress of Maternal and Child Health in Japan................ I-3
Israel: The National Program for Reduction of Infant Mortalicy.:.... I-47
Methodology
Perinatal Audit Experience in Norway: A Model for InternationalApplication....● ....*..,.*.........................● *.......● ....*.*. II-3., . ..
Scottish Perinatal Mortality Survey: Results From 1984.............. 11-21
A Methodology for Evaluating Size at Birth......● ...● ..........● ..... 11-31”
Comparisons of Trends and Data on Perinatal and Infant Uortal ityr-
Comparison of Cesarean Trends and Pregnancy Outcome in SelectedStates.● s● ...● ● .● *● .● ● ...● ....● ● ........● ....● ..● .....● .● .*..● ● ....0 1’11-3
Trends in Birth Weight Distribution: 1970-83........................ ‘111-37
Trends in Birth Weight-Specific Perinatal Mortality Rates, 1970-83... ~ 111-51,:
Comparative Health Care Systems
Having a Baby in Europe: Lessons for North America.................. IV-3
Birth Weight-Specific Mortality Through the Fifth Year of Life inSweden: 1973-81.........*..............● ...............● ........... IV-15
Detection, Monitoring, and Care of High-Risk Pregnancies in Sweden... IV-19
xi
Chapter 1: Risk Factor/OutcomeAssessment
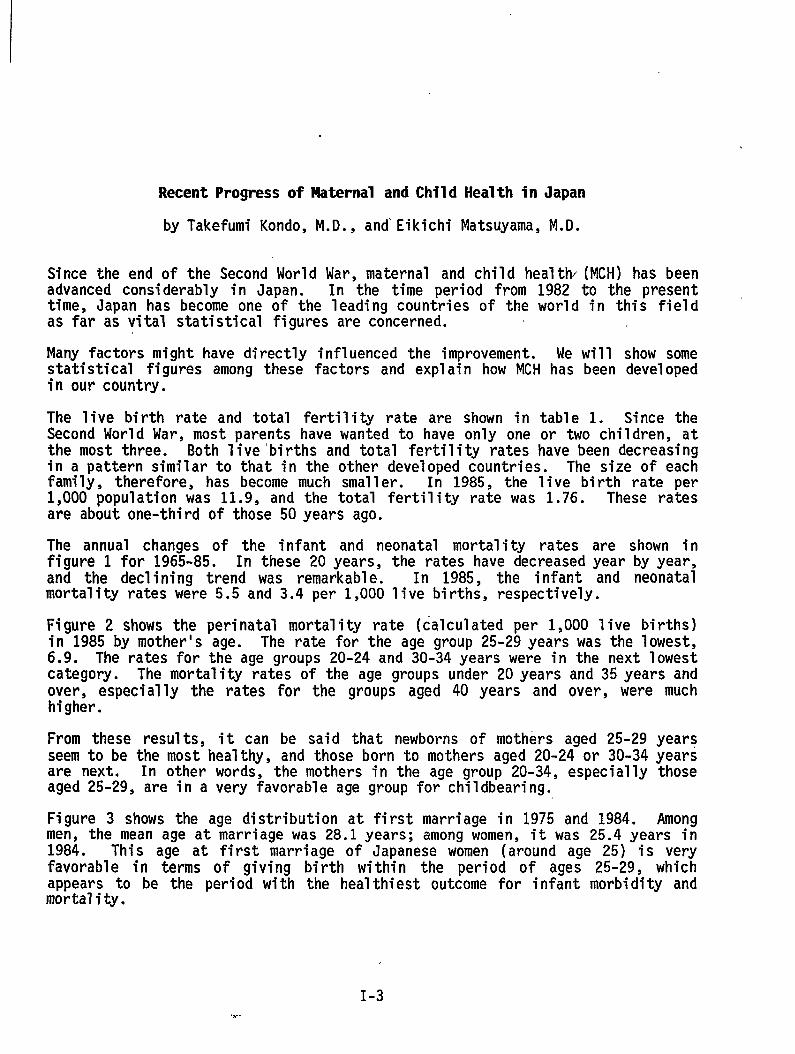
Recent Progress of Maternal and Child Health in Japan
by Takefumi Kondo, M.D., and’Eikichi Matsuyama, M.D.
Since the end of the Second World War, maternal and child health/(MCH) has beenadvanced considerably in Japan. In the time period from 1982 to the present ,time, Japan has become one of the leading countries of the world in this fieldas far as vital statistical figures are concerned.
Many factors might have directly influenced the improvement. We will show somestatistical figures among these factors and explain how MCH has been developedin our country.
The live birth rate and total fertility rate are shown in table 1. Since theSecond World War, most parents have wanted to have only one or two children, atthe most three. Both live ’births and total fertility rates have been decreasingin a pattern similar to that in the other developed countries. The size of eachfamily, therefore, has become much smaller. In 1985, the live birth rate per1,000 population was 11.9, and the total fertility rate was 1.76. These ratesare about one-third of those 50 years ago.
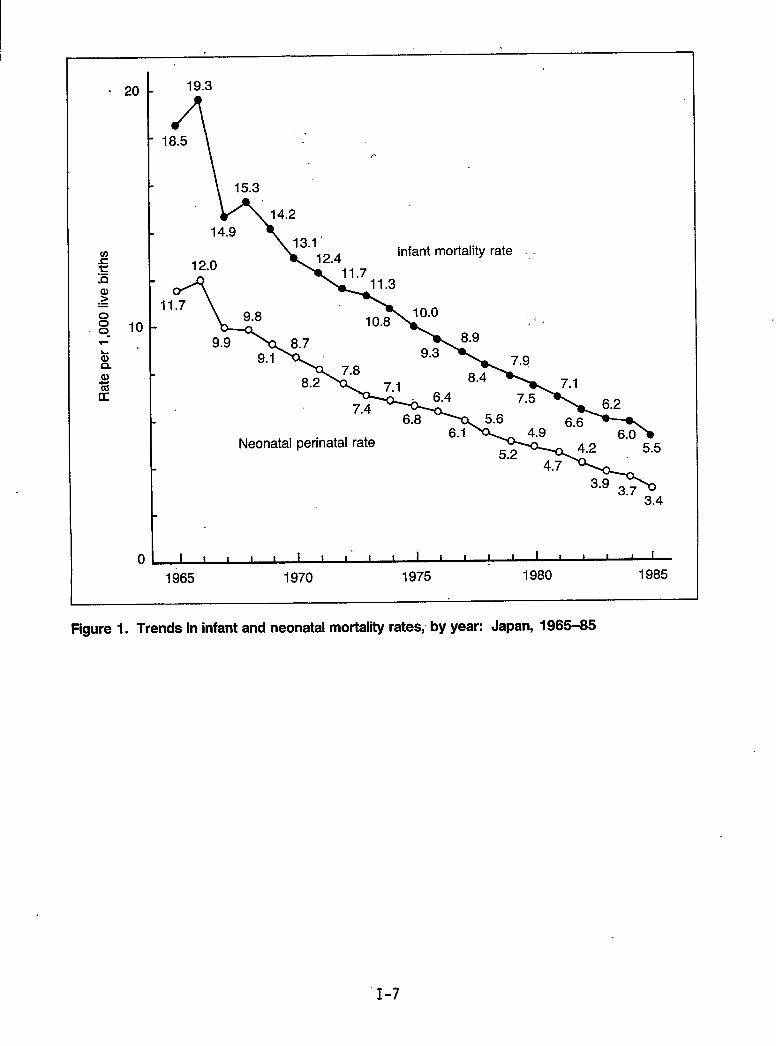
The annual changes of the infant and neonatal mortality rates are shown infigure 1 for 1965-85. In these 20 years, the rates have decreased year by year,and the declining trend was remarkable. In 1985, the infant and neonatalmortality rates were 5.5 and 3.4 per 1,000 live births, respectively.
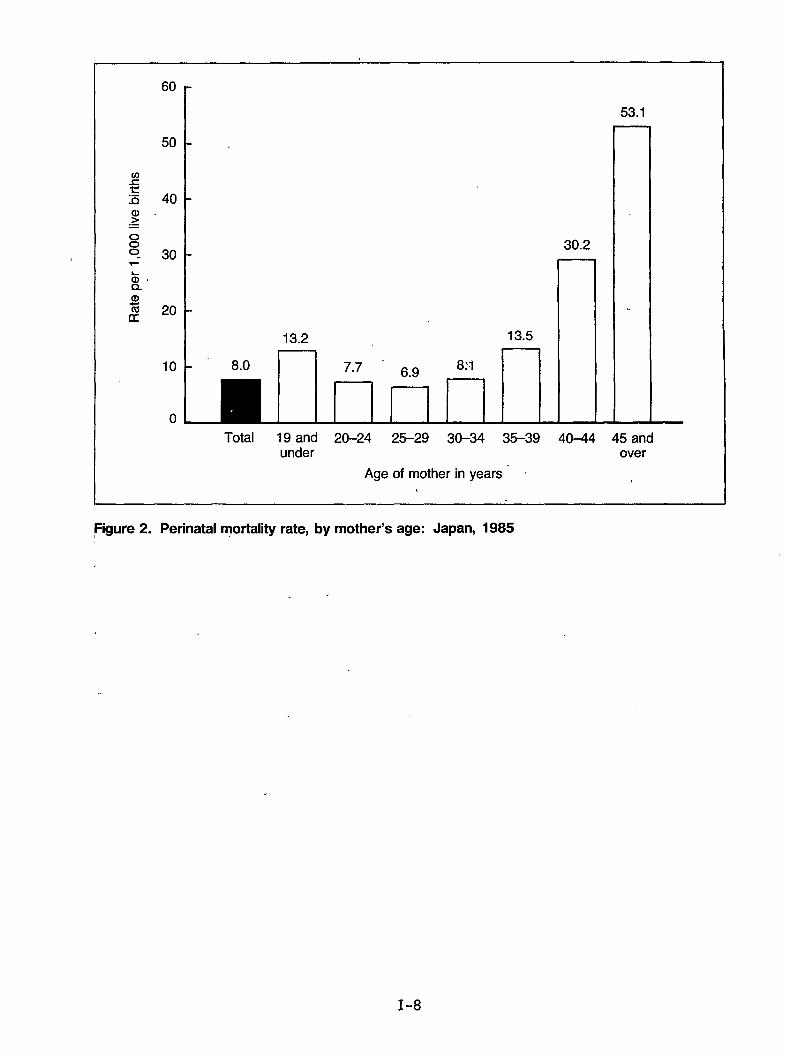
Figure 2 shows the perinatal mortality rate (calculated per 1,000 1ive births)in 1985 by mother’s age. The rate for the age group 25-29 years was the lowest,6.9. The rates for the age groups 20-24 and 30-34 years were in the next lowestcategory. The mortality rates of the age groups under 20years and 35years andover, especially the rates for the groups aged 40 years and over, were muchhigher.
From these results, it can be said that newborns of mothers aged 25-29 yearsseem to be the most healthy, and those born to mothers aged 20-24 or 30-34 yearsare next. In other words, the mothers in the age group 20-34, especially thoseaged 25-29, are in a very favorable age group for childbearing.
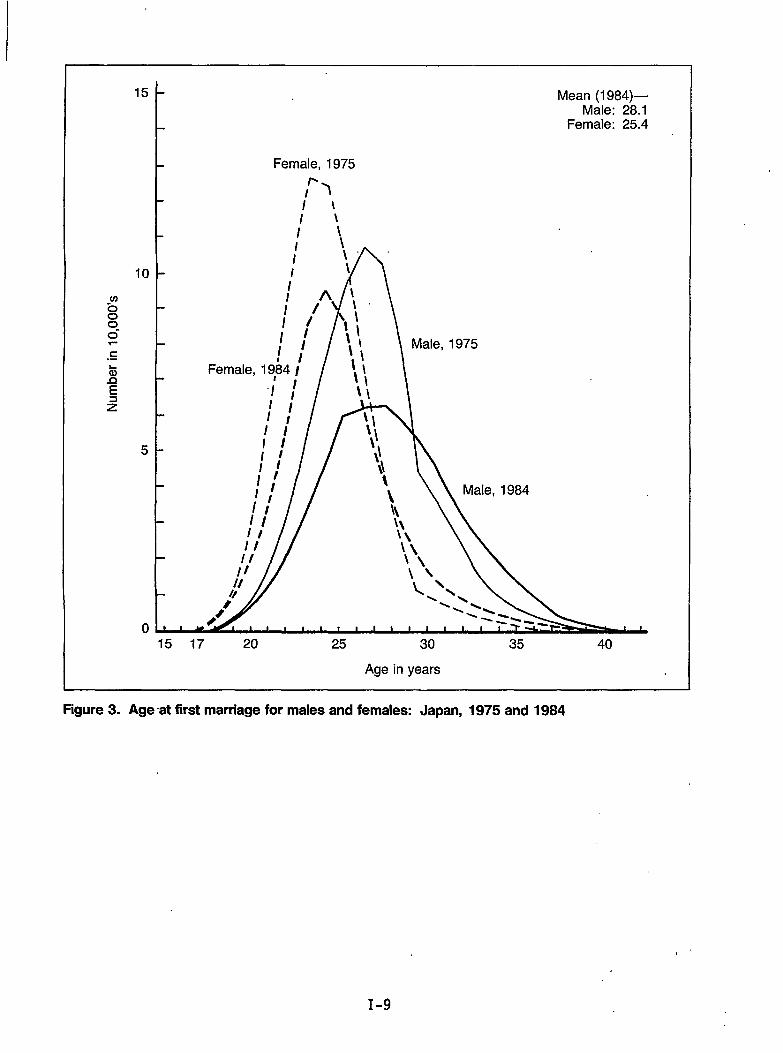
Figure 3 shows the age distribution at first marriage in 1975 and 1984. Amongmen, the mean age at marriage was 28.1 years; among women, it was 25.4 years in1984. This age at first marriage of Japanese women (around age 25) is veryfavorable in terms of giving birth within the period of ages 25-29, whichappears to be the period with the healthiest outcome for infant morbidity andmortality.
I-3
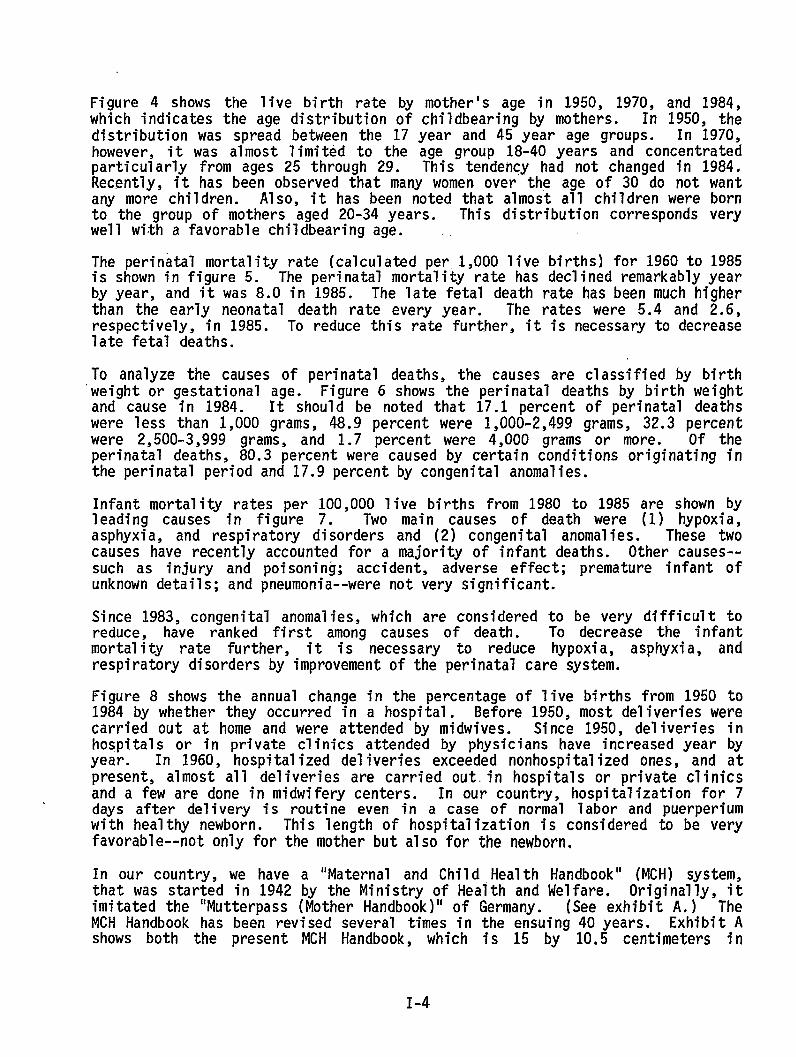
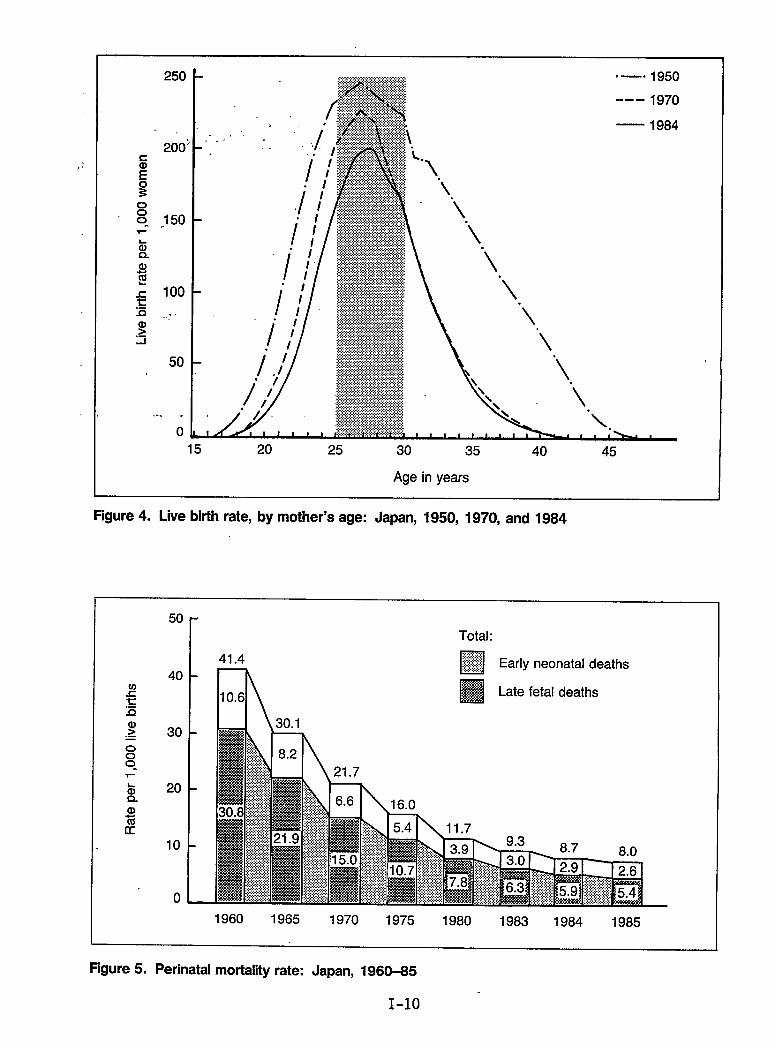
Figure 4 shows the live birth rate by mother’s age in 1.950,1970, and 1984,which indicates the age distribution of childbearing by mothers. In 1950, thedistribution was spread between the 17 year and 45 year age groups. In 1970,however, it was almost limited to the age group 18-40 years and concentratedparticularly from ages 25 through 29. This tendency had not changed in 1984.Recently, it has been observed that many women over the age of 30 do not wantany more children. Also, it has been noted that almost all children were bornto the group of mothers aged 20-34 years. This distribution corresponds verywell with a favorable childbearing age.
The perinatal mortality rate (calculated per 1,000 1ive births) for 1960 to 1985is shown in figure 5. The perinatal mortality rate has declined remarkably yearby year, and it was 8.0 in 1985. The late fetal death rate has been much higherthan the early neonatal death rate every year. The rates were 5.4 and 2.6,respectively, in 1985. To reduce this rate further, it is necessary to decreaselate fetal deaths.
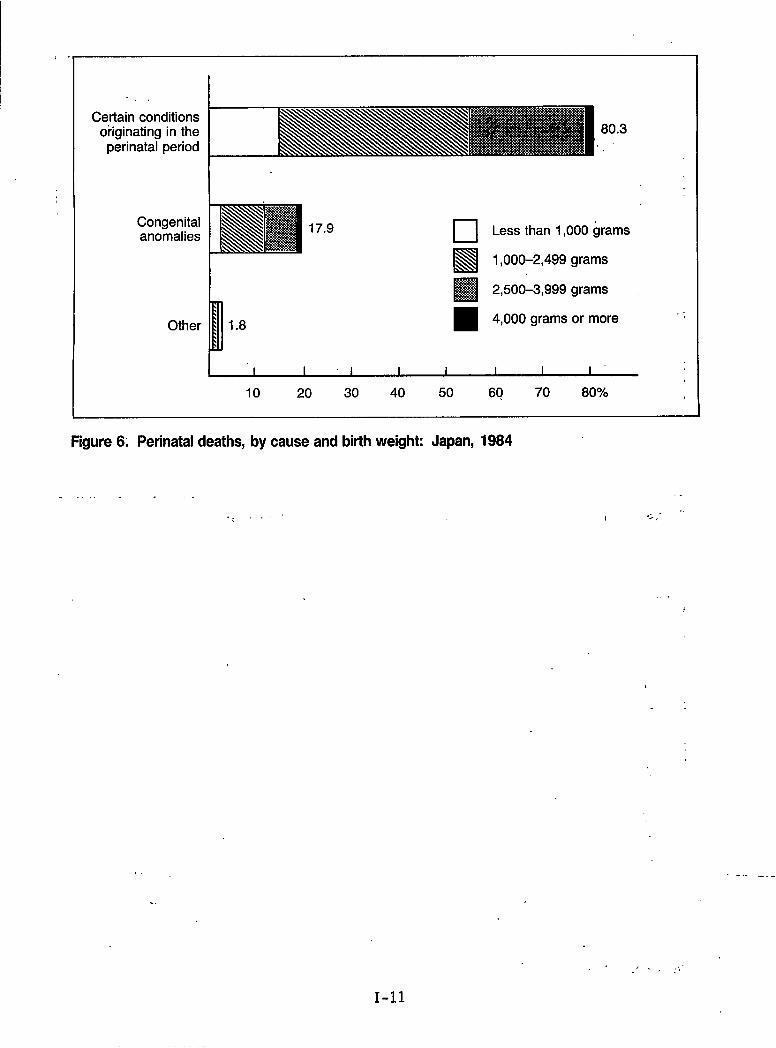
To analyze the causes of perinatal deaths, the causes are classified by birth‘weight or gestational age. Figure 6 shows the perinatal deaths by birth weightand cause in 1984. It should be noted that 17.1 percent of perinatal deathswere less than 1,000 grams, 48.9 percent were 1,000-2,499 grams, 32.3 percentwere 2,500-3,999 grams, and 1.7 percent were 4,000 grams or more. Of theperinatal deaths, 80.3 percent were caused by certain conditions originating inthe perinatal period and 17.9 percent by congenital anomalies.
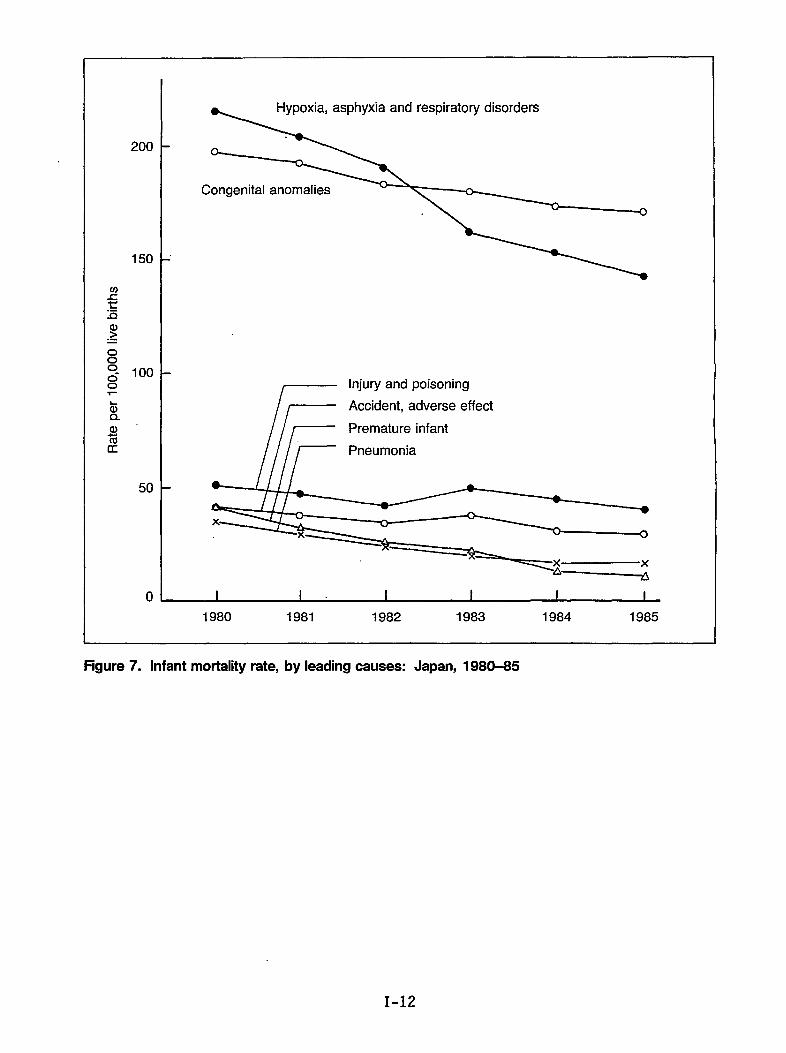
Infant mortality rates per 100,000 live births from 1980 to 1985 are shown byleading causes in figure 7. Two main causes of death were (1) hypoxia,asphyxia, and respiratory disorders and (2) congenital anomalies. These twocauses have recently accounted for a majority of infant deaths. Other causes--such as injury and poisoning; accident, adverse effect; premature infant ofunknown details; and pneumonia--were not very significant.
Since 1983, congenital anomalies, which are considered to be very difficult toreduce, have ranked first among causes of death. To decrease the infantmortality rate further, it is necessary to reduce hypoxia, asphyxia, andrespiratory disorders by improvement of the perinatal care system.
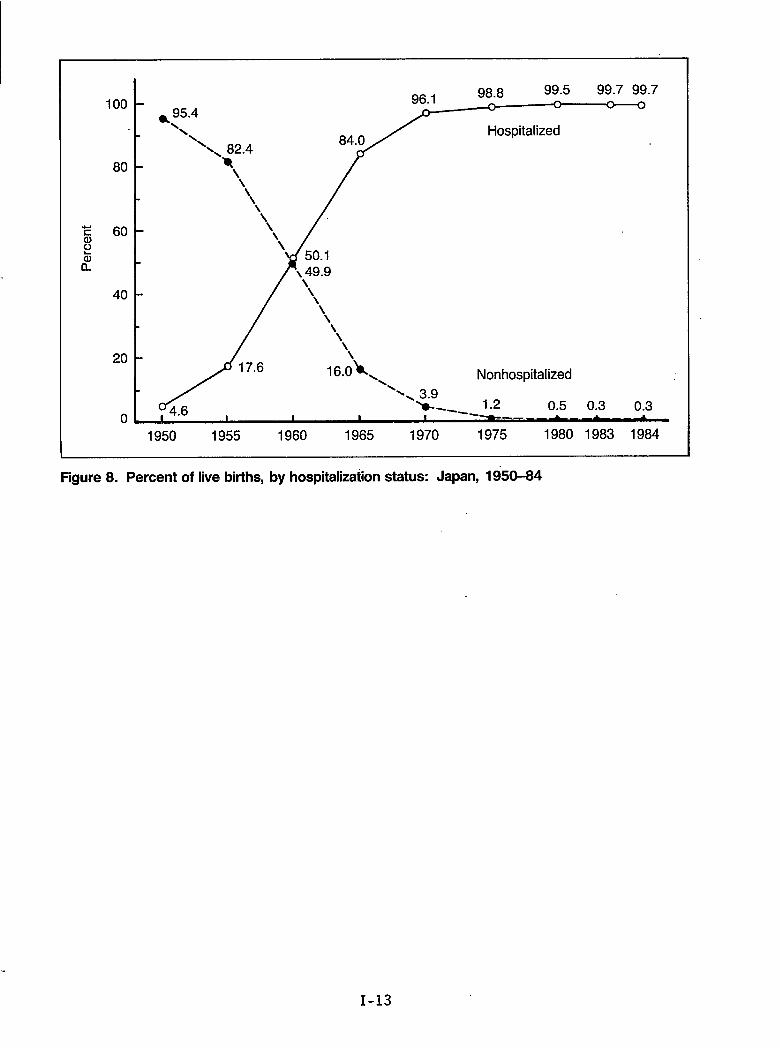
Figure 8 shows the annual change in the percentage of live births from 1950 to1984 by whether they occurred in a hospital. Before 1950, most deliveries werecarried out at home and were attended by midwives. Since 1950, deliveries inhospitals or in private clinics attended by physicians have increased year byyear. In 1960, hospitalized deliveries exceeded nonhospitalized ones, and atpresent, almost all deliveries are carried out,in hospitals or private clinicsand a few are done in midwifery centers. In our country, hospitalization for 7days after delivery is routine even in a case of normal labor and puerperiumwith healthy newborn. This length of hospitalization is considered to be veryfavorable--not only for the mother but also for the newborn.
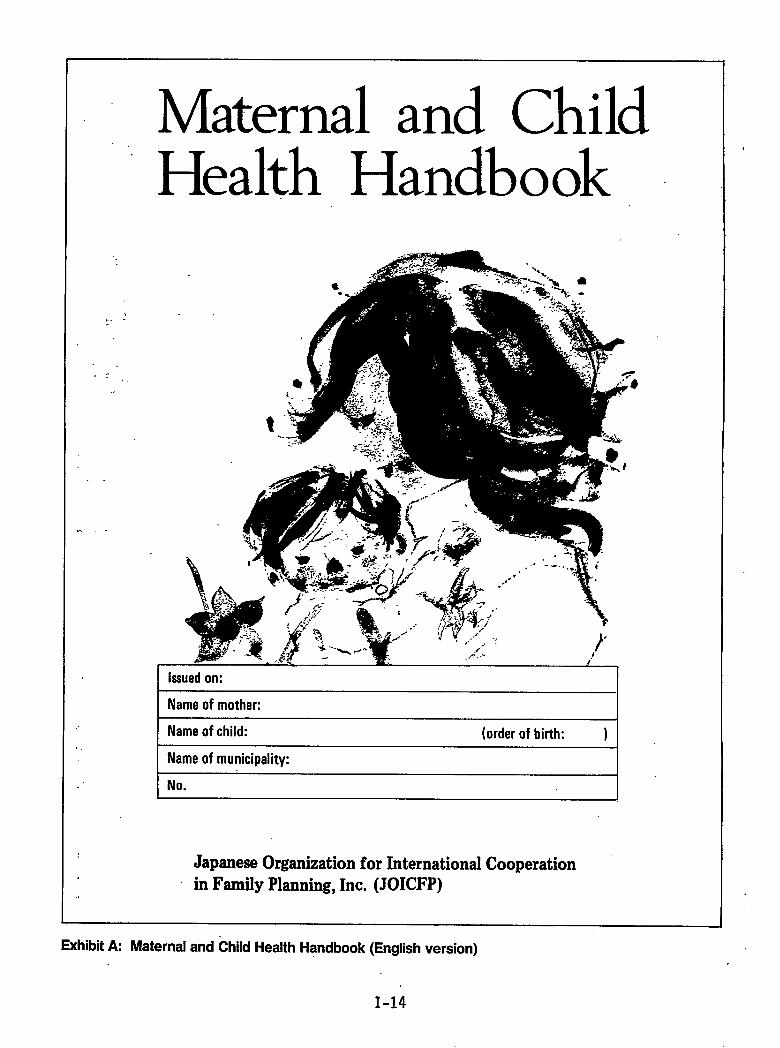
In our country, we have a “Maternal and Child Health Handbook” (MCH) system,that was started in 1942 by the Ministry of Health and Welfare, Originally, itimitated the “Mutterpass (Mother Handbook)” of Germany. (See exhibit A.) TheMCH Handbook has been revised several times in the ensuing 40 years. Exhibit Ashows both the present MCH Handbook, which is 15 by 10.5 centimeters in
1-4
size and contains’56 pages, and the English version. When a woman becomespregnant, she can get this handbook free of charge from the local governmentaloffice. The pregnant woman then takes it to the hospital for each medicalexamination. Results of:prenatal and postnatal examinations of the mother,status of labor, and growth conditions, as well as vaccinations for infants, arerecorded in this handbook’.
This MCH Handbook system has been useful in improving the level ofMCH care. Itis valued highly both at home and abroad. In addition to administrative organs,many private organizations, such as the Japan Medical Association, JapanAss~ciation for M~ternal Welfare. Ja~an Famil.vPlanninq Association for MaternalWelfare, Japancooperated withactivities haveof MCH.
In the future,deaths, and congenital anomalies. Because we have found the Maternal and Ctii1dHealth Handbook to be so useful in ourpursuit of the reduction of perinatal andinfant mortality, we have attached this document for your review.
Family Planning- As’sociation-,and tfie MCH Association, havethe” government on’ both the central and local level. Theirbeen very effective for motivation, information, and promotion
we will make efforts to reduce maternal deaths, late fetal
I-5
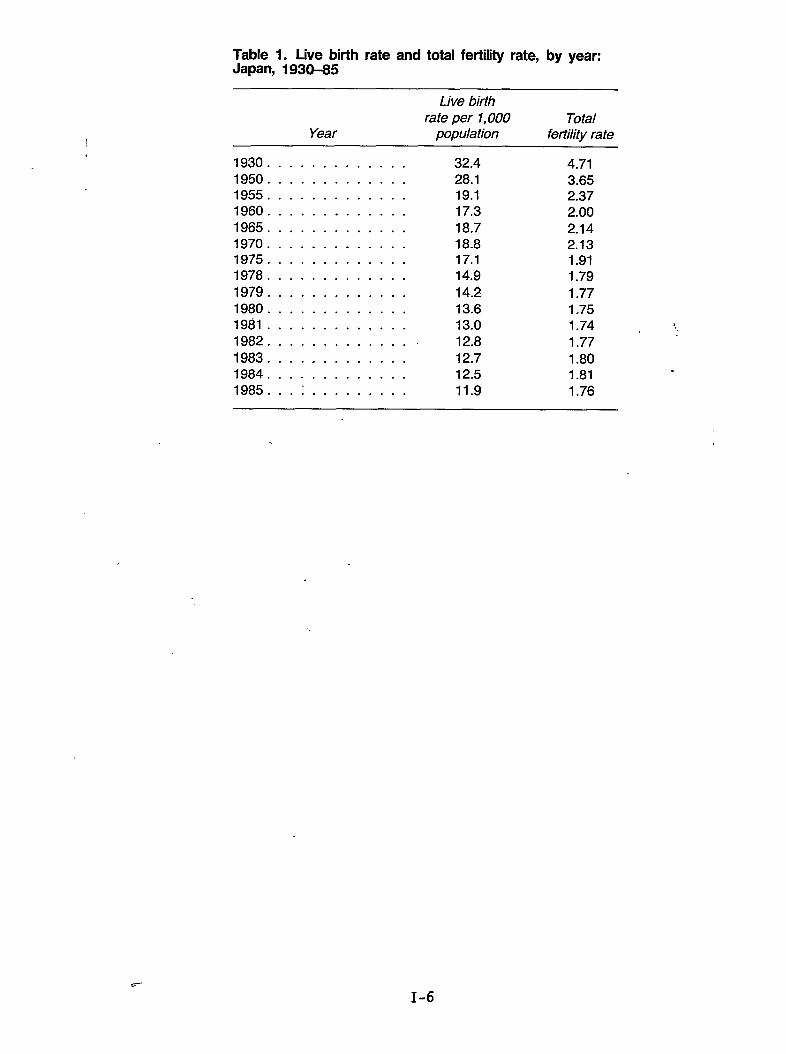
Table 1. Live birth rate and total fertility rate, by year:Japan, 1930-35
Live birthrate per 1,000 Total
Year population fertility rate
1930 . . . . . . . . . . . . . 32.4 4.711950 . . . . . . . . . . . . . 28.1 3.651955 . . . . . . . . . . . . . 19.1 2.371960 . . . . . . . . . . . . . 17.3 2.001965 . . . . . . . . . . . . . 18.7 2.141970 . . . . . . . . . . . . . 18.8 2.131975 . . . . . . . . . . . . . 17.1 1.911978 . . . . . . . . . . . . . 14.9 1.791979 . . . . . . . . . . . . . 14.2 1.771980 . . . . . . . . . . . . . 13.6 1,751981 . . . . . . . . . . . . . 13.0 1.74 $.1982 . . . . . . . . . . . . . . 12.8 1.771983 . . . . . . . . . . . . . 12.7 1.801984 . . . . . . . . . . . . . 12.5 1.81
.
1985. . . : . . . . . . . . . 11.9 1.76
c-
-.
1-6
m 1 19.3
a)>.=
o00.
.“ n+~,>18.5 . .
15.3
14.2
1
10 -
/-
14.9
Infant mortality rate .,12.0
1.7
9.9
8.2
6.8
Neonatal perinatal rate6.1
5“2“’x”3.4
0 I I I I t I 1 1 1 I I I I 1 I I 1 1 1 1 I
1965 1970 1975 1980 1985
Figure 1. Trends in infant and neonatal mortality rates, by year: Japan, 1965-65
I-7
60
50
40
30
20
10
0
8.0
13.2 13.5
liibiiE
30.2
53.1
Total 19 and 20-24 25–29 30-34 35-39 40-44 45 andunder over
Age of mother in years - ~
Figure 2. Perinatal mortality rate, by mother’s age: Japan, 1985
15
10
5
0
Mean (1984)—Male: 28.1
Female: 25.4
Female, 1975
l-3Ii
\l’\\/’ \
/’/
////Iv///’/’1,//II11
\\II
/’/’II
//
15 17 20 25 30 35 40
Age in years
Figure 3. Age at first marriage for males and females: Japan, 1975 and 1984
250
200:
:50
100
.,..
50
. .
0
. .
.:,::.:,:,:.,,,,,,,,,,.,,.,.,.,.,.,.,.:.,.,.,.,.,.. . .. ... . .. “—” 1950.......................:;:~~~- ---1970$:& — 1984
‘\.u
15 20 25 30 35 40 45
Age in years
Pigure 4. Live birth rate, by mother’s age: Japan, 1950, 1970, and 1984
50
r Total:
a)isu
40
30
20
10
0
1960 1965 1970 1975 1980 1983 1984 1985
Figure 5. Perinatal mortality rate: Japan, 1960-85
1-10
,.
Certain conditionsoriginating in the
perinatal period
Congenitalanomalies
Other
80.3,,
17.9 ❑ Less than 1,000 grams
El1,000-2,499 grams
i
❑ 2,500-3,999 grams
1.8 4,000 grams or more
I I I 1 I i I 1 I
10 20 30 40 50 60 70 80%
Figure 6. Perinataldeaths, by cause and birthweight: Japan, 1984
. . ..
. ..$’“
,.,
. .
. .
-—. _ ._
.,/ ., ,.,,.-
1-11
.“
.
Hypoxia, asphyxia and respiratory disorders
o
Congenital anomalies
I’mInjury and poisoning
Accident, adverse effect
Premature infant
●
I I 1 1 i I
1980 1981 1982 1983 1984 1985
Figure 7. Infant mortality rate, by leading causes: Japan, 1980-85
1-12
100
80
40
20
0
* 95.4‘\ Hospitalized
\\
\
Nonhospitalized
0.5 0.3 0.3
1950 1955 1960 1965 1970 1975 1980 1983 1984
Figure8. Percent oflivebirths, byhospitalizadon status: Japan, 1950-84
1-13
Maternal and childHealth Handbook
,.
. .
. ... ...
. . .
-I Issued on: I
Nameof mother: INameof child: (orderof birth: )
.,Nameof municipality:
No.
Japanese Organization for International Cooperation.
in Family Planning, Inc. (JOICFP)
Exhibit A: Maternal and Child Health Handbook (English version)
1-14
l-l
Im
. . ., -. /
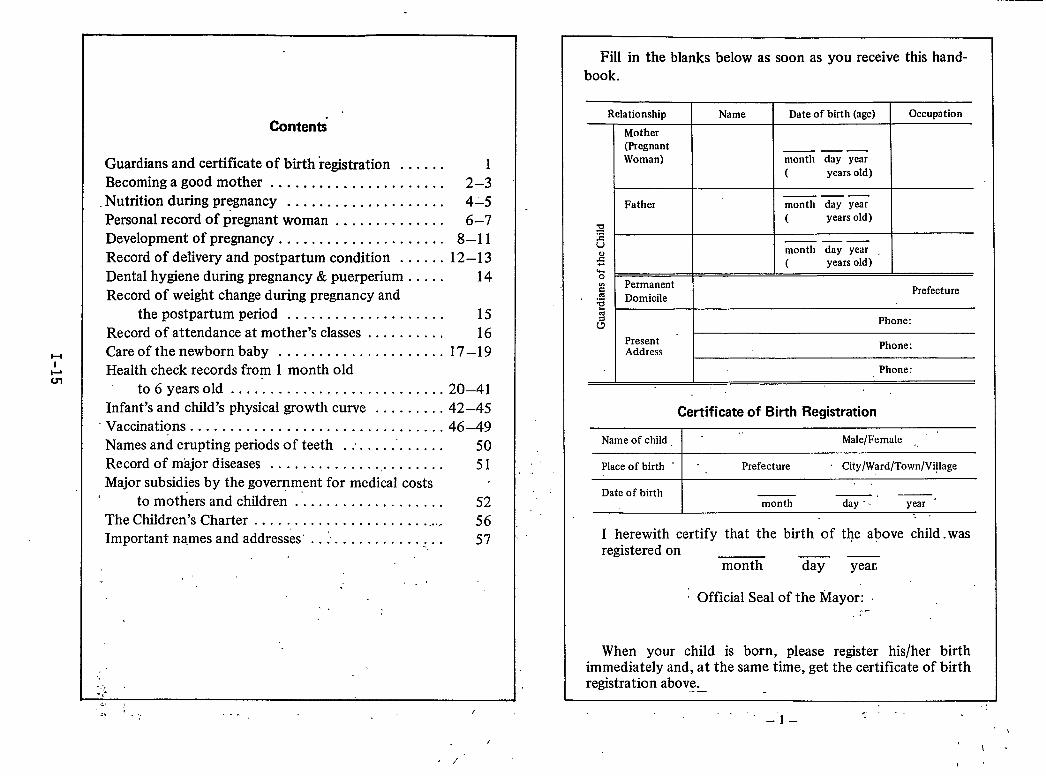
Contents-
Guardians and certificate of birth registration . . . . . . 1Becoming a good mother . . . . . . . . . . . . . . . . . . . . . . 2–3
.Nutrition during pregnancy . . . . . . . . . . . . . . . . . . . . 4-5Personal record of pregnant woman . . . . . . . . . . . . . . 6–7Development of pregnancy . . . . . . . . . . . . . . . . . . . . . 8–11Record of delivery and postpartum condition . . . . . . 12–13Dental hygiene during pregnancy & puerperium . . . . . 14Record of weight change during pregnancy and
thepostpartum period . . . . . . . . . . . . . . . . . . . . 15Record of attendance at mother’s classes . . . . . . . . . . 16Careofthe newborn baby . . . . . . . . . . . . . . . . . . . ..17–19Health check records from 1 month old
to6 years old . . . . . . . . . . . . . . . . . . . . . . . . . ..20–41Infant’s and child’s physical growth curve . . . . . . . . . 42–45
“Vaccinations . . . . . . . . . . . . . . . . . . . . . . . . . . . . . . ..46–49Names and erupting periods of teeth . .. . . ..’...... 50Record ofmajor diseases . . . . . . . . . . . . . . .. . . . . . . . 51Major subsidies by the government for medical costs “
tomothers and children .’...... . . . . . . . . . . . . 52The Children’s Charter . . . . . . . . . . . . . . . . . . . . 56. . .....Important names and addresses’ . . ;. . . . . . . . . . . ~,. . 57
,,. ,.,,“
.,.
Fill in the blanks below as soon as you receive this hand-book.
Relationship Nmne Date of birth (age) Occupittiort
Mother(Pregnant —..Woman) month day yew
( years old)
I I I —. —Father month ddy yew I
m( years old)
=6
_— —month day yem
.8 ( years old)G. I I I. Iz I Permanentg Domicile I Prefecture
I PresentAddress I Phone:
Phone:
Certificate of Birth Registration
Name of child. I “ ‘‘ Male/Female , “
Place of birth ‘ I ‘. Prefecture City/Ward/Town/Village
Date of birth —, —month day -. year “
-. ,
I herewith certify that the birth of the above child. wasregistered on ——
month day year,
Official Seal of the Mayor:. .-,.
When your child is born, please register his/her birthimmediately and, at the same time, get the certificate of birth iregistration above..—
..- . . . .–’l–
,
, /,

uI
1+u)
We sincerely hope that this handbook can become a usefulreference to many countries in the world and help all thechildren in the world to have healthy and happy lives.
Aprd 1, 1987
Takefumi Kondo M.D.DirectorMaternal and Child Health DivisionChildren and Families BureauMinistry of Health and WelfareGovernment of Japan
I II fBo)l%4J II ,\.lJtiz ............................................. II I
I ililxmwl II 1I No. II I
The picture aboveshows the actual size of the “Boshi Kenko Te~ho~’
.
nI
u
Note: Translated from the Japanese version of the“Boshi Kenko Techo” (Maternal and Child
Health Handbook) which is published bythe Ministry of Health and Welfare.
No pan of this handbook may be copied orreproduced without permission’of 30 ICFP.
... I
,.
Preface for English version
Everybody, particularly family of a newborn baby, hopesthat a-baby will grow up healthy and strong.
The maternal and child health programs in Japan havemade steady progress, having overcome the chaotic periods.,after World War II when there was a serious food shortageand communicable diseases were rampant.
The “Maternal and Child Health Handbook” has been agreat driving force in the progress of our maternal and childhealth programs. Its provision is stipulated in the Maternaland Child Health Law.
The handbook is issued by the prefectural governor to apregnant woman when she submits a report to the municipaloffice, who, in turn, reports to the governor.
The handbook is made, in a compact size, convenient tocarry. It is used to fill in the results of health check-ups andhealth guidance which the pregnant woman/mother andbaby receives from doctors, dentists, midwives; or public
health nurses. The mother’s obse~~tions on ths growth ofthe baby can be also freely recorded. -When used faithfully,it can be a complete digest of all the necessary items” on thehealth of a mother and baby. ..
The system of distributing the Maternal and Child HealthHandbook to all pregnant women was begun in 1942.
The contents of the handbook have been updated severaltimes including the most recent made in April 1987, althoughits objectives remain unchanged: to maintain and promotethe health of a“:mother and baby. Continuing-efforts will bemade to keep it, up-to-date.in the future.
,- ...:.
,: , ... .,. . z
. . -- .-,
l-l
I
co
Protect the Health of Both Mother and
Child and Build a Happy Family
About the Maternal and Child Health Handbook
o The purpose of this handbook is to help protect the health
of both mother, and child. As soon as it is issued to you,read through it carefully, and then fill in the necessary
items in the blank spaces as required.
o This handbook is importan~ as a health record for bothmother and child, Please bring, this handbook with youwhenever you and/or your child , receive any kind ofhealth check-up or guidance, and ask the medical doctor orhealth workers to fill in the necessary items. Please alsouse this handbook for your own notes about you and yourbaby, the results of check-ups, etc.
o Because this handbook will be used in the future as a refer-ence for medical history when your child enters nursery,kindergarten, and primary school, please be careful not tolose it,
o If you are pregnant with twins or multiple fetuses, pleaseask your municipal office to issue a handbook for eachbaby.
o If this handbook is torn, soiled or lost, please ask yourmunicipal office to re-issue it.
o If you have any questions about this handbook, pleaseinquire at the health center or municipal office whereyou received it.
Maternal and ChildHealth Handbook
Edited byEikichi Matsuyarna,M.D.
Executive Director,Japan Association for MaternalWelfare
&EnglishTranslationby
JOICFP
H
I
G
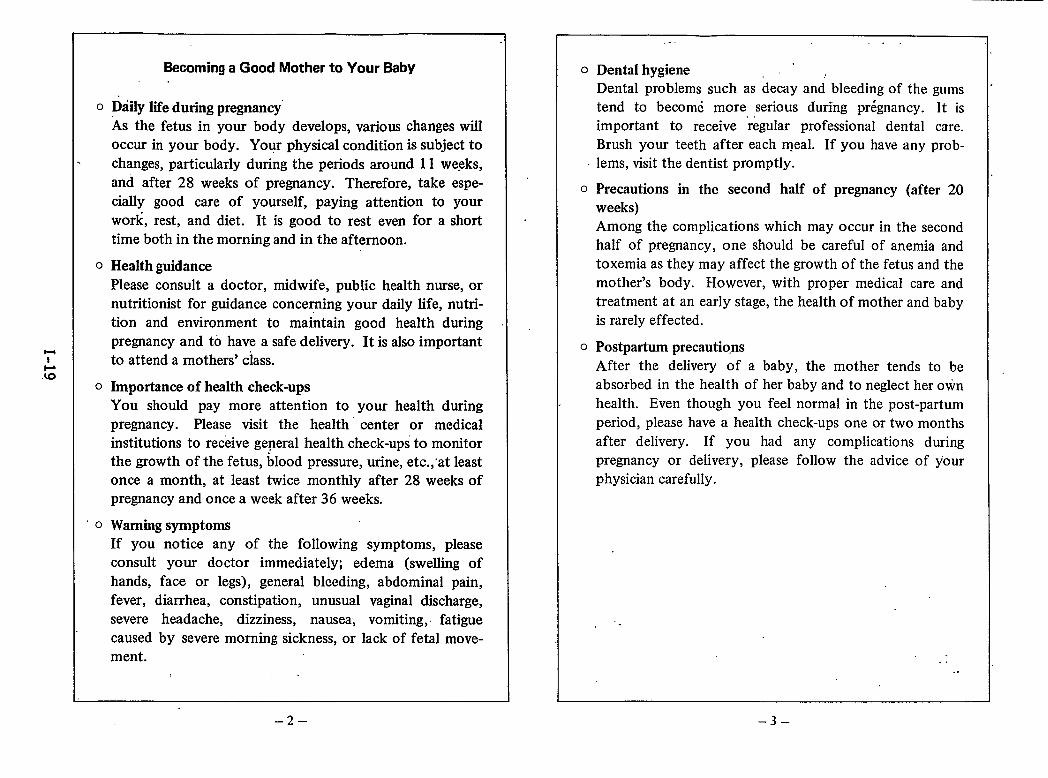
Becoming a Good Mother to Your Baby
o Daily life during pregnancy’As the fetus in your body develops, various changes willoccur in your body. Your physical condition is subject tochanges, particularly during the periods around 11 weeks,and after 28 weeks of pregnancy. Therefore, take espe-cially good care of yourself, paying attention to yourwork, rest, and diet. It is good to rest even for a shorttime both in the morning and in the afternoon.
o Health guidancePlease consult a doctor, midwife, public health nurse, ornutritionist for guidance concerning your daily life, nutri-tion and environment to maintain good health duringpregnancy and to have a safe delivery. It is also importantto attend a mothers’ class.
o Importance of health check-upsYou should pay more attention to your health duringpregnancy. Please visit the health center or medicalinstitutions to receive general health check-ups to monitorthe growth of the fetus, blood pressure, urine, etc.,”at leastonce a month, at least twice monthly after 28 weeks ofpregnancy and once a week after 36 weeks.
o WarningsymptomsIf you notice any of the following symptoms, pleaseconsult your doctor immediately; edema (swelling ofhands, face or legs), general bleeding, abdominal pain,fever, diarrhea, constipation, unusual vaginal discharge,severe headache, dizziness, nausea, vomiting, fatiguecaused by severe morning sickness, or lack of fetal move-ment.
. . . .
0 Dental hygiene .’Dental problems such as deedy and bleeding of the gumstend to become more serious during pr;gnancy. It is.important to receive regular professional dental care.Brush your teeth after each meal. If you have any prob-lems, visit the dentist promptly.
o Precautions in the second half of pregnancy (after 20weeks)Among the complications which may occur in the secondhalf of pregnancy, one should be careful of anemia andtoxemia as they may affect the growth of the fetus and themother’s body. However, with proper medical care andtreatment at an early stage, the health of mother and babyis rarely effected.
o Postpartum precautionsAfter the delivery of a baby, the mother tends to beabsorbed in the health of her baby and to neglect her ownhealth. Even though you feel normal in the post-partumperiod, please have a health check-ups one or two monthsafter delivery. If you had any complications duringpregnancy or delivery, please follow the advice of yourphysician carefully.
,-
,. ,...
–2– -3–

u
ILo
Nutrition during Pregnancy
o Eat well-balanced meals
Your meals slioukl be nutritionally welI-baIanced, combin- ‘ing the six basic fimcl groups lkted~cm the opposite page.
o To prevent anemiai
Intake of good’ quality protein, iron and vitamins helps topreyenti anemia. The foods which contain plenty ofthese nutrients me eggs, meat, liver,, soybeans, green andyqllo,w vegetables,. fruits and seaweed.
o To) prevent toxemia
For the prevention. of taxemia in pnegpancy, eat foodssuch as lean meats and fish, dairy products, soybeanproducts, vegetables and fruits. Avoid excessive intake ofcarbohydrates (e.g., rice), sugar, sweets, and salt.
Six Basic Food Groups
Groups Examples
fish, meats, eggs fish, shellfish, squid, octopus, crab, etc.
1soybeans beef, pork, chicken, ham, sausage,etc.
chicken eggs,quail eggs,etc.soybeans, bean curd, etc.
milk, dairy milk, skimmed milk, cheese, yoghurt, etc.2 products dried sardines, pond smelt, dried whitebait,
small fish etc. (including various seaweeds)
3green and yellow carrots, spinach, squash, tomatoes, komatsunavegetables (a kind of Chinese mustard), etc.
other vegetables radishes, chinese cabbage, cabbage, cucumbers,
4 fruitsetc.tangerines, apples, pears, grapes, strawberries,etc.
rice, bread, rice, bread, noodles, buckwheat, spaghetti, etc.
5noodles, sweet potatoes, potatoes, tares, etc.potatoes (includes sugar and foods which contain sugar
such as confectioneries)
oils and fats vegetable oil, salad oil, lard, butter, margarine,
6etc.(including foods which contain a lot of oilsuch as mayonnaise and dressing)
* It is desirable to drink 200 to 300 ml of milk daily during the fir&half of pregnancy (until 19 weeks) and ,400 ml of milk daily duringthe second half of pregnancy (after 20 weeks).
–4– -.s–
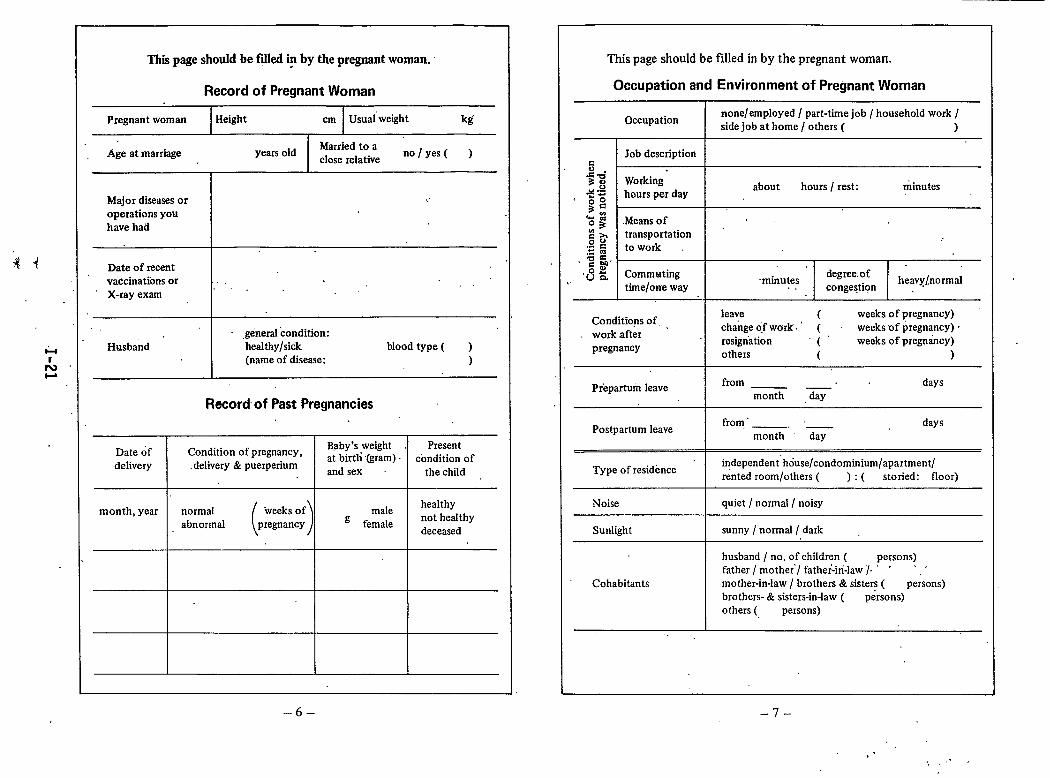
Thii page should be fflled @ by the pregnant woman.
Record of Pregnant Woman
Pregnant woman Height cm Usuaiweight kg
Age at marriageMarried to a
years oldclose relative
no/yes( )
Major diseases or ,.
operations youhave had
Date of recentvaccinations or .,X-ray exam
1.. .
. .,genersl condition:
Husband healthy/sick blood type ( )(name of disease: )
Record of Past Pregnancies
Date df Condition of pregnancy,Baby’s weight . Present
delivery delivery & puerperiumat birth (gram) condition ofand sex the child
month, year normal
( )
healthy“weeksof male
abnormal pregnancy g femalenot heahhydeceased
–6–
This page should be filled in by the pregnant woman.
Occupation and Environment of Pregnant Woman
Occupationnone/employed / part-time job / household work /side job at home/ others ( )
Job description.5.5% Working+ .s hours per day
about hours / rest: minutes
s:
=: .Means of .,
:5 transportation
:2 5 to work.;+-,~ ~ Commuting
,.degree of -
,.time/orre way
-minutes heavy~normal. . congestion
Conditions of, ,leave t weeks of pregnancy)
work afterchange o,f wdrk. ‘ ( weeks of pIegnancy) -
pregnancyresignation “(” weeks of pregnticy)others ( )
,.
Preparturn leavefrom days——
month day
Postpartum leavefrom,’ _ days
month day
Type of residenceindependent” house/condominium/apartment/rented room/others ( ) : ( storied: floor)
Noise quiet / normal/ noisy
Sunlight sunny / normal / dark
husband / no. of children ( persons)father / mothe~/ father-in-law ~, ‘ ‘ ‘
.—Cohabitants mother-in-law / brothers & sisters ( persons)
brothers- & sisters-in-law ( persons)others ( persons)
.,
–7–
>’ . .“.. ,
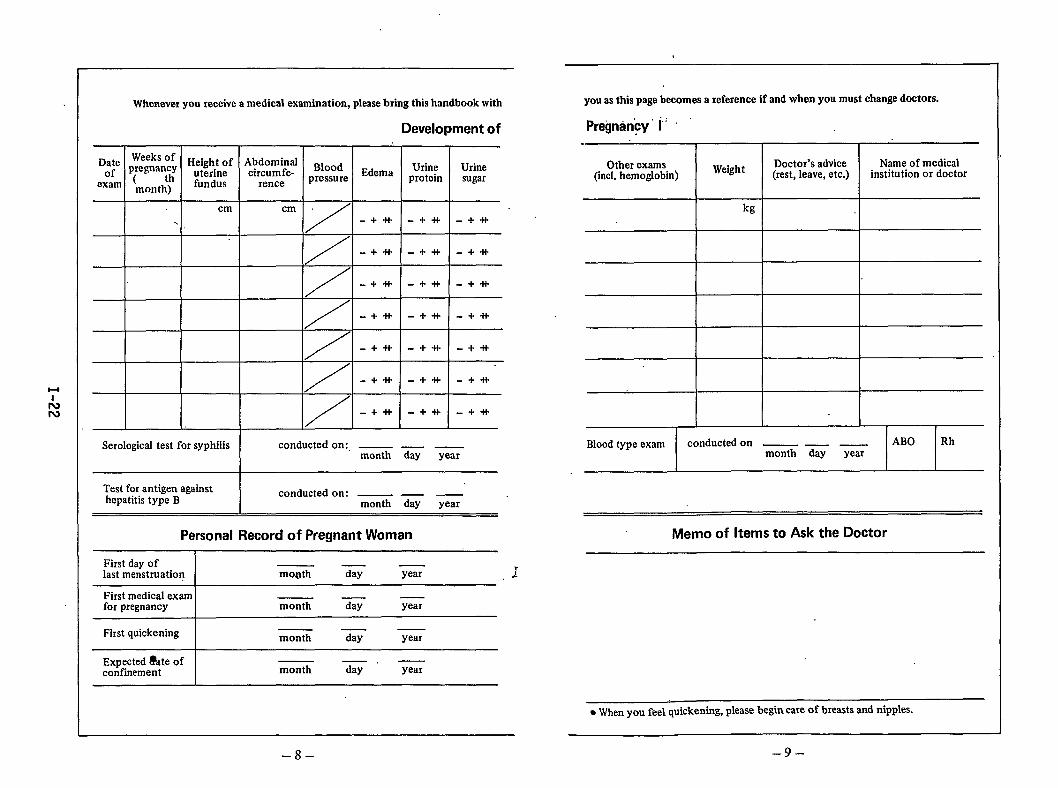
you as thk page becomes a reference if and when you must change doctors.Whenever you receive a medical examination, please bring this handbook with
Pregnancy’ 1; ‘
‘===7=
Development of-
EdemaWeeks of Height of Abdominalpregnantly uterine circumfe- Blood( fundus rence pressuremonth)
Dateof
exam
Doctor’s advice(rest, leave, etc.)
Name of medicalinstitution or doctor
Urineprotein
Urinesugar
cm
/
cm.
/
/
/
/
/
/
+
-++-+* -+*
-+*--w+i- -+*
-+it -+* -+*
-+tl- -+* -+-H-
-+-It
-+*
-+*
-+tt
-+*
-+*
-+*
-+*
-+*I
Blood type exam conducted on — — ———month day year
Serological test for syphilis conducted on:, ABO Rh— - ——month day year
I
Test for antigen againsthepatitis type B
conducted on: — — —month day year
Memo of Items to Ask the DoctorPersonal Record of Pregnant Woman
First day oflast menstruation I mo@h G G 7.+
First medical examfor pregnancy month G year
First quickening I ——month day year
Expected i%te ofconfinement month %“ year
. When YOUfeel quickening, please begin =re of breasts and niPPles.
–9––8-
,.
Dateof
exam
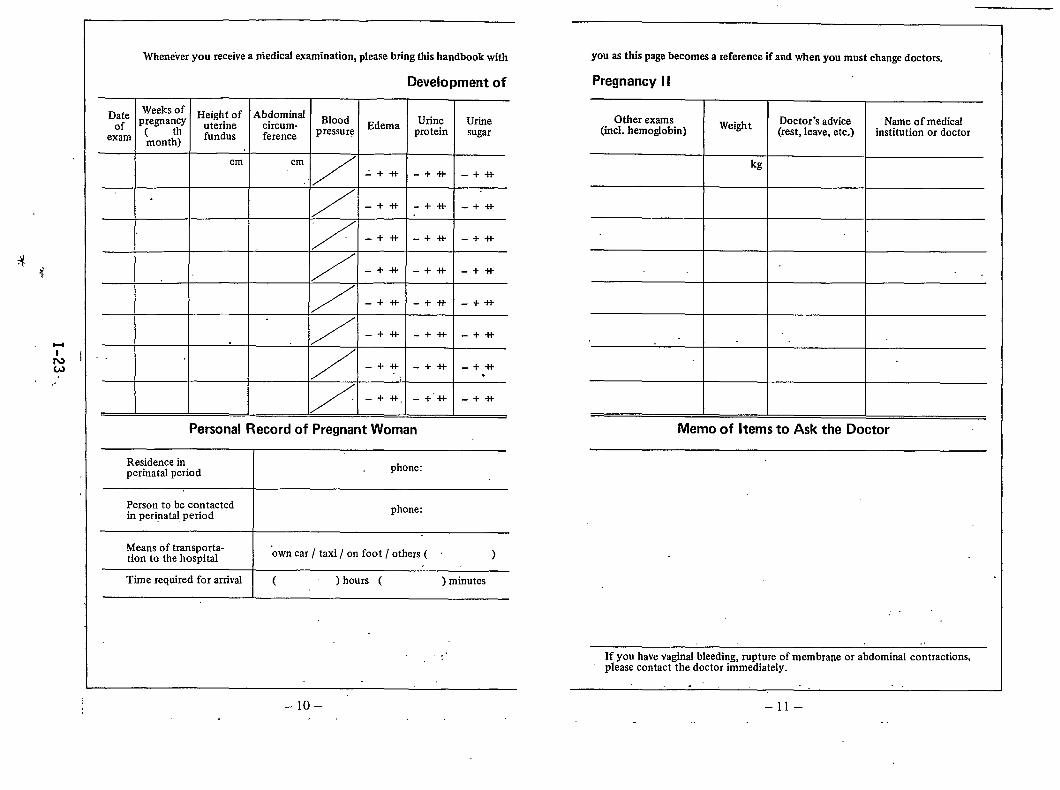
Whenever you receive a medical examination, please bring this handbook with
Development of
weeks Of Height of Abdominalpregna~y uterine circum- Blood Edema Urine( fundus ference pressure proteinmonth)
/-.++! -+-t+
/-.+* -i-+l-
/ -++ -+*
/-+* .-+*
/-+* -++’+
/ -+*: _ +++
Personal Record of Pregnant Woman
Residence inperinatrd period I phone:
Urinesugar
-+++
-+*
-+*
-+++
+*
.- +-H-
-+-++“
-+++
Person to be contactedin perinatal period I phone:
youasthis page becomes a reference if and when you must change doctors.
Pregnancy II
I I
Other examsWeight Doctor’s advice
(incl. hemoglobin) (rest, leave, etc.)
I I
kg
I I
Name ofmedicelinstitution or doctor
Memo of Items to Ask the Doctor
Means of transporta-tion to the hospital I “owncar / taxi / on foot / others ( )
I
Time required for arrival ( ) hours ( ) minutes
.- .
,,.
[1 –lo–
.
,,
If you have vaginal bleeding, rupture of membrane or abdominal contractions,please contact the doctor immediately.
.,, , ., . .
–11–
H
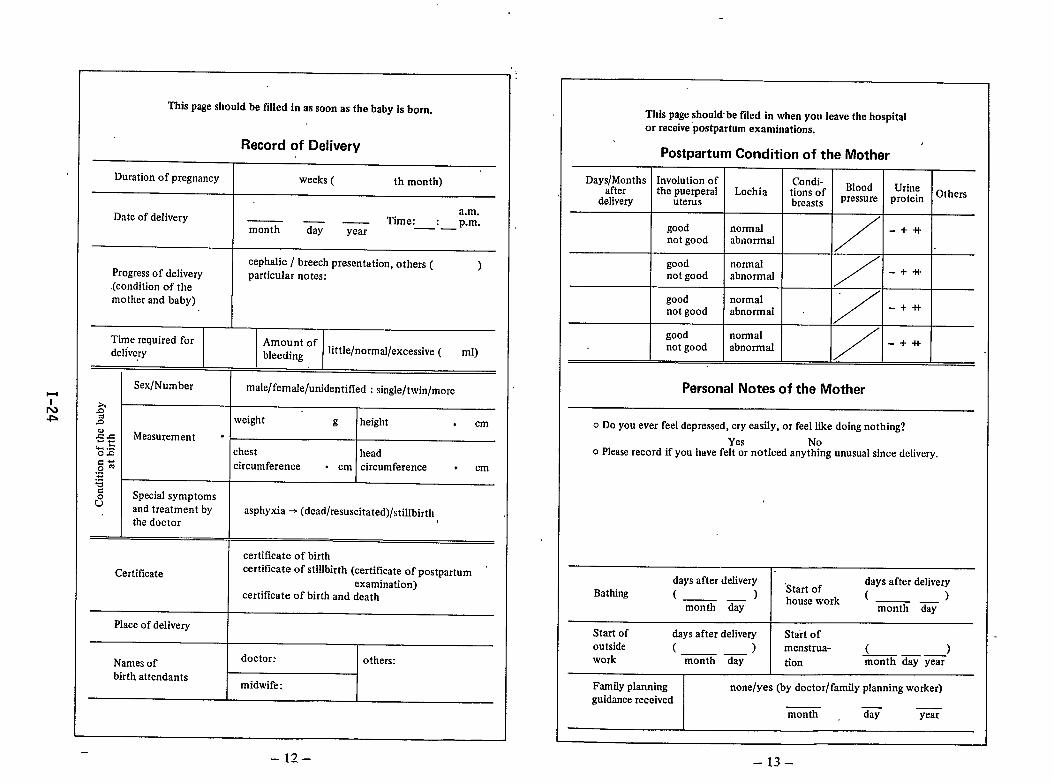
This page should be filled in as soon as the baby is born.
Record of Delivery
Duration of pregnancy weeks ( th month)
Date of deliverya.m.
Time: : p.m.month z — ——year
cephalic / breech presentation, others (progress of delivery
)particular notes:
(condition of themother and baby)
Time required for Amount ofdelivery bleeding little/normrd/excessive ( ml)
Sex/Number male/femaJe/unidentified : singIe/twin/more
2’2 weight E height . cm2s Measurement .. .%$ chest headc-~m circumference,“ . cm circumference . cm!==~ Special symptomsu and treatment by asphyxia ~ (dead/resuscitated)/stillbirth
the doctor
certificate of birth
Certificate certificate of stillbirth (certificate of postpartumexamination)
certificate of birth and death
Place of delivery
Names ofdoctor: others:
birth attendantsmidwife:
This page should-be filed in when you leave the hospitalor receive ‘postpartumexaminations.
Postpartum Condition of the Mother
Days/Months Involution of Condi-after the puerperal Lochia tions of Blood Urine Others
delivery uterus breasts pressure protein
good normal
/
-+*not good abnormal
good normalnot good abnormaJ
/-+-H’
good normalnot good abnormal
Y-+ +1-
good normalnot good abnormal
/-+*
Personal Notes of the Mother
o DOyou ever feel depressed, cry easily, or feel like doing nothing?
Yes Noo Please record if you have felt or noticed anything unusual since delivery.
days after delivery days after deliveryBathing ( )
“Start of—— house work ( )month day a-
Start of days after delivery Start ofoutside ( ) menstrua-—— ( )work
—. —month day tion month day year
Family planning none/yes (by doctor/family planning worker)guidance received
month G year
–13-

u,
Am
Dental Hygiene during Pregnancy & Puerperium
(upper jaw)3 ~ I I ~ ~n.?4 ‘.’”” 4 Date of fust examination:
5 front ~ + 5+* testh z ~ Weeks of pregnancy:
6th week
7+ A’ treated: no.8 IS8 Decayed teeth
right back teeth back teeth left untreated: no.
lb
8*
,AParadentosis
j? 78norie / yes
, 1- front J 6 Others
5 $.tamth:b , Guidance healthy/need caution/(lower jaw) ~ \ . . . ~
321,23memo need treatment
Tooth conditions:Name of medi-cal institution
Untraated decayed taoth : C or dentist
Presant taath :, I
Lost taeth ~A
Traatad taath :0
Record of Weight Change during Pregnancy and the
Postpartum Period
Your weight is a good indicator of the state of your health. Unusual
changes of weight can identify complications, especially during pregnancy and the postpartum period. Please mark this record yourself.
(kg)
+18
+16
+14
+12
+1 r)
+8
+6
1.
+4
+2
o(usual weight)
-2
-4
before 71115192327313539 12.3456pregnancy weeks months postpartum
Mark your weight before pregnancy- or in very early pregnancy at
zero and make ‘a graph of the weight increase/decrease. It is desirable
to return to your original pre-pregnancy weight level about six months
after delivery.
–14–” –15–

H
Lm
Record of Attendance at Mother’s Classes
Date of class Subject Remarks
—.
—— .month day year
.—= day year
— ——month day year
.—month day year
—— .month day year
— —.month day year
—— .month day year
— ——month day year
——month day year
——month day year
— —.month day year
Care of the Newborn Baby
(within 4 Weeks after Birth)
The first four weeks, especially the first two weeks afterthe birth, is a very important period for a baby to becomeadapted to living and growing in a new environment whichis quite different from the one inside the mother’s uterus.
Therefore, please pay special care to the following pointsso that your baby can naturally adapt to a new life, and startout his/her life feeling secure.
o.RestA baby sleeps most of the time except when he/shesucks milk. Let your baby sleep peacefully in a clean andquiet place: “
o TemperattireA baby cannot control his/her own body temperature well,so try to keep the temperature of the baby’s room notbelow 20° C. Do not forget to air the room out regularly.
o NutritionBreast feeding provides the best nutrition for your baby.Breastfeeding prevents your baby from getting sick andstrengthens the bond between the baby and mother.The initial breast milk, colostrum, is very important for thebaby’s health and nutrition, so by all means, please breastfeed your baby. Even though YQU may feel that your
breast milk is not abundant, it will flow freely if you letyour baby suck as much as he/she likes. It is also im-portant for the mother to have sufficient nutrition andrest in order to produce abundant milk.
–16- –17–
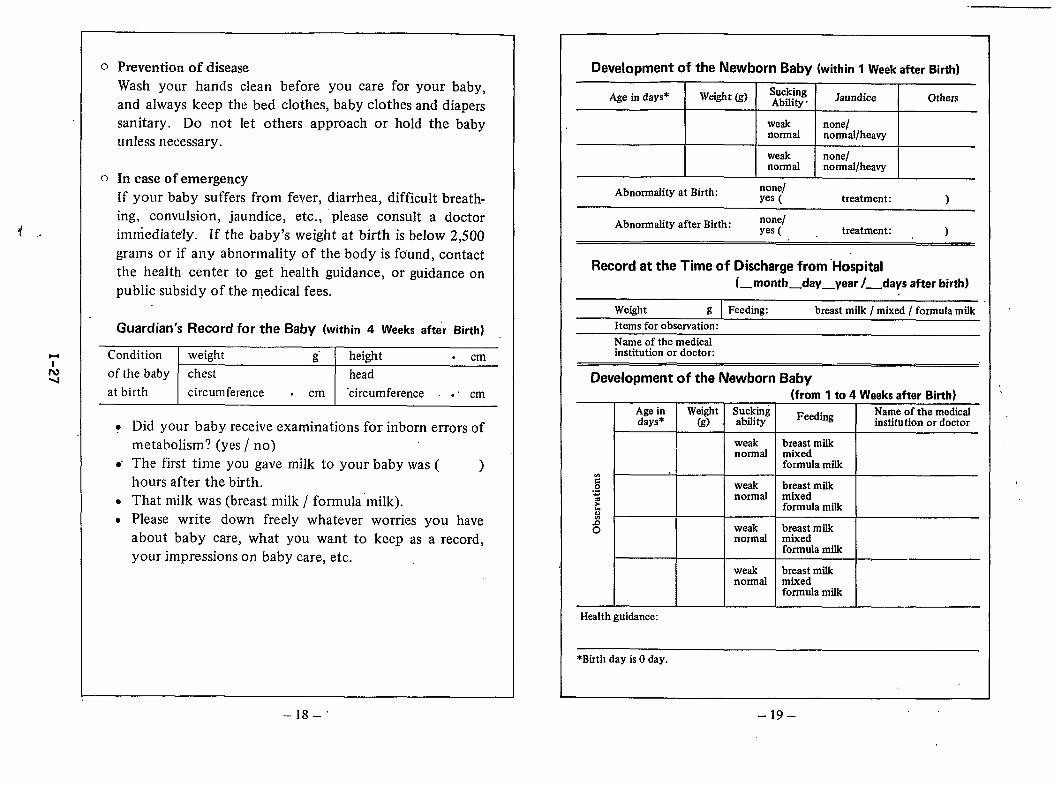
o preventionof disease
Wash your hands clean before you care for your baby,and always keep the bed clothes, baby clothes and diaperssanitary. Do not let others approach or hold the babyunless necessary.
n In case of emergency
If your baby suffers from fever, diarrhea, difficult breath-ing, convulsion, jaundice, etc., ‘please consult a doctorimniediately. If the baby’s weight at birth is below 2,500grams or if any abnormality of the body is fo’und, contactthe health center to get health guidance, or guidance onpublic subsidy of the medical fees.
Guardian’s Record for the Baby (within 4 Weeks afte”r Birth)
Condition weight g- height . cm
of the baby chest head
at birth circumference . cm ‘circumference . cm
o Did your baby receive examinations for inborn errors ofmetabolism? (yes / no)
.“ The first time you gave milk to your baby was ( )hours after the birth.
● That milk was (breast milk/ formula ”milk).● Please write down freely whatever worries you have
about baby care, what you want to keep as a record,your impressions on baby care, etc.
Development of the Newborn Baby (within 1 Week after Birth)
Age in days* Weight (g) SuckingAbility” Jaundice Others
weak nonelnormal normal/heavy
weak none/normal normal/heavy
Abnormality at Birth: none/yes ( treatment: )
Abnormality after Birth: none/yes ( treatment: ). .
Reeord at the Time of Discharge from ‘Hospital(_month_day_year /_days after birth)
Weight g Feeding: breast milk / mixed/ formula milk
Items for observation:
Name of the medicalinstitution or doctor:
Development of the Newborn Baby(from 1 to 4 Weeks after Birth)
Age in We&ht sll;k~ Feeding Name of the medicaldays* institution or doctor
weak breast milknormrd mixed
formula milk
Eo weak breast milk.-~ normal mixed
E formula milk
8 weak breast milknormal mixed
formula milk
weak breast milknormal mixed
formula milk
Health guidance:
*Birth day is O day.
_19–.-. ]8-”
H
I
!3
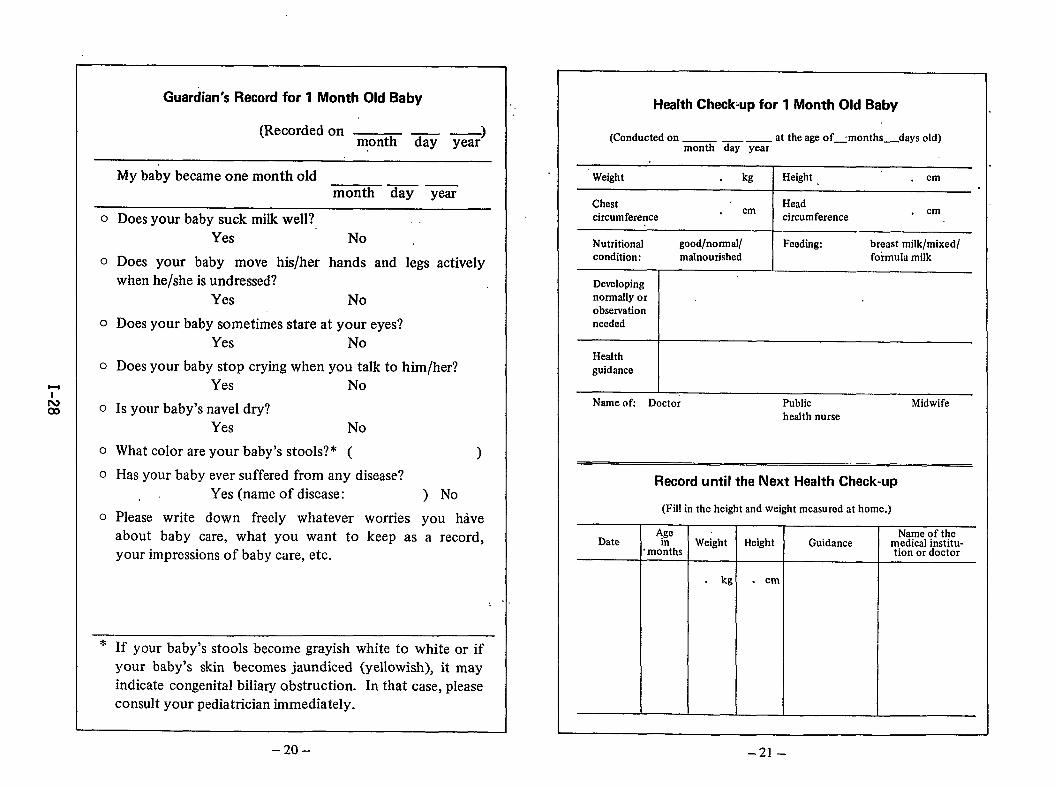
Guardian’s Record for 1 Month Old Baby
(Recorded on — — )month day year
My baby became one month old — —.month day year
o Does your baby suck milk well?Yes No .
0 Does your baby move his/her hands and legs activelywhen he/she is undressed?
Yes No
o Does your baby sometimes stare at your eyes?Yes No
o Does your baby stop crying when you talk to him/her?Yes No
o Is your baby’s navel dry?Yes No
o What color are your baby’s stools?* ( )
o Has your baby ever suffered from any disease?Yes (name of disease:,. ) No
o Please write down freely whatever worries you haveabout baby care, what you want to keep as a record,your impressions of baby care, etc.
* If your baby’s stools become grayish white to white or ifyour baby’s skin becomes jaundiced (yellowish), it mayindicate congenital biliary obstruction. In that case, pleaseconsult your pediatrician immediately.
Health Check-up for 1 Month Old Baby
(Conducted on at the age of_-months_days old)month day year
Weight kg Height cm
Chest Headcm
circumference. cm
circumference— ——
Nutritional good/nomral/ Feeding: breast milk/mixed/condition: malnourished fokmultt milk
Developingnormally or .,observationneeded
Healthguidance
Name of: Doctor Public Midwifehealth nurse
Record until the Next Health Check-up
(Fill in the height and weight measured at home.)
AgeDate
Name of theWeight Height Guidance medical institu-
‘mo%ths tion or doctor
kg . cm
-20– –21-
uI
.2
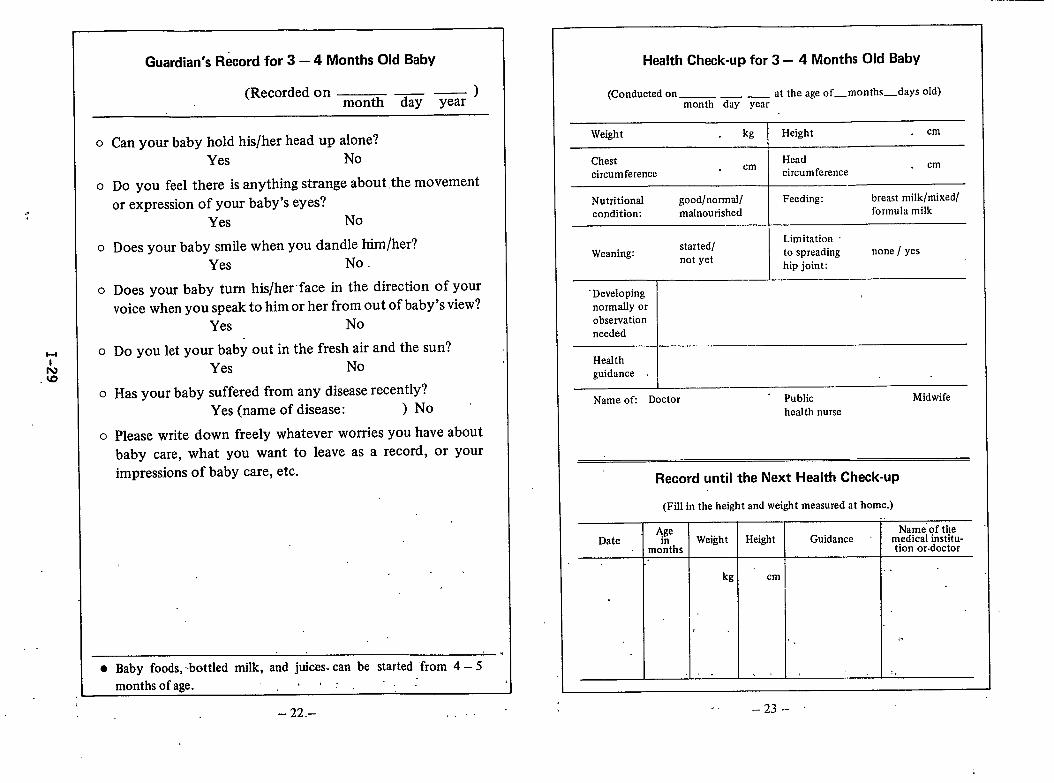
Guardian’s Record for 3 – 4 Months Old Baby
(Recorded on — — )month day year
o Can your baby hold his/her head up alone?Yes No
o Do you feel there is anything strange about ,the movementor expression of your baby’s eyes?
Yes No
o Does your baby smile when you dandle him/her?Yes No.
o Does your baby turn his/her ‘face in the direction of yourvoice when you speak to him or her from out of baby’s view?
Yes No
o Do you let your baby out in the fresh air and the sun?Yes No
o Has your baby suffered from any disease recentlY?Yes (name of disease: )No
o Please write down freely whatever worries you have about
baby care, what you want to leave as a record, or yourimpressions of baby care, etc.
.$ ,,● Baby foods, -bottled milk, and juices. can be started “from 4 – 5
months of age. ,4: ,.
Health Check-up for 3 – 4 Months Old Baby
(Conducted on_ — _ at the age of_months—days old)month day year
Weight kg Height cm
Chest Heirdcm
circumferencecm
circumference——.
Nutritional good/normal/ Feeding: breast milk/mixed/condition: malnourished formula milk
——
LimitationWeaning:
started/to spreading none / yes
not yethip joint:
—— __— ——
‘Developingnormally orobservationneeded
—.—.———
Healthguidance
—.
Name ofi Doctor “ Public Midwifehealth nurse
Record until the Next Health Check-up
(Fill in the height and weight measured at home.)
Age Name of theDate m Weight Height Guidance ~‘ medical institu-
months tion or.doctor.’
kg ‘ cm.
,..~.
,. .. $ J 1,
t– 22.– $., ,,
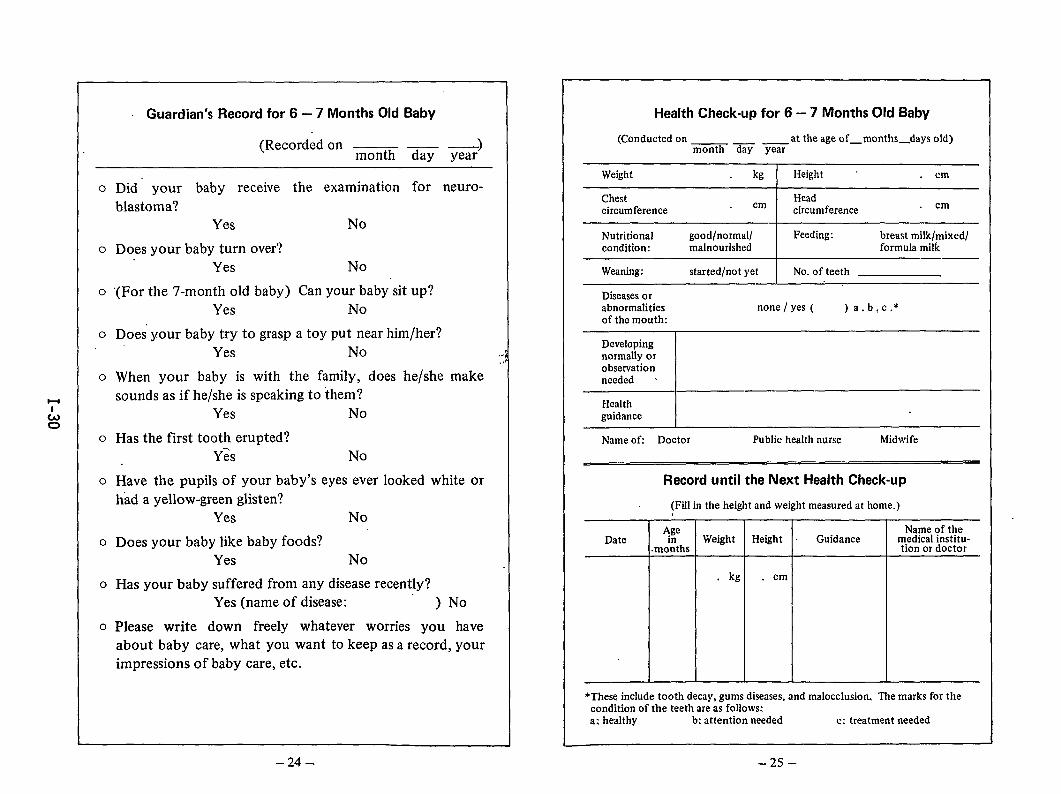
Guardian’s Record for 6 – 7 Months Old Baby
(Recordedon — — )month day year
o Did your baby receive the examination for neuro-blastoma?
Yes No
o Does your baby turn over?Yes No
o “(For the 7-month old baby) Can your baby sit up?Yes No
o Does”your baby try to grasp a toy put near him/her?,.
Yes No
o When your baby is with the family, does he/she makesounds as if he/she is speaking to them?
Yes No
o Has the first tooth erupted?Y& No
o Have the pupils of your baby’s eyes ever looked white orhad a yellow-green glisten?
Yes No
o Does your baby like baby foods?Yes No
o Has your baby suffered from any disease recently?Yes (name of disease: ) No
o Please write down freely whatever worries you haveabout baby care, what you want to keep as a record, yourimpressions of baby care, etc.
Health Check-up for 6 – 7 Months Old Baby
(Conducted on _ at the age of_months_days old)month day year
Weight kg Height cm
Chest Headcircumference
cm circumference cm
Nutritional good/normal/ Feeding: breast milk/mixed/condition: malnourished formula milk
Weaning: started/not yet No. of teeth
Diseases orabnormalities none j yes ( )a. b,c, *of the mouth:
Developingnormally orobservationneeded s
Healthguidance
Name of: Doctor Public health nurse Midwife
Record until the Next Health Check-up
(Fill in the height and weight measured at home.)
AgeDate
Name of thein Weight Height . Guidance medical institu-
.months tion or doctor
kg . cm
*These include tooth decay, gums diseases, and malocclusion. The marks for thecondition of the teeth are as follows:a: healthy b: attention needed c: treatment needed
–24- -25-
‘70.)
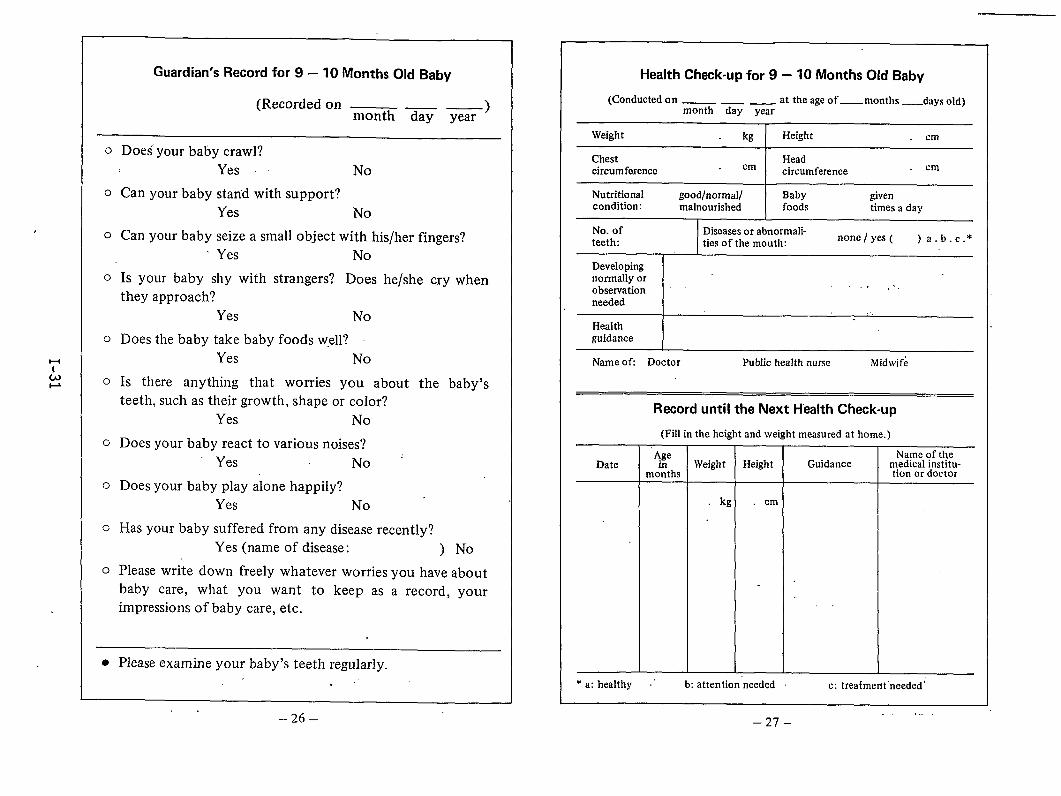
Guardian’s Record for 9 – 10 Months Old Baby
(Recorded on — _ _ )month day year
o Does your baby crawl?Yes No
o Can your baby stan”dwith support?Yes No
o Can your baby seize a small object with his/her fingers?‘ Yes No
o Is your baby shy with strangers? Does he/she cry whenthey approach?
Yes No
o Does the baby take baby foods well?Yes No
o Is there anything that worries you about the baby’steeth, such as their growth, shape or coIor?
Yes No’
o Does your baby react to various noises?Yes No
o Does your baby play alone happily?Yes No “
G Has your baby suffered from any disease recently?Yes (name of disease: ) No
o Please write down freely whatever worries you have aboutbaby care, what you want to keep as a record, yourimpressions of baby care, etc.
● Please examine your baby’s teeth regularly.. ,’
Health Cheek-up for 9 – 10 Months Old Baby
(Conducted on _ _ _. at the age of_ months _ddyS old)month day year
Weight kg Height ml
Chestcircumference I Head
cm circumference cm
Nutritional good/normal/ I Baby givencondition: malnourished foods times a day
No. ofteeth:
Diseases or abnormali-ties of the mouth:
none / yes ( )a. b.c.*
Developingnormally orobservation “
.,? ,..
needed,,.
Healthguidance
Name ofi Doctor Public health nurse Midwife
Record until the Next Health Check-up
(Fill in the height and weight measured at home.)
‘Age Name of theDate in Weight Height Guidance medical institu-
months tion or doctor
kg . cm
,.
* a: healthy .‘ b: attention’needed c: treaimerit “needed’
–26–. ..-
–27–
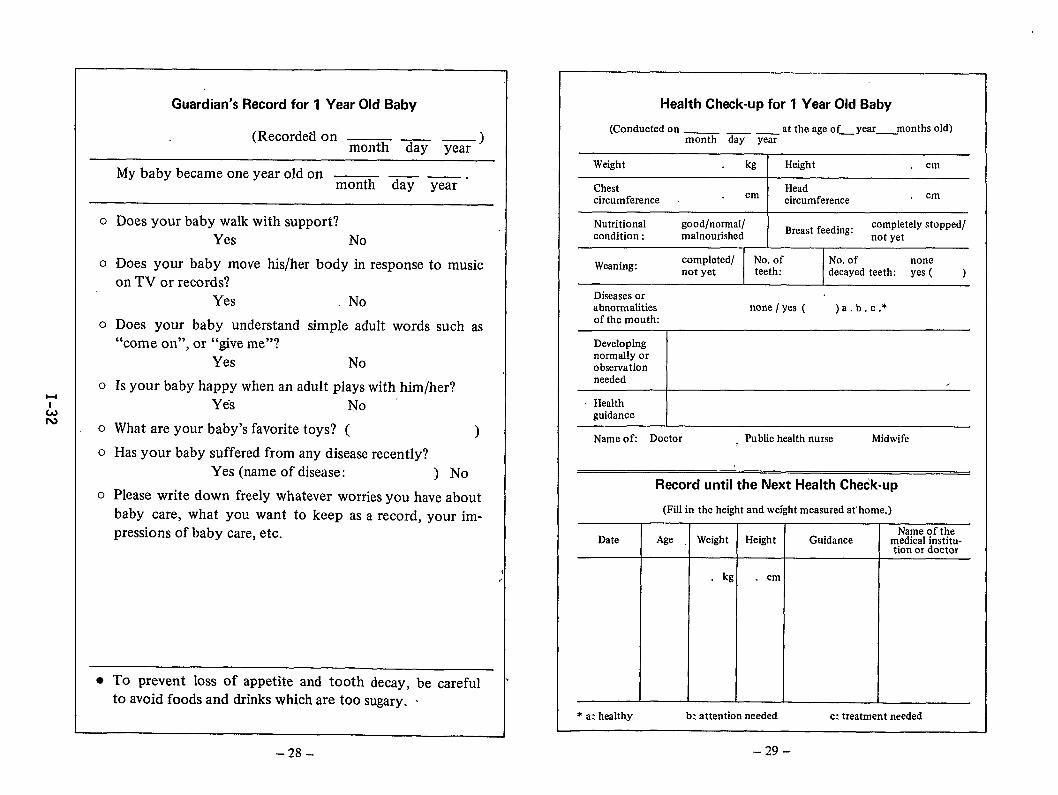
Guardian’s Record for 1 Year Old Baby
(Recorded on — _ _ )month day year
My baby became one year old on — — — .month day year
o Does your baby walk with support?Yes No
o Does your baby move his/her body in response to music
on TV or records?Yes No
o Does your baby understand simple adult words such as“come on”, or “give me”?
Yes No
o Is your baby happy when an adult plays with him/her?Yes No
o What are your baby’s favorite toys? ( )
o Has your baby suffered from any disease recently?Yes (name of disease: ) No
o Please write down freely whatever worries you have aboutbaby care, what you want to keep as a record, your im-pressions of baby care, etc.
● To prevent loss of appetite and tooth decay, be carefulto avoid foods and drinks which are too sugary. .
Health Check-up for 1 Year Old Baby
(Conducted on at the age of_ year_ months old)month day year
Weight kg Height cm
Chest Headcircumference
cm circumferencecm
Nutritional good/normal/Breast feeding:
completely stopped/condition: malnourished not yet
Weaning:completed/ No. of No. of nonenot yet teeth: decayed teeth: yes ( )
Diseases orabnormalities none / yes ( )a. b.c.*of the mouth:
Developingnormally orobservationneeded /
- Healthguidance
Name ofi Doctor , Public health nurse Midwife
Record until the Next Health Check-up
(Fill in the height and weight measured at home.)
Date Age WeightName of the
Height Guidance m.edlcal institu-tion or doctor
kg . cm
* a: healthy b: attention needed c: treatment needed
–29--28-
HI
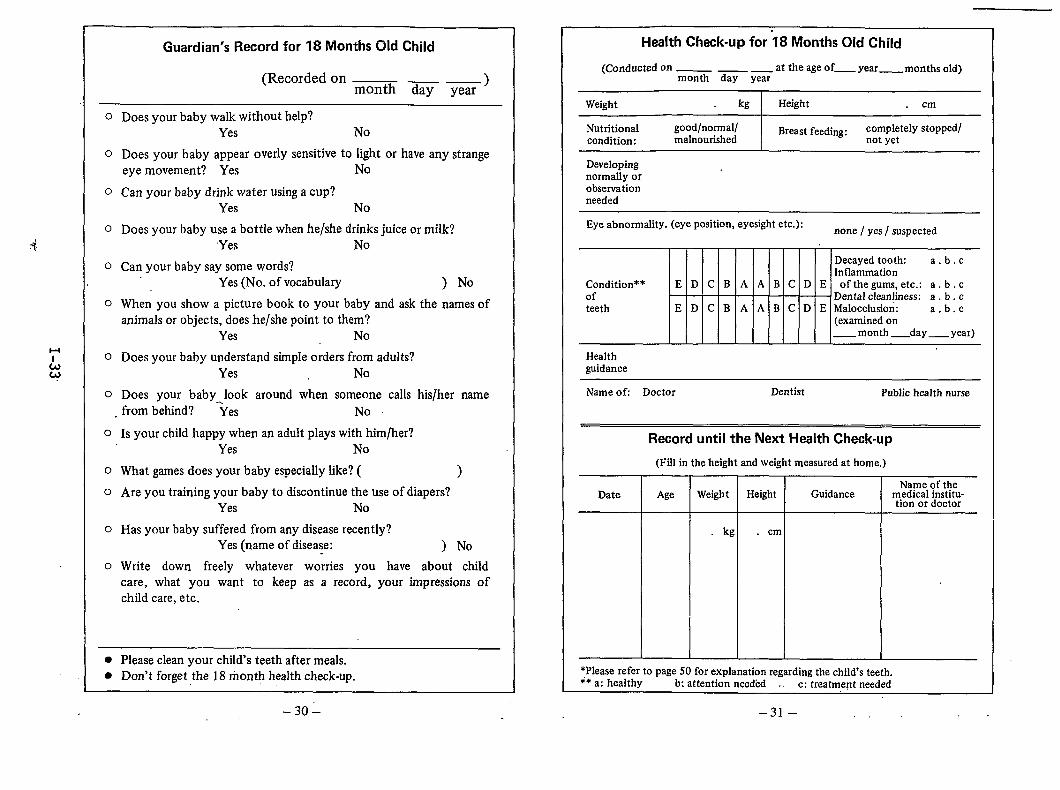
Guardian’s Record for 18 Months Old Child
(Recorded on _ —)month day year
o Doesyour baby walk without help?Yes No
o Does your baby appear overly sensitive to light or have any strangeeye movement? Yes No
o Can your baby drink water using a cup?Yes No
o Doesyour baby use a bottle when he/she drinks juice or milk?Yes No
o Can your baby say some words?Yes (No. of vocabulary ) No
o When you show a picture book to your baby and ask the names ofanimals or objects, does he/she point to them?
Yes No
o Does your baby understand simple orders from adults?Yes No
o Does your baby look around when someone calls hislher name. from behind? ‘Yes No
o Is your child happy when an adult plays with him/her?Yes No
O What games does your baby especially like? ( )
o Are you training your baby to discontinue the use of diapers?Yes No
o Has your baby suffered from any disease recently?Yes (name of disease: ) No
o Write down freely whatever worries you have about childcare, what you want to keep as a record, your impressions ofchild care, etc.
● Please clean your child’s teeth after meals.● Don’t forget the 18 rnont~ health check-up. -
–30–
Health Check-up for 18 Months Old Child ~
(Conducted on_ ___ at the age of_ year_ months old)month day year
Weight kg Height cmI
Nutritional good/normal/ Breast feeding: completely stopped/condition: malnourished not yet
Developingnormally orobservationneeded
Eye abnormality. (eye position, eyesight etc.):
Condition**ofteeth
Healthguidance
IEDC B A A B c D
EDC B A A B c D
none / yes/ suspected
c
Decayed tooth: a.b. chrflammation
E of the gums, etc.: a. b . cDental cleanliness: a . b. c
E Malocclusion: a.b. c(examined on_ month _day _ year)
Name of Doctor Dentist Public health nurse
Date
Record until the Next Health Check-up
(Fill in the height and weight measured at home.)
Age WeightName of the
Height Guidance medical institu-tion or doctor
cm
*Please refer to page 50 for explanation regarding the child’s teeth.** a: healthy b: attention needed ,. c: treatment needed
–31 –.,..
1+
L.b
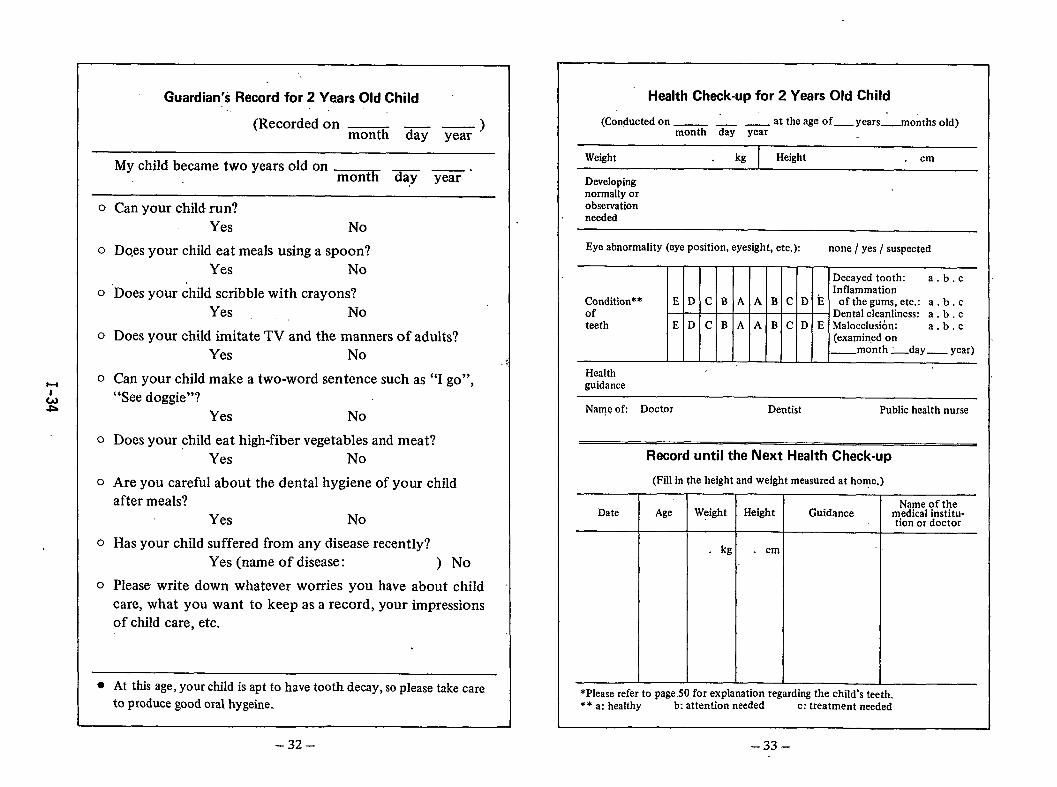
Guardian’s Record for 2 Years Old Child.,
(Recordedon _ — —)month day year
Mychild became twoyears old on _ _.X day year
o Can your child run?Yes No
o Dqes your child eat meals using a spoon?Yes No
o ‘Does your child scribble with crayons?Yes, ,, No
o Does your child imitate TV and the manners of adults?Yes No
o Can your child make a two-word sentence such as “I go”,“See doggie”?
Yes No
o Does your child eat high-fiber vegetables and meat?Yes No
o Are you careful about the dental hygiene of your childafter meals?
Yes No
o Has your child suffered from any disease recently?Yes (name of disease: ) No
o Please write down whatever worries you have about childcare, what you want to keep as a record, your impressionsof child care, etc.
● At this age, your child is apt to have tooth decay, so please take care
to produce good oral hygeine.
–32–
Health Check-up for 2 Years Old Child
(Conducted on_ _ _ at the age of_ years _months old)month day year
Weight kg Height cm
Developingnormally orobservationneeded
Eye abnormality (eye position, eyesight, etc.): none / yes / suspected
Decayed tooth: a.b. cInflammation
Condition** E D c B A .4 B c D E of the gums, etc.: a . b . cof - Dental cleanliness: a . b , cteeth E D c B A A B c D E Malocclusion: a.b. c
(examined on_month _d~y _ year)
Healthguidance
Name ofi Doctor Dentist Public health nurse
Record until the Next Health Check-up
(Fill in the height and weight measured at home.)
Date Age WeightName of the
Height Guidance medical institu-tion or doctor
kg . cm
*Please refer to page .50 for explanation regarding the child’s teeth.** a: healthy b: attention needed c: treatment needed
-33–
1+
t!dul
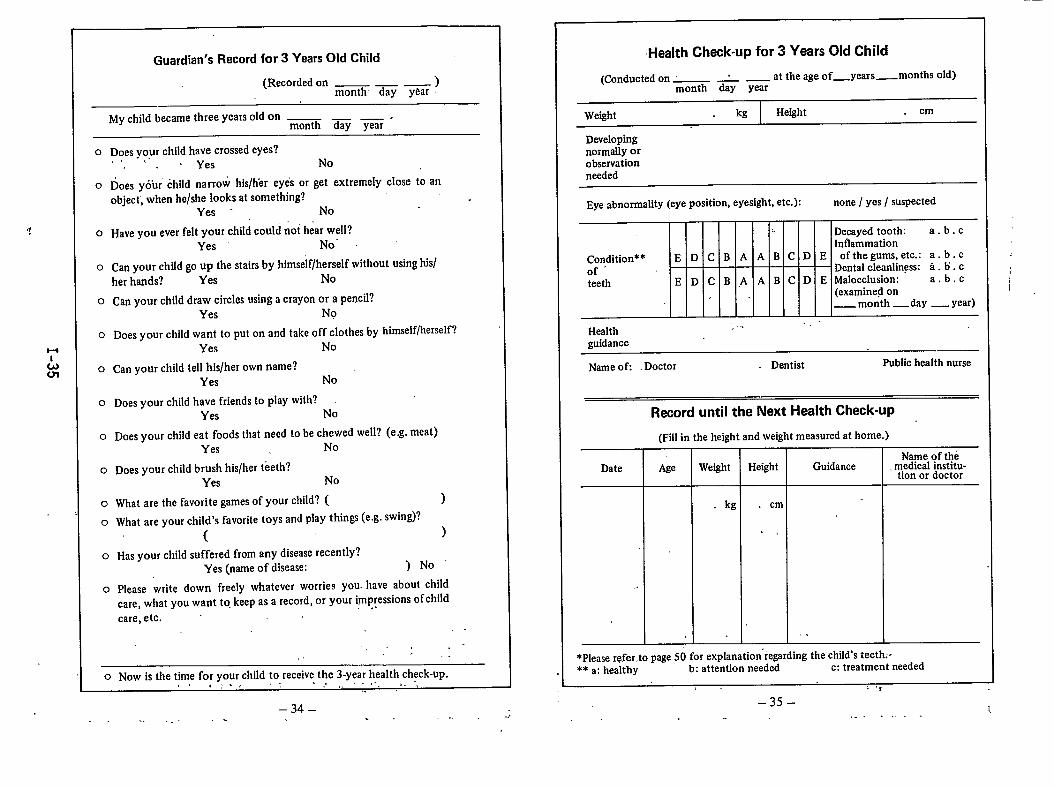
Guardian’s Record for 3 Years Old Child
(Recorded on — _ — )month- day ykar
My child became three years old on —— —.month day year
o Does yo,ur child have crossed eyes?., “ Yes No
o Does youi child narrow his/hkr eyes or get extremely close to an
object, when he/she Iooks at something? .Yes - No.,
0 Have you ever felt your child could riot hear well?Yes No”
o Can your child go up the stairs by himself/herself without using his/her hands? Yes No
o Can y-our child draw circles using a crayon or a pencil?Yes No
o Does your child want to put on and take off clothes by himself/herself?
Yes No
o Can your child tell his/her own name?Yes No
o Does your child have friends to play with?Yes No
o Does your child eat foods that need to be chewed well? (e.g. meat)Yes . No
o Does your child brush his/her teeth?Yes No
o What are the favorite games of your child? ( )
o What are your child’s favorite toys and play things (e.g. swing)?
( )
o Has your child suffered from any disease recently?Yes (name of disease: )No’
o Please write down freely whatever worries you- have about childcare, what you want to, keep as a record, or your i,rnp~essions of childcare, etc.
,.. .-,,
0 Now is the time for your chiId to receive the 3-year health check-up.,,, :. ,.-, !,, ... -,, . ..
..
–34–
Health Check-up for 3 Years Old Child
(Conducted on - : — at the age of_years — months old)month day year
Weight kg Height cm
Developingnormally orobservationneeded
Eye abnorrnaMy (eye position, eyesight, etc.): none / yes / suspected
Decayed tooth: a.b. cInflammation
Condition** E D c B A A B c D E of the gums, etc.: a. b. c
of ‘ Dental cleanliness: a. b. c
teeth E D c B .A A B c D E Malocclusion: a.b. c(examined on_ month _day _ year)
.,.Healthguidance
Name ofi Doctor Dentist Public health nurse
Record until the Next Health Check-up
(Fall in the height and weight measured at home.)
Name of theDate Age Weight Height Guidance . medical institu-
tion or doctor
kg . cm
,,
,.
. .
*Please refer,to page 50 for explanation’regarding the child’s teeth:-** a: healthy b: attention needed c: treatment needed
,. ,,,
–35–i,
. . ...- ----
,
I
. . .. . . . . . . .. . -,
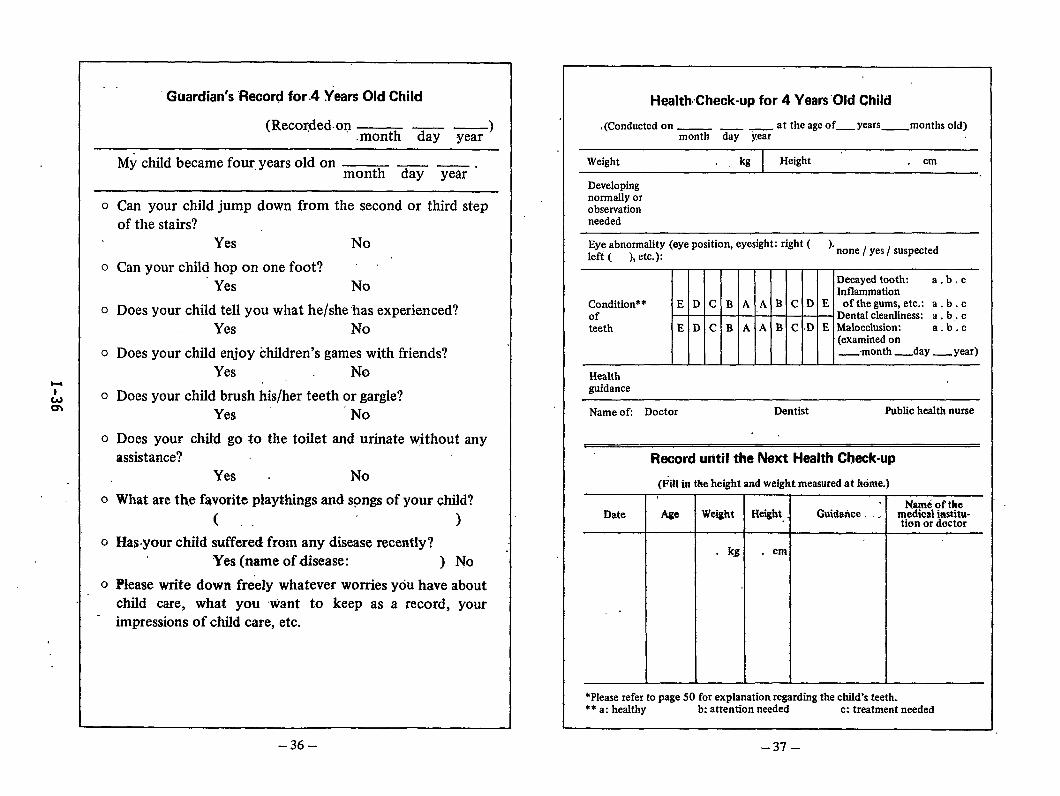
Guardian’s “Record for.4 years Old Child
(Recordedon- — — )month day year
My child became four. years old on ————————.month day year
o Can your child jump down from the second or third stepof the stairs?
Yes No
o Can your child hop on one foot?Yes No
o Does your child tell you what he/she has experienced?Yes No
o Does your child enjoy children’s games with friends?Yes No. .
0 Does your child brush his/her teeth or gargle?Yes No
o Does your Ghitd go to the toilet and urinate without anyassistance?
Yes . No
o What are the favorite playthings and sprigs of your child?
( . . )o Has.your child suffered from any disease recentiy?
Yes (name of disease: ) No
o Please write down freely whatever worries YOU have aboutchild care, what you want to keep as a record, yourimpressions of child care, etc.
Health.’Check-up for 4 Years ‘Old Child
t(Conducted on —— - at the age of_ Years_ months old)month day year
Weight ., kg Height cm
Developingnormally orobservationneeded
Eye abnormality (eye position, eyesight: right ( ).left ( ), etc.): none / yes/ suspected
Decayed tooth: a.b. cInflammation
Condition** E D c B A A B c D E of the gums, etc.: a. b. cof - Dental cleanliness: a . b,. cteeth E D c B A A B c D E Malocclusion: a.b. c
(examined on_,month _day _ year)
Healthguidance
Name ofi Doctor Dentist Public health nurse
.,
Re&d until the Next Health Check-up
(Fill irs the height and weight measwedat is6ma)
Date Age Weight Height .Nant4 of the
Guidarice, . medicrd hsstitu-tiors or doctor
kg. . cm
*Please refer to page 50 for explanation regarding the child’s teeth.** a: healthy b: attention needed c: treatment needed
–36– –37–
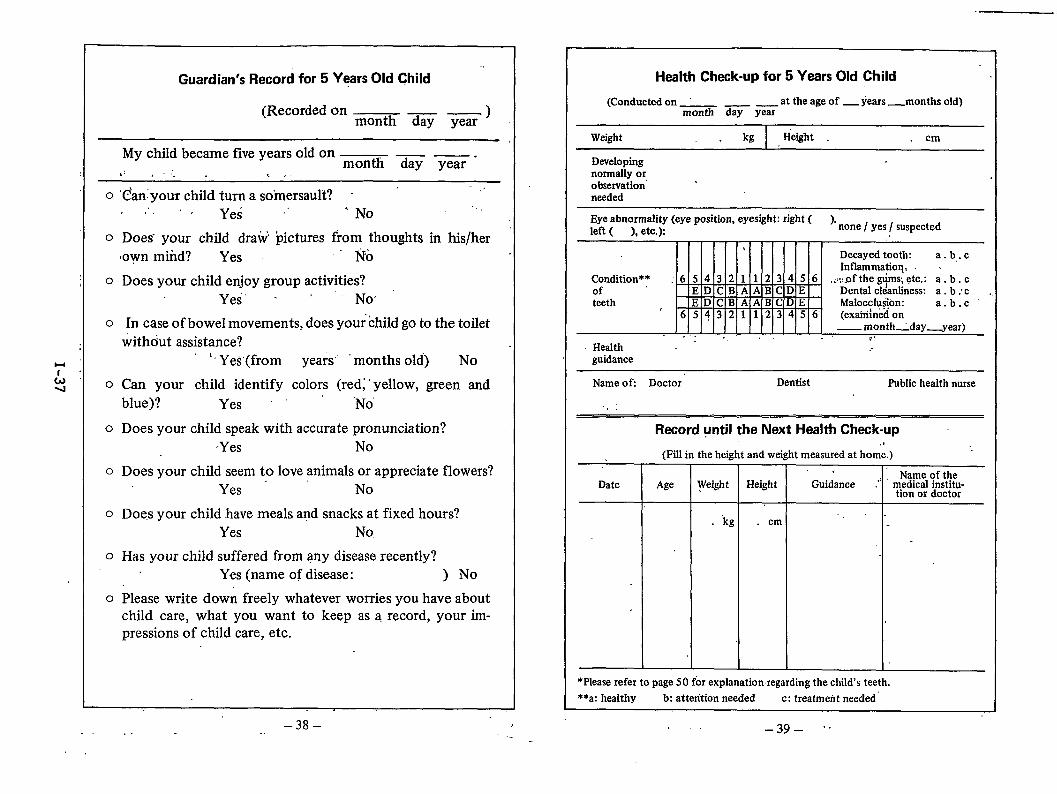
Guardian’s Record for 5 years Old Child ““
(Recorded on — — )month day year
My child became five years old on — —.month day year
,> .-;. ,.. .
0 ‘C’anyouT child turn a somersault? - “. . Ye; ~‘ ‘ No
.,.,.
0 Does” your child draw pictures from thoughts in his/her,own mtid? Yes “’ No
o Does your child enjoy group activities?Yes’ “ ‘ - NO
o In case of boweI movements, does your child go to the toiletwithdut assistance?
‘~YeS(from years’ months old) NO
o Can your child identify colors (red;” yellow, green andblue)? Yes””” ‘No
o Does your child speak with accurate pronunciation?Yes No
o Does your child seem to love animals or appreciate flowers?Yes - No
o Doe,s your child have meals and snacks at fixed hours?Yes No,
o Has your child suffered from any disease recently?Yes (name of disease: ) No
o Please write down freely whatever worries you have aboutchild care, what you want to keep as a record, your im-pressions of child care, etc.
Health Check-up for 5 Years Old Child
(Conducted on at the age of _ years _months old)month day year
Weight kg Height .,. cm
Developingnormally orobservation’needed
Eye abnormality (eye position, eyesight: rjght ( ).left ( ), etc.): none / yes/ suspected
,“,
Decayed tooth: a. b,. cInflammation, .
Condition** : 6 5 4 3 2 1 1 2 3 4 5 6 ,,:;,~f the g~ms, etc.: a. b. cof E D c B A A B c D E Dental cleanliness: a. b: c ,,teeth E D c B A A B c D E Malocchriion: a.b. c
6 5 4 3 2 1 1 2 3 4 5 6 (exahilned on— month _day__year)
. . . . .,, ., .,Health ~ “
*...
guidance
Name of Doctor” Dentist Public health nurse
.,,
Record until the Next Health Check-up
(Fill in the height and weight measured at horn;.).,
DateName of the
Age Weight Height Guidance ,“: medical institu-tion or doctor
“kg . cm “ “-
. .
*Please refer to page 50 for explanation. regarding the child’s teeth.
**a: healthy b: attention needed c: treatment needed’
–38– !-- . -..,
. . –39– ‘“
H
L03
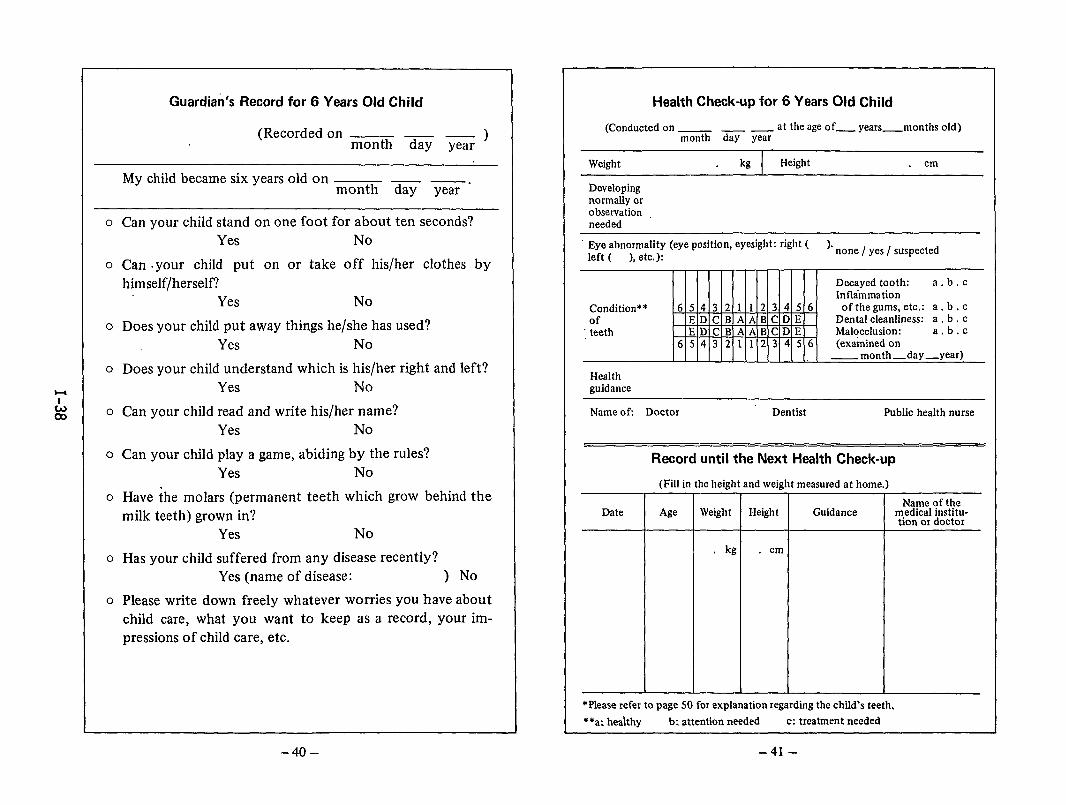
Guardian’s Record for 6 Years Old Child
(Recordedon — —)month day year
Mychild became sixyears old on — —.month day year
o Can your child stand on one foot for about ten seconds?Yes No
o Can .your child put on or take off his/her clothes byhimself/herself?
Yes No
o Does your child put away things he/she has used?Yes No
o Does your child understand which is his/her right and left?Yes No
o Can your child read and write his/her name?Yes No
o Can your child play a game, abiding by the rules?Yes No
o Have ~he molars (permanent teeth which grow behind themilk teeth) grown in?
Yes No
o Has your child suffered from any disease recently?Yes (name of disease: ) No
o Please write down freely whatever worries you have about
child care, what you want to keep as a record, your im-pressions of child care, etc.
Health Check-up for 6 Years Old Child
(Conducted on_ _ _ at the age of_ years_nlonths old)month day year
Weight kg Height cm
Developingnormally orobservationneeded
“ Eye abnormality (eye position, eyesight: right ( ).left ( ), etc.):
none / yes/ suspected
Decayed tooth: a,b, cInflammation
Condition** 6 5 4 3 2 I 1 2 3 4 5 6 of the gums, etc.: a. b. cof E D c B A A B c D E Dental cleanliness: a . b . c
; teeth E D c B A A B c D E Malocclusion: a.b. c6 5 4 3 2 1 1 2 3 4 5 6 (examined on
—month—day—year)
Healthguidance
Name of Doctor Dentist Public health nurse
Record until the Next Health Check-up
(Fill in the height and weight measured at home.)
Name of theDate Age Weight Height Guidance medical institu-
tion or doctor
kg . cm
*Please refer to page 50 for explanation regarding the child’s teeth.
**a: heahhy b: attention needed c: treatment needed
-40– -41-
l-lI
Infant’s Physical Growth Curve (as of 1980)
(boy) Fill in weight and heightbaby in this graph.
(cm)
80-
75 -
70 -
(kg]
65 - 11-
60- 10 -
t -
55 9
!
50 8
145 7
2
+$’ 40 6s
5-
4-
irth) Age in months +Months old
of your
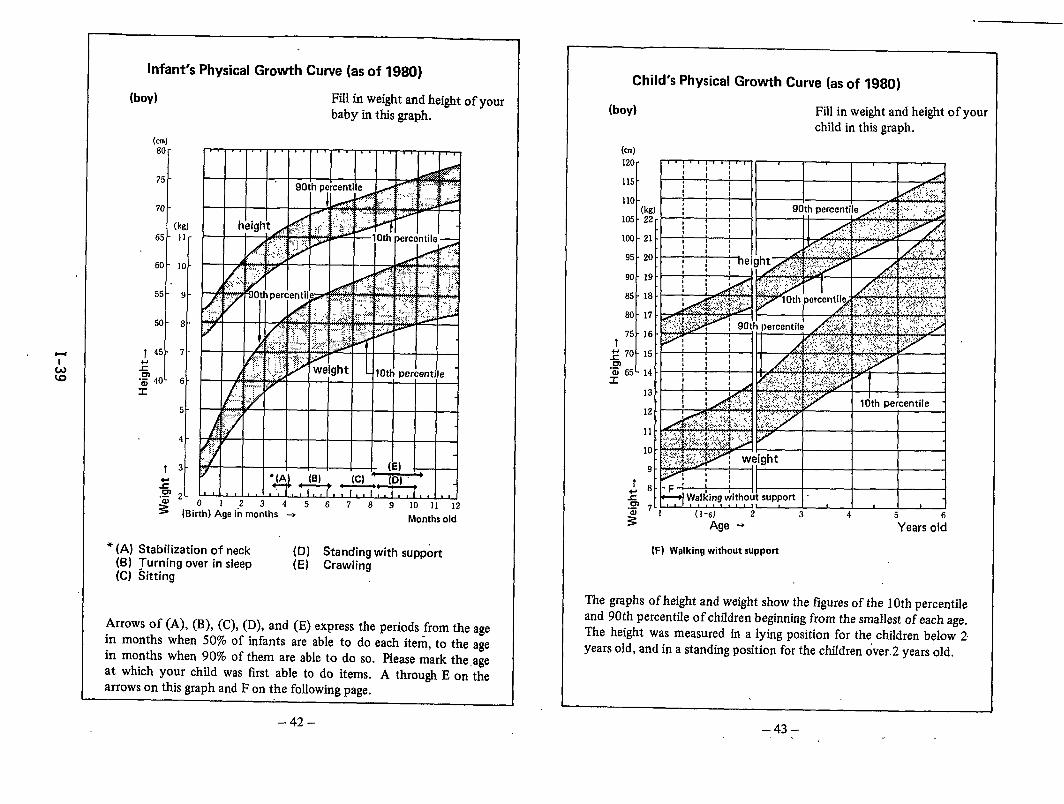
● (A) Stabilization of neck (D) Standing with support(B) ?urnmg over in sleep (E) Crawling(C) Sitting
Arrows of (A), (B), (C), (D), and (E) express the periods from the agein months when 50% of infants are able to do each item, to the agein months when 90% of them are able to do so. Please mark the ageat which your child was first able to do items. A through E on thearrows on this graph and F on the following page.
Child’s Physical Growth Curve (as of 1980)
(boy) Fill in weight and height of yourchild in this graph.
(cm)
120 -
115 -
110 -(kg)
105 -22-
103 -21 -
95 -20 .
90 -19 .
85 -18 .
80 -17 -
75 -16 -t
~ 70 -15
“~ 65- 14 -r
13 -
12 -
11 -
10 -
9-
f ~:
zm 7-,.-
= (1-6) 2 3 4 5 65 Age + Years old
(H walkingwithoutsupport
The graphs of height and weight show the figures of the 10th percentileand 90th percentile of children beginning from the smallest of each age.The height was measured in a lying position for the children below 2years old, and in a standing position for the children over.2 years old.
–42– –43–
Infant’s Physical Growth Curve (as of 1980)
(girl) Fill in weight and height of yourbaby in this graph.
(cm)
80-
75-
70-
(kg]65 - 11-
60- 10-
55-9 -
50-8 -
T45-7 -
z.Q 40- 6 -
$
5 -
4-
t 3“
2~ 2’.-
% (B01234567 89 10 11 12
~irth) Age in months + Months old
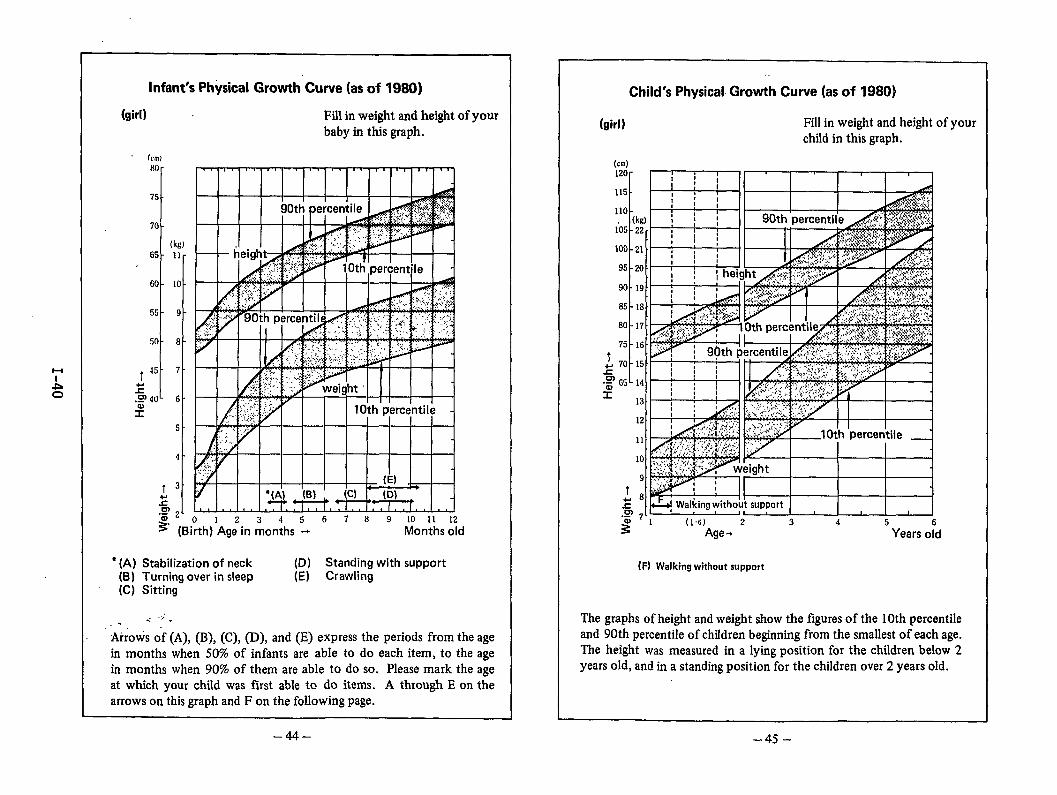
‘ (A) Stabilization of neck (D) Standing with support(B) Turning over in sleep (E) Crawling(C) Sitting
-. .,.,.. .Arrows of (A), (B), (C), (D), and (E) express the periods from the agein months when 50% of infants are able to do each item, to the agein months when 90% of them are able to do so. Please mark the ageat which your child was first able to do items. A through E on thearrows on this graph and F on the following page.
Child’s Physical Growth Curve (as of 1980}
(girl) Fill in weight and height of yourchlId in this graph.
(cm)120r~:;: II I I I I
’151I-w!-11 I I I
I=-’A&!
60 -
75 -
1+ 70--c.:65 -
x
(H Walkingwithoutsupport
The graphs of height and weight show the figures of the 10th percentileand 90th percentile of chfldren beginning from the smallest of each age.The height was measured in a lying position for the children below 2years old, and in a standing position for the children over 2 years old.
–44– -45-
l-l
-Lw
Vaccinations
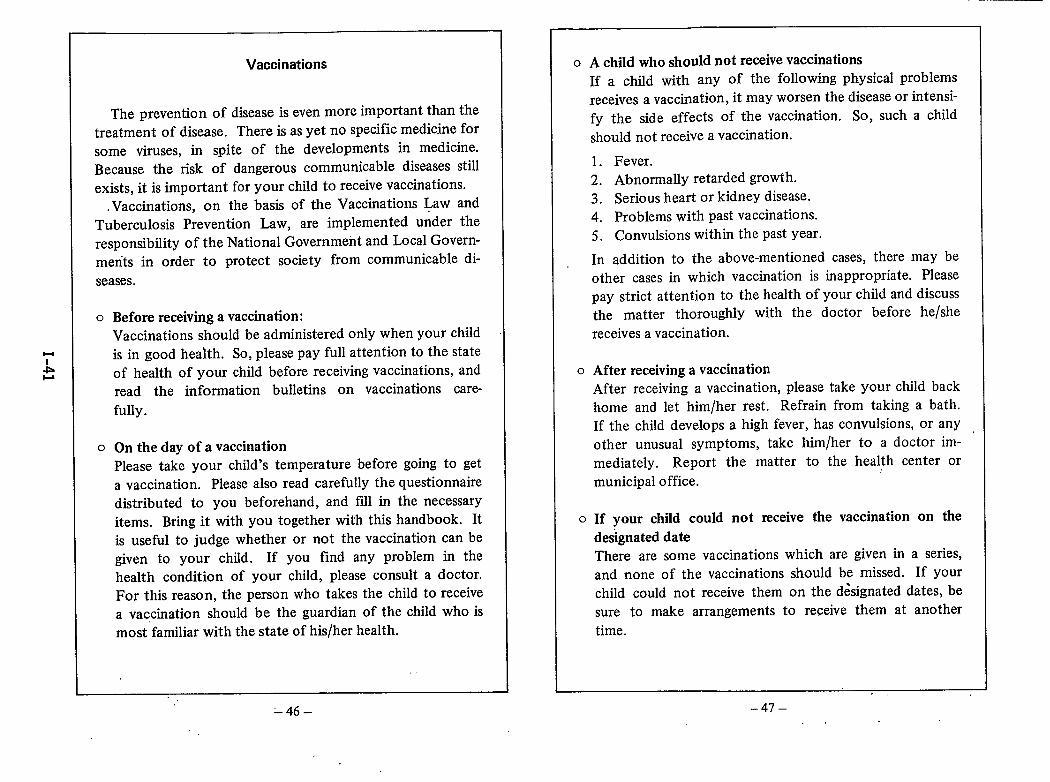
The prevention of disease is even more important than thetreatment of disease. There is as yet no specific medicine forsome viruses, in spite of the developments in medicine.Because the risk of dangerous communicable diseases stillexists, it is important for your child to receive vaccinations.
Vaccinations, on the basis of the Vaccinations Law andTuberculosis Prevention Law, are implemented under theresponsibilityy of the National Government and Local Govern-ments in order to protect society from communicable di-seases.
o Before receiving a vaccination:
Vaccinations should be administered only when your childis in good health. So, please pay full attention to the stateof health of your child before receiving vaccinations, andread the information bulletins on vaccinations care-fully.
o On the day of a vaccinationPlease take your child’s temperature before going to geta vaccination. Please also read carefully the questionnairedistributed to you beforehand, and fill in the necessaryitems. Bring it with you together with this handbook. Itis useful to judge whether or not the vaccination can begiven to your child. If you find any problem in thehealth condition of your child, please consult a doctor.For this reason, the person who takes the child to receivea vaccination should be the guardian of the child who ismost familiar with the state of his/her health.
,,
0 A child who should not receive vaccinationsIf a child with any of the following physical problemsreceives a vaccination, it may worsen the disease Or intensi-fy the side effects of the vaccination. SO, such a childshould not receive a vaccination.
1. Fever.2. Abnormally retarded growth.3. Serious heart or kidney disease.4. Problems with past vaccinations.5. Convulsions within the past year.
In addition to the above-mentioned cases, there may beother cases in which vaccination is inappropriate. Pleasepay strict attention to the health of your child and discussthe matter thoroughly with the doctor before he/shereceives a vaccination.
o After receiving a vaccinationAfter receiving a vaccination, please take your child backhome and let him/her rest. Refrain from taking a bath.If the child develops a high fever, has convulsions, or any ,other unusual symptoms, take him/her to a doctor imm-ediately. Report the matter to the health center ormunicipal office.
o If your child could not receive the vaccination on thedesignated dateThere are some vaccinations which are given in a series,and none of the vaccinations should be missed. If yourchild could not receive them on the d&ignated dates, besure to make arrangements to receive them at anothertime.
-46–.,
–47–.
.,.
l-l
AIv
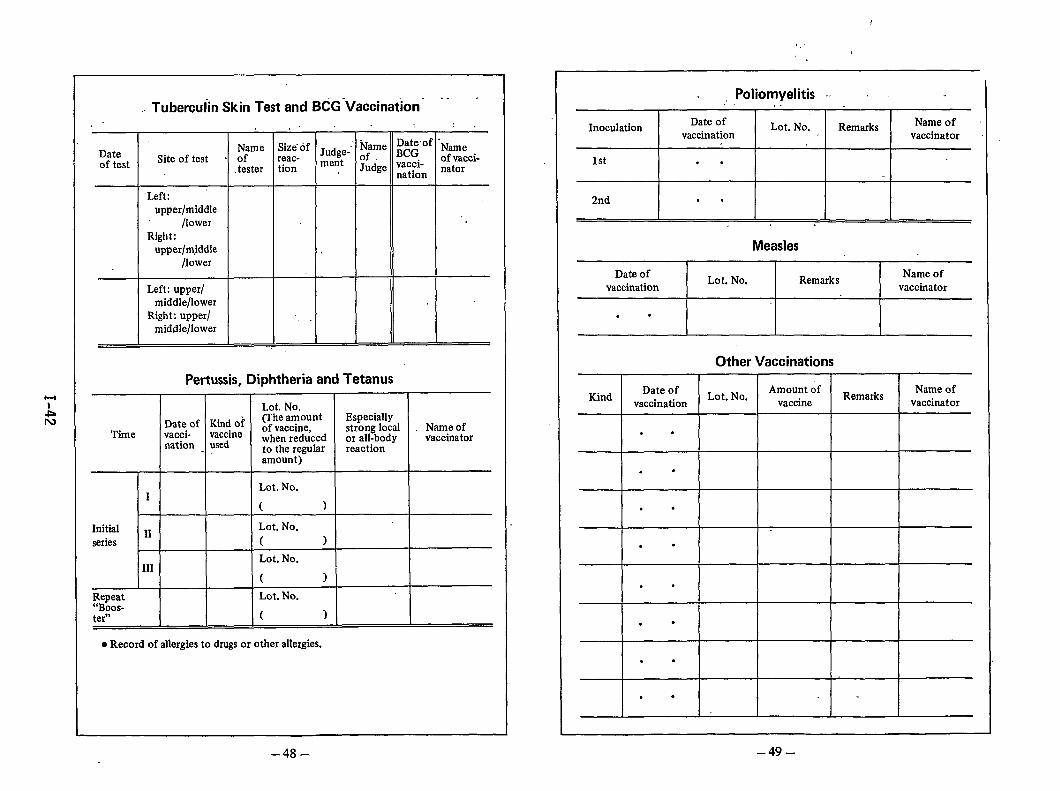
Tuberculin Skin Test and BCG Vaccination- ‘- “,. . . ,.: .
.’ Name :)t&’of “NameName ::: of Jrldge- ~fDateof test Site of test . of of vacci-
.tester tion me:t Judge ‘f&; nator
‘Left:upper/middle
/lowerRight:
upper/m,iddle/lower
Left: upper/middle/lower
Right: upper/ ,.middle/lower
Pertussis, Diphtheria and Tetanus
Lot. No.
Date of Kind of(The amount Especially
Time vacci- vaccineof vaccine, strong local Name of
nation usedwhen reduced or all-body vaccinatorto the regular reactionamount )
Lot. No.1
( )
Initial ~~ Lot. No.
series ( )
Lot. No.111
( )
R.::o;t L@. No.
tern ( )
● Record of allergies to drugs or other allergies.
Poliomyelitis -,L . .
InoculationDate of Lot. No. Remarks Name of
vaccination vaccinator
1st . .
2nd . .
Measles
Date ofLot. No, Remarks
Name ofvaccination vaccinator
. .
Other Vaccinations
KindDate of Lot. No.
Amount ofRemarks
Name ofvaccination vaccine vaccinator
. .
.*
. .
. .
. .
.=
. .
. .
–49--48-
l-l
Acd
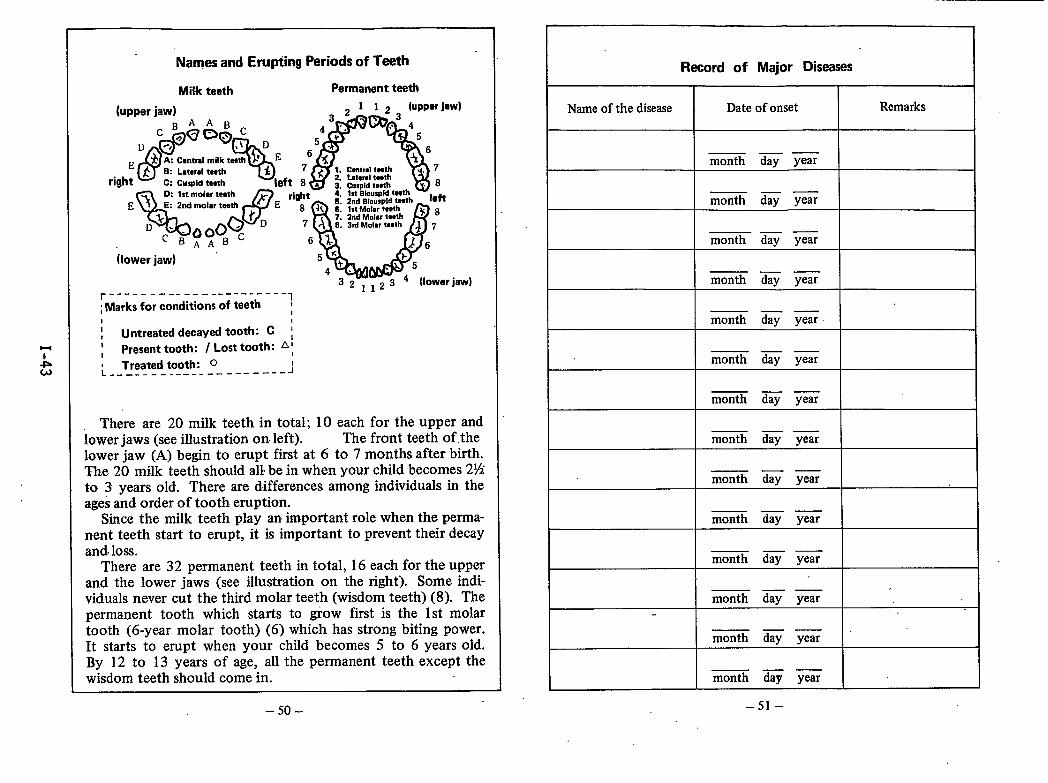
Namesand Erupting Periods of Teeth
MiHr teeth Permanent teeth
r ----- ------ ------- ---- . .
;Marks for conditions of teeth ~I I
I! Untreated decayed tooth: C ;1
Present tooth: I Lost tooth: A;1Treated tooth: o
L ---------------------- ---J
There are 20 milk teeth in total; 10 each for the upper andlower jaws (see illustration on left). The front teeth of.thelower jaw (A) begin to erupt first at 6 to 7 months after birth.The 20 milk teeth should all’be in when your child becomes 2%to 3 years old. There are differences among individuals in theages and order of tooth eruption.
Since the milk teeth play an important role when the perma-nent teeth start to erupt, it is important to prevent their decayand-loss.
There are 32 permanent teeth in total, 16 each for the upperand the lower jaws (see illustration on the right). Some indi-viduals never cut the third molar teeth (wisdom teeth) (8). Thepermanent tooth which starts to grow first is the 1st molartooth (6-year molar tooth) (6) which has strong biting power.It starts to erupt when your child becomes 5 to 6 years old.By 12 to 13 years of age, all the permanent teeth except thewisdom teeth should come in.
–50–
Record of Major Diseases
Name of the disease Date of onset Remarks
_—month day year
—— .month day year
— . .month day year
—— —month day year
I I monti day year \—. —
—— —month day year
—— —month day year
—. —month day year
I I —. —month day year I
.—month day year
I I .—month day year I—. —month day year
I—. .month day year
–51–

Notes
1+
-L.b
Major Subsidies by the Government for Medical Costs
to Mothers and Children
o For toxemia of pregnancy and othersIf the pregnant or post-partum woman is affected by thefollowing diseases and needs to be hospitalized, medicalcosts are subsidized by the government:
toxemia of pregnancy, diabetes, anemia, excessivebleeding or heart diseases
o For premature babiesWhen a premature baby” needs continued hospitalization,medical costs are subsidized by the government.
o For designated chronic diseases of infantsIf a child is affected by any of the following diseases,medical costs are subsidized by the government:
malignant neoplasms, chronic renal diseases, asthma,chronic heart diseases, endocrine diseases, collagendiseases, diabetes, inborn errors of metabolism, andblood diseases such as hemophilia
o For physically handicapped childrenCosts for medical treatment and equipment for physicallyhandicapped children are subsidized by the government,
The above subsidies are awarded by criteria based on the degree
of the disease or the income of the guardian. Please consult the
health center for details.
-52- –53-
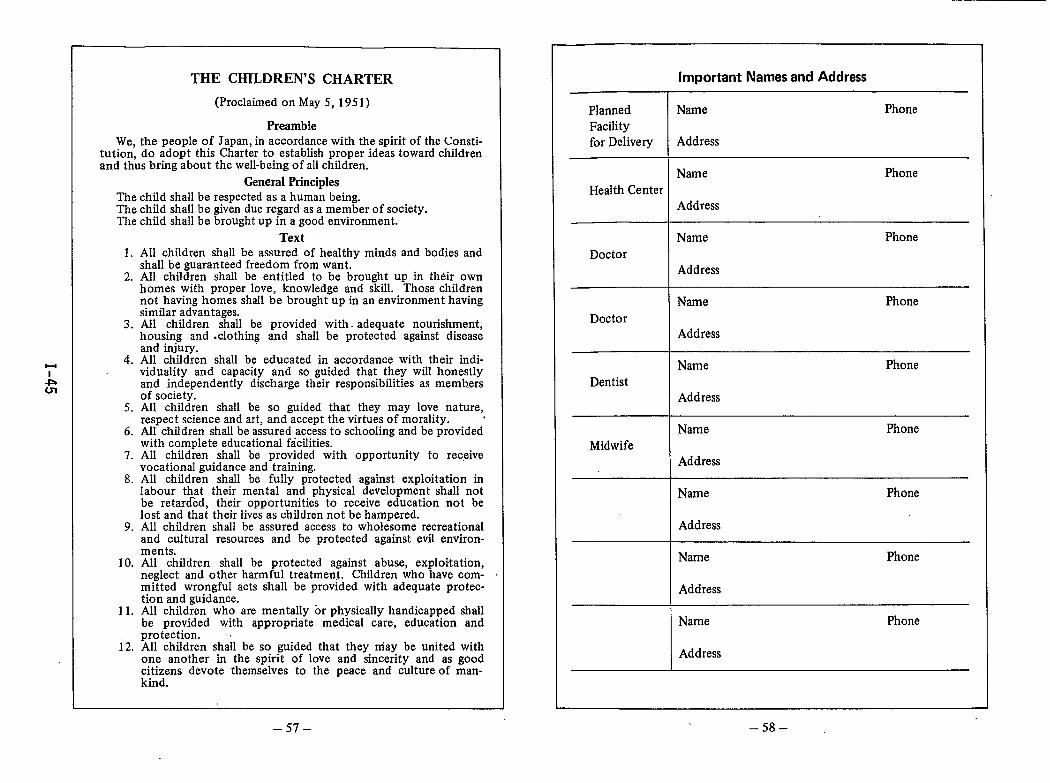
l-l
Am
THE CHILDREN’S CHARTER
(Proclaimed on May 5, 195 1)
PreambleWe, the people of Japan, inaccordance with thespirit of the Consti-
tution, do adopt this Charter to establish proper ideas toward childrenand thus bring about the well-being of all children.
General PrinciplesThe child shall be respected as a human being.The child shall be given due regard as a member of society.The child shall be brought up in a good environment.
Text1. All children shall be assured of healthy minds and bodies and
shall be guaranteed freedom from want.2. All children shall be entitled to be brought up in their own
homes with proper love, knowledge and skill. Those childrennot having homes shall be brought up in an environment havingsimilar advantages.
3. All children shall be provided with. adequate nourishment,housing and clothing and shall be protected against diseaseand injury.
4. All children shall be educated in accordance with their indi-viduality and capacity and so guided that they will honestlyand independently discharge their responsibilities as membersof society.
5. All children shall be so guided that they may love nature,respect science and art, and accept the virtues of morality. ‘
6. All children shall be assured access to schooling and be providedwith complete educational facilities.
7. All children shall be provided with opportunity to rec,eivevocational guidance and training.
8. All children shall be fully protected against exploitation inIabour that their mental and physical development shall notbe retar~ed, their opportunities to receive education not belost and that their lives as children not be hampered.
9. All children shall be assured access to wholesome recreationaland cultural resources and be protected against evil environ-ments.
10. All children shall be protected against abuse, exploitation,neglect and other harmful treatment. Children who have corn-mitted wrongful acts shall be provided with adequate protec-tion and guidance.
11. All children who are mentally or physically handicapped shallbe provided with appropriate medical care, education andprotection.
12. All children shall be so guided that they may be united withone another in the spirit of love and sincerity and as goodcitizens devote themselves to the peace and culture of man-kind.
important Names and Address
Planned Name Phone
Facility
for Delivery Address
Name Phone
Health CenterAddress
Name Phone
DoctorAddress
Name Phone
DoctorAddress
Name Phone
DentistAddress
Name Phone
MidwifeAddress
Name Phone
Address
Name Phone
Address
Name Phone
Address
–57– –58–
The Japanese Organization for International Coopera-tion in Family Planning (JOICFP) is a private, non-profitorganization approved by the Japanese Ministry of ForeignAffairs and Ministry of Health and Welfare, providing co-operation and assistance for promoting family planninga@ maternal and child health programs in developingcountries.
Its major activities are to implement the integratedfamily planning, nutrition and parasite control project (1P)in Asia, Africa, the South Pacific, and Latin America incooperation with IPPF (International Planned ParenthoodFederation), UNFPA (United Nations Fund for Population
I Activities), UNICEF, WHO and other international organi-zations. To meet this aim, JOICFP also conducts regularinternational meetings, se”minars and training programs,and provides commodities, information, and publicationservices in Japan and other countries in the world.
JOICFPHoken Kaikan Bekkan, 1-1, Sadohara-cho, Ichigaya,Shinjuku-ku, Tokyo 162, JapanTel: 03-268-5875Cable: JOICFPJAPAN TOKYO,Telex: 2324584 JOICFP J .
JlmIn order to contribute to the social and economic
development of the developing world, the Japan Inter-national Cooperation Agency (JICA), an executing agencyof the aid prograrnmes of the Government of Japan, ex-tends international cooperation mainly in the field oftechnical cooperation to developing countries on the basisof agreements concluded between the Japanese Govern-ment and the governments of these countries.
From the viewpoint that the development of humanresources enables a wide range of people to participate inthe development process and share the fruit of growth,JICA is putting increasing emphasis on technical coopera-ticm for human resources development.
JICAShinjuku Mitsui Bldg.,2-1-1, Nishi-Shinjuku, Shinjuku-ku, Tokyo 163, JapanTel: 03-345-5311 Telex: J22271
I-46
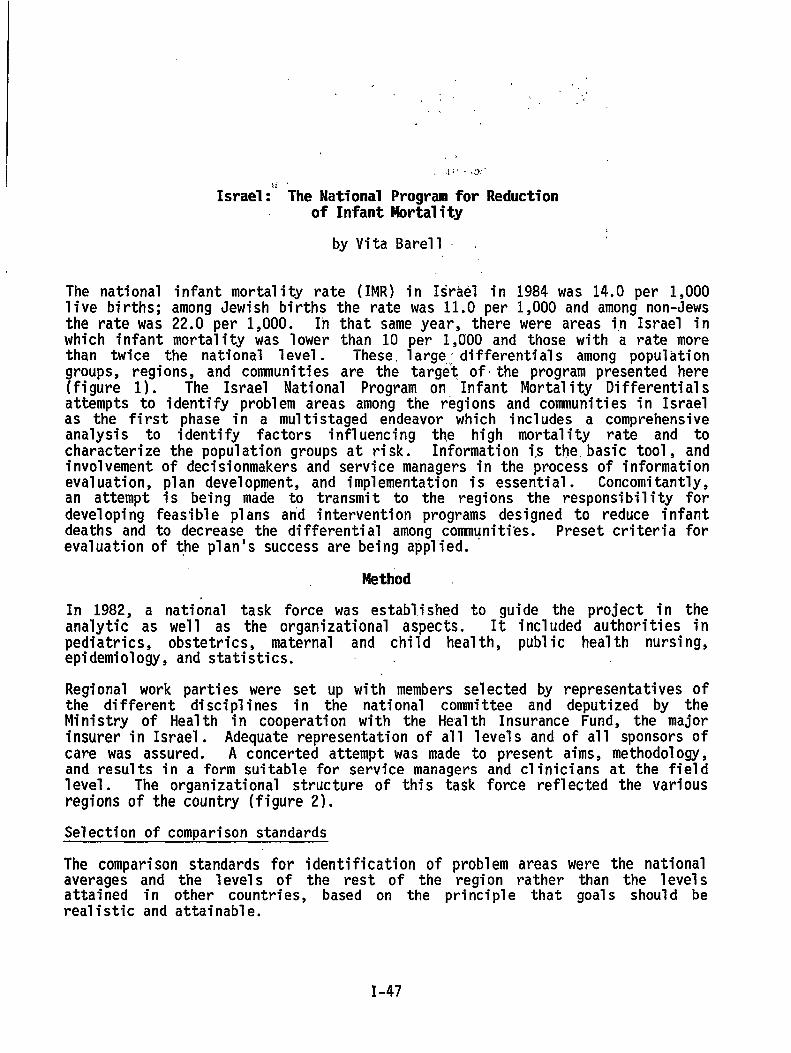
.,,,,’
.;
.~; .,.:). . .
itIsrael: The National Program for Reduction
of Infant Mortality
by Vita Barel1
The national infant mortality rate (IMR) in Israel in 1984 was 14.0 per 1,000live births; among Jewish births the rate was 11.0 per 1,000 and among non-Jewsthe rate was 22.0 per 1,000. In that same year, there were areas in Israel inwhich infant mortality was lower than 10 per 1,000 and those with a rate morethan twice the national level. These, large,;differentials among populationgroups, regions, and communities are the ’targe”tofthe program presented here(figure 1). The Israel National Program on Infant Mortality Differentialsattempts to identify problem areas among the regions and conmwnities in Israelas the first phase in a multistage endeavor which includes a comprehensiveanalysis to identify factors influencing the high mortality rate and tocharacterize the population groups at risk. Information i,sthe.basic tool, andinvolvement of decisionmakers and service managers in the process of informationevaluation, plan development, and implementation is essential. Concomitantly,an attempt is being made to transmit to the regions the responsibility fordeveloping feasible plans and intervention programs designed to reduce infantdeaths and to decrease the differential among comnuniti’es. Preset criteria forevaluation of the plan’s success are being applied.
Method
In 1982, a national task force was establ,ishe.dto guide the project in theanalytic as well as the organizational aspects. It included authorities inpediatrics, obstetrics, maternal and child health, public health nursing,epidemiology, and statistics.
Regional work parties were set up with members selected by representatives ofthe different disciplines in the national committee and deputized by theMinistry of Health in cooperation with the Health Insurance Fund, the majorinsurer in Israel. Adequate representation of all levels and of all sponsors ofcare was assured. A concerted attempt was made to present aims, methodology,and results in a form suitable for service managers and clinicians at the field1evel. The organizational structure of this task force reflected the variousregions of the country (figure 2).
Selection of comparison standards
The comparison standards for identification of problem areas were the nationalaverages and the levels of the rest of the region rather than the levelsattained in other countries, based on the principle that goals should berealistic and attainable.
I-47
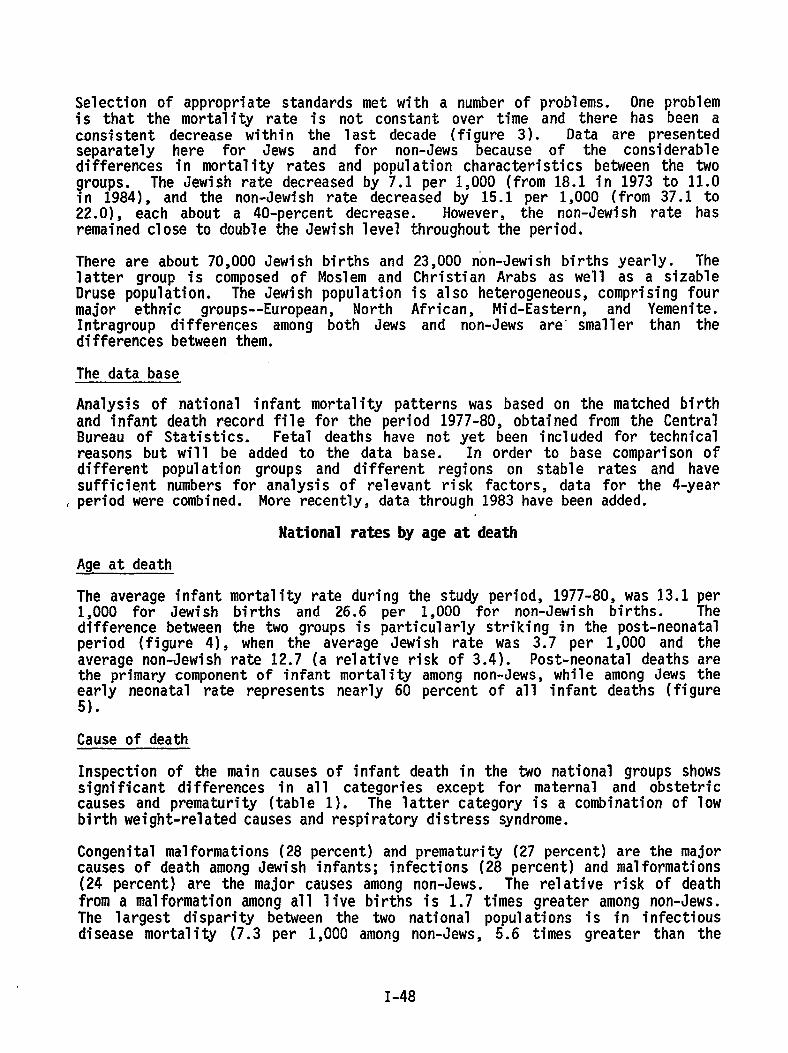
Selection of appropriate standards met with a number of problems. One problemis that the mortality rate is not constant over time and there has been aconsistent decrease within the last decade (figure 3). Data are presentedseparately here for Jews and for non-Jews because of the considerableedifferences in mortality rates and population character sties between the twogroups. The Jewish rate decreased by 7.1 per 1,000 (from 18.1 in 1973 to 11.0in 1984), and the non-Jewish rate decreased by 15.1 per 1,000 (from 37.1 to22.0), each about a 40-percent decrease. However, the non-Jewish rate hasremained close to double the Jewish level throughout the period.
There are about 70,000 Jewish births and 23,000 non-Jewish births yearly. Thelatter group is composed of Moslem and Christian Arabs as well as a sizableDruse population. The Jewish population is also heterogeneous, comprising fourmajor ethnic groups--European, North African, Mid-Eastern, and Yemenite.Intragroup differences among both Jews and non-Jews are” smal1er than thedifferences between them.
The data base
Analysis of national infant mortality patterns was based on the matched birthand infantdeath recordfile for the period 1977-80, obtained from the CentralBureau of Statistics. Fetal deaths have not yet been included for technicalreasons but will be added to the data base. In order to base comparison ofdifferent population groups and different regions on stable rates and havesufficient numbers for analysis of relevant risk factors, data for the 4-year
, period were combined. More recently, data through 1983 have been added.
Age at death
The average infant1,000 for Jewishdifference between
National rates by age at death
mortality rate during the study period, 1977-80, was 13.1 perbirths and 26.6 per 1,000 for non-Jewish births. Thethe two groups is particularly striking in the post-neonatal
period (figure 4), when the average-Jewish rate was 3:7 per ljOOO and theaverage non-Jewish rate 12.7 (a relative risk of 3.4). Post-neonatal deaths ar@the primary component of infant mortality among non-Jews, while among Jews theearly neonatal rate represents nearly 60 percent of all infant deaths (figure5).
Cause of death
Inspection of the main causes of infant death in the two national groups showssignificant differences in all categories except for maternal and obstetriccauses and prematurity (table 1). The latter category is a combination of lowbirth weight-related causes and respiratory distress syndrome.
Congenital malformations (28 percent) and prematurity (27 percent) are the majorcauses of death among Jewish infants; infections (28 percent) and malformations(24 percent) are the major causes among non-Jews. The relativerisk of deathfrom a malformationamong all 1ive birthsis 1.7 times greateramong non-Jews.The largest disparitydisease mortality (7.3
b&ween the two national popula~ions is in-infectiousper 1,000 among non-Jews, 5.6 times greater than the
I-48

comparable rate among Jews--l.3 per 1,000). This excess is mainly due togastrointestinal infections.
Maternal age at delivery, maternal education and parity, and differences in~urban-rural residence all contribute to the. differential between nationalgroups. Multivariate analyses are being performed for evaluation of the “.contribution of these factors to the differences in infant mortalitY. ~
Regional Analysis
Israel has about 4 million inhabitants: 3,400,000 Jews and 670,000 non-Jews.The country is divided into 23 health regions with 100,000-300,000 persons each.These regions have only recently been defined and do not represent functioningadministrative entities.
The current project is limited to six of these regions situated throughout thecountry. The six regions under investigation include about 31 percent of allthe births in the nation among Jews and non-Jews alike. The combined IMR forall regions is similar to the national rate ‘during the study period. Ouranalysis shows considerable differences in crude rates among the differentregions (figure 6), with the Ramat Gan region the lowest. For example, ‘among’non-Jews in the Nahariya area, the infectious disease mortality rate wasparticularly disturbing. In the Beer Sheva southern region, deaths associatedwith low birth weight were the highest ranking cause of death among Jews, withexcess respiratory deaths as well.
Statistical Methods
In order to obtain relatively stable rates within the regions and in communitiesof only a few hundred births, data for a number of years were combined.Communities with very few deaths were grouped together with others in the sameregional council or combined with communities of similar “characteristics(kibbutzim, rural villages). A community is considered to have excess mortalityif at least one of the following conditions exists:
1. There is an excess in crude IMR.
2. There is an excess in the earlyrate.
3. There is an excess rate in one or
The community”rates were compared toregion and to the national standards.
neonatal, late neonatal
more specific causes of
Y or post-neonatal
death. ‘
the “comparablerates in the rest of theThe quantitative basis for definitionof
a ~ommunity with excess infant mortality was the level of significance of thedifference between its rate and the national or regional rates, a mea’sureofdistance from the standard. The definition was chosen with the approach that itis preferable to obtain false positives (communities identified as having exdess “mortality, while their deviation from the standard is a chance deviation) thanfalse negatives (conwnunitieswith excess mortality which are not identified).
I-49
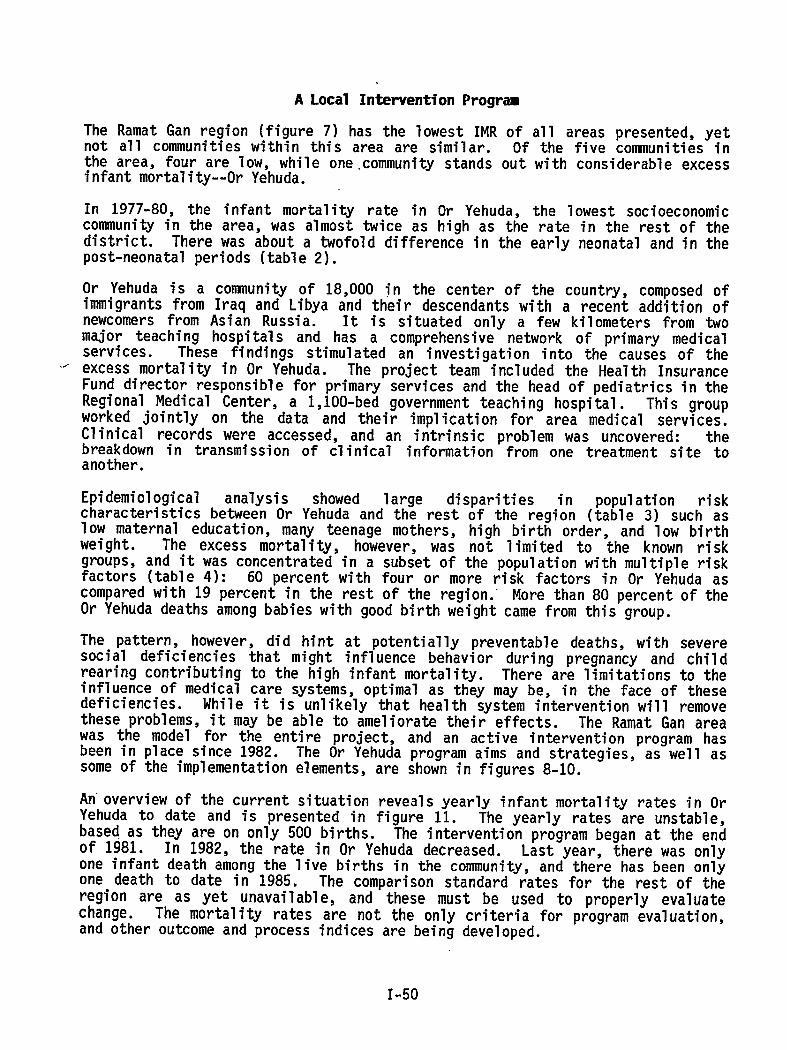
A Local Intervention Program
The Ramat Gan region (figure 7) has the lowest IMRof all areas presented, yetnot all communities within this area are similar. Of the five connnunitiesinthe area, four are low, while one.community stands out with considerable excessinfant mortality--Or Yehuda.
In 1977-80, the infant mortality rate in Or Yehuda, the lowest socioeconomiccommunity in the area, was almost twice as high as the rate in the rest of thedistrict. There was about a twofold difference in the early neonatal and in thepost-neonatal periods (table 2).
Or Yehuda is a community of 18,000 in the center of the country, composed ofimmigrants from Iraq and Libya and their descendants with a recent addition ofnewcomers from Asian Russia. It is situated only a few kilometers from twomajor teaching hospitals and has a comprehensive network of primary medicalservices. These findings stimulated an investigation into the causes of the
“ excess mortality in Or Yehuda. The project team included the Health InsuranceFund director responsible for primary services and the head of pediatrics in theRegional Medical Center, a 1,100-bed government teaching hospital. This groupworked jointly on the data and their implication for area medical services.Clinical records were accessed, and an intrinsic problem was uncovered: thebreakdown in transmission of clinical information from one treatment site toanother.
Epidemiological analysis showed 1arge disparities in population riskcharacteristics between Or Yehuda and the rest of the region (table 3) such as10W maternal education, many teenage mothers, high birth order, and low birthweight. The excess mortality, however, was not limited to the known riskgroups, and it was concentrated in a subset of the population with multiple riskfactors (table 4): 60 percent with four or more risk factors in Or Yehuda ascompared with 19 percent in the rest of the region.” More than 80 percent of theOr Yehuda deaths among babies with good birth weight came from this group.
The pattern, however, did hint at potentially preventable deaths, with severesocial deficiencies that might influence behavior during pregnancy and childrearing contributing to the high infant mortality. There are limitations to theinfluence of medical care systems, optimal as they may be, in the face of thesedeficiencies. While it is unlikely that health system intervention will removethese problems, it may be able to ameliorate their effects. The Ramat Gan areawas the model for the entire project, and an active intervention program hasbeen in place since 1982. The Or Yehuda program aims and strategies, as well assome of the implementation elements, are shown in figures 8-10.
An”overview of the current situation reveals yearly infant mortality rates in OrYehuda to date and is presented in figure 11. The yearly rates are unstable,based as they are on only 500 births. The intervention program began at the endof 1981. In 1982, the rate in Or Yehuda decreased. Last year, there was onlyone infant death among the live births in the community, and there has been onlyone death to date in 1985. The comparison standard rates for the rest of theregion are as yet unavailable, and these must be used to properly evaluatechange. The mortality ratesand other outcome and process
are not the only criteria for program evaluation,indices are being developed.
1-50
Application of Demonl%tration
The Or Yehuda program serves as a model for thewocessin~ and statistical techniques developed in
Project
national program. The datathe analysis of the Ramat Gan
~egiona~ ‘pr~totype are beipg applied for all. six rqgions. Analysis ofpopulation risk characteristics and characteristic-specificmortality rates arecurrently underway and will be used for targeting intervention.
Thirty-six other communities among the study regions have been identified ashaving excess infant mortality according to one or more of the predefinecriteria. The regional working parties have developed their own situationanalyses on the basis of data provi,ded and local information. They haveprepared tentative intervention programs according to local problems,priorities, and feasibility.
The central working party is responsible for standard setting in data analysisand for coordination and guidance of the regional committees. The 1ocallydeveloped planning program in Or Yehuda, using epidemiological techniques toidentify public health problems and target populations, has become the model forthe National Infant Mortality Differential Project, and both are developingalong the lines of a planning cycle. Change takes place in a real-worldenvironment, with different sponsors of medical care, different levels ofproficiency among medical and nursing care givers, and very different populationneeds within each region.
I
1-51
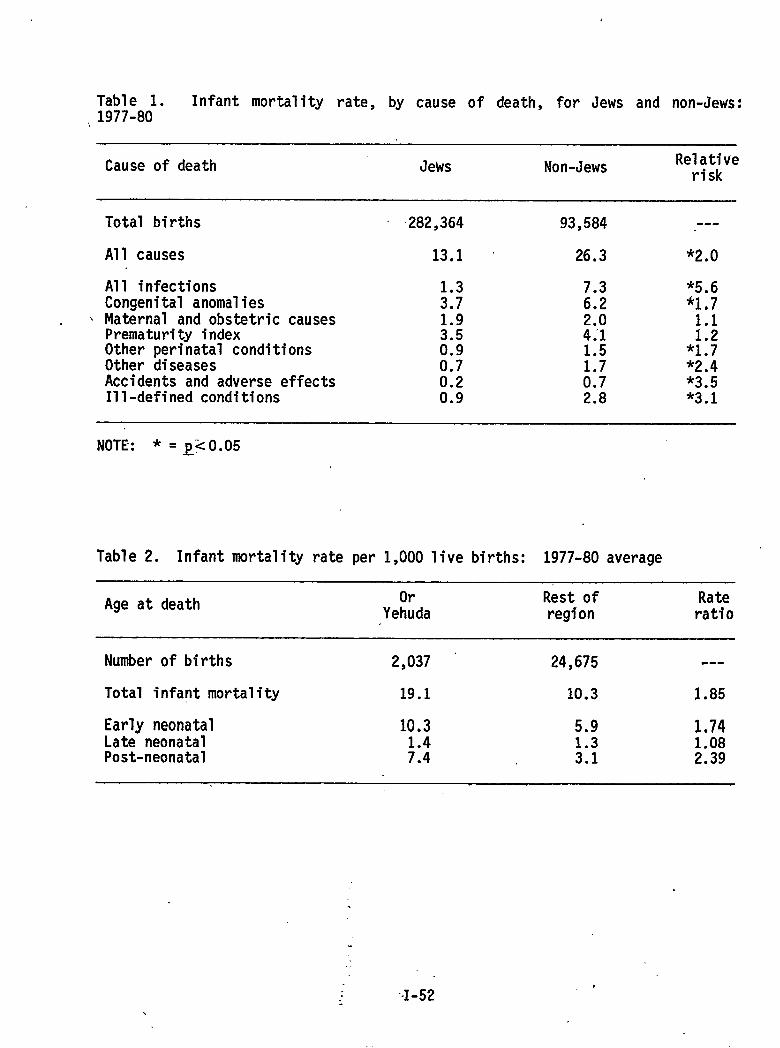
Table 1. Infant mortality rate, by cause of death, for Jews and non-Jews:,1977-80
Cause of death Jews Non-Jews Relativerisk
\
Total births
All causes
All infectionsCongenital anomaliesMaternal and obstetric causesPrematurity indexOther perinatal conditionsOther diseasesAccidents and adverse effectsIll-defined conditions
282,364
13.1
H1.93.50.90.7
:::
93,584
26.3
7.36.2
:!/
H0.72.8
---
*2*-J
*5.6*1,7
;::*1.7*2.4*3.5*3.1
NOTE: * . Q<O.05
Table 2. Infant mortality rate per 1,000 live births: 1977-80 average
Age at death Or Rest of RateYehuda region ratio
Number of births 2,037 24,675 .-.
Total infant mortality 19.1 10.3 1.85
Early neonatal 10.3 5.9 1.74Late neonatal 1.3 1,08Post-neonatal ;:: 3.1 2.39
.
.
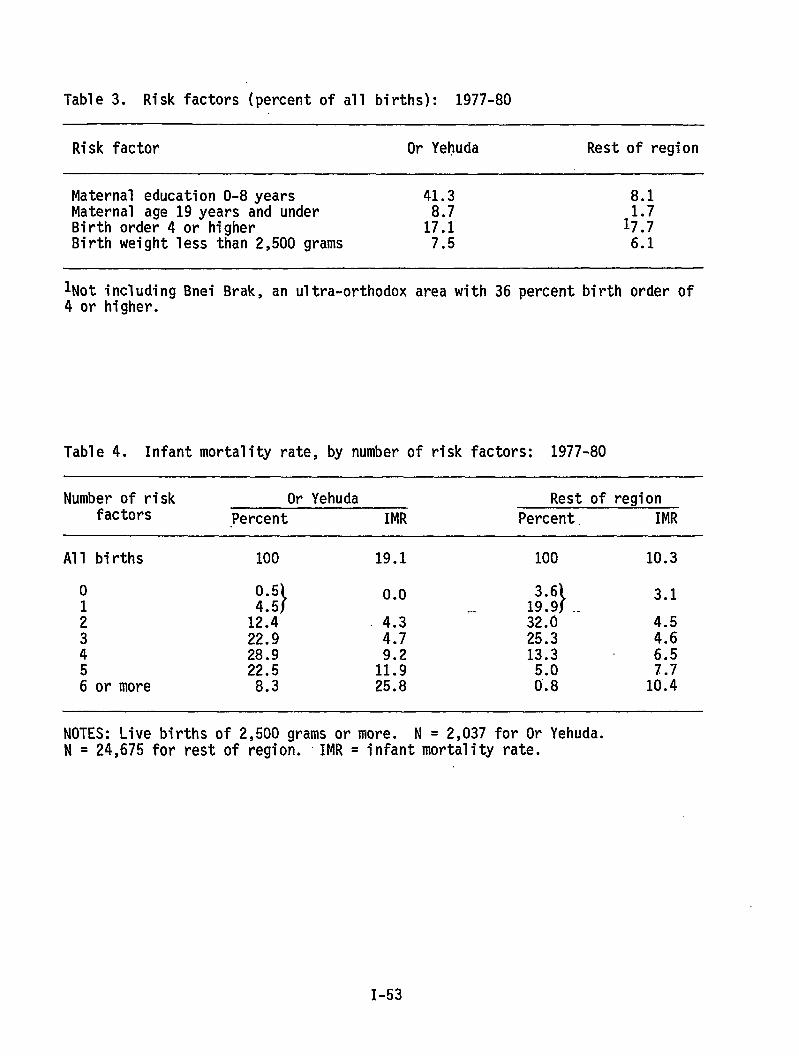
Table 3. Risk factors (percent of all births): 1977-80
Risk factor Or Yehuda Rest of region
Maternal education O-8 years 41.3 8.1Maternal age 19years and underBirth order 4 or higher 1;:; 1;:;Birth weight less than 2,500 grams 7.5 6.1
lNot including Bnei Brak, an ultra-orthodox area with 36 percent birth order of4 or higher.
Table 4. Infant mortality rate, by number of risk factors: 1977-80
Number of risk Or Yehuda Rest of regionfactors Percent IMR Percent. IMR
All births 100 19.1 100 10.3
0 0.5}
0.0}
3.11::: ..
: 1;:: 4.3 ‘- 32.0 4.53 22.9 4.7 25.3 4.64 28.9 13.3 6.55 22.5 1::; 7.76 or more 8.3 25.8 ;;: 10.4
NOTES: Live births of 2,500 grams or more. N = 2,037 for Or Yehuda.N = 24,675 for rest of region. IMR = infant mortality rate.
I-53
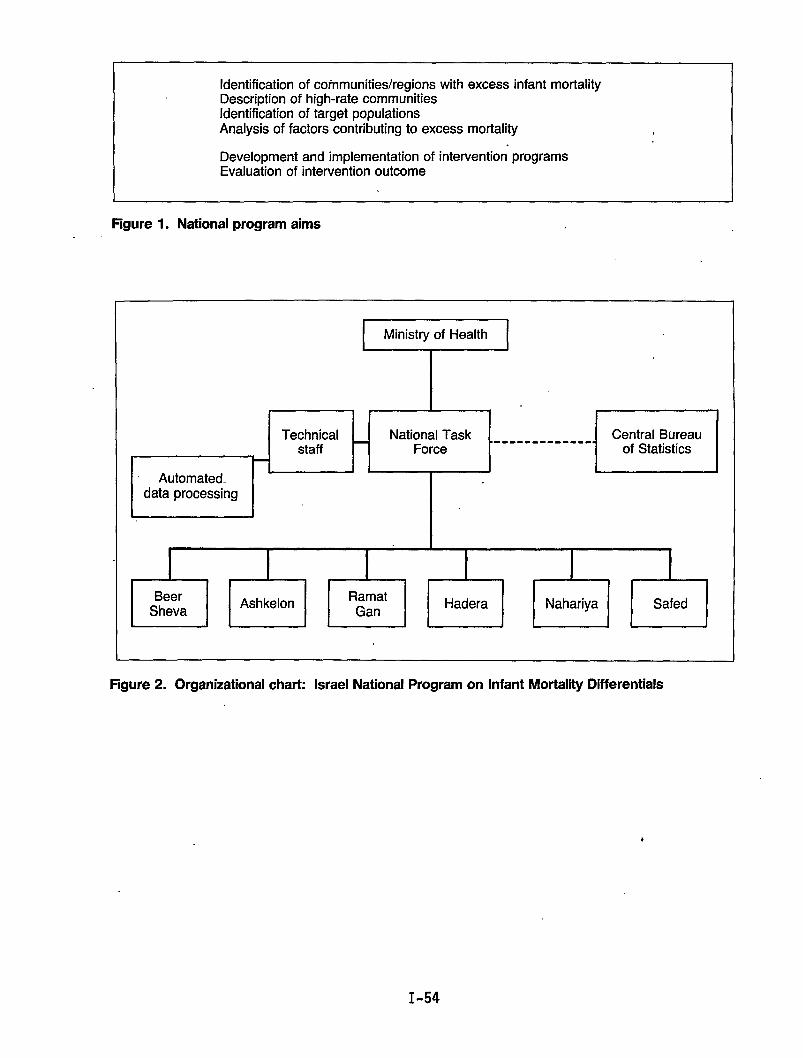
Identification of communities/regions with excess infant mortalityDescription of high-rate communitiesIdentification of target populationsAnalysis of factors contributing to excess mortality
Development and implementation of interventionEvaluation of intervention outcome
I
programs
Figure 1. National program aims
T “I
Technical National Task .staff Force
L
Automated..data processing
!------ ----
I I
1Central Bureau.-of Statistics I
I
I I I I I IBeer Ashkelon Ramat
Sheva GanHadera Nahariya Safed
Figure 2. Organizational chart: Israel National Program on Infant Mortality Differentials
I-54
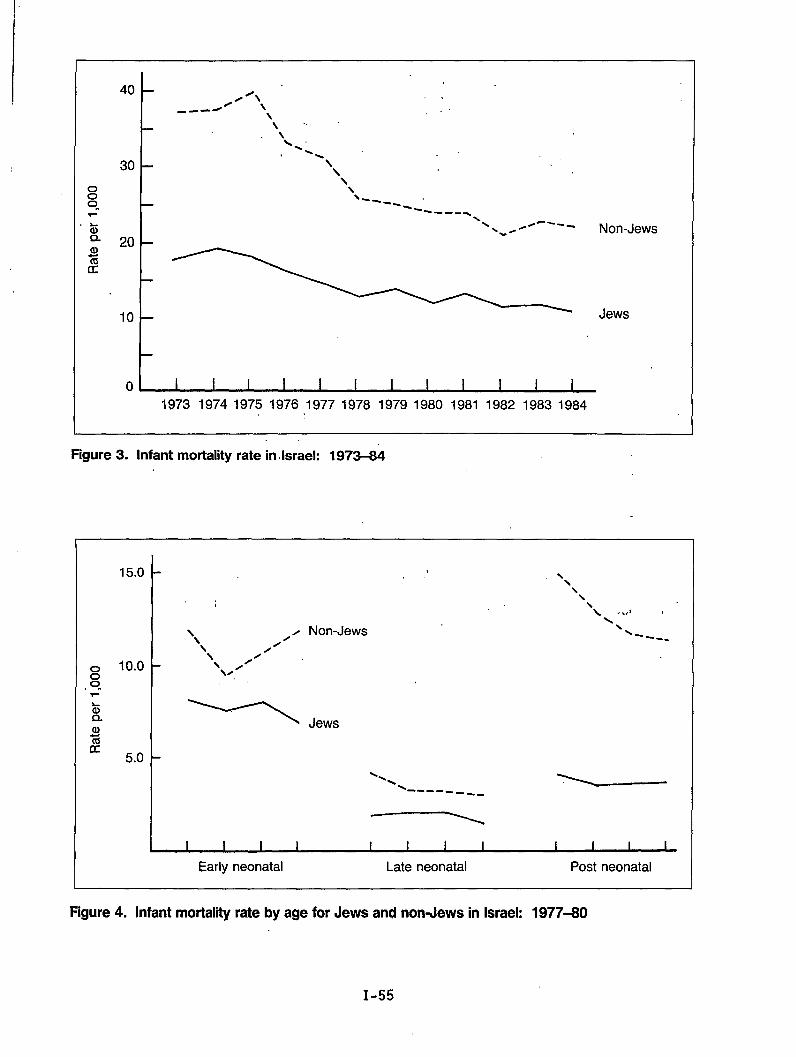
40
30
20
10
0
‘\ ,.4’ \.--= . .
\
Jews
1973 19741975 1976 19771978 19791980 1981 1982 19831984
Figure3. lnfantmortality rate in.lsrael: 1973-84
15.0
10.0
5.0
. .
Non-Jews
\\
\\‘\ .4
\\
\----
Jews
Early neonatal Late neonatal Post neonatal
Figure 4. Infant mortality rate by age for Jews and non-Jews in Israel: 1977-80
I-55
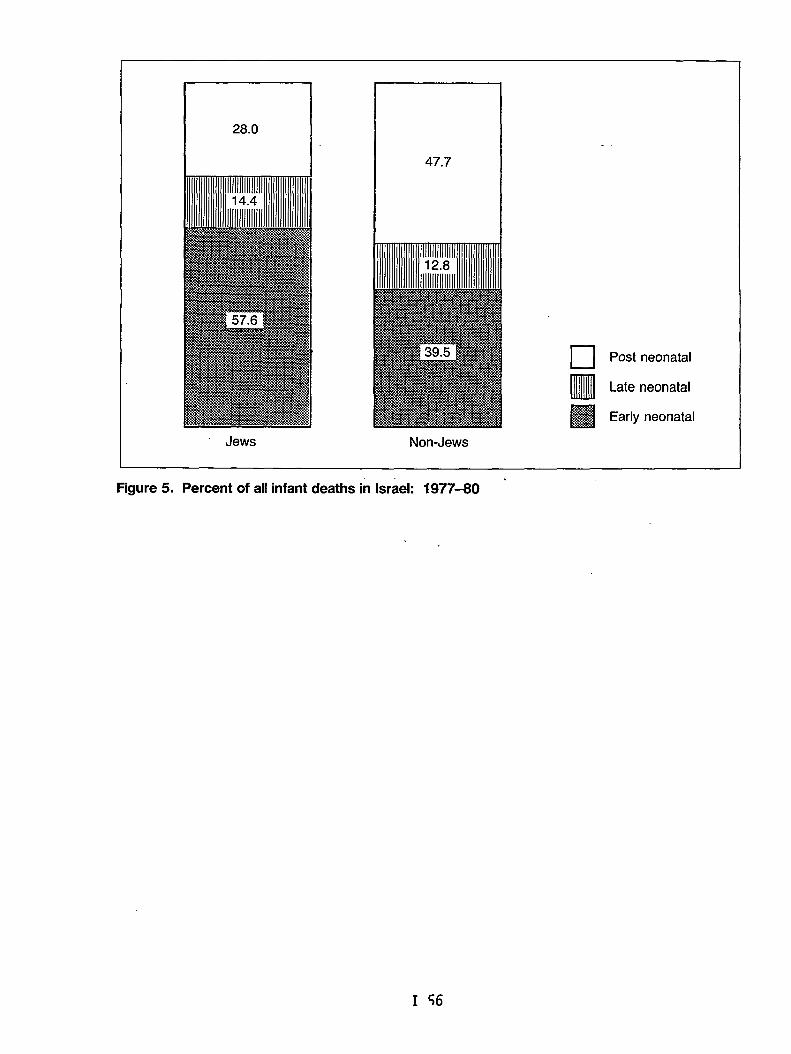
28.0
47.7
❑ Post neonatal
•IulllLate neonatal
IliliSl
.. .Early neonatal
Non-Jews
Figure 5. Percent of all infant deaths in Israel: 1977-80 ‘
I 56
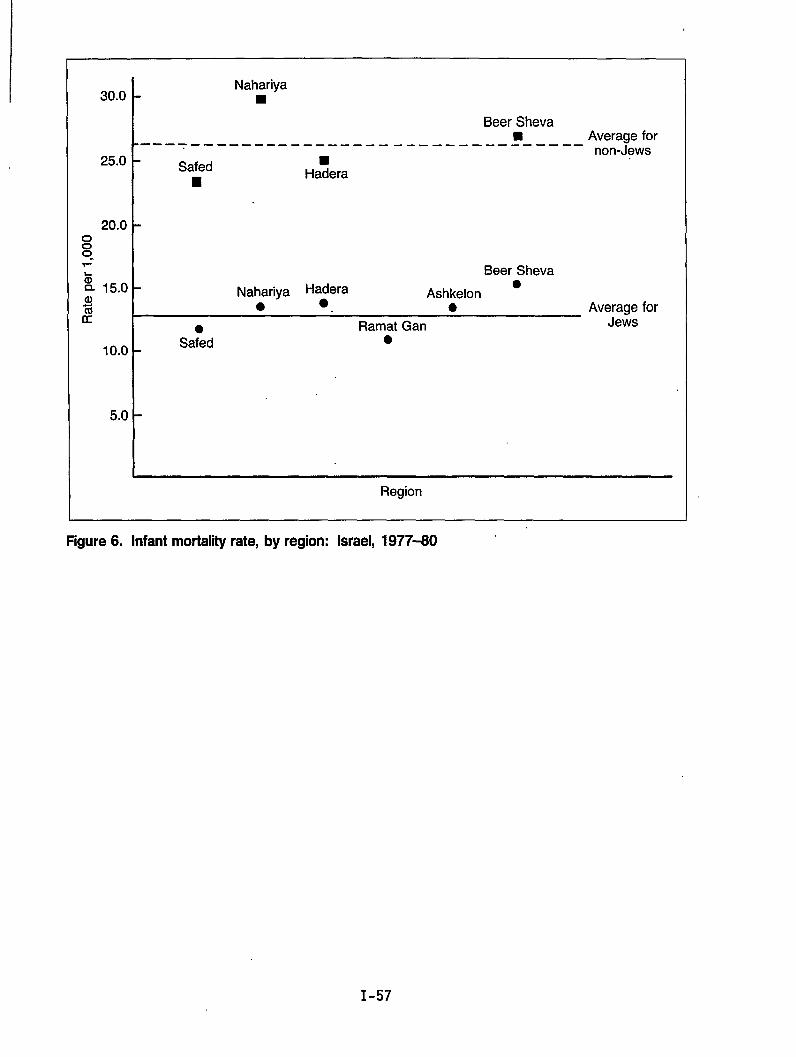
30.0
25.0
20.0
%Q 15.0a)%K
10.0
5.0
Nahariya■
Beer Sheva9 Average for---- ---- _____ ____ ____ ____ ____ ____ __
non-JewsSafed
■Ha?era
Beer Sheva
Nahariya Ha~era●
Ashkelon● ● Average for
Ramat Gan Jews
Sa;d ●
.
Region
Figure6. Infantmortalityrate, by region: Israel, 1977-60
I-57
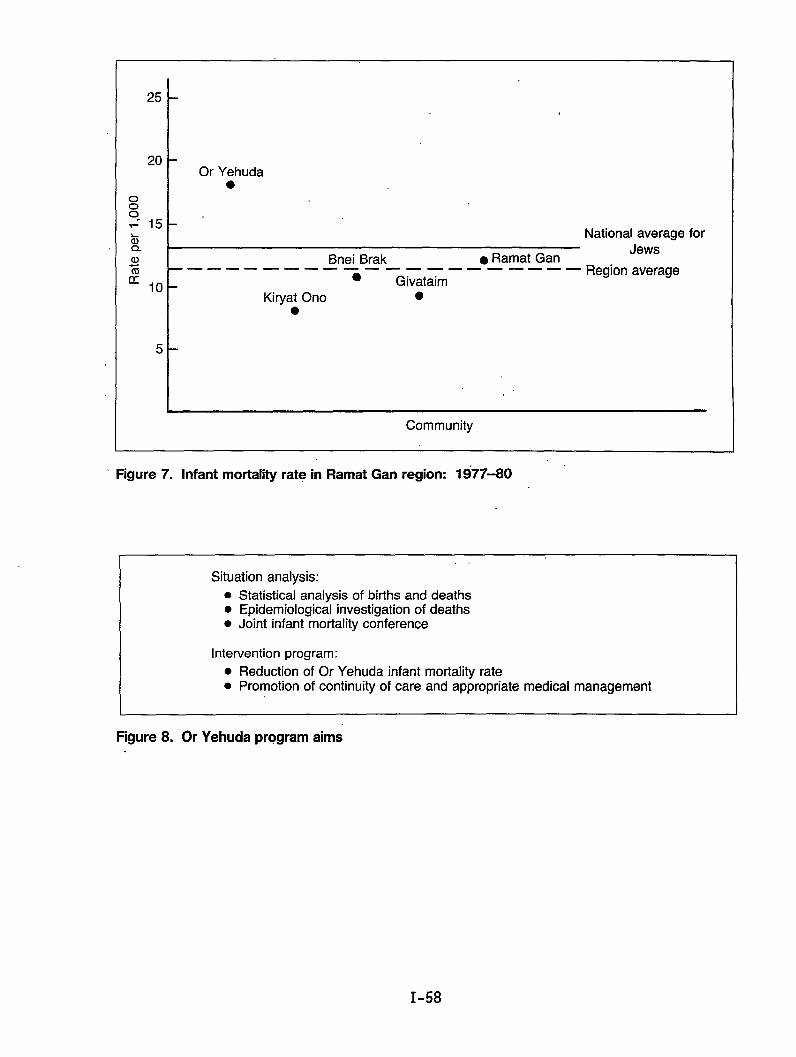
25
20
00
s 15zQaJam 10
Or Yehuda●
I Bnei Brak . Ramat Gan——— ——— ——— ——— —.. ——— ——
s GivataimKiryat Ono ●
●
5
I
National averageJews
Region average
for
‘ Figure 7. Infant mortality rate in Ramat Gan region: 1977-80
. .
Situation analysis:
. Statistical analysis of births and deaths
. Epidemiological investigation of deaths● Joint infant mortality Conference
Intervention program:
. Reduction of Or Yehuda infant mortality rate
. Promotion of continuity of care and appropriate medical management
Figure 8. Or Yehuda program aims
I-58
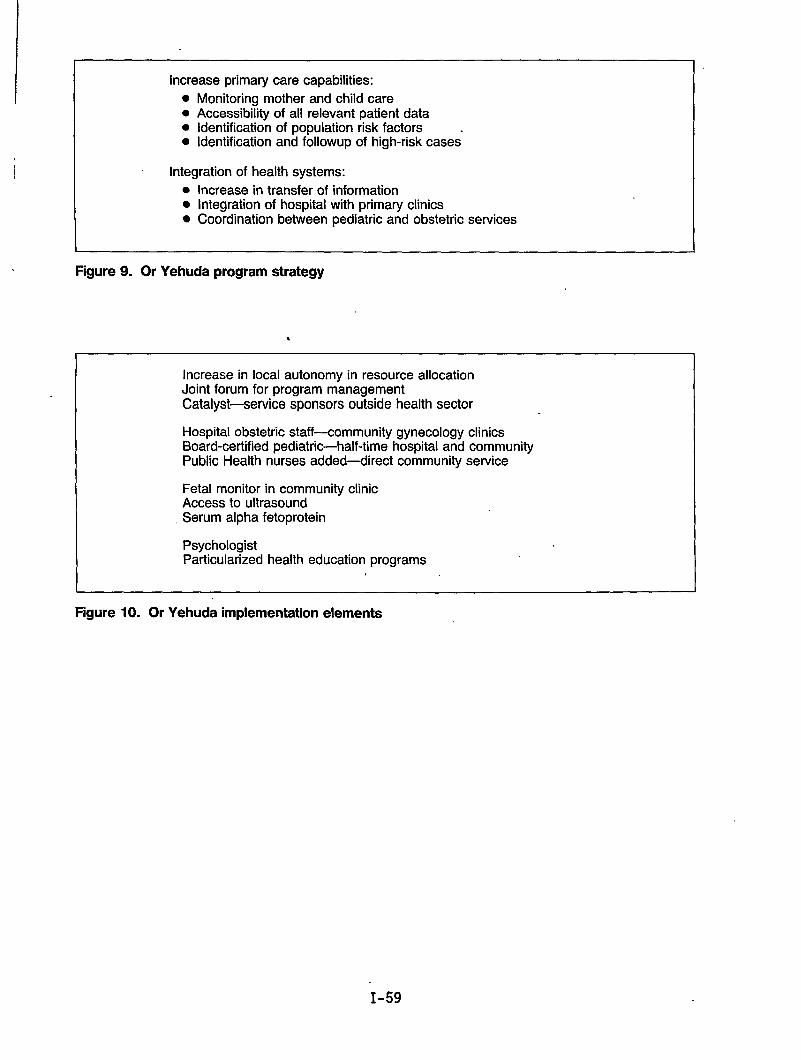
I Increase primary care capabilities:
! ● Monitoring mother and child care● Accessibility of all relevant patient data● identification of population risk factors .● Identification and followup of high-risk cases
Integration of health systems:
● Increase in transfer of information● Integration of hospital with primary clinics● Coordination between pediatric and obstetric services
I I
Figure 9. Or Yehuda program strategy
●
I 1
Increase in local autonomy in resource allocationJoint forum for program managementCatalyst—service sponsors outside health sector
Hospital obstetric staff-community gynecology clinicsBoard-certified pediatric-half-time hospital and communityPublic Health nurses added-direct community service
Fetal monitor in community clinicAccess to ultrasoundSerum alpha fetoprotein
PsychologistParticularized health education programs
Figure 10. Or Yehuda implementation elements
I-59
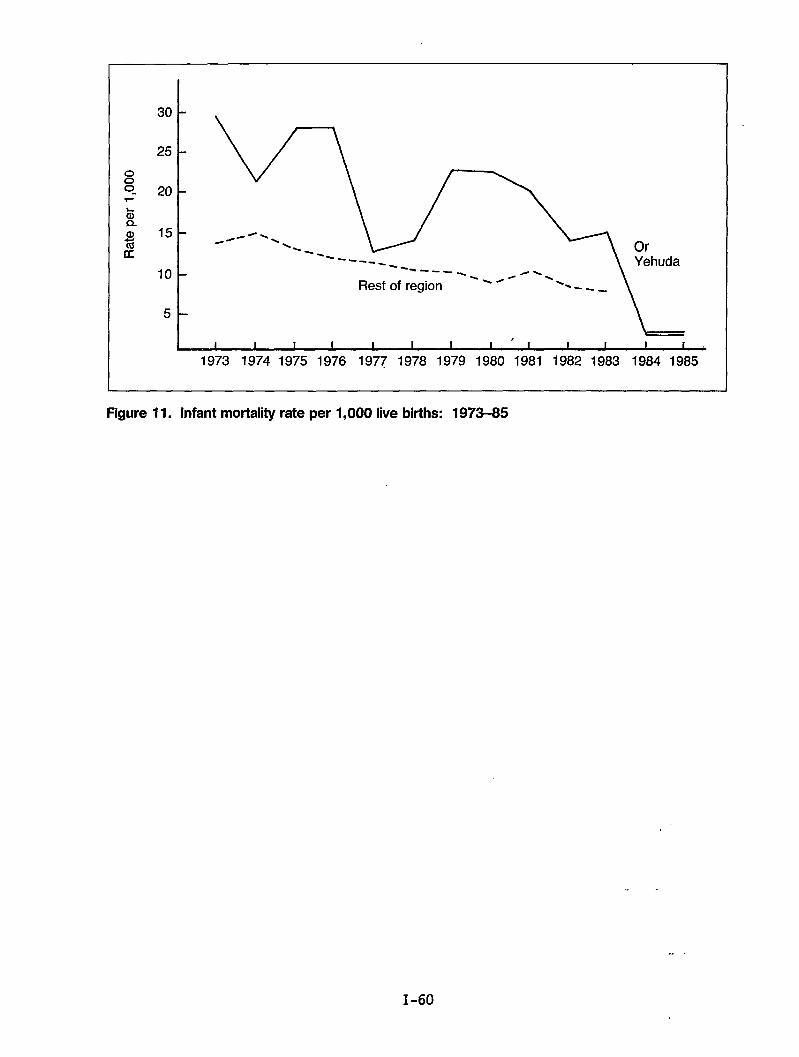
30
25
~0“ 201-
10
5
kI
,I I 1 I I I 1 I I I I i b
1973 1974 1975 1976 1977 1978 1979 1980 1981 1982 1983 1984 1985
Figure Il. lnfantmortality rate perl,OOO1ive bitths: 1973-85
--
.. .
1-60

. .
Chapter 11: Methodology
.
Perinatal Audit Experience in Norway:A Model for International Application
by Leiv S. Bakketeig, M.D., Per Bergsj!d,M.D., and Karl-Erik Larssen, M.D.
The Scandinavian countries have a record for having some of the lowest perinatalmortality rates. Among the three Scandinavian countries--Denmark, Norway, andSweden--Norway has the least favorable rates. The development of perinatalmortality rates over the last decade or so is shown in table 1. Sweden showsthe most favorable rates over the whole period and even has the most impressivedecline during this period. In 1983, the perinatal mortality was more than 30percent lower in Sweden as compared to Norway.
Comparisons of birth weight-specific perinatal mortality rates among these threecountries are shown in figure 1. The rates are shown for the year 1982 forDenmark, Norway, and Sweden. It appears that mortality is consistently higherin Norway than in the two other countries for each of the weight categories.For example, for average-sized births (weighing more. than 3,000 grams), theperinatal mortality is 50 percent higher in Norway than in Sweden. Thesedifferences in perinatal mortality rates are mainly due to differences in thestillbirth rates among the three countries, as shown in figure 2. In thesecomparisons, the standard definition of stil1birth has been used (fetal deathaged 28 weeks or more). It should also be mentioned that birth weight-specificcomparisons are justified and valid among the Scandinavian countries, since theunderlying birth weight distributions are very similar indeed.
If we accept that the shown differences in mortality in these three countriesare most likely due to real differences, what ,then could account for them?Well, in principle, the differences could be explained in three different waysor through a combination of these three:
o The childbearing population could differ biologically among the threecountries;
o The habits of living, the psychosocial environment, or the environment at1arge COU1d differ; or finally,
o The perinatal care which is being offered and being utilized by the womenand their newborns could also differ.
We do not have reason to believe that there exist any important biologicaldifferences among the fertile female populations in the three countries. We donot know enough about differences in habits of living, but from what is known--for example, about smoking habits--we have 1ittle evidence of any considerableedifferences of this kind among the three populations. Finally, we come to the
II-3
medical or perinatal care available in the three countries. There has been andcontinues to be much speculation as to whether the organization and content ofperinatal care can explain the mortality differences, at 1east partly.
Attention has been focused, in particular, on two features of perinatal care.The first feature to be examined is the organization and context of antenatalcare. This care has, until now, been rather loosely organized in Norway. Thegeneral practitioners have been in charge of the care, and until recently noreal attempt to standardize the content of care has been made. In contrast, inSweden and also to some extent in Denmark, the antenatal care is organizedthrough maternity centers where the midwives play a key role as care providers,assisted by general practitioners, obstetricians, and other specializedpersonnel, with strict guidelines for the content of care, including guidelinesfor referrals among different levels of care.
The second feature to be discussed is the delivery services and the neonatalservices, which have been examined in an attempt to explain the differences inmortality. These parts of perinatal care are more centralized in Sweden. InDenmark, due to geography, even though the deliveries do not necessarily occurin the larger hospitals, the distance to the nearest more specializedobstetrical and neonatal services is less crucial.
In Norway, even though practically all births occur in maternity institutionsand even though considerable centralization of deliveries has occurred over thelast two decades, as shown in table 2, 50 percent of all low birth weight birthsstill take place in institutions without an available neonatal intensive careunit. Referral of high-risk mothers to specialized institutions has become moreeffective. However, one-third of all low weight births (less than 2,500 grams)and one-fourth of all very low weight births (less than 1,500 grams) still occurin hospitals without a neonatal intensive care unit.
In order to explore the reasons for the relatively poorer perinatal statisticsin Norway, the medical audit method has been applied to perinatal care. Aperinatal audit was conducted in 1980 based on 1980 perinatal deaths in 5 (of19) selected counties in Norway (Larssen et al., 1982). For each of theperinatal deaths, all available information was collected for the differentlevels of care (antenatal, intrapartum, and neonatal care). Additionalinformation on all fetal deaths with gestational “age24 weeks or more and alldeaths during the first month after birth was CO1lected using a speciallydesigned form. In each of the participating counties, the data collection wascoordinated by a se%ior pediatrician located at the pediatric department at thecentral county hospital. A panel of experts reviewed all the availableinformation together with the local coordinating pediatrician. The panel ofexperts consisted of an obstetrician, a midwife, a pediatrician, and a child“pathologist. The panel was chaired by an epidemiologist. A study pediatricianprepared and organized the information and the panel meetings.
The panel members thoroughly reviewed the records and all available documentsprior to each panel meeting. The main purpose of the review was to classify thedeaths into unavoidable and potentially avoidable deaths. Certain criteria forunavoidable deaths were agreed upon initially, such as lethal malformations,birth weight less than 700 grams, and gestational age less than 26 weeks.
II-4
Potentially avoidable.death~.were sought and were subgrouped into whether thedeaths were potentially avoidable given the available resources (meaningpersonnel andl,,equipment) or, whether -the avoidability, required additionalresources or delivery in a better equipped clinic. The panel reviewed 270perinatal deaths, which could be.shown by linkage with the information in theMedical Birth Registry of Norway to be a complete coverage of all perinataldeaths in the five counties-during.the actual 12-month period., Of the deaths,190 (70 percent) were classified as unavoidablee. A majority of the remaining 80deaths were classified as potentially avoidable given the actual setting and theavailable resources at the,place of delivery (65 deaths). Only slightly morethan 5 percent of the deaths (or 15 deaths) were considered to be potentiallyavoidable given more optimal resources or a more appropriate place of delivery.The panel of experts triedto locate the avoidable factors. These avoidablefactors were mostly associated with either the antenatal or the neonatal care.
Later, the same Norwegian panel of experts applied the same method to a sampleof Swedish perinatal deaths (Eksmyr et al., 1986). Deaths from one averageSwedish county were examined, and the deaths were selected from two timeperiods, one in the first half,.andone in the latter half of the 1970’s. Thepanel members were not told in which period the deaths occurred. In this way,one could get a closer look at which deaths disappear as the mortality drops, asit certainly did in Sweden during the 1970’s. Also, this audit made it possibleto compare perinatal deaths between the two countries.
The main findings are illustrated in table 3. Of the deaths in the first timeperiod, 47 percent were considered potentially avoidable, while this proportionin the latter period had dropped to 14 percent. As shown in table 3, the rateof unavoidable deaths did not change very much (as expected) from the firstperiod to the latter. The unavoidable stillbirths became somewhat fewer, butthis could be ascribed to prenatal diagnoses and the use of induced abortions.The rate of unavoidable perinatal deaths was moderately reduced from 7.3 per1,000 to 6.2 per 1,000. The -potentially avoidable stillbirths and earlyneonatal deaths, however, were dramatically reduced, and the rate of such deathsdropped significantly from 6.4 to 1.0 per 1.,000from the first to the latterperiod. .’
The reduction in potentially,avoidabledeaths occurred in all weight groups; anddeaths weighing more than 2,500 grams had nearly disappeared completely. Thedeaths that particularly.had..disappeared were deaths which might be due toinsufficient followup during antenatal care, deaths associated with delayedtransfers, and deaths due to inadequately performed ventilator treatment.These also were the deaths.thatwere observed in the Norwegian audit, but whichin comparison had disappeared in the latest period in the Swedish county.
In conclusion, we believe one can learn from comparative studies of this type.International comparisons ~f perinatal outcomes might be enhanced by the use,ofsimilar medical audit approaches. An international perinatal audit COU1d beorganized in a manner similar to the Norwegian/Swedish one presented here or,for example, through an internationally composed panel of experts or somecombination of these approaches. Based on new available data sets,international comparisons of perinatal outcome statistics obviously will becomemore sophisticated. However, in order to enhance our understanding of thedifferences and their explanations,we will need to get beyond statistical
II-5
comparisons, and here the audit method has an interesting potential. Inaddition, we have devised a model for descriptive comparisons that we alsobelieve would be useful in improving our knowledge of international differencesand the reasons for these variations (exhibit A).
References
Eksmyr, R., K.-E. Larssen, L. S. Bakketeig, et al. 1986. Perinatal mortalityin a Swedish county, 1973-1978, Time trends revealed by Perinatal Audit. ActsPediatr. Stand. 75:17-23.
Larssen, K.-E., L. S. Bakketeig, P. Bergsj$, et al. 1982. Perinatal Audit inNorway, 1980. NIS Report 7/82. Trondheim, Norway.
.,
II-6
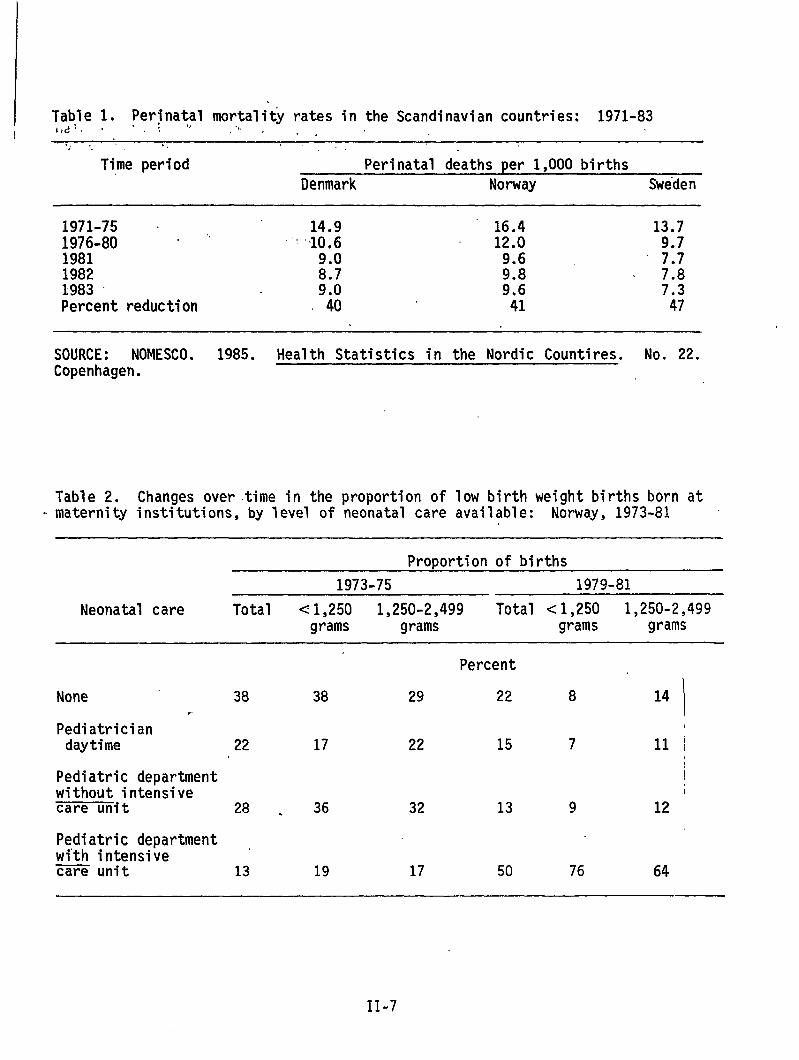
Table 1. Perinatal mortality rates in the Scandinavian countries: 1971-83l+d~ ‘ “ , .,., .,./ ., ,!.!
Time period Perinatal deaths per 1,000 birthsDenmark Norway Sweden
1971-75 ‘ 14.9 16.4 13.7;;;;-80 “ ““ “ 10.6 12.0
9.0 9.6 ‘ ;:;1982 8.7 9.8 7.81983 9.0 9.6 7.3Percent reduction 40 41 47
SOURCE: NOMESCO. 1985. Health Statistics in the Nordic Countires. No. 22.Copenhagen.
Table 2. Changes overtime in the proportion of low birth weight births born at- maternity institutions, by level of neonatal care available: Norway, 1973-81
Proportion of births
1973-75 1979-81
Neonatal care Total <1,250 1,250-2,499 Total <1,250 1,250-2,499grams grams grams grams
Percent
None 38 38 29 22 8 14. i
Pediatriciandaytime 22 17 22 15 7 11 i
Pediatric department !without intensivecare unit 28 . 36 32 13 9 12
Pediatric department ,with intensivecare unit 13 19 17 50 76 64
II-7
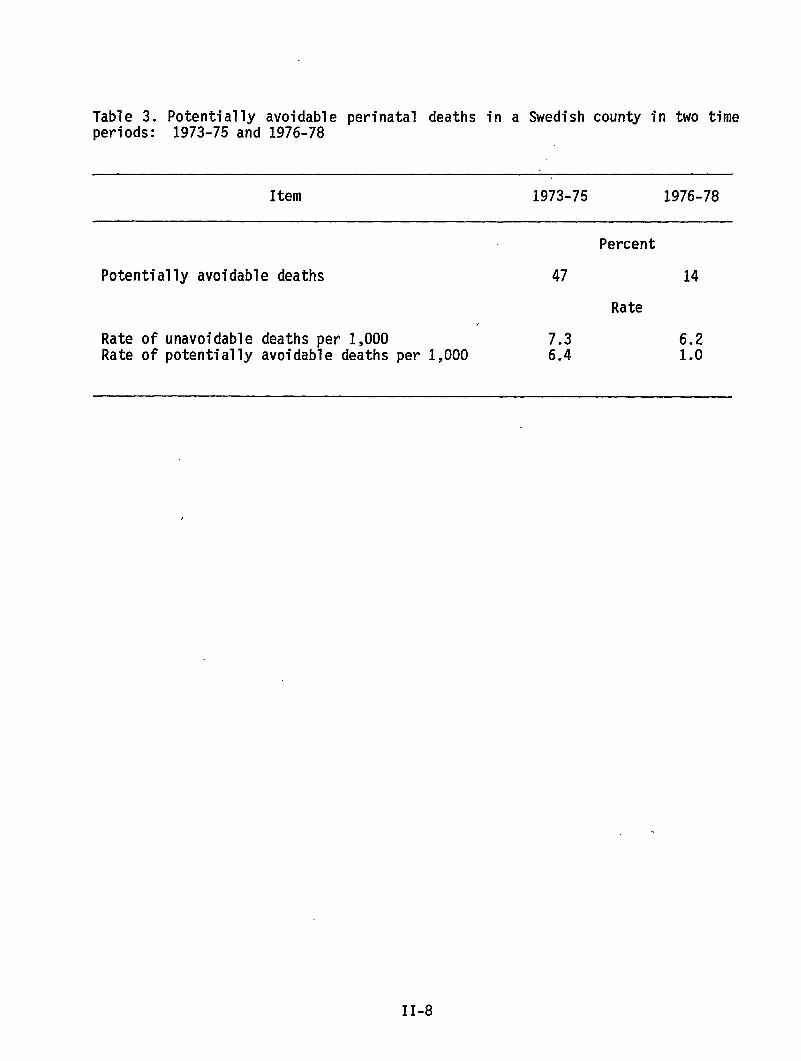
Table 3. Potentially avoidable perinatal deaths in a Swedish county in two timeperiods: 1973-75 and 1976-78
Item 1973-75 1976-78
Potentially avoidable deaths
Rate ofRate of
unavoidable deaths per 1,000potentially avoidable deaths per 1,000
Percent
47 14
Rate,
7.3 6.26.4 1.0
II-8
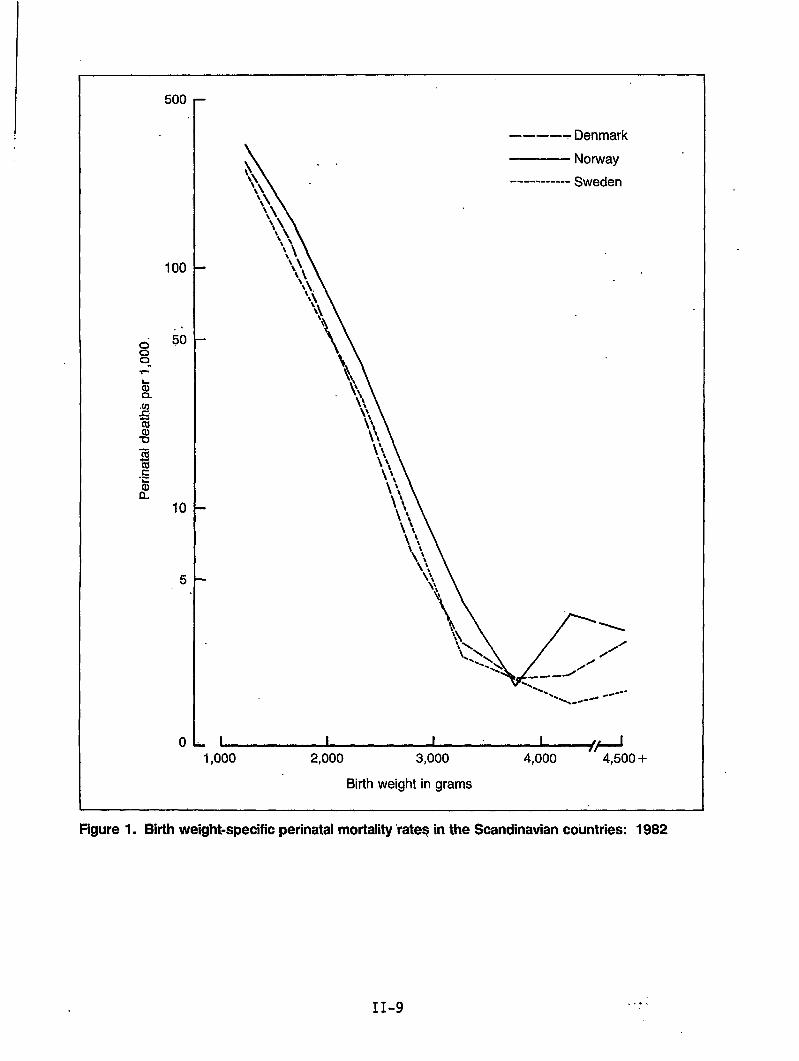
500
100
50
10
5
0
.
.
1,000
—--–- Denmark
Norway
----------- Sweden
2,000 3,000
Birth weight in grams
4,000 -“4,500+
Figure 1. Birth weight-specific perinatal mortality “rateqin the Scandinavian countries: 1982
----
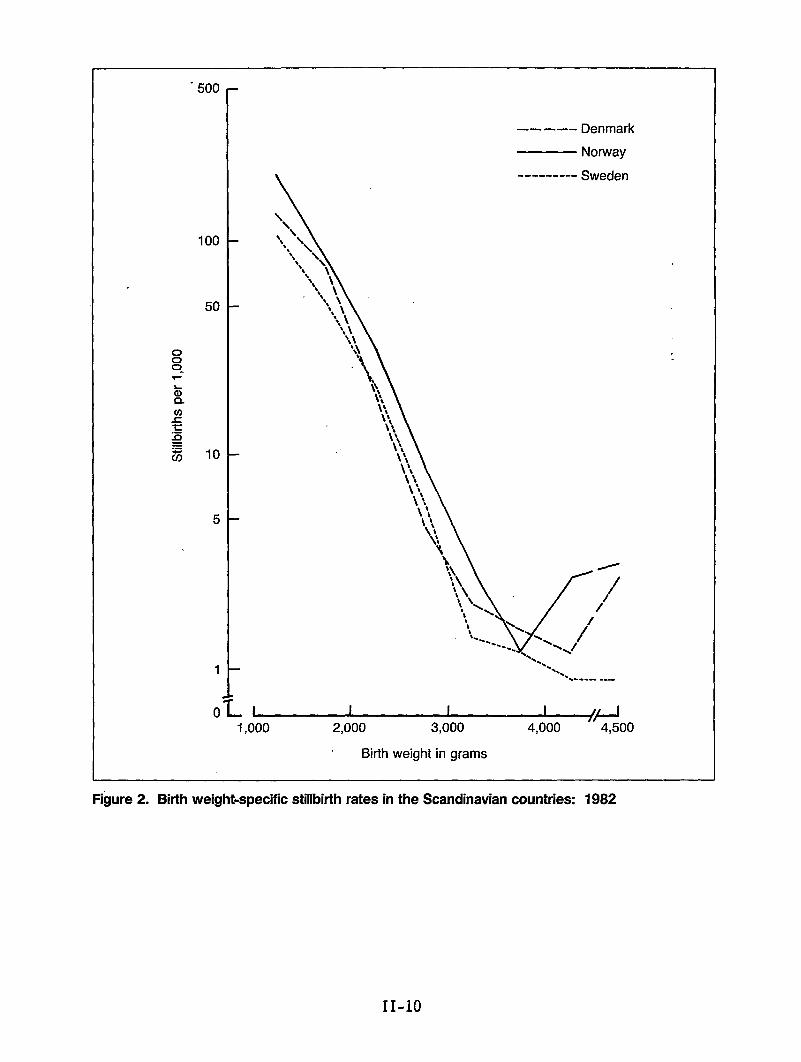
o00-.
“500
100
50
10
5
1
0
.
.
—— —-- Denmark
Norway
--------- Sweden
~+1,000 2,000 3,000 4,000 4,500
Birth weight in grams
Figure2. Bitihweight-specific stillbifih rates inthe Scandinavian countries: 1982
11-10
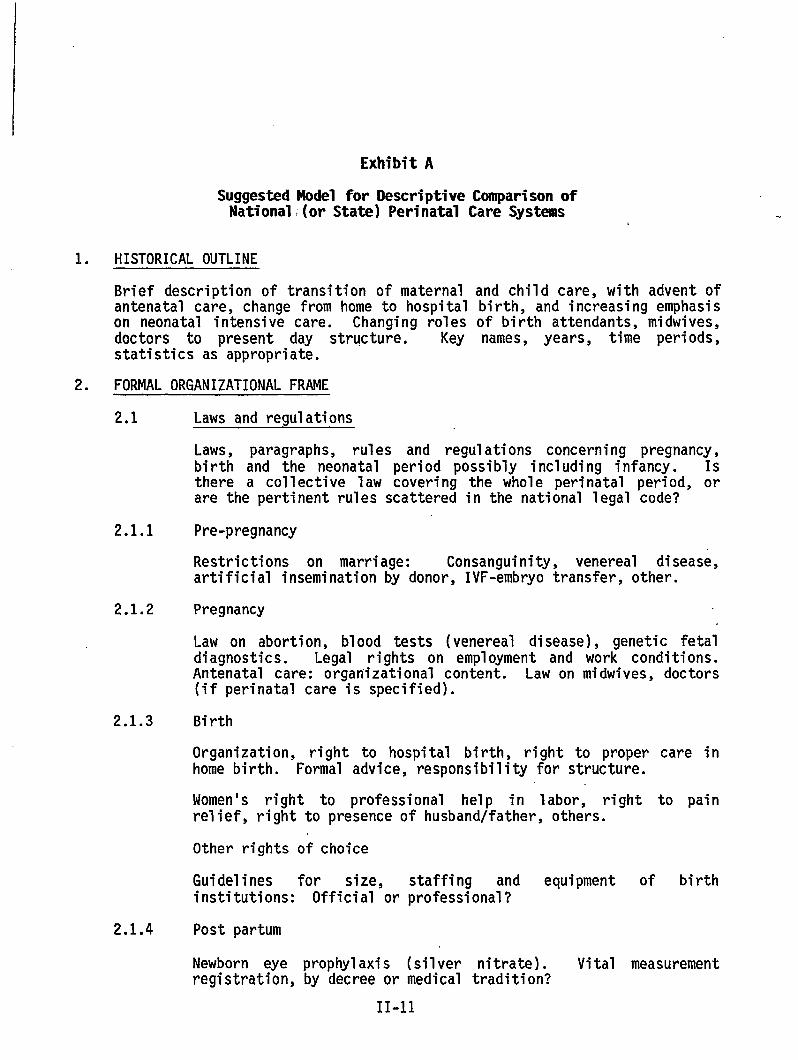
Exhibit A
Suggested Model for Descriptive Comparison ofNational (orState) Perinatal Care Systems
1. HISTORICAL OUTLINE
Brief description of transition of maternalantenatal care, change from home to hospitalon neonatal intensive care. Changing rolesdoctors to present day structure. Keystatistics as appropriate.
2. FORMAL ORGANIZATIONAL FRAME
and child care. with advent ofbirth, and increasing emplof birth attendants, midw-names, years, time per-
asisves,ods,
2.1
2.1.1
2.1.2
2.1.3
2.1.4
Laws and regulations
Laws, paragraphs, rules and regulations concerning wwmncy,birth and ~he-neonatal period possibly including {nfancy. Isthere a collective law covering the whole perinatal period, orare the pertinent rules scattered in the national legal code?
Pre-pregnancy
Restrictions on marriage: Consanguinity, venereal disease,artificial insemination by donor, IVF-embryo transfer, other.
Pregnancy
Law on abortion, blood tests (venereal disease), genetic fetaldiagnostics. Legal rights on employment and work conditions.Antenatal care: organizational content. Law on midwives, doctors(if perinatal care is specified).
Birth
Organization, right to hospital birth, right to proper care inhome birth. Formal advice, responsibility for structure.
Women’s right to professional help in labor, right to painrelief, right to presence of husband/father, others.
Other rights of choice
Guidelines for size, staffing and equipment of birthinstitutions: Official or professional?
Post partum
Newborn eye prophylaxis (silver nitrate). Vital measurementregistration, by decree or medical tradition?
11-11
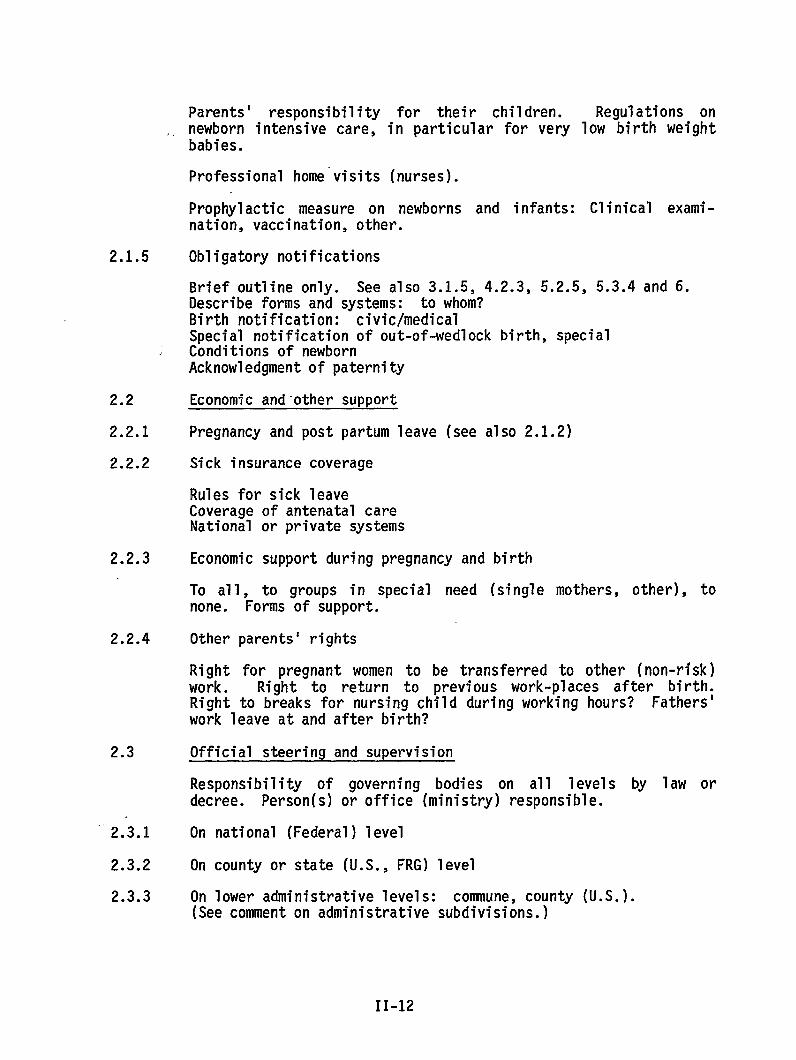
2.1.5
.
2.2
2.2.1
2.2.2
2.2.3
2.2.4
2.3
2.3.1
2.3.2
2.3.3
Parents’ responsibility for their children. Regulations on,. newborn intensive care, in particular for very low birth weight
babies.
Professional home’visits (nurses).
Prophylactic measure on newborns and infants: Clinical exami-nation, vaccination, other.
Obligatory notifications
Brief outline only. See also 3.1.5, 4.2.3, 5.2.5, 5.3.4 and6.Describe forms and systems: to whom?Birth notification: civic/medicalSpecial notification of out-of-wedlock birth, specialConditions of newbornAcknowledgment of paternity
Economic and-other support
Pregnancy and postpartum leave (see also 2.1.2)
Sick insurance coverage
Rules for sick leaveCoverage of antenatal careNational or private systems
Economic support during pregnancy and birth
To all, to groups in special need (single mothers, other), tonone. Forms of support.
Other parents’ rights
Right for pregnant women to be transferred to other (non-risk)work. Right to return to previous work-places after birth.Right to breaks for nursing child during working hours? Fathers’work leave at and after birth?
Official steering and supervision
Responsibility of governing bodies on all levels by law ordecree. Person(s) or office (ministry) responsible.
On national (Federal) level
On county or state (U.S., FRG) level
On lower administrative levels: comnune, county (U.S.).(See comment on administrative subdivisions. )
11-12
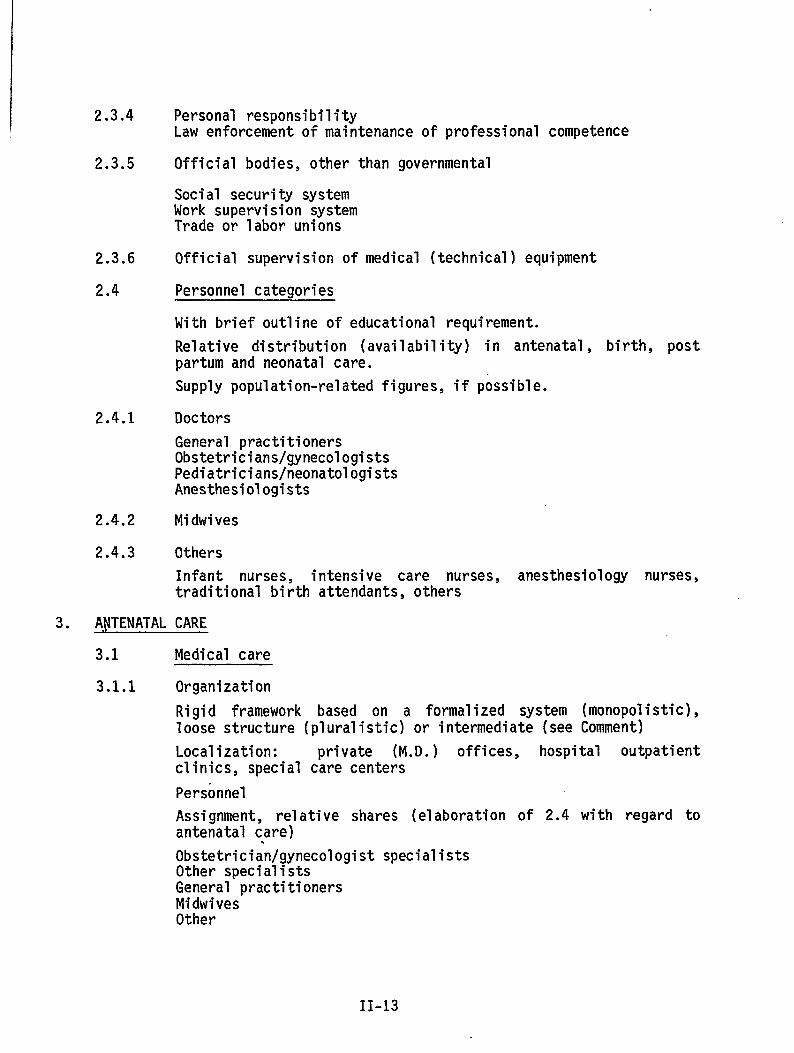
2.3.4 Personal responsibilityLaw enforcement of maintenance of professional competence
2.3.5 Official bodies, other than governmental
Social security systemWork supervision systemTrade or labor unions
2.3.6 Official supervision of medical (technical) equipment
2.4 Personnel categories
With brief outline of educational requirement.
Relative distribution (availability) in antenatal, birth, postpartum and neonatal care.
Supply population-relatedfigures, if possible.
2.4.1 Doctors
General practitionersObstetricians/gynecologistsPediatricians/neonatologistsAnesthesiologists
2.4.2 Midwives
2.4.3 Others
Infant nurses, intensive care nurses, anesthesiology nurses,traditional birth attendants, others
3. ANTENATAL CARE
3.1 Medical care
3.1.1 Organization
Rigid framework based on a formalized system (monopolistic),loose structure (pluralistic)or intermediate (see Comment)
Localization: private (M.D.) offices, hospital outpatientclinics, special care centers
Personnel
Assignment, relative shares (elaboration of 2.4 with regard toantenatal care).Obstetrician/gynecologistspecialistsOther specialistsGeneral practitionersMidwivesOther
11-13
Shared care - continuity of care
3.1.2 -Referral systems
Risk evaluation, formalized or based on individual judgementReferral system - cooperative or competitive
, Laboratory facilities and use ,
3.1.3 Examination schedule and attendance
Uniform or based on risk evaluationParity differences?
Basis for schedule:
Government rule or adviceMedical advice - learned society, medical school, textbook?
Attendance rates
Economic incentive for attendance?
Systems for increasing attendance?Person-oriented?Media - recommendations?
3.1.4 Medical content
a.
b.
c.
d.
Initial visit: Civil status, education, employment
Consanguinity, genetic risksMedical history. Past pregnancies.Present pregnancy. Life style (habits)MedicationParticulars about spouse/partnerExamination: General, local (gyn)Lab tests (routine)Advice - information: Life style, food, iron intake, otherprophylactics
Later visits: HistoryExaminationLab tests
Genetic counseling: Policy, diagnostics (availability),coverage, cost
Screening proceduresSyphilisUltrasoundRubel1a
11-14
DiabetesCytology (Pap smear)Blood groups - antibodiesSickle cell, Thalassemia
./ Neural tube defectsOthers
‘,
e. Planning for delivery
Normal cases - risk casesContinuity of care from antenatal to birth situation
f. Special policies
Extent of AID -“artificial insemination by donorExtentof IVF - in vitro fertilization and embryo transfer
3.1.5 ‘,:Antenatal record form
National standard/local standards . ..Attach copy (copies) asAppendix
3.2
3.2.1
3.2.2
4. BIRTH
4.1
●
4.1.1
4*1.2
Other antenatal ~rer)arator.vactivities%
Content, attendance, personnel involved
Antenatal classes
Other
Conversation groupsGuidance by psychologist, social workers, oth&s
Organization
Implementation of2.1.3Distribution of hospital (institution) versus home birthsSpecial group pressure towards alternative birthing
Birth institutions
Numbers, sizes, classification (degree of specialization)
Capacity
Beds per population unit, or by reproduction index
11-15

4.1:3 Personnel. eauiDment. availabilit.vPersonnel”
Doctors -
Midwives,
Equipment
categories, by size of institution
Obstetricians/residentsAnesthesiologists ,Pediatricians (neonatologists)Other specialists
nurses, special care nurses
for surveillance, delivery, analgesia/anesthesia,laboratory services
Availability: round the clock/daytime only/occasionally/never
Outline responsibilities and relative share of work of thedifferent personnel categories (elaboration of 2.4 with regard todelivery services), i.e., who conducts normal labor and delivery?Are midwives ’permitted to perform operative deliveries? Whosepresence is required in normal/complicatedcases?
4.1.4 Policy and work routines
Person(s) of mother’s choice permitted to be present atnormal/complicated (operative) birth? Official or local rules?Choice of birth position?Policy concerning pubic shaving, enemaLabor rooms and delivery rooms separated?Single or multiple bed labor/delivery rooms?Continuous presence of other person (lay or professional) duringlabor required?
Continuity of care - labor, delivery, post partum?Policy for mother-child bonding
4.2 Medical content
4.2.1 Extent of use of intensive electronic monitoring
Policy for:breech presentationtwin birthsprevious Cesarean sectionhandling of post term pregnancyinduction by oxytocics
Preference for vacuum extraction/forceps deliveryFrequency of vaginal examinationsUse of anesthesia/analgesiaEpisiotomy, stitchingDelivery of the placentaImmediate care of newborn - washing/eye prophylaxis
4.2.2 Transfer of mothers in labor
Policy and systems for transfer to hospital/between hospitals
11-16

4.2.3 Birth record form
National standard/local standardAttach copy (copies) as Appendix
!5. POST PARTUM - MOTHER AND CHILD
5.1-
5.1.1
5.1.2
5.1.3
5.1.4
5.2
5.2.1
5.2.2
5.2.3
5.2.4
Organization in obstetrical department
Some items will be covered in 4.1Organization of neonatal intensive care - see 5.3.1
Duration of post partum stay
Uncomplicated cases: Parity considerations?Complicated cases - well babiesCesarean sectionOther
Work routines
Rooming-in for mothers and newbornsRound the clock/daytime onlyNewborn feeding schedules - by clock/by demand?
Visiting hours
Restricted or flexible?Special policy for fathers/siblings?
Policy for care of newborns
Mother’s participationFather’s participationInstruction of parents
Content
Breast-feeding
Policy, compliance (statistics?)
Preparation for homecoming
On care of childOn contraceptionIndividual/classpreparation
Physiotherapy
Medical content
Diet, medication, other
11-17
5.2.5
5.3
5.3.1
5.3.2
5.3.3
5.3.4
Record form
Discharge record form, information on mother and, child notcovered by 4.2.3Attach copy as Appendix .),,
Neonatal intensive care
Organization
Separate pediatric units or units within obstetrical departmentProximity to obstetrical departmentPolicy for transferMode of transferFrequency of transfer
Bonding policy
Contact parents-child during intensive careMother’s milk
Medical decision, content
Rules for application of resuscitation and intensive careby weightlength of gestationmalformationsother
Neonatal intensive care form
Examination and treatment formTransfer formAttach copy (copies) as Appendix
6. INFORMATION AND EVALUATION SYSTEMS
6.1 Notification of birth (see ajso 2.1.5)——
6.1.1 Legal requirements for notification ,!
6.1.2 Civil registration systems
To which authorities at which level(s)live births
;: stillbirths ‘>c. neonatal deaths
State definitions concerning required notifications, particularlyconcerning length of gestation, birth weight, life and death
11-18
6.1.3 Medical registration
Medical birth registry, if separate from civil notificationauthority. Outline”scopeand content of information.
6.1.4 Other registration systems
IfOnOnOnOn
separate from 6.1.2 and 6.1.3congenital malformations/all or separate entitiescer~bral palsyblindnessother/at risk cases
State whether central or local administration
6.1.5 Utilization of data from registration systems
Stated objective of 6.1.2, 6.1.3, 6.1.4Implementation of objectivesSurveillanceIssuing of statistical information, disseminateSpecific feedback to information providersScientific useAd hoc studies on causation, risk factors, etc
Educational useSupply tables and publications if possible
6.2 Notification forms
on
‘Describe and attach obligatory forms required by systems 6.1.2,6.1.3, and 6.1.4, if not already covered by 3.1.5, 4.2.3, 5.2.5and 5.3.4
6.3 Evaluation of perinatal services
6.3.1 Periodic updates on
Personnel and equipment at birth institutions at neonatalintensive care units
Noninstitutionalbirths
Home birthsTransportationalbirthsOther
6.3.2 Perinatal audit
Organized audit systems? Describe data collection, comnitteestructure, work routines, criteria for conclusions, mode of feed-back
11-19 1

7. CURRENT CHANGES
Outline specific (government or professional) plans for legal, or carechanges. Pressure from political or other groups?
8. ATTACHMENTS
FormsKey st~tistical tabulationsExplanatory information (brochures,leaflets, instructions)
9. LITERATURE
List of publications pertaining to national perinatal care systems
COMMENT
I. On administrative subdivisions: Denominations vary from state to state,and furthermore, similar denominations may signify different levels.Suggested guideline for corresponding levels:
a) ‘Federal Republic (U.S., FRG) - Peoples Republic (China) - State(sovereign nation, country)
b) State (U.S., FRG), Province, Semi-autonomous Region (China), nocorresponding level in many countries
c) County (U.S., Scandinavia), Commune (China), City commune, Shire(Great Britain)
d)” Comnune (Scandinavia), Township (U.S., Canada), Work Brigade, CityNeighborhood (China)
II. On framework of antenatal care systems: In monopolistic systems, as oneextreme, pregnancy care is offered exclusively through health centers andhospital outpatient clinics. In these institutions all personnel areemployed by the state or county, antenatal services are not offered byprivate practitioners on any level. In this system the woman has little orno chance to choose, her place of residence determines which center shewill attend. In pluralistic systems, care during pregnancy is offered bydoctors and midwives in private practice, and to some extent byinstitutions. The woman is relatively free to choose the kind of care, andthe care provider, she wants. Intermediate systems denote a combination ofthese two extremes.
III. It is realized that much of the information which this proposed index asksfor will be absent or incomplete at the national (or state) level.Clinical routines will vary from place to place within states, but theremay be prevailing trends. Furthermore, the desired information willgenerally not be available from one single source but may requireconsiderable detective work for collection. However, it is felt that sucheffort will be infinitely rewarding.
} 11-20
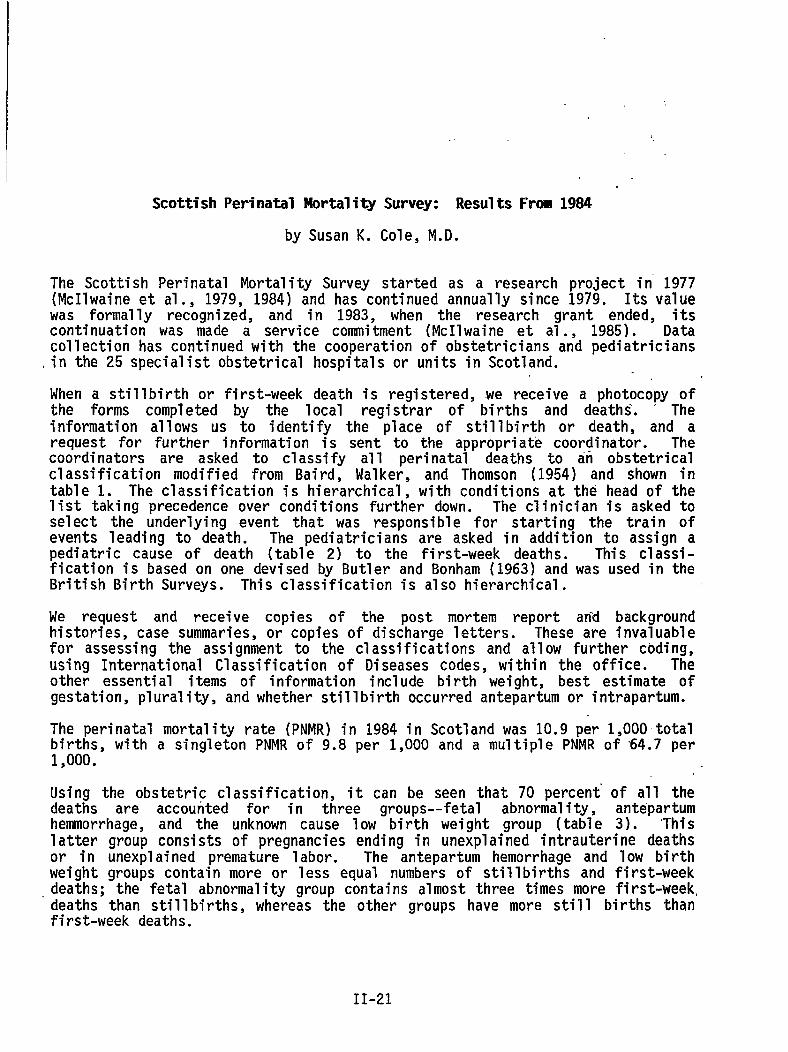
Scottish Perinatal Mortality Survey: Results From 1984
by Susan K. Cole, M.D.
The Scottish Perinatal Mortality Survey started as a research project”in 1977(McIlwaine et al., 1979, 1984) and has continued annually since 1979. Its valuewas formally recognized, and in 1983, when the research grant ended, itscontinuation was made a service commitment (McIlwaine et al., 1985). Datacollection has continued with the cooperation of obstetricians and pediatricians,in the 25 specialist obstetrical hospitals or units in Scotland.
When a stillbirth or first-week death is registered, we receive a photocopy ofthe forms completed by the local registrar of births and deaths. “ Theinformation allows us to identify the place of stillbirth or death, and arequest for further information is sent to the appropriate coordinator. Thecoordinators are asked to classify all perinatal deaths to an obstetricalclassification modified from Baird, Walker, and Thomson (1954) and shown intable 1. The classification is hierarchical, with conditions at the head of thelist taking precedence over conditions further down. The clinician is asked toselect the underlying event that was responsible for starting the train ofevents leading to death. The pediatricians are asked in addition to assign apediatric cause of death (table 2) to the first-week deaths. This classi-fication is based on one devised by Butler and Bonham (1963) and was used in theBritish Birth Surveys. This classification is also hierarchical.
We request and receive copies of the post mortem report an-d backgroundhistories, case summaries, or copies of discharge letters. These are invaluablefor assessing the assignment to the classifications and allow further coding,using International Classification of Diseases codes, within the office. Theother essential items of information include birth weight, best estimate ofgestation, plurality, and whether stillbirth occurred antepartum or intrapartum.
The perinatal mortality rate (PNMR) in 1984 in Scotland was 10.9 per 1,000 totalbirths, with a singleton PNMR of 9.8 per 1,000 and a multiple PNMR of 64.7 per1,000.
Using the obstetric classification, it can be seen that 70 percent”of all thedeaths are accounted for in three groups--fetal abnormality, ante”partumhemorrhage, and the unknown cause low birth weight group (table 3). ‘This1atter group consists of pregnancies ending in unexplained intrauterine deathsor in unexplained premature labor. The antepartum hemorrhage and low birthweight groups contain more or less equal numbers of stillbirths and first-weekdeaths; the fetal abnormality group contains almost three times more first-week,deaths than stillbirths, whereas the other groups have more still births thanfirst-week deaths.
11-21
There was considerable difficulty in achieving a standard definition thatdifferentiated between the anoxia/trauma and immaturity groups. This was aresult of the difficulties in classifying babies who were both immature andasphyxiated at birth. Experience in subsequent years has led to a reduction inthe proportion assigned to the asphyxial group and a corresponding increase inthe immaturity group.
Of the babies who are born alive, 32.7 percent die of a lethal malformation;29.7 percent die of problems arising during labor--namely, anoxia or birthtrauma; 27.6 percent die of problems associated with immaturity; and about 10percent are associated with other pediatric factors (table 4). Figure 1 showshow these pediatric groups fit into the obstetric classification.
Birth weight is probably as important a factor in perinatal deaths as congenitalanomaly (table 5).
Figure 2 shows the percent distribution of all births compared with the percentdistribution of normally formed perinatal deaths. Stil1births are not parti-cularly associated with birth weight, but the first-week deaths show a highdegree of correlation with birth weight.
This survey has demonstrated the significance of data CO11ection efforts and theutilization of data in revealing specific health and risk-related factors.
References
Baird, D., J. Walker, and A. M. Thomson, 1954. The causes and prevention ofstillbirths and first week deaths. J. Obstet. and Gynaecol. Br. Emp. 61:433-448.
Butler, N. R., and D. G. Bonham. 1963. Perinatal Mortality: The First Reportof the 1958 British Perinatal Mortality Survey. dlnburgh: Llvlngstone.
McIlwaine, G. M., F. Dunn, R.C. L. Howat, et al. 1984. The Scottish PerinatalMortality Survey, 1977-81. University of G1asgow.
McIlwaine, G. M., F. Dunn, R. C. L. Howat, et al. 1985. The establishment of aPoutine system for monitoring perinatal deaths in Scotland. Br. J. Obstet.G.vnaecol. 92:9-13.
McIlwaine, G. M., R. C. L. Howat, +F. Dunn, and M. C. Macnaughton. 1979.Scotland 1977 Perinatal Mortality Survey. University of Glasgow.
II-22
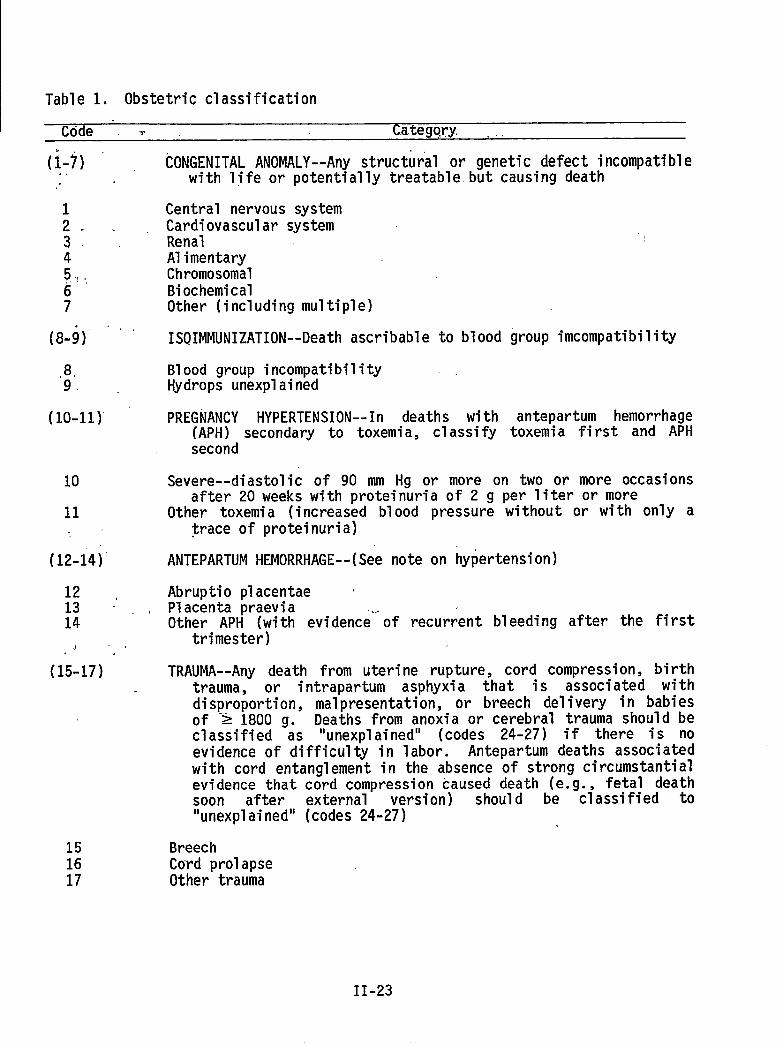
Table 1. Obstetric classification
Code ‘ T Category. ..
(1-7)
L .3.45,.,,,,67
,8.9. ‘
(10-11)”
10
11
(12-14)”
1213 -’ .14
.1 ,,
(15-17) -
151617
CONGENITALANOMALY--Anystructural or genetic defect incompatiblewith life or potentially treatable.but causing death
Central nervous systemCardiovascular system ~RenalAlimentaryChromosomalBiochemicalOther (includingmultiple)
ISOIMMUNIZATION--Deathascribable to blood
Blood group incompatibilityHydrops unexplained
PREGNANCY HYPERTENSION--In deaths with(APH) secondary to toxemia, classifysecond
group incompatibility
antepartum hemorrhagetoxemia first and APH
Severe--diastolic of 90 mrn Hg or more on two or more occasionsafter 20 weeks with proteinuria of 2 g per liter or more
Other toxemia (increased blood pressure without or with only atrace of proteinuria)
ANTEPARTUM HEMORRHAGE--(See note on hypertension)
Abruptio placentae ‘Placenta praevia .,,.Other APH (with evidence of recurrent bleeding after the first
trimester)
TRAUMA--Any death from uterine rupture, cord compression, birthtrauma, or intrapartum asphyxia that is associated withdisproportion, malpresentation, or breech delivery in babiesof ‘> 1800 go Deaths from anoxia or cerebral trauma should beclassified as “unexplained” (codes 24-27) if there is noevidence of difficulty in labor. Antepartum deaths associatedwith cord entanglement in the absence of strong circumstantialevidence thatsoon after“unexplained”
BreechCord prolapseOther trauma
c&d compression caused death (e._g.,fetal deathexternal version) should be classified to(codes 24-27)
II-23
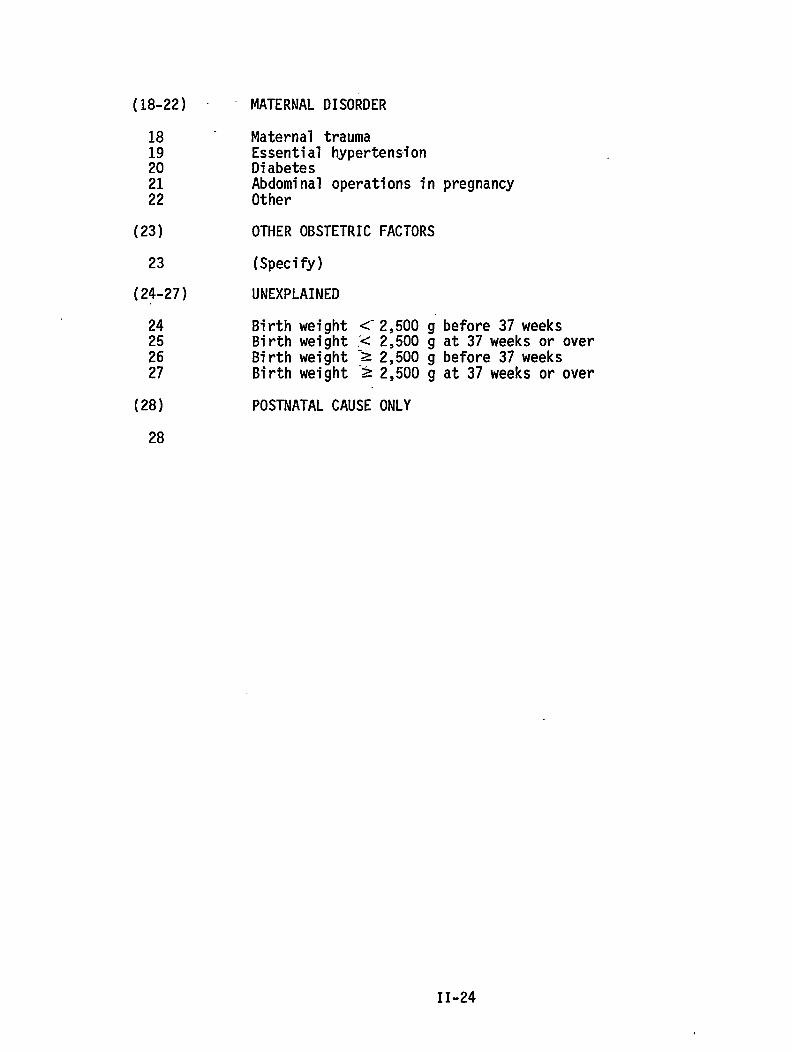
(18-22) -
18 -
;:2122
(23)
23
(24-27)
24252627
(28)
MATERNAL DISORDER
Maternal traumaEssential hypertensionDiabetes::l:inal operations in pregnancy
OTHER OBSTETRIC FACTORS
(Specify)
UNEXPLAINED
Birth weight <“2,500 g before 37weeksBirth weight < 2,500 g at 37 weeks or overBirth weight :Z 2,500 g before 37 weeksBirth weight >2,500 g at 37 weeks or over
POSTNATAL CAUSE ONLY
28
II-24

I
Table 2. Pediatric classification
Code Category
(l-7)
12
:567
(8-9)
89
(10-11)
101112
(13)
13
(14)
14
(15-17)
15
1;6 “
(18-25)
CONGENITAL ANOMALY (See obstetric classification)
Central nervous systemCerebrovascular systemRenalAlimentaryChromosomalBiochemicalOther (includingmultiple)
ISOIMMUNIZATION
RhesusHydrops unexplained
INTRAUTERINE ANOXIA
AntepartumIntrapartumNot known whether 10 or 11
BIRTH TRAUMA--e.g., serious damage to falx, great cerebral vein,or cervical spine in the absence of clinical or post mortemevidence of severe fetal anoxia.
(Specify)
IMMATURITY <24 MEEKS
Structural 1ung immaturity sufficient toimpossible
HYALINE MEMBRANE DISEASE (HMD)
Mit~V;ignificant intraventricular hemorrhage
With infection,HMD without significant IVH or infection
HEMORRHAGE
render ventilation
(IVH) (grade III or
IVH (in the-absence of potentially lethal HMD)IVH (in a baby who never had HMD)Subarachnoid hemorr~Subdural hemorrhageIntracerebral hemorrhage(If 20-22 are thought to be due to birth trauma or anoxia, code
these first and 20-22, as appropriate, second)
II-25/..
,.
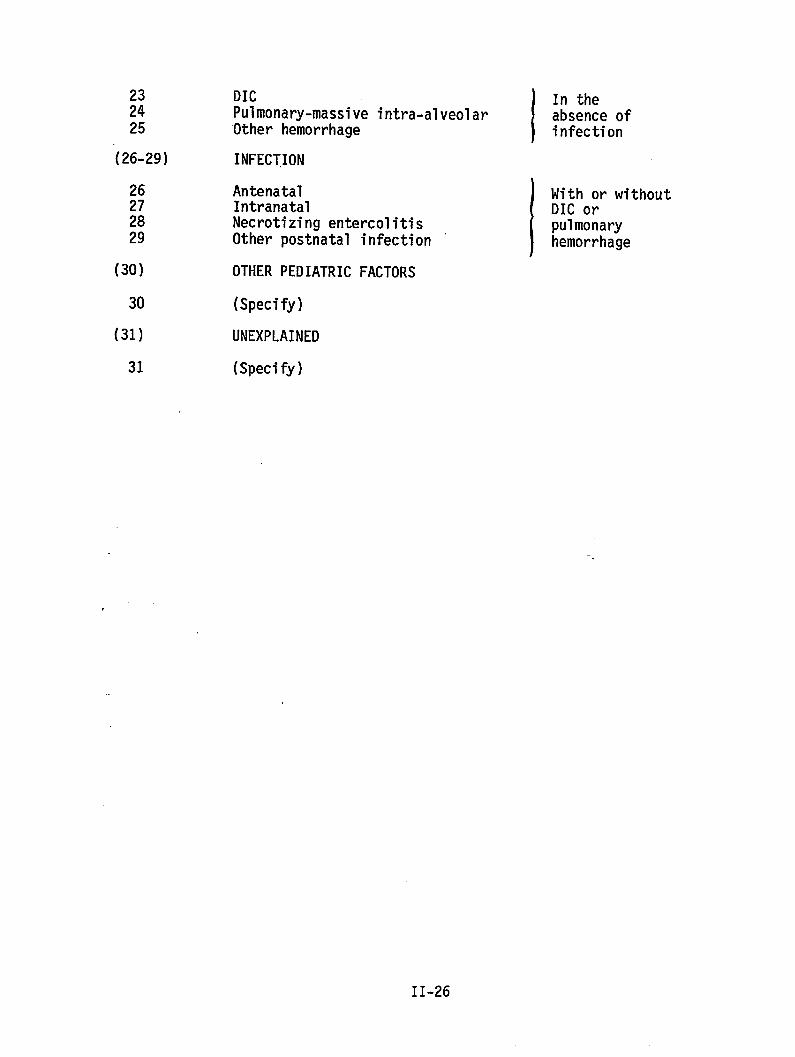
232425
(26-29)
(30)
30
(31)
31
DIC
1
In thePulmonary-massive intra-alveolar absence of‘Otherhemorrhage infection
INFECTION
Antenatal
IWith or without
Intranatal DIC orNecrotizing entercolitis pulmonaryOther postnatal infection hemorrhage
OTHER PEDIATRIC FACTORS
(Specify)
UNEXPLAINED
(Specify)
II-26
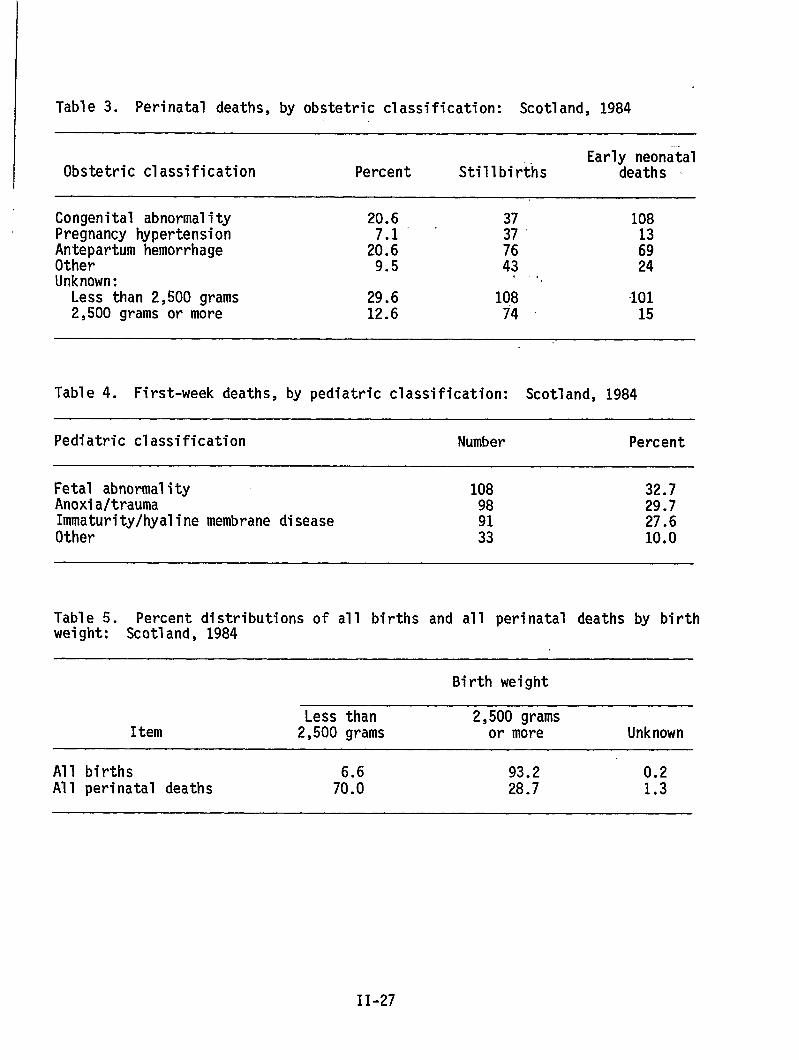
Table 3. Perinatal deaths, by obstetric classification: Scotland, 1984
Early neonatalObstetric classification Percent Stillbirths deaths ~
Congenital abnormality 20.6 37 108Pregnancy hypertension
,.
Antepartum hemorrhage 2::: ;: ;;Other 9.5 43 24Unknown: ‘,Less than 2,500 grams 29.6 108 “1012,500 grams or more 12.6 74 15
Table 4. First-week deaths, by pediatric classification: Scotland, 1984
Pediatric classification Number Percent
Fetal abnormality 108 32.7Anoxia/trauma 98 29.7Immaturity/hyalinemembrane disease 27.6Other ;: 10.0
Table 5. Percent distributions of all births and all perinatal deaths by birthweight: Scotland, 1984
Birth weight
Less than 2,500 gramsItern 2,500 grams or more Unknown
All births 93.2 0.2All perinatal deaths 7::: 28.7 1.3
II-27
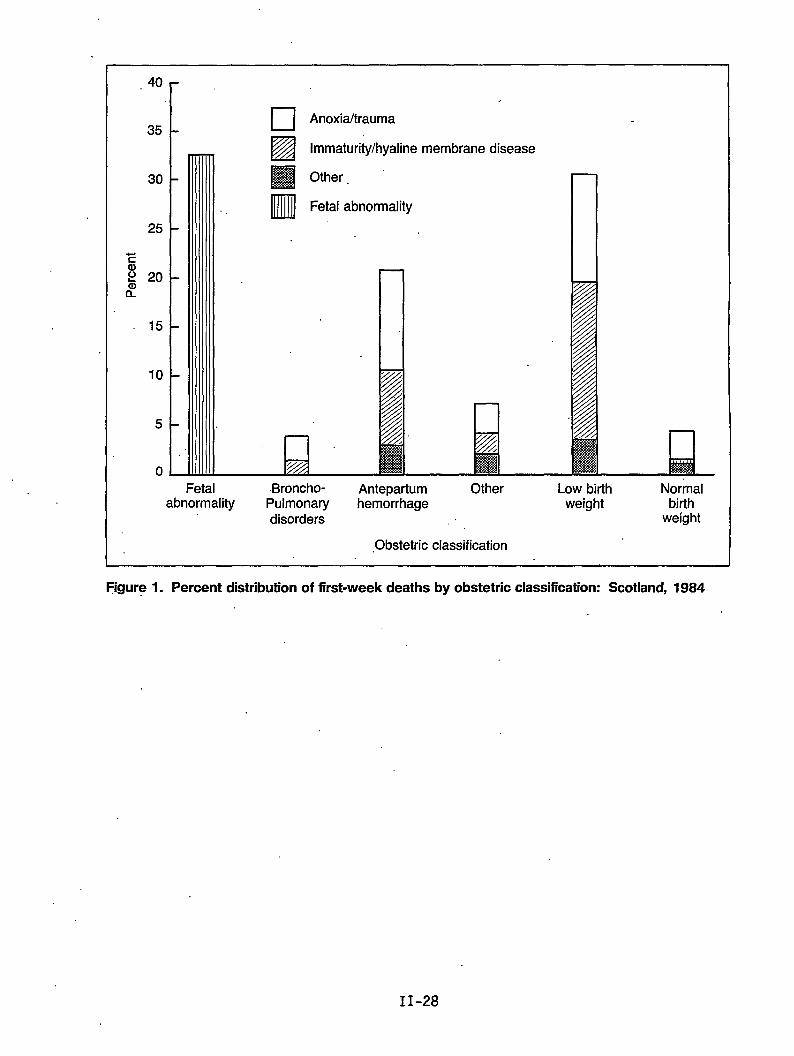
.40 r
35
30
25
Ea)P 20&’
15
10
5
0
‘1 ❑ Anoxia/trauma
.
Ezlimmaturity/hyaline membrane disease
❑ Other.
•Ml Fetal abnormality
QFetal Broncho- Antepartum Other Low birth Normal
abnormality Pulmonary hemorrhage weight birthdisorders weight
,Obstetric classification
~gure 1. Percent distribution of first-week deaths by obstetric classification: Scotland, 1984
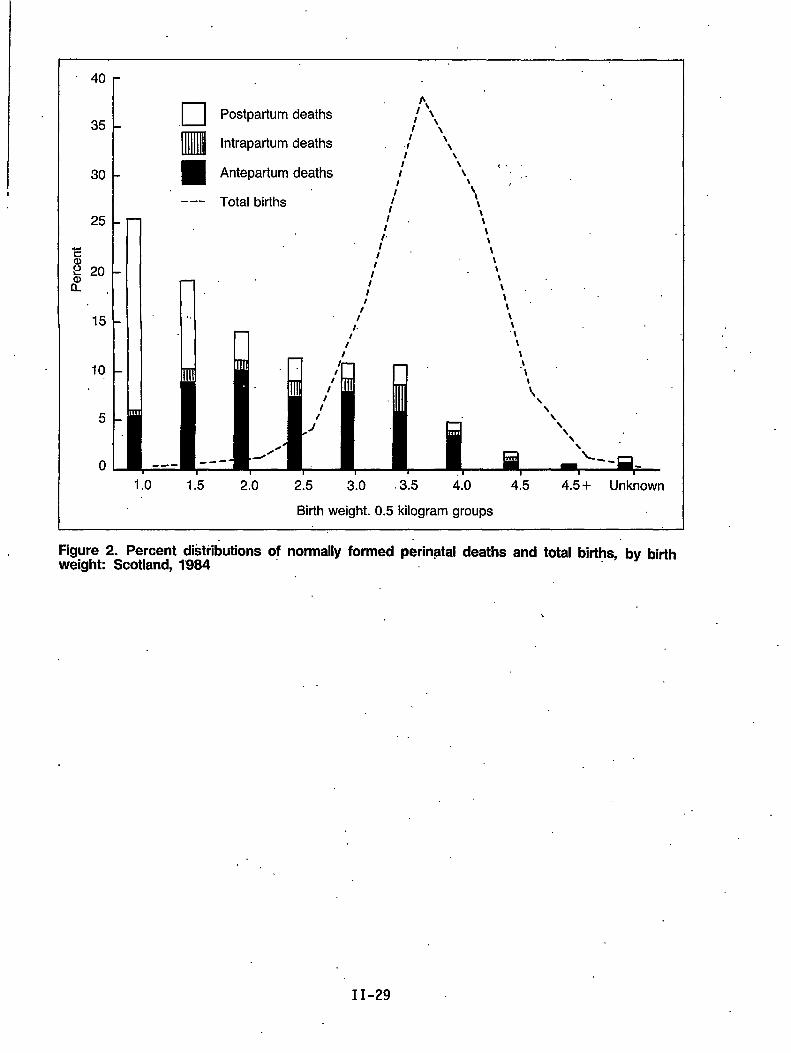
1
40 r
L
❑b,
Postpartum deaths 1 \\35
Inmlll
l’\Intrapartum deaths , J’ ‘\
I \\
30 Antepartum deaths(.
/’ \ ,.~
--- Total births
Ill “’‘Wrll I
I I n!.
It‘\\
\
10 -\
\\\
o ---- “
1.0 1.5 2.0 2.5 3.0 3.5 4.0 4.5 4,5 + Unknown
Birth weight. 0.5 kilogram groups
Figure 2. Percent distributions of normally formed p&inatal deaths and total births, by birthweight Scotland, 1’984
\
II-29

A Methodology for Evaluating Size at Birth
byP. Karlberg, M.D.; A. Niklasson, M.D.; A. Ericson, M.SC.;J. G. Fryer, Ph.D.; R. G. Hunt, Ph.D.;
C. J. Lawrence, Ph.D.; and A. G. Munford, Ph.D.
Introduction
The outcome of a pregnancy is closely related both to the maturity of the babyand to its size. Because these two measures are correlated, they are even moreinformative when viewed as a pair. Their evaluation either in an individualnewborn baby or in groups of newborns requires reference to what is consideredto be a reasonably “normal” situation. By this, we mean undisturbedintrauterine development of the fetus. The main purpose of this paper is todescribe a method of obtaining reference values for the relationship betweensize at birth and gestational age. Swedish data that include clinicalinformation on individual infants are used to illustrate the approach. Theywere taken from the Swedish Medical Birth Registration and cover all “healthy”live-born singletons of estimated gestational age 28-42 weeks born in Swedenduring the years 1977-78. Comparisons are made later between these results forSweden and those reported in the literature for other countries. The questionof how to proceed when less information on individual infants is available isconsidered in the discussion at the end of the paper.
Defining Gestational Age and Undisturbed Growth
In general, two separate assessments of the gestational age (GA) of each infantare included in the Swedish material. First, the time that elapses between thefirst day of the mother’s last menstrual period and the baby’s delivery (LMP-GA)is recorded in completed weeks. In addition, there is a comparable obstetricassessment (OB-GA) in practice, which is estimated to the nearest week. Thedifference between the statistical distributions of the two~lustrated infigure 1. Both histograms in figure l(a), where frequencies are given inpercents, show the expected skewness toward the lower GA weeks. There is aclear tendency for the OB-GA estimate to be more concentrated in the commonlyoccurring weeks. Miscalculations may well account for the heavier tails of thethe LMP-GA.
NOTE: This work was supported by grants from the Swedish Medical ResearchCouncil (project no. 5529) and the Faculty of Medicine of the Universityof Gbtenborg.
11-31
The corresponding cumulative distributions are also displayed on the usuallinear scale in figure l(b). They show the median for OB-GA to be some 2 or 3days longer than that for LMP-GA. This simply reflects the difference betweenthe recording conventions used, that is, the nearest and completed weeks. Thecumulative plot becomes rather more informative when the probability scale isused instead, as shown in figure l(b). On this special nonlinear scale, thecumulative distribution of a pure Gaussian distribution appears as a line, andthe strong linearity exhibited from 37 through 42 weeks might well indicate thepresence’of a dominant Gaussian component, possibly representing “normal” full-term development.
In view of the suspected inaccuracies of LMP-GA and a preference for the use ofcompleted weeks, a combined method for estimating GA (COM-GA) has been adoptedhere. LMP-GA is used provided it differs from OB-GA by no more than 2 weeks.It might be argued in this case that the two assessments are probably referringto the same menstrual period. If they differ by more than 2 weeks, OB-GA isused instead. When either estimate is missing, GA is considered unknown. Thedistribution of COM-GA is evidently somewhat more concentrated than that ofLMP-GA in the “full-term” range but has consequentially lighter tails.
Our definition of infants showing undisturbed growth is relativelystraightforward. This “healthy” subgroup is taken to be the total population ofliveborn singletons, excluding both those babies whose mothers experiencedcomplications in pregnancy with potential effect on fetal growth and those withidentified malformations. Shortened or prolonged gestational age alone is nottaken to be a reason for rejection. The clinical perinatal information on eachinfant given in its Medical Birth Registration was used to identify cases forexclusion. Factors taken to be relevant are as fOllOWS: .-.
Factors potentially affecting intrauterine growth
Maternal factors
Infection (TBC, virus, cytomegalo-virus, syphilis, toxoplasmosis)TumorDiabetes or other endocrine disturbanceAlcohol abuseNarcotic addictionHypertensionHeart diseaseAsthmaEnteritis, ulcerative colitisKidney disease
Disorders related to the pregnancy
HemorrhageAnemiaCervical insufficiencyProlonged pregnancy (more than 42 weeks)Urinary infectionEclampsia, preeclampsia
II-32
Neonatal
Al1
disorders
malformations except:
Persistent ductus arteriosusSingle umbilical arteryCongenital dislocation of the hipUndescended testicle
Information on maternal smoking was not available in 1977-78. Approximately 80percent of the original births remained after the exclusions, and some detailsconcerning the composition of this resulting “healthy” subgroup are set out intables 1 and 2..
Construction of Reference Standards--The So-Called Perinatal Growth Chart
The individual relationships of birth weight (BW), birth length (BL), and birthhead circumference (BHC) to GA concern us here. ‘In probabilistic terminology,we are basically interested.in the form taken by the conditional distributionof, say, BW, given GA, as GA is varied over its complete range. Because thisdistribution (like others) is in fact uniquely determined by the jointdistribution of the two measures, it would appear to be the natural one tomodel. However, this has proven to be very difficult to do satisfactorily, so asimpler approach is adopted here. We model weekly conditional distributions oneby one, as if they were entirely unrelated. After this basic step, they are1inked through a smoothing device in order to emphasize and reflect thecontinuity of the underlying biological process.
For the modeling of most of the conditional distributions of BW, the individualweights were grouped in intervals of 250 grams (g) in the following manner:375-624 g, 625-874 g, 875-1,124 g, and so on. Weights like 1,500 g, 2,000 g,and 2,500 g were therefore made the center points of groups rather than the endpoints, thereby reducing bias. In the lower GA’s, we have used finer groups(width 50 g) for obvious reasons; however, this makes surprisingly 1ittledifference to the analyses for the lower ages and virtually none to theremainder. In a similar way, groups of 2 centimeters (cm) were used for both BLand BHC. Scrutinizeng the frequency distributions of BW for each GA shows thatanomalous observations have been retained despite the initial screening of theGA data. Consider, for instance, the distribution of BW at GA 30 weeks formales. Starting at the lowest 250 g group, 375-624 g, and ending at 4,125-4,374g, the successive entries for the numbers of infants are
1249311384003111312.
Because we have no good reason a priori to expect other than a unimodaldistribution, we are bound to suspect the last six figures. These seem verylikely to be classification errors that have somehow survived our carefulfiltering of the data. Some of them may well be “4 week” errors for birthshaving a true gestational age of 34 weeks and others even 8- or 12-week errors.Others may just be errors in the BW itself. Our way of dealing with the problemin this paper has been to truncate each distribution to a suitable BW rangewhere theBW range
observations seem entirely plausible. The data within the restrict~dhave then been used to estimate the true distribution over that
II-33..W.
interval and hence, by extrapolation, over the complete range. Includingdubious observations in our estimation procedure COU1d lead to considerableeb,ias?:whereas’excluding them brings a little inefficiency at worst.
‘:’The,rnodelingof the GA-specific distributions of BW would be a good deal easier~if we could find a transformation for BW that moved the distributions to a well-.known form. Because the Gaussian distribution is the natural focal point of‘protiabilityand statistics, and conditional distributions are already roughly of‘this form,” a normalizing transformation would be especially apposite.Accordingly, the BOX-COX power family of transformations (Box and Cox, 1964) wasapplied at each GA, with normality over the complete.range as the aim. With‘this transform, the most appropriate power (say p ) whether it be 2 (thesquare), 0~05 (the square root), or some other number, is to be determined bythe.,data themselves. If the data point is to a power of 1, then we concludethat the’data are already as close to normality as they can be brought by a,s:imp~epower. Figure 2 displays the’individual powers found for BW for the twosexes” at each GA. Although these are only estimates (and so are subject tosampl”ingfluctuation), the pattern for males is quite clear. In the lowestGA’s, the data arealready near normal; at term, the square roots are called‘for; and in between, a logarithmic transformation is required. The last is‘-unsurprising;in periods of steady growth, physical measures often follow a‘lognormal distribution (Karlsberg et al., 1976). There is a tendency forfemales to follow a similar pattern, but the results are more diffuse.the: data are normalized,
Afterfiducial points of the distribution are readily
determined. With ”the Gaussian distribution, it is natural to work in terms of“thernean (w) plus or minus multiples of the standard deviation (u), IX ~~~).“The ’constant k is chosen to match the desired probability levels. In this“paper, we use% = 2 (corresponding to percentage levels of 2.28 and 97.72), butthis is purely arbitrary. Having assessed the percentage points orI the‘trafisforrnedscale, it is a simple matter to “invert” them to recover the samepercentage points on the original scale of grams. We denote these by P* and(p&z(Y)*. In the case of BW, plots of the # * and ( # f 2u)* are~seen tofollow somewhat irregular sigmoid-shaped patterns. Because we would expectvalues of these percentage points, when not subject to error of any sort, tovary in a systematic fashion, we have applied smoothing procedures (cubicsplimes) to the ,raw estimates to bring them into line. The results are given in“’tabularform in table 3 and displayed pictorially in figure 3 (together withsome’raw estimates). Plots of the ratios-
:,..,
~ ‘R+ = (#+2u)* and R-” =P*
~or.BW show these to be far from constantex,trerneamongthe”lower GA’s than at term...
Corresponding results are given for both BL‘generally higher percents of infants withraoiXe,these fiqures mdst be reqarded as
(/L-2c)*
P*
as GA is varied. Values are more
and BHC in table 3. Because of theunknown measurements in the pretermmore approximate. The pattern is
‘par~icularly -”tia~dto gauge in tie lowest GA’s, where unknown percents are attheir highest. All median values (P*) given are based on the directly relevantobservations alone. However, the values of ( P ~. 2~)* for preterm ages are‘obtained indirectly through use of the R values for full-term infants, using thesimple formula ( ti~2c)* = RP*.
11-34

Comparison Hith Other Results
Our results were compared with those of the Engstr8m-Falconer material of 1956-57 (Engstrbm and Falconer, 1960), which formed the basis for the SwedishPerinatal Growth Chart of 1971 (Karlberg and Priolisi, 1977). The median gr~wthcurve of BW for 1977-78 exceeds the 1971 Chart figure by some 100 g at term. Onthe other hand, taken literally, the results show a reduction in median lengthof some 0.5-1.0 cm. These findings indicate a secular trend over the past 20years, but the reality of this is currently being carefully assessed and will bediscussed elsewhere.
In view of the genetic differences in populations and the environments in whichthey live and the different ways in which material may be classified, collected,and analyzed, we would expect a priori to find wider differences when our 1977-78 Swedish figures are compared with those reported for the inhabitants,of othercountries. Figure 4, in which five commonly quoted data sets (Bjerkedahl andSkjaerven, 1980; Hoffman et al., 1974; Lubchenko et al., 1963; Thomson,Billewicz, and Hytten, 1968; Usher and Mac-Lean, 1969) are displayed, shows moresimilarity of pattern for median BW at 28-36 weeks GA, where the curves arefairly well parallel, than afterwards, when they begin to show different ratesof deceleration and relative positions change. Swedish males seem to show theleast deceleration in the full-term region. At 40 weeks, there is a 400gdifference among medians of the six sets of standards. The ranges of thedistributions are more difficult to assess because of the differentdistributional assumptions and percent levels used. The 1atter vary from 2.5percent, or ( ~ - 2~) at the lower end, through 5-10 percent, possibly becauseof the clinician adjusting the limit to reflect similar clinical experiences.Two of the standards, Bjerkedahl and Skjaerven (1980) and Hoffman et al. (1974),show very much higher levels of (P+ ka)* than the others prior to 37 weeks.These authors appear to have included certain extreme observations that, in ourdata, have been taken to be misclassificationsof GA.
Discussion
A knowledge of the GA of an infant is essential for an evaluation of its size;because infants of the same weight can have very different levels of maturity,the use of BW (or BL) alone provides much reduced information. Given both, theinfant needs to be referred to established growth ‘standards for the “healthy,”by which we mean those infants who. experienced undisturbed fetal growth.Inclusion of all live born infants in such standards merely widens the range andso obscures the issue. Stillbirths should certainly be excluded.
A universally acceptable definition of undisturbed intrauterine growth isdesirable; but to establish this further, analyses and debate are required.What matters in practice is that at least all deviations of a nontrivial naturebe excluded. In the case of Swedish infants, it is possible to construct avariety of plausible “healthy” groups from the information contained in thenational Medical Birth Registration. Naturally, any such definition isconstrained by the items available. For our own definition, we would have likedto have excluded infants of mothers who smoked, for example, but this was ,notfeasible in 1977-78. In fact, when the record was first discussed prior to1973, it was feared that requesting information about a smoking habit might.beviewed as an insult to a mother’s personal integrity. Nowadays (1982 onwards), a
11-35

smoking habit is recorded in Sweden and, together with other items, has recentlybeen used by Rooth, Meirek, and Karlberg (1985) in an alternative definition ofthe “healthy.” This more restrictive definition retains only-some 10 percent ofthe total material, compared with our own 80 percent. However, values of medianBW at term have been found to be practically identical to ours. Because we havenot explicitly excluded infants of heavy smokers, for instance, some differencemight have been anticipated. However, it is likely that such infants have.largely.been rejected on other .grounds,for smoking.in,particular is associatedwith certain other negative factors. It is our intention to pursue variousdefinitions of “healthy” in a forthcoming comprehensive analysis of the Swedishdata for 1977-84, although the principal aim is to fix probability levels moresecurely among the lowest GA’s, for which data for only two years generateinsufficient numbers of infants.
.,The numerical approach used in this paper seems to.us to have h-number of points which may be worth noting.
First, even if initial filtering of the data fails to eliminateGA’s, it iS still Possible to use a relatively simple and efficient
ghlighted a
all suspectmodel-based
approach based on- the truncation of the underlying distributions to derivestandards. Other approaches involving the modeling of the complete distribution(after filtering) are possible too, but they require many more infants in the1owest GA’s than are commonly available:
Second, the proposition that BW data follow a Gaussian (or even symnetric)distribution for each gestational week appears to be distinctly unrealistic.Our analyses indicate that some transformation of the original scale is neededat most GA’s.to bring the data into line, at least for Swedish material. A keyfeature of our approach is that the data are required-to transform themselves tothe Gaussian form as a matter of course if deviant. Because this procedure iseasily inverted to recover the original scale, even in probabilistic terms, weare offered the flexibility of two scales of, measurement with merit, the ,original grams and the power of it producjng Gaussian frequency; and we can movefrom one to the other with ease. On the transformed symmetric scale, we canwork in terms of standard deviation scores,(Karlberg, Engstrom, and Karlberg,
as advocated for postnatal growth1981); and on the original asymmetric scale,
we can work in terms.of the corresponding levels of probability. Note that theuse of sample percentiles is ruled out if any nontrivial truncation of thedistributiontakes place; even without it, this somewhat naive approach WOU1d berejected by many on the grounds of statistical inefficiency alone.
Third, the assumption that the coefficient of variation of the BW distributionis constant throughout the GA range appears to be untenable, for noticeablyIarger values are recorded in the lower GA’s than at term. If term values areapplied-at 28-36 weeks, then unduly restricted limits result naturally.
Although the corresponding results for BL and BHC mimic those for IN to aconsiderable extent, there are some points.of difference too. Because fetalgrowth is not a uniform phenomenon in the sense that different organs and partsof thebody develop at different rates, this is hardly surprising.
Both BL and BHC appear”to be more normally distributed at term than does BW.The fact that BL and BHC are one-dimensional measures and that BW, if considered
. .
II-36
I
I1 as a volume, is three-dimensional would lead us to anticipate rather different
forms. ‘Afteral1, both X and X3”cannot be normall.ydistributed. The fact thatwe need to use the square root orcube rootof Bkl-toconvert it to novmality atterm lends support to this dimensional argument.
We find the median growth curve to be more clearly sigmoid in shape for BW thanit is for the other two over the range explored (28 weeks onward). Presumably,BL and BHC would show a clearer tendency to conform to this shape if we ,wereable to extend the range to cover, say, 12-28 weeks as well. All of thisemphasizes that charts for the various measures should be studied simultaneouslyfor they are related aspects of the same phenomenon. A natural sequel to notingthat the BW of an infant is low for its’GA is to check BL and BHC too. Thisaction might indicate a simple measurement.or recording’error in BW, confirm asignificant clinical deviation, or Support doubts about the accuracy of the GAassessment, for example.
Many paths exist for extending customary analysis. Some clinicians.mightconsider appropriately constructed standards for BW given GA and BL, as helpfulancillary information. Again, perinatal growth charts coul~e drawn for BW,after adjusting it for the ‘influenceof BL and BHC (via regression), or for asimple combination of BW, BL, and BHC optimally representing physical .development in some sense. If a decision is to be made concerning the normalityor otherwise of the”physical state of an infant for its level of GA, then allworthwhile available measures should be used. “The basic ingredient for thisprocedure WOU1d be the joint distribution of the measures involveal’(conditionalon GA)--let us say, BW, BL, and BHC. Given that the infant is judged “unusual,”some explanation will be sought, and naturally charts for the individualmeasures will be consulted. Therefore, we conclude that, even in more extensivedecision analyses, basic univariate standards have a role to play. ..
In order to construct “perinatal growth charts” similar to the ones displayed ‘here, a considerablee amount of information is required. The”question naturallyarises as to what can be done when a full set is not available. Presume in thefirst place that there is little clinical information at hand and that we are1imited in effect to BW and GA. Given that stillbirths are identified, thentheir elimination from the data could well be the only practical step towardforming a “healthy” group if the approach pursued in thi’spaper is adopted, Inthis instance, a change of approach might be more fruitful; the one we have inmind does not actually require the identification of stillbirths. Because thetotal material is the aggregation of the “healthy” and,the “1ess healthy,” wemay argue that at any particular GAwe could easily find.that the “healthy” form.one statistical subpopulation and the remainder another. If we coulddisentangle the two, probability.levels for the “healthy” could be determined.Some plausible assumptions about the forms of the components are called forinitially; these can be checked later using the data in aggregate form.Gaussian subpopulations seemed reasonable a priori here and were later found tobe quite consistent with the data” (Fryer et al., in press). Because of’.thepresence of misclassifications, it was necessary .to postulate further -theexistence of a third component in the lower GA’s.
The results of some tentative analyses in which the sexes are combined aredisplayed in figure 3 along with the standard derived earlier. The term“primary” is used to denote the alternative “healthy” subpopulation. Median
II-37
values of the two seem to be close but the upper limits less so. It is possiblethat the application of the BOX-COX transform (Box and. Cox, 1964) to theoriginal scale might make normal components on the transformed scale moreplausible still; in this case, the limits produced would be asymmetric. Thisapproach does seem to us to be worth pursuing further.
F4nally, we come to the case in which BW alone is available. Current practicemight tempt us to use some arbitrary cutoff point such as 2,500 g to define thelow weight and, by further inference, the “less healthy.” Apart from thecrudity of the latter step, it is difficult to see how a fixed point like2,500 g could be justified for all populations. If boundaries are related toprobability when we have a full set of information, then why should we deviatefrom this reasoning when the set is reduced? Following this approach, we wouldadopt probability-based limits among both the low weights and the high, althoughpercents in the two tails might be quite different. A more ambitiousstatistical approach would be to attempt to isolate a “healthy” group using thesubcomponent or mixture method outlined in the last paragraph. This has alreadybeen explored by several authors. Fryer et al. (in press) claim to have found aprimary “healthy” Gaussian component in Swedish data that accounts for some 90percent of infants, with a mean of 3,500 g and standard deviation rather lessthan 500 g. Obviously, this distribution would provide the base reference forprobability calculations. Tables 4 and 5 give precise parameter values of themixture for seven of the countries participating in a 1973 perinatal studysponsored by the World Health Organization (World Health Organization, 1979),an@ this seems to support the interpretation of the major component. It is alsoargued in Fryer et al. (in press) that standardizing this primary subpopulationprovides a sensible basis for making international comparisons of BW. In Figure5, the cumulative distributions of BW for three of the participating countries(Hungary, Japan, and Sweden) are presented, first in-abscrltiteform and then instandardized form. We see that, although the levels for Japan and Sweden arequite different in figure 5(a), the plots are virtually coincident in figure5(b), although Hungary still shows a heavier lower tail.
BW-specific early neonatal mortality rates can be standardized in the same way,and these are also displayed in figure 5. The parallel courses of thestandardized BW-specific mortalities in figure 5(b) indicate an improved,descriptionof the biological events.
References
Bjerkedahl, T., and Skjaerven, R. 1980. Percentile for fddelsevikt og isse-hal1engde i forhold til svangerskapsvarighet for levenefl!dte enkelf~dte.Tidsskr. Norske Laegefor. 100:1088-1091.
Box, G. E. P., and Cox, D. R. 1964. Analysis of transformations. Journal ofthe Royal Statistical Society. Series B:211-252.
Engstr8m, L., and Falcon@r, B. 1960. En JHmfbrelse mellan svenska nyfdddabarns ltingdoch vikt 1911-1920 och 1956-1957. Sv. L/!katidn. 57:1750-1759.
Fryer, J. G., Hunt, R. C., Simons, A. M., and Karlberg, P. In press. Modellingthe distribution of birth weight. Bristol University Monograph Series.
II-38
Hoffman, H. E., Stark, C. R:, Lundin, F. E., and Ashbrook, J. D. 1974.Analysis of birth weight, gestational age, and fetal viability, U.S. births,1968. Obstet. Gynecol. Surv. 29:651-679. .,,
Karlberg, P., and Priolisi, A. 1977. Clinical Evaluation of Similarities andDissimilarities Between the Two City Surveys. In Fundamentals of Morality RisksDuring the Perinatal Period and Infancy, Vol. 9, edited by F. Palkner. Basel:Rarger.
Karlberg, P., Engstrbm, I., and Karlberg, J. 1981. Methods of Evaluation”ofGrowth. In Biology of Normal Human Growth, edited by M. Ritzen, K. Hally’A.Zetterberg, el al. New York: Raven Press. ,.,
Karlberg, P., Taranger, J., Engstrdm, I., et al. 1976. The somatic developmentof children in a Swedish urban community. A prospective longitudinal study;, I.Physical growth from birth to 16 years and longitudinal outcome of the studyduring the same age period. Acts Paediatr. Stand. 258(Supp.):7-76. , 4 .
Lubchenco, L. O., Hansman, C., Dressier, M., and Boyd, E. 1963. Intrauterinegrowth as estimated from liveborn birth-weight data at 24 to 42 weeks”ofgestation. Pediatrics 32:793-800. ‘,
Rooth, G., Meirik, O., and Karlberg, P. 1985. Estimation of “normal” growth’ofSwedish infants at term, Preliminary report. Acts Paediatr. Stand.319(Supp.):76-79.
Thomson, A. M., Billewicz, W. Z., and Hytten, F. E. 1968. The assessment offetal growth. J. Obstet. Gynaecol. Brit. Cwlth. 175:903-916. ,,-.
Usher, R., and Mac-Lean, R. N. 1969. Intrauterine growth of live-bornCaucasian infants at sea level; Standard obtained from measurements -in”7dimensions of infants born between 25 and 44 weeks of gestation. Pediatrics74:901-910.
World Health Organization. 1979. Social and Biological Effects on PerinatalMortality, 1. Report on an International Comparative Study, Sponsored by WorldRealth Organization, 1978. Budapest: tatlstlcal Publishing House.
,:,..-
II-39
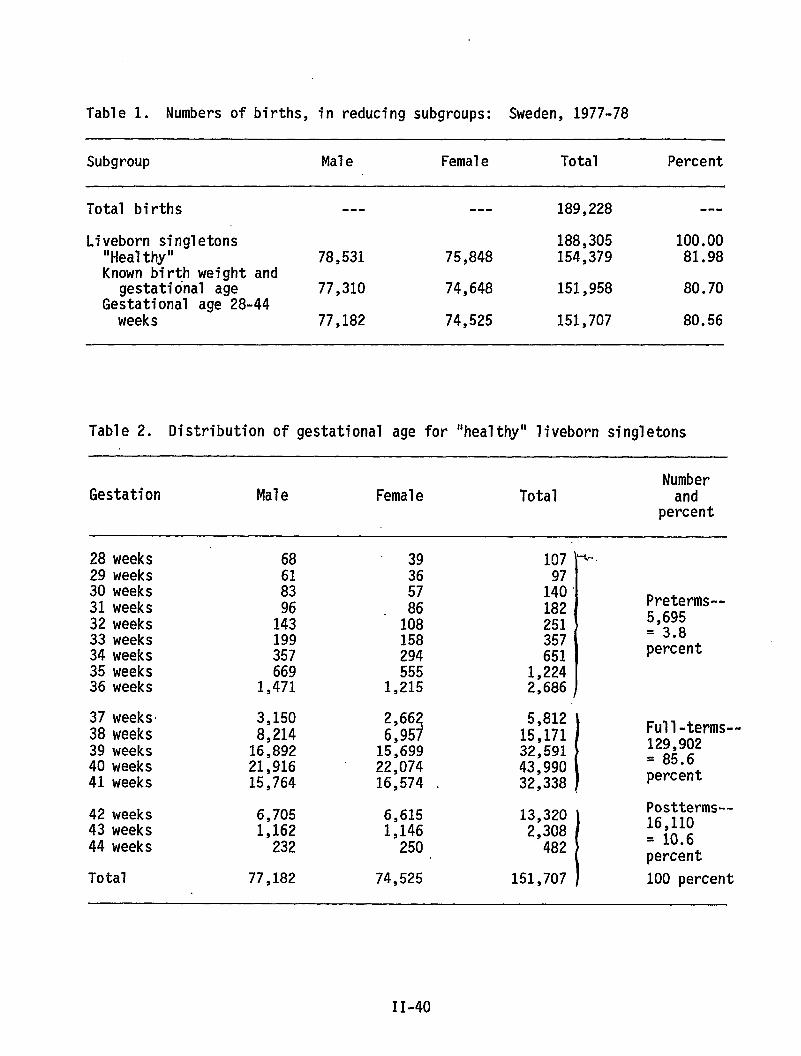
Table 1. Numbers of births, in reducing subgroups: Sweden, 1977-78
Subgroup Male Female Total Percent
Total births --- --- 189,228 ---
Liveborn singletons 188,305 100.00“Healthy” 78,531 75,848 154,379 81.98Known birth weight and
gestational age 77,310 74,648 151,958 80.70Gestational age 28-44weeks 77,182 74,525 151,707 80.56
Table 2. Distribution of gestational age for “healthy” liveborn singletons
NumberGestation Male Female Total and
percent
28 weeks 68 39I
1:; -“29 weeks 61 3630 weeks31 weeks32 weeks33 weeks34 weeks
83- :;
1% 108199 158357 294
140 ‘182 Preterms--
251 5,695
357 = 3.8
651 percent
35 weeks 669 555 1,22436 weeks 1,471 1,215 2,686 J
37 weeks 3,150 2,66?
5,81238 weeks 8,214 6,95 15,171
1
Full-terms--
39 weeks 16,892 15,699 32,591 129,902
40 weeks 21,916 22,074 43,990 = 85.6
41 weeks 15,764 16,574 . 32,338 . percent
42 weeks 6,705 6,615 13,320
1
Postterms--
43 weeks 1,162 1,146 2,308 16,110
44 weeks 232 250 482 = 10.6percent
Total 77,182 74,525 151,707 J 100 percent
11-40
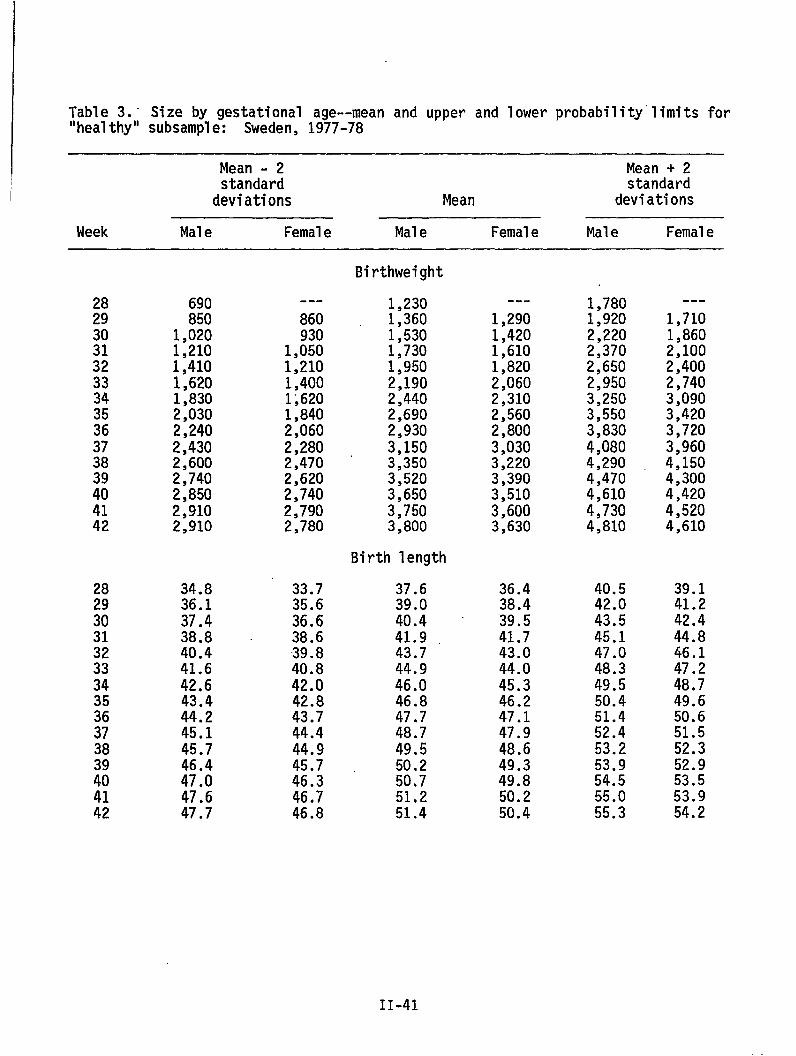
Table 3.” Size by gestational age--mean and upper and lower probability”limitsfor“healthy” subsample: Sweden, 1977-78
Mean - 2 Mean + 2standard standard
deviations Mean deviations
Week Male Female Male Female Male Female
28
%3132333435363738
%4142
690850
1,0201,2101,4101,6201,8302,0302,2402,4302,6002,7402,8502,9102,910
34.836.137.438.8 -40.441.642.643.444.245.145.746.447.047.647.7
---
860930
1,0501,2101,4001;6201,8402,0602,2802,4702,6202,7402,7902,780
33.735.636.638.639.840.842.042.843.744.444.945.746.346.746.8
Birthweight
1,2301,3601,5301,7301,9502,1902,4402,6902,9303,1503,3503,5203,6503,7503,800
Birth length
37.639.040.441.943.744.946.046.847.748.749.550.250.751.251.4
---
1,2901,4201,6101,8202,0602,3102,5602,8003,0303,2203,3903,5103,6003,630
36.438.439.541.743.044.045.346.247.147.948.649.349.850.250.4
1,7801,9202,2202,3702,6502,9503,2503,5503,8304,0804,2904,4704,6104,7304,810
40.542.043.545.147.048.349.550.451.452.453.253.954.555.055.3
---
1,7101,8602,1002,4002,7403,0903,4203,7203,9604,1504,3004,4204,5204,610
39.141.242.444.846.147.248.749.650.651.552.352.953.553.954.2
11-41
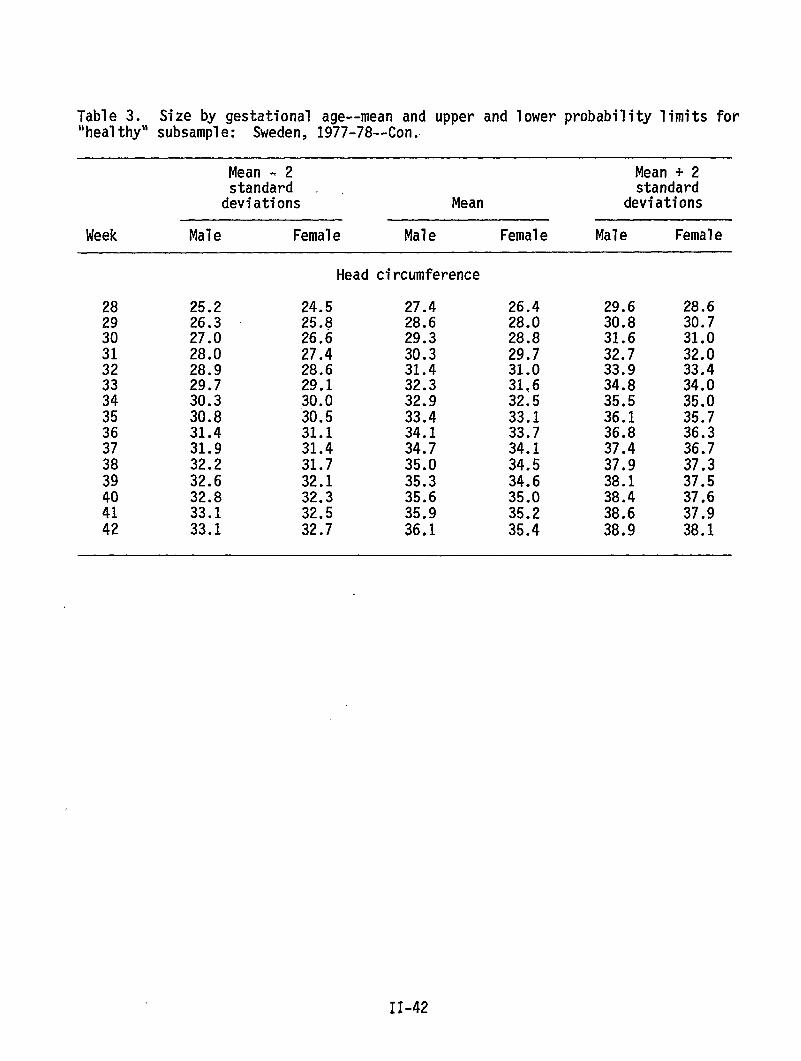
Table 3. Size by gestational age--mean and upper and lower probability limits for“healthy” subsample: Sweden, 1977-78--Con..
Mean - 2 Mean + 2standard standarddeviations Mean deviations
Week Male Female Male Female Male Female
Head circumference
282930313233343536373839
::42
25.226.327.028.028.929.730.330.831.431.932.232.632.833.133.1
24.525.826.627.428.629.130.030.531.131.431.732.132.332.532.7
27.428.629.330.331.432.332.933.434.134.735.035.335.635.936.1
26.428.028.829.731.031,632.533.133.734.134.534.635.035.235.4
29.630.831.632.733.934.835.536.136.837.437.938.138.438.638.9
28.630.731.032.033.434.035.035.736.336.737.337.537.637.938.1
II-42
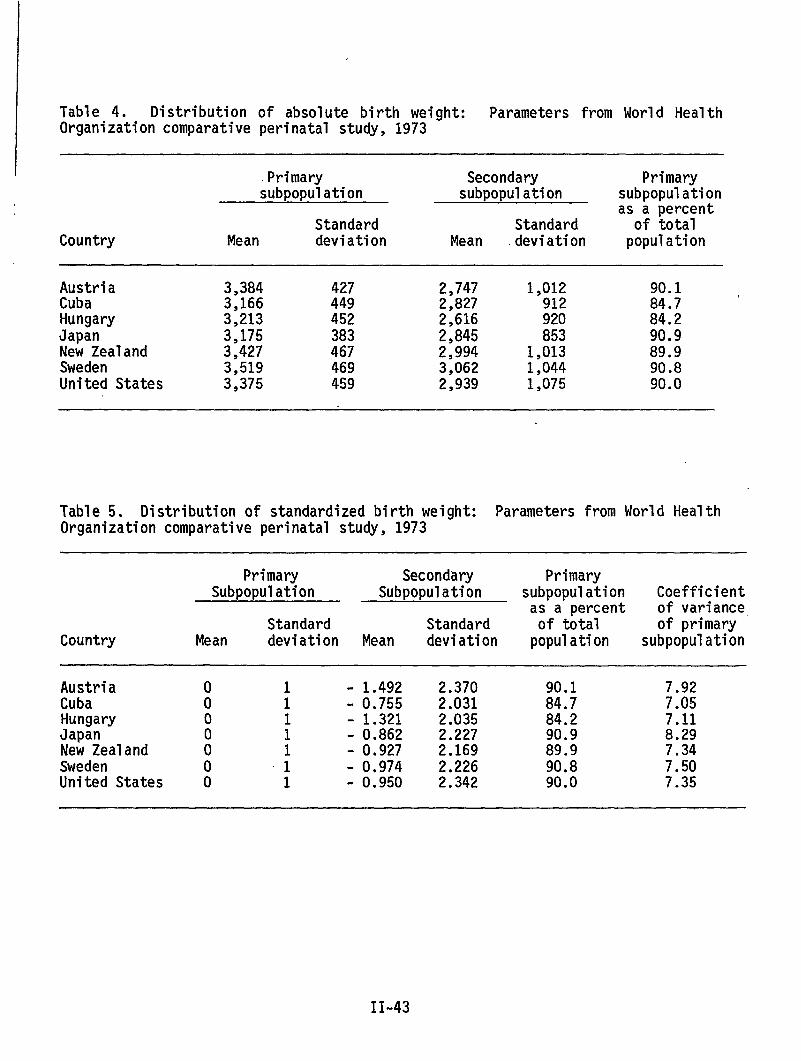
Table 4. Distribution of absolute birth weight: Parameters from World HealthOrganization comparative perinatal study, 1973
I .Primary Secondary Primarysubpopulation subpopulation subpopulation1
as a percentStandard Standard of total
Country Mean deviation Mean deviation population
Austria 3,384 427 2,747 1,012 90.1Cuba 3,166 449 2,827 912 84.7 <Hungary 3,213 452 2,616 920 84.2Japan 3,175 383 2,845 853 90.9New Zealand 3,427 467 2,994 1,013 89.9Sweden 3,519 469 3,062 1,044 90.8United States 3,375 459 2,939 1,075 90.0
Table 5. Distribution of standardized birth weight: Parameters from World HealthOrganization comparative perinatal study, 1973
Primary Secondary PrimarySubpopulation Subpopulation subpopulation Coefficient
as a Percent of varianceStandard Standard of total of primary
Country Mean deviation Mean deviation population subpopulation
Austria o 1 - 1.492 2.370 90.1 7.92Cuba o 1 -0.755 2.031 84.7 7.05Hungary o 1 - 1.321 2.035 84.2 7.11Japan 1 - 0.862 2.227 90.9 8.29New Zealand : 1 - 0.927 2.169 89.9 7.34Sweden o “1 -0.974 2.226 90.8 7.50United States O 1 - 0.950 2.342 90.0 7.35
II-43
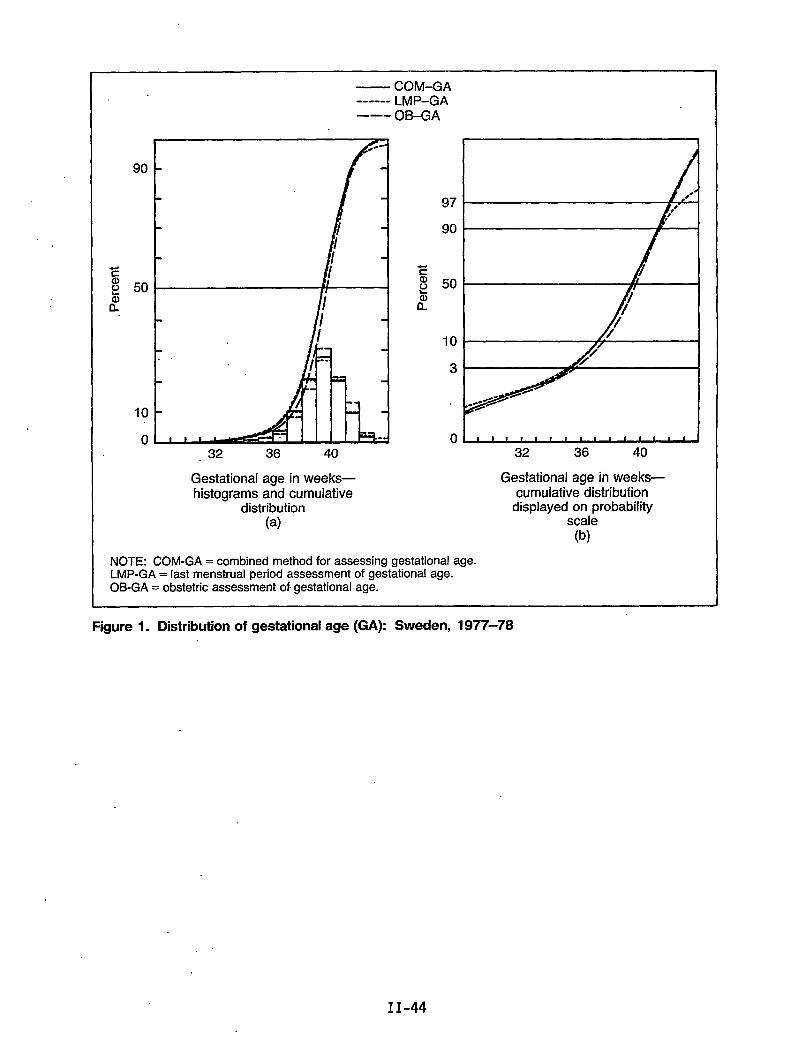
50
10
0
— COM-GA------ LMP-GA––- OB-GA
97
90
50
10
3
o~32 36 40
Gestational age in weeks—cumulative distribution
displayed on probabilityscale
(b)
.32 36 40
Gestational age in weeks—histograms and cumulative
distribution(a)
NOTE: COM-GA = combined method for assessing gestational age.LMP-GA = last menstrual period assessment of gestational age.OB-GA = obstetric assessment of.gestational age.
Figure 1. Distribution of gestational age (GA): Sweden, 1977-78
II-44
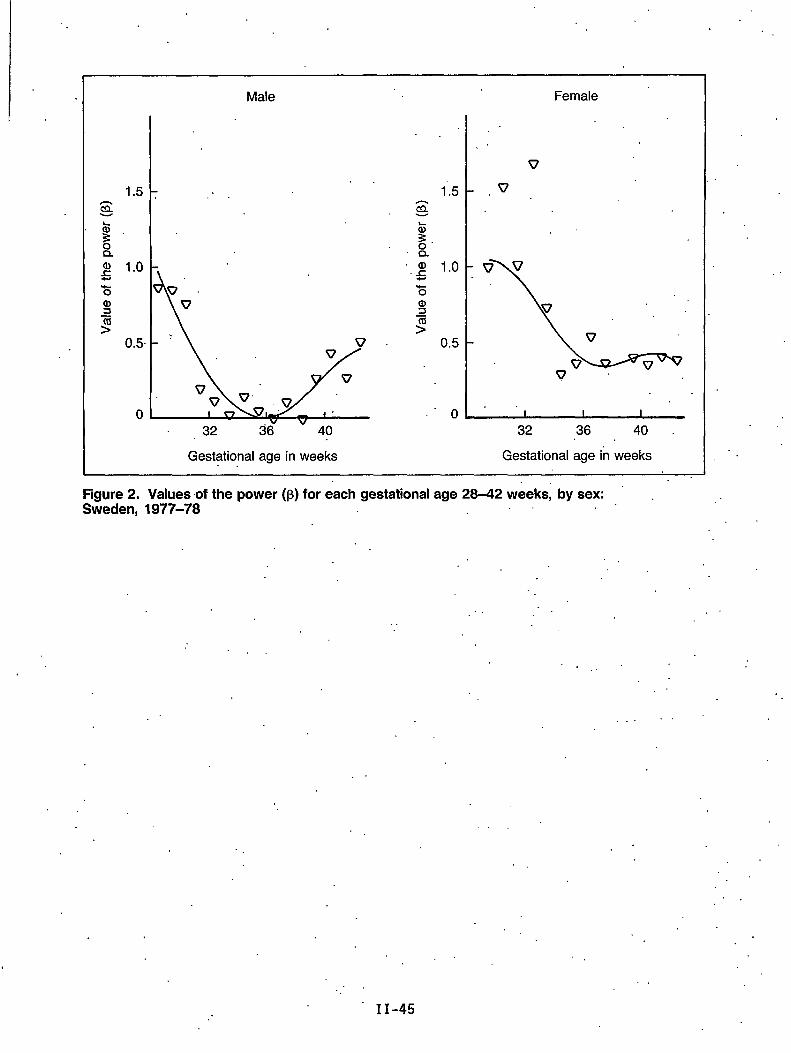
11.5 .
Male
. .
g 1.0.%
0.5
0
1“”,,,’7
Female
v
.,
v’
. .I 1 1
32 36 40
Gestational age in weeks Gestational age in weeks
. ..,Figure 2. Values of the power (p) for each gestational age 28-42 weeks, by sex:Sweden, 1977-78 .’
.,
. . . .
. .
.“
. .
.’,
II -45
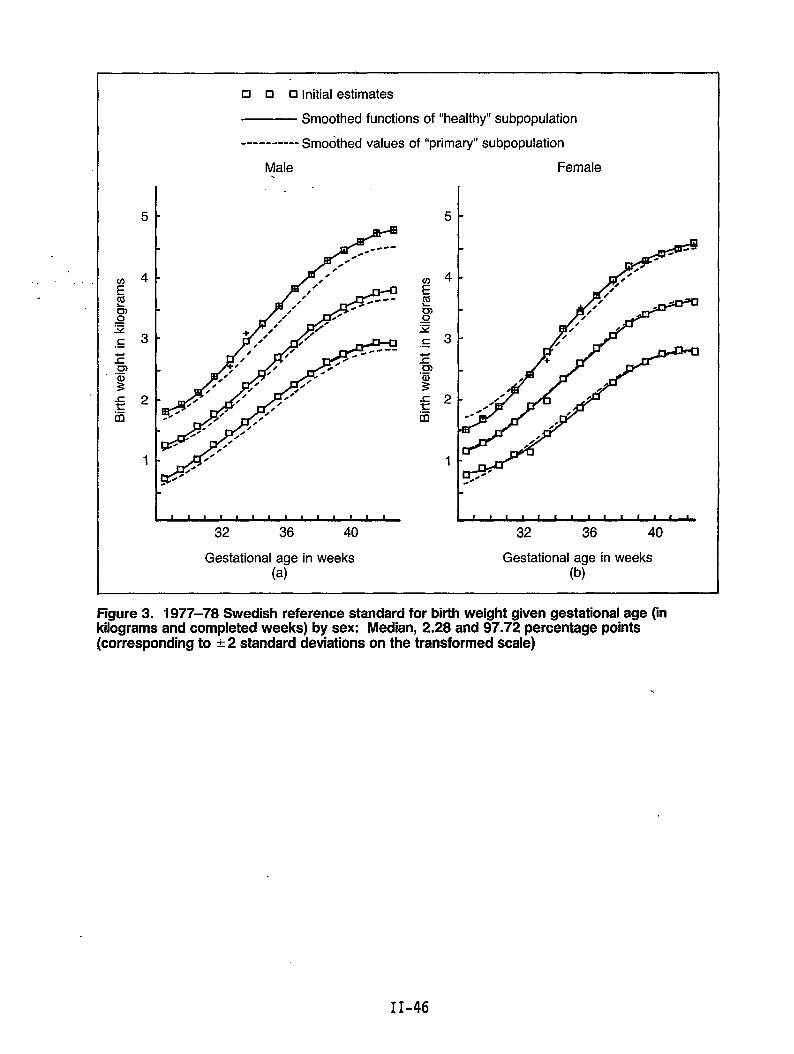
.,.
Figure 3. 1977–78 Swedish reference standard for birth weight given gestational age (inkilograms and completed weeks) by sex: Median, 2.28 and 97.72 percentage points[corresponding to k 2 standard deviations on the transformed scale)
.
•1 ❑ 0 Initial estimates
— Smoothed functions of “healthy” subpopulation
---------- Smoothed values of “primary” subpopulation
Male Female.
I.,
5
g2.-m
1
32 36 40
g2.-m
1
t[ , I 1 I 1 c 1 1 t s f * 1 ,
32 36 40
Gestational age in weeks Gestational age in weeks(a) (b)
II-46
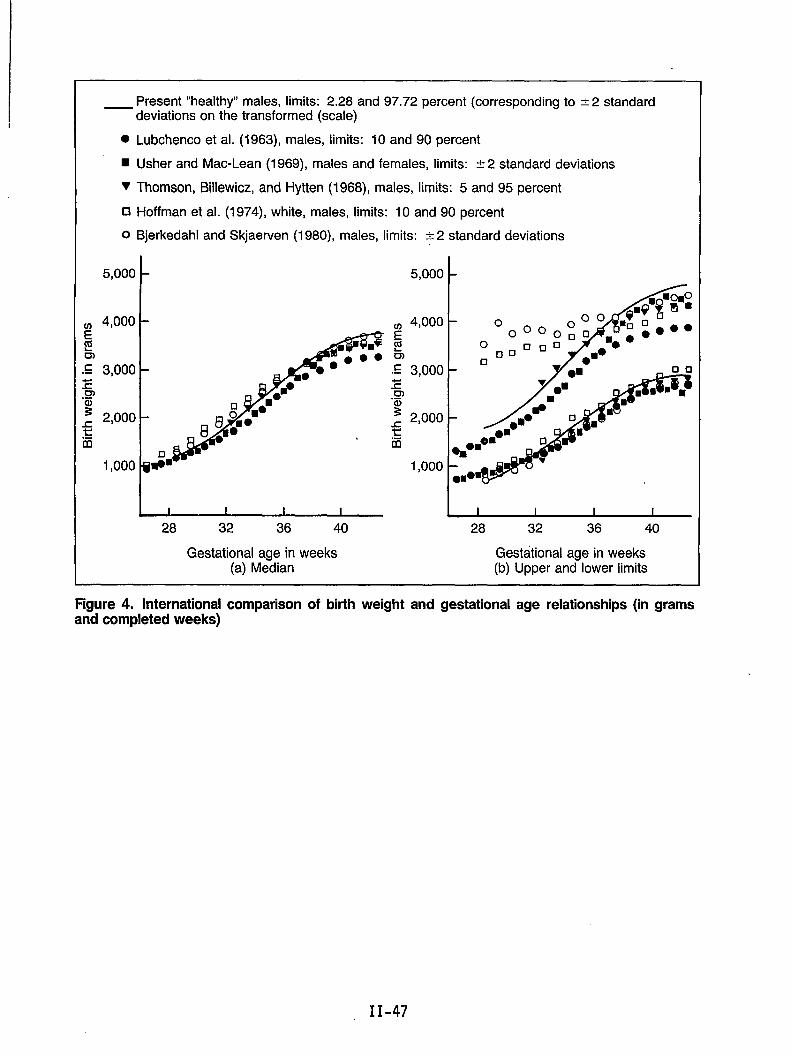
Present “healthy” males, limits: 2.28 and 97.72 percent (corresponding to &2 standard— deviations on the transformed (scale)
● Lubchenco et al. (1963), males, limits: 10 and 90 percent
~ Usher and Mac-Lean (1969), males and females, limits: A 2 standard deviations
T Thomson, ~llewicz, and Hytten (1968), males, limits: 5 and 95 percent
❑ Hoffman et al. (1974), white, males, limits: 10 and 90 percent
O Bjerkedahl and Skjaerven (1980), males, limits: & 2 standard deviations
c.-
5,000
4,000
3,000
2,000
1,000
1-
~~28 32 36 40 28 32 36 40
Gestational age in weeks Gestational age in weeks(a) Median (b) Upper and lower limits
Figure 4. International comparison of birth weight and gestational age relationships (in gramsand completed weeks)
II-47
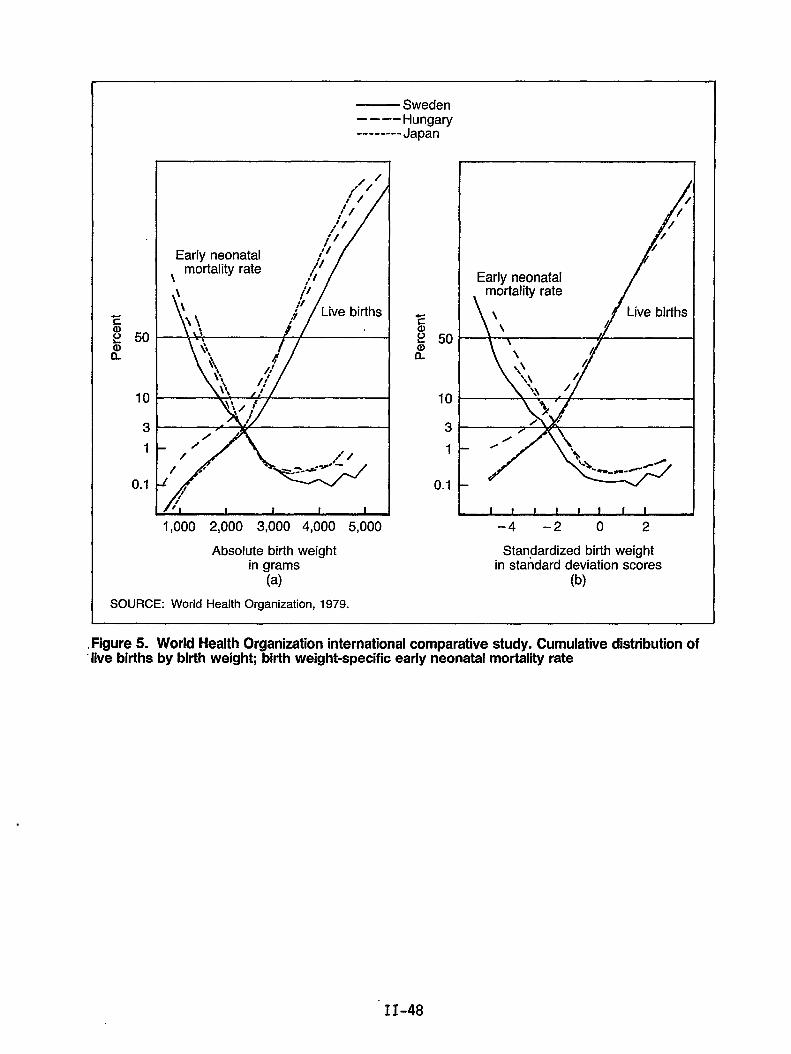
-Ea)i? 501?
10
3
1
0.1
— Sweden––-–Hungary-------- Japan
/,*’”/
tf // /
,/ /t’ /
Early neonatal 11/:mortality rate ~1
\ ;4~’1i
;;3
/“/
1,000 2,000 3,000 4,000 5,000
Absolute birth weightin grams
(a)
SOURCE: World Health Organization, 1979.
zal2 50$
10
3
1
0.1
Early neonatal
/
0
–4 –2 o 2
Standardized birth weightin standard deviation scores
(b)
.Figure 5. World Health Organization international comparative study. Cumulative distribution of“live births by birth weight; birth weight-specific early neonatal mortality rate
II-48
Chapter Ill: Comparisons ofTrends and Data onPerinatal and InfantMortality
Comparison of Cesarean Trends and Pregnancy Outcomein Selected States
.,
by Patricia W. Potrzebowski, Ph.D.
The rate of cesarean section deliveries in the United States quadrupled from1965 to 1983, from 4.5 per 100 hospital deliveries in 1965 to 20.3 in 1983,based on National Hospital Discharge Survey data from the National Center forHealth Statistics. Cesarean section rates in 1981 were highest in the Northeastat 20.0 per 100 hospital deliveries and lowest in the North Central Region at15.9 per 100. The South and West had intermediate rates in 1981 of 18.8 and17.1, respectively.
Previous studies of cesarean deliveries in the United States have been based onnational sample data from either the National Hospital Discharge Survey or theNational Natality Survey, both conducted by the National Center for HealthStatistics. While data from individual States have been reported, no State-by-State comparisons have been made. At present, 23, or almost half, of the Statesand other registration areas in the United States include information on methodof delivery on birth certificates. These States are shown in Figure 1. (Forsimplicity, the registration areas of New York City and New York State,excluding New York City, are referred to as States throughout this paper.) Thisinformation is collected and coded in a variety of standard and nonstandardways, including method, mode, or type of delivery; cesarean section; operationfor delivery; and operative procedures.
In order to obtain the data for this study, letters were sent to the vitalregistrar or health statistician in each of the 23 States, requesting that 14standardized table shells be completed with information for 1965, 1970, 1975,1980, and 1983. Of these 23 States, 18 provided at least some of the requesteddata and are included in this study. They are listed in table 1. The fiveregistration areas that, for a variety of reasons, were unable to provide datawere Arkansas, the District of Columbia, Massachusetts, Oregon, and SouthDakota. I would like to acknowledge the generous cooperation and support ofparticipating States at this time, as they were asked to provide rather largeamounts of data in a relatively short timeframe.
Table 1 also shows the year that method of delivery (or an equivalent data item)was added to the birth certificate in each of these States and the year that thedata were first put into machine-readable form. We were interested to find thatsix States had been collecting this data item on the birth certificate since .before 1950. Five of these six States were able to provide statisticalinformation on cesarean section delivery rates back to 1965, the earliest yearfor which we requested data. Cesarean section delivery rates for those five
,
III-3
States in 1965 and 1983 are shown in figure 2. Cesarean section rates for allparticipating”States are shown intable 2.
It should be noted that in all tables included in this study, rates are per 100live births with unknown type of delivery excluded. Data from the NationalHospital Discharge Survey,.published. by NCHS are rates per 100 hospitaldeliveries. About 1.1 percent of all live birthsin the United States werenonhospital deliveries in 1983. Since we can assume that the vast majority ofthese nonhospital deliveries.were not .cesarean sections, the difference indenominators means that the U.S. rates based on hospital deliveries wil1 be onlyslightly higher than if they had been,computed on the basis of all live births. .
In 1965, the”U.S. rate of cesarean section deliveries was”4.5 per 100. Of thefive States which provided data for 1965, only California, with 5.1 per 100 livebirths, had a rate that greatly exceeded the U.S. rate.
Fi,gures”3through 6 showthe earlies”tyear of data providedby each’State in thestudy in comparison with their 1983 rates. .Figure 7 shows the increase in ratesfor six selected States over time from 1965 to 1970. You can see some S1ightdifferences”in trends among the States, most notably California and New YorkCity, whose increases seem to have tapered off faster than the other Statesshown.
..Table 3 shows the cesarean section,rates in 1983 for the 18 States included inthe study. The rate of 23.6 in Maryland was the highest in 1983, well above theU.S. rate’of 20.3 per 100 hospital deliveries. However, it should be noted thatthe Maryland data are by residence of mother, not place of occurrence, so it is “possible that this rate is higher than it would be if calculated by.occurrence.
Preliminary analysis has shown that thereappears to be a positive correlationbetween these cesarean section rates and per capita income in the State and alsowith the number of physicians per’capita in the State.
Because of time limitations, I can only briefly summarize the remainingpreliminary findings. More.detailed analyses,are planned to further investigatethese’findings. ‘
In table 4 and,fi.gure8, cesarean section rates by age of mother are shown. Inall States studied, the incidence,of cesarean section increased consistentlywith increasing maternal age (probably because, in the past, medical practicehas been for the most part “once a section, always a section”).
Table 5 shows.cesarean section rates by race of mother.- In figure 9, you cansee that the cekarean section rates were higher for black women ,than’whitewomenin eightof the States, but higher for,whi~e women than black women in the othersix States. This phenomenon may be related to age or to income and paymentsource but merits further study before any conclusions can be drawn.
Table 6 Shows’rates for 1970 and 1983 by mother’s marital status. Married womengenerally “show slightly higher rates, and this is probably related to age. Theone- exception is Maryland in 1970, where unmarried women had slightly morecesarean sections per 100 live births than did married women.
111-4
Table 7shows cesarean section delivery rates by mother’s’educatfon for 1980 and1983, and figure 10 shows rates for 1983: The rates are consistently higher forwomen with at least a high school education, and again this may be related toage but may also be related to income. ,,
The change in cesarean section rates by mother’seducation from 1980 to 1983 are” ‘+shown’infigure 11. Most States had a smaller increase for women with less thana high school education. Missouri and Vermont had a greater increase for.thosewomen.
Table 8 and fiwre 12 show cesarean seitio.ndelivery rates in 1983 by birth’order. In gene;al, the cesarean section rates decreased with increasi~g birthorder, but there are exceptions and this decrease does not appear to beconsistent.
In figure 13, the cesarean section delivery rates in 1983 for infants of lessthan 1,500 grams, 1,500-2,499 grams; and 2,500 or more grams are shown.. Therates were considerably higher for very low and low birth weight infants.. Forinfants weighing less than 2,500 grams at birth, ‘the cesarean section ratesincreased considerably from 1975 to 1983 (figure 14). The percent of increasewas greater for these infants than for normal weight infants (fi9ure 15)’with,the exception of Maryland, where the percent of increase was about the same.
In figure 16, a comparison of cesarean section delivery rates by State for verylow birth weight babies is shown. In figure 17, the percent of increase’from1975 to 1983 by gestational age is shown. The inconsistency of these data maybe due to the relatively poor quality of this information as reporliedon birthcertificates.
Figure 18 shows cesarean section delivery rates for plural births in 1970 and -1983, and figure 19 shows rates for 1983. Figure 20 shows higher sex ratios forcesarean sections than for vaginal births in all States.
. .
In figure 21, the percent’of all cesarean section deliveries that were repeat’procedures.is given for those States that cpuld provide this information. ‘ ~~
Figure 22 shows the percent of increase in cesarean section rates for livebirths and neonatal deaths from 1975 to 1983. Without further study, it isdifficult to interpret these results.
In summary, while many of the variables under study were consistent for allStates, there were some interesting differences. Since the itern “method ofdelivery” will be on the 1989 revision.of the U.S. Standard Certificate of LiveBirth, most, if not all, registration areas will begin to collect these” data in1989. With the implementation of standard wording and coding procedures andwith the addition of information on primary and repeat cesarean sectionprocedures and V-BAC’S (vaginal births. after cesarian) in all States, we will be-able to study.future trends in cesarean section deliveries in all States in .greater detail. National sample data do not generally provide the specificityneeded for State and local public health program “managers and decisionmakers.There is considerable value to State and local users in State-specific data andin cross-State comparisons such as those shown in this presentation.
III-5
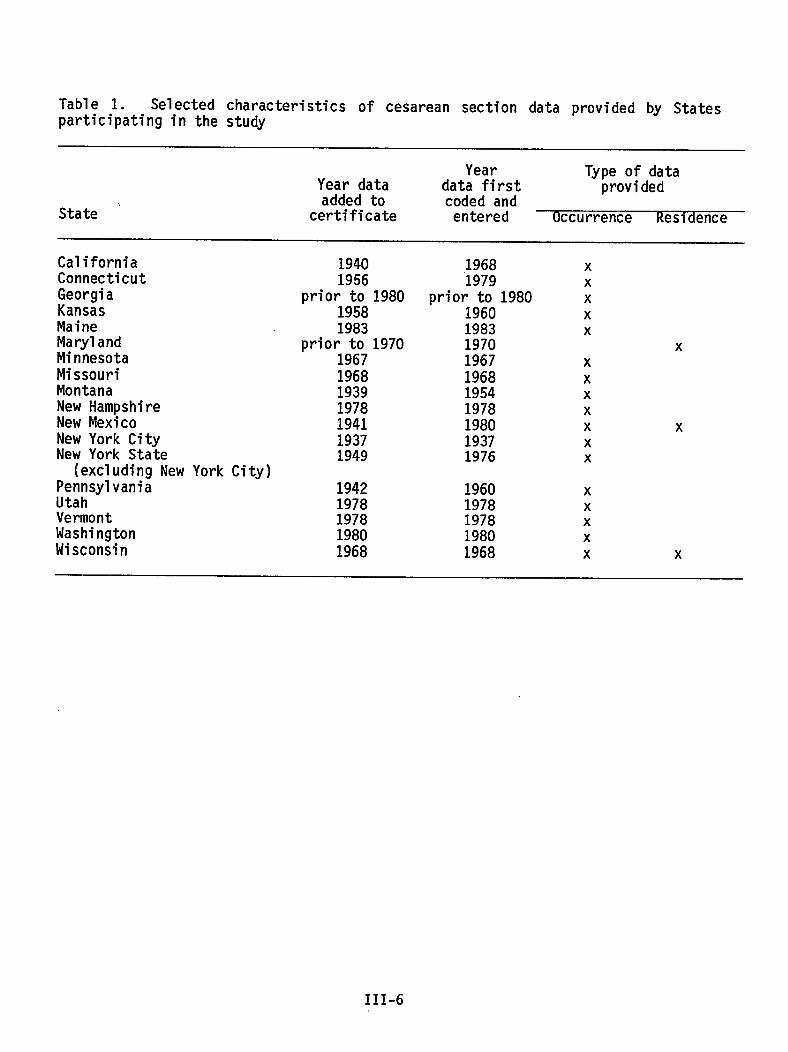
Table 1. Selected characteristics of cesarean section data provided by Statesparticipating in the study
Year Type of dataYear data data first providedadded to
State ‘coded and
certificate entered Occurrence Residence
CaliforniaConnecticutGeorgiaKansasMaineMarylandMinnesotaMissouriMontanaNew HampshireNew MexicoNew York CityNew York State
(excluding New York City)PennsylvaniaUtahVermontWashingtonWisconsin
19401956
prior to 198019581983
prior to 19701967196819391978194119371949
1968‘1979
prior to 19801960198319701967196819541978198019371976
1942 19601978 19781978 19781980 19801968 1968
xxxxx
xxxxxxxx
xxxxx
x
x
III-6
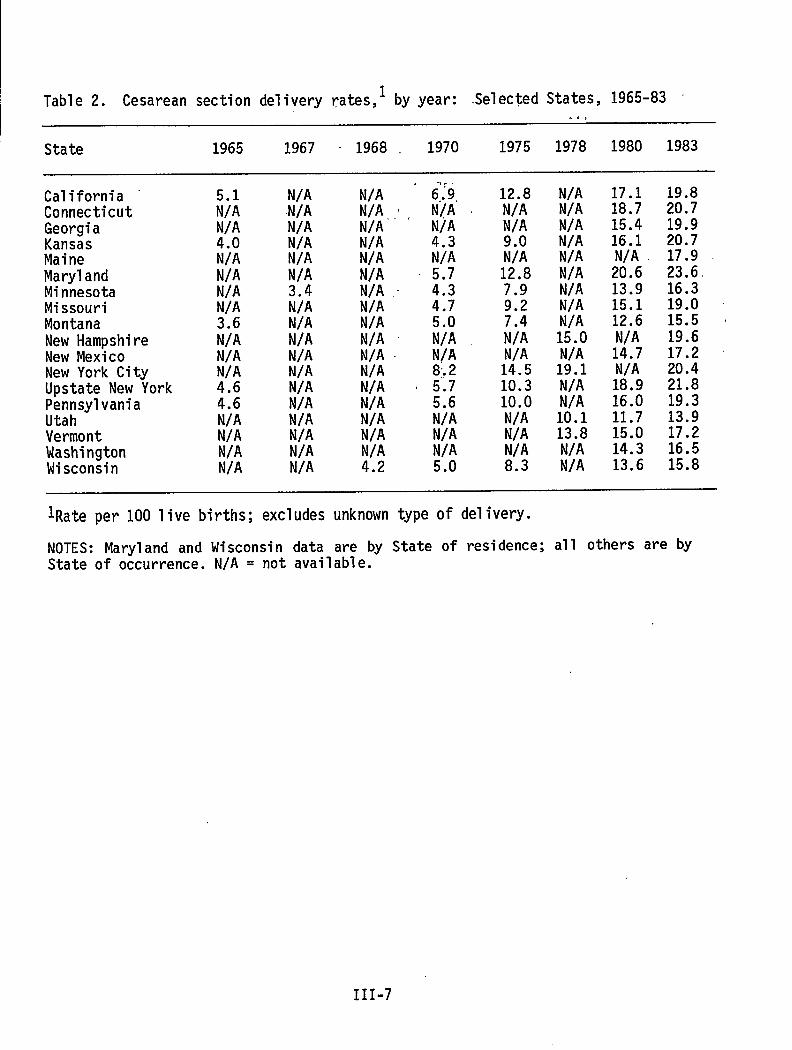
Table 2. Cesarean section delivery rates,l by year: .Selec$edStates, 1965-83
State 1965 1967 - 1968 . 1970 1975 1978 1980 1983
California “ConnecticutGeorgiaKansasMaineMarylandMinnesotaMissouriMontanaNew HampshireNew MexicoNew York CityUpstate New YorkPennsylvaniaUtahVermontWashingtonWisconsin
;;:N/A4.0N/AN/AN/AN/A3.6N/AN/AN/A4.64.6N/AN/AN/AN/A
N/AN/AN/AN/AN/AN/A3.4N/AN/AN/AN/AN/AN/AN/AN/AN/AN/AN/A
N/A “ 6;9, 12.8 N/A 17.1 19.8N/A,;t N[A ~ N/A N/A 18.7 20.7N/A N/A N/A N/A 15.4 19.9N/A 4.3 9.0 N/A 16.1 20.7N/A N/A N/A N/A N/A 17.9N/A 5.7 12.8 N/A 20.6 23.6N/A ~ ;.; 7.9 N/A 13.9 16.3N/A . 9.2 N/A 15.1 19.0N/A 7.4 N/A 12.6 15.5 4N/A ~ i;: N/A 15.0 N/A 19.6N/A N/A N/A N/A 14.7 17.2 ~N/A :: 14.5 19.1 N/A 20.4N/A ~ :.; 10.3 N/A 18.9 21.8N/A 5.6 10.0 N/A 16.0 19.3N/A N/A N/A 10.1 11.7 13.9N/A N/A N/A 13.8 15.0 17.2N/A N/A N/A N/A 14.3 16.54.2 5.0 8.3 N/A 13.6 15.8
lRate per 100”live births; excludes unknown type Of delivery.
NOTES: Maryland and Wisconsin data are by State of residence; all others are byState of occurrence. N/A = not available.
III-7

Table 3. Cesarean section deliveryrates, by State and rank: SelectedStates, 1983
Rank State Ratel
;3356‘789101112121415161718
MarylandUpstate New YorkConnecticutKansasNew York CityGeorgiaCaliforniaNew HampshirePennsylvaniaMissouriMaineNew MexicoVermontWashingtonMinnesotaWisconsinMontanaUtah
23.621.820.720.720.419.919.819.619.319.017.917.217.216.516.315.815.513.9
lRate per 100 live births; excludesunknown type of delivery.
NOTES: U.S. rate for 1983 is 20.3 per100 hospital deliveries; 1.1 percent ofall births in the United States werenonhospital deliveries. Maryland andWisconsin data are by State ofresidence; all others are by State ofoccurrence.
III-8
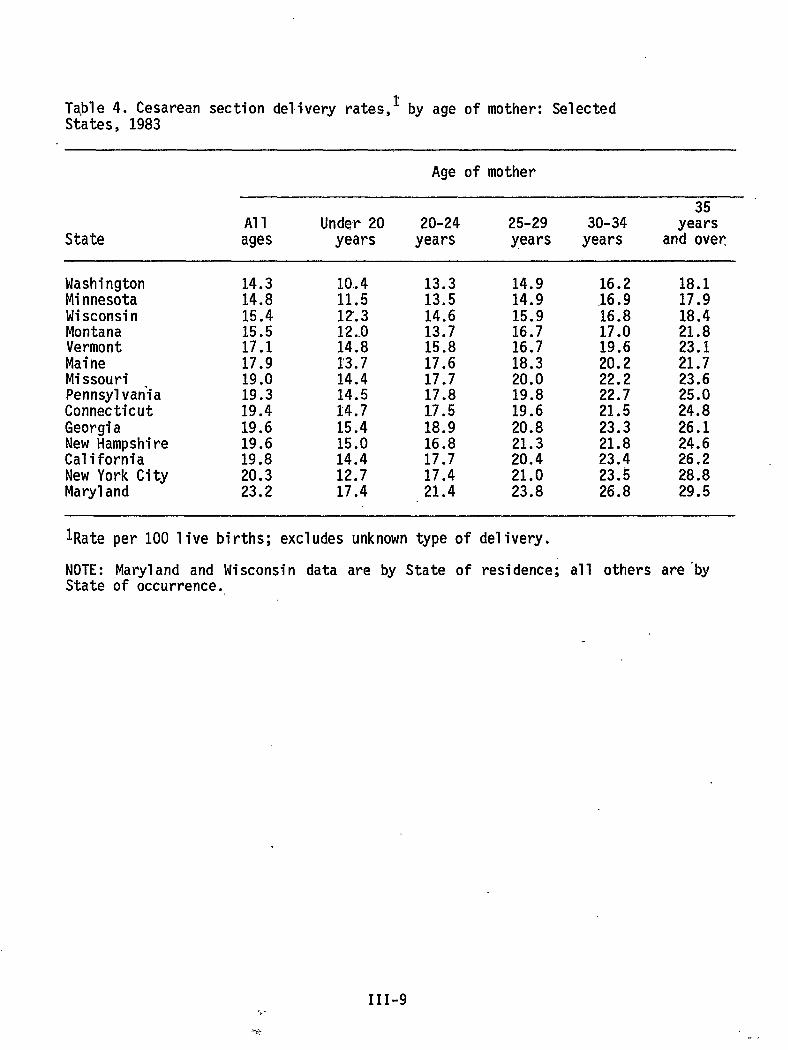
Table 4. Cesarean section delivery rate.s,~by age of mother: SelectedStates, 1983
Age of mother
35Al1 Under 20 20-24 25-29 30-34 years
State ages years years years years and over
WashingtonMinnesotaWisconsinMontanaVermontMaineMissouriPennsylvaniaConnecticutGeorgiaNew HampshireCaliforniaNew York CityMaryland
14.314.815.415.517.117.919.019.319.419.619.619.820.323.2
10.411.512.312..014.813.714.414.514.715.415.014.412.717.4
13.313.514.613.715.817.617.717.817.518.916.817.717.421.4
14.914.915.916.716.718.320.019.819.620.821.320.421.023.8
16.2,16.916.817.019.620.222.222.721.523.321.823.423.$26.8
18.117.918.421.823.121.723.625.024.826.124.626.228.829.5
lRate per 100 live births; excludes unknown type of delivery.
NOTE: Maryland and Wisconsin data are by State of residence; all others are”byState of occurrence.
III-9.%.
..#: .,
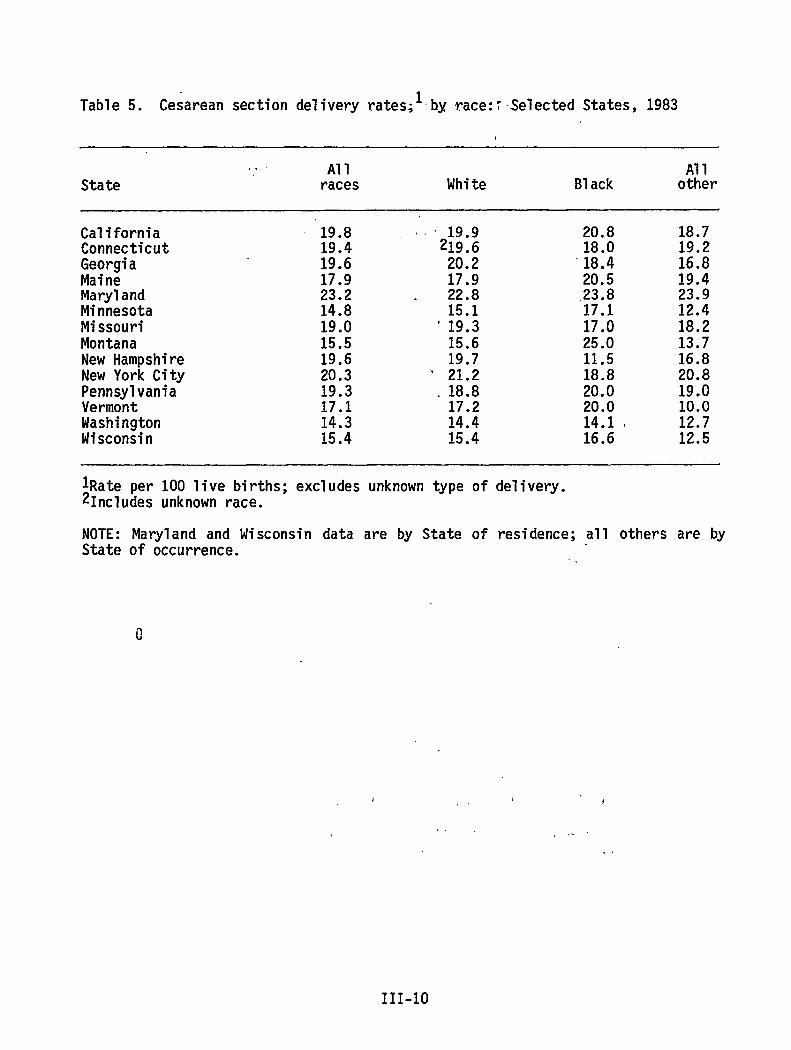
Table 5. Cesarean section delivery rates;lbyrace::SelectedStates, 1983
. . Al1 Al1State races White B1ack other
CaliforniaConnecticutGeorgiaMaineMarylandMinnesotaMissouriMontanaNew HampshireNew York CityPennsylvaniaVermontWashingtonWisconsin
19.819.419.617.923.214.819.015.519.620.319.317.114.315.4
,, ‘ 19.9219.620.217.9
. 22.815.1
‘19.315.619.7
“ 21.2.18.817.214.415.4
20.818.0-18.420.5.23.817.117.025.011.518.820.020.014.116.6
18.719.216.819.423.912.418.213.716.820.819.010.012,712.5
ll?ateper 100 live births; excludes unknowntype of delivery.21n~l~des unknownrace.
NOTE: Maryland and Wisconsin data are by State of residence; all others are byState of occurrence.
111-10
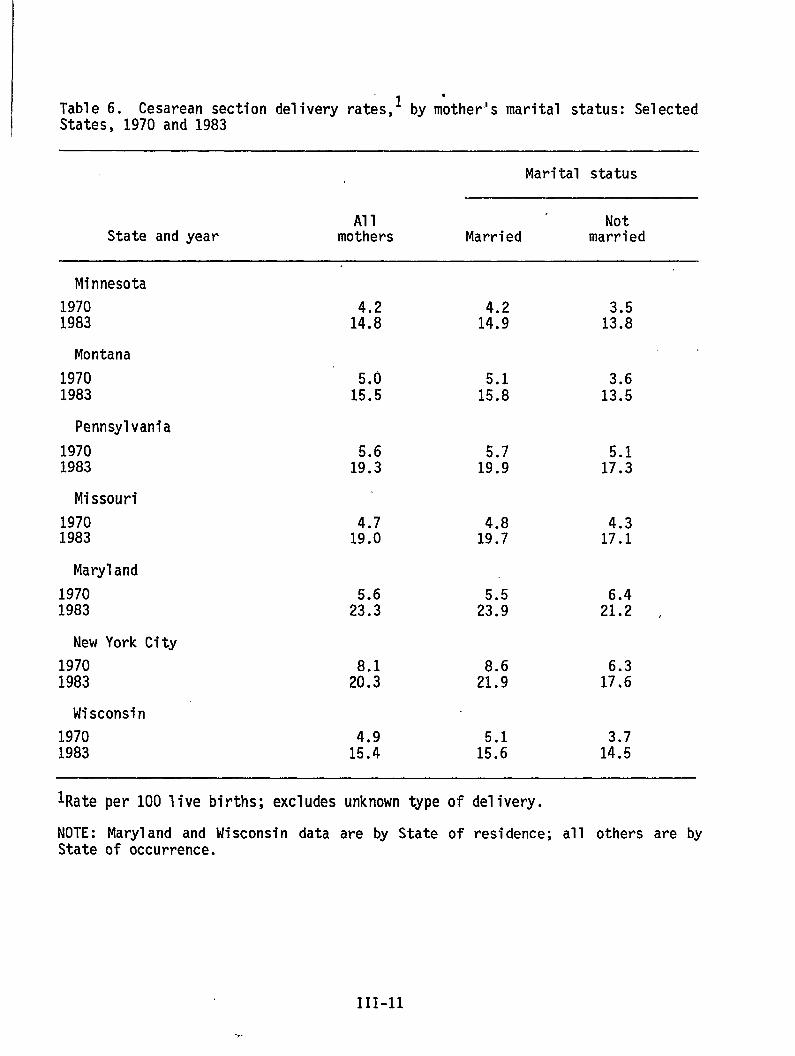
1 by m~ther’s marital status: SelectedTable 6. Cesarean section delivery rates,States, 1970 and 1983
Marital status
Al1 NotState and year mothers Married married
Minnesota
19701983
Montana
19701983
5.015.5
5.115.8
3.613.5
Pennsylvania
19701983
5.619.3
Missouri
19701983
4.719.0
4.317.1
Maryland
19701983
New York City
19701983
Wisconsin
19701983
lRate per 100 live births; excludes unknowntype of delivery.
NOTE: Maryland and Wisconsin data are by State of residence; all others are byState of occurrence.
111-11
-,.
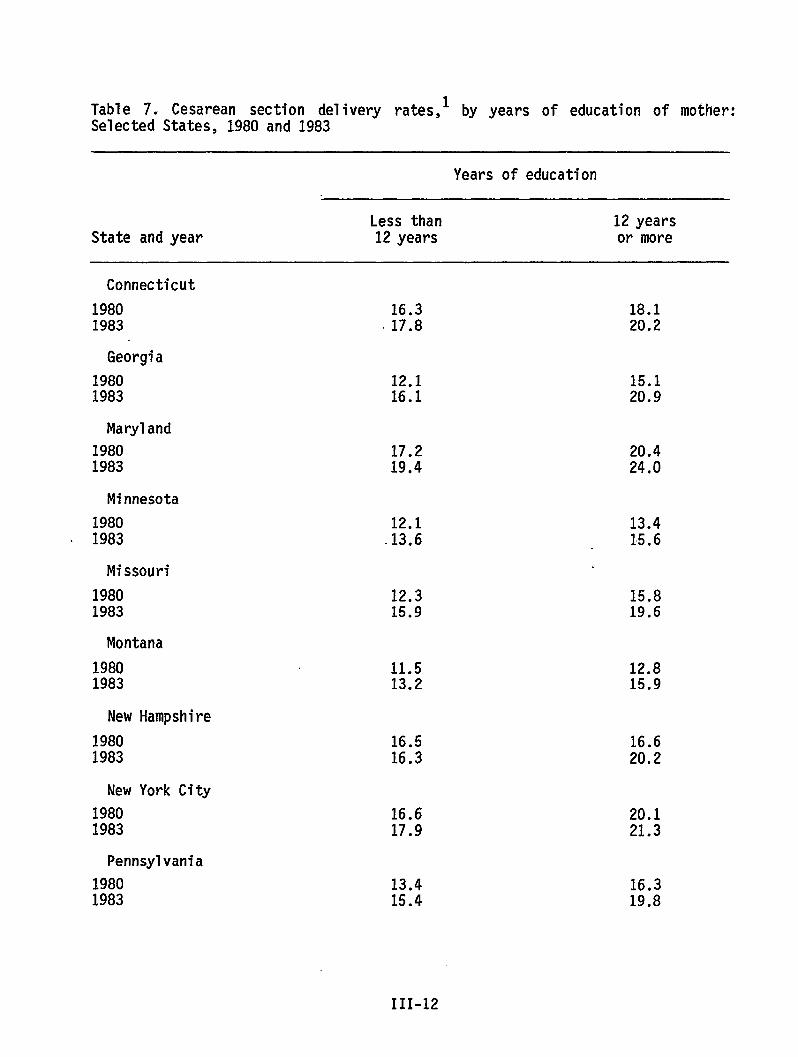
Table 7. Cesarean section delivery rates,l by years of education of mother:Selected States, 1980and 1983
Years of education
Less than 12 yearsState and year 12 years or more
Connecticut
1980 16.31983 .17.8
Georgia
1980 12.11983 16.1
Maryland
1980 17.21983 19.4
Minnesota
1980 12.1. 1983 .13.6
Missouri
1980 12.31983 15.9
Montana
1980 11.51983 13.2
New Hampshire
1980 16.51983 16.3
New York City
1980 16.61983 17.9
Pennsylvania
1980 13.41983 15.4
18.120.2
15.120.9
20.424.0
13.415.6
15.819.6
12.815.9
16.620.2
20.121.3
16.319.8
111-12
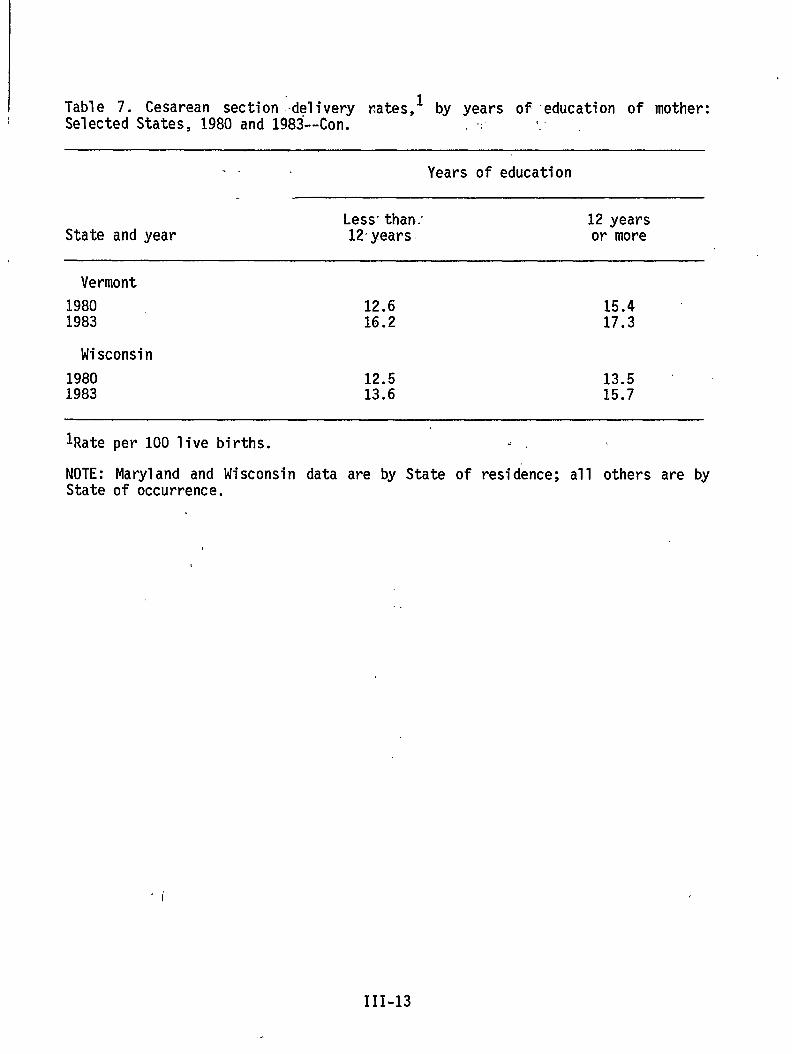
Table 7.Selected
Cesarean section delivery r%tes,l by years of-education of mother:States, 1980 and 1983--Con. .,, !.i.
. . Years of education
Less-than: 12 yearsState and year 12years or more
Vermont
1980 12.6 15.41983 16.2 17.3
Wisconsin
19801983
12.513.6
13.515.7
lRate
NOTE:State
per 100 live births. .=
Maryland and Wisconsin data are by State of residence; all others are byof occurrence.
,.I
111-13
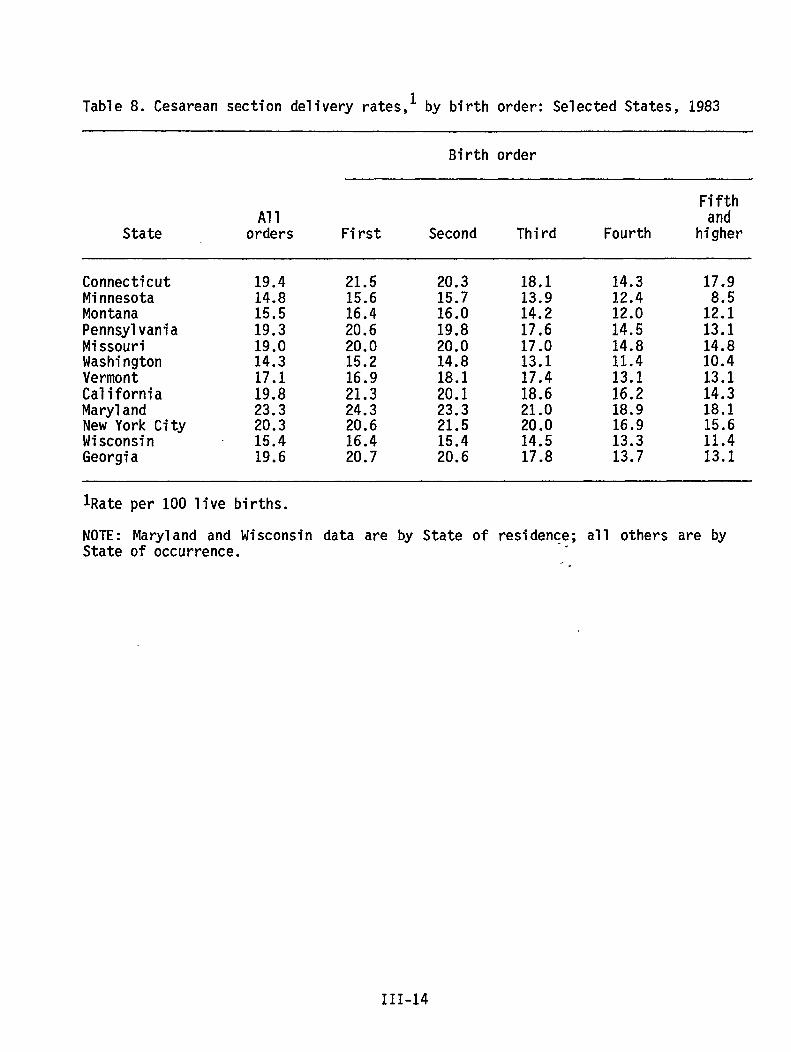
Table 8. Cesarean section delivery rates,l by birth order: Selected States, 1983
Birth order
F;;;hAl1
State orders First Second Third Fourth higher
ConnecticutMinnesotaMontanaPennsylvaniaMissouriWashingtonVermontCaliforniaMarylandNew York CityWisconsinGeorgia
19.414.815.519.319.014.317.119.823.320.315.419.6
21.515.616.420.620.015.216.921.324.320.616.420.7
20.315.716.019.820.014.818.120.123.321.515.420.6
18.113.914.217.617.013.117.418.621.020.014.517.8
14.312.412.014.514.811.413.116.218.916.913.313.7
17.9
1;:!13.114.810.413.114.318.115.611.413.1
lRate per 100 live births.
NOTE: Maryland and Wisconsin data are by State of residence; all others are byState of occurrence.
.-.
111-14
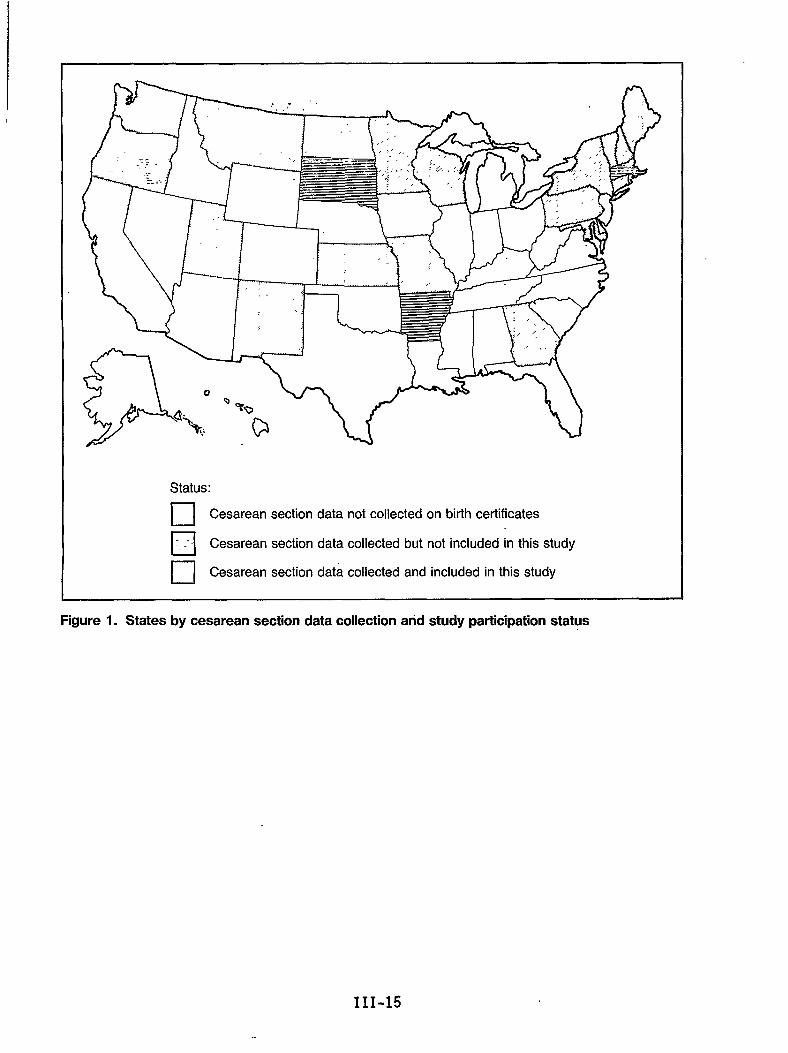
w-’-m----- n
/(e ‘“w.. ,<.
,“” “v‘.
. . . . ;w’\
‘dStatus:
❑ Cesarean section data not collected on birth certificates
ElCesarean section data collected but not included in this study
•1Cesarean section data collected and included in this study
Figure 1. States by cesarean section data collection and study participation status
111-15
..
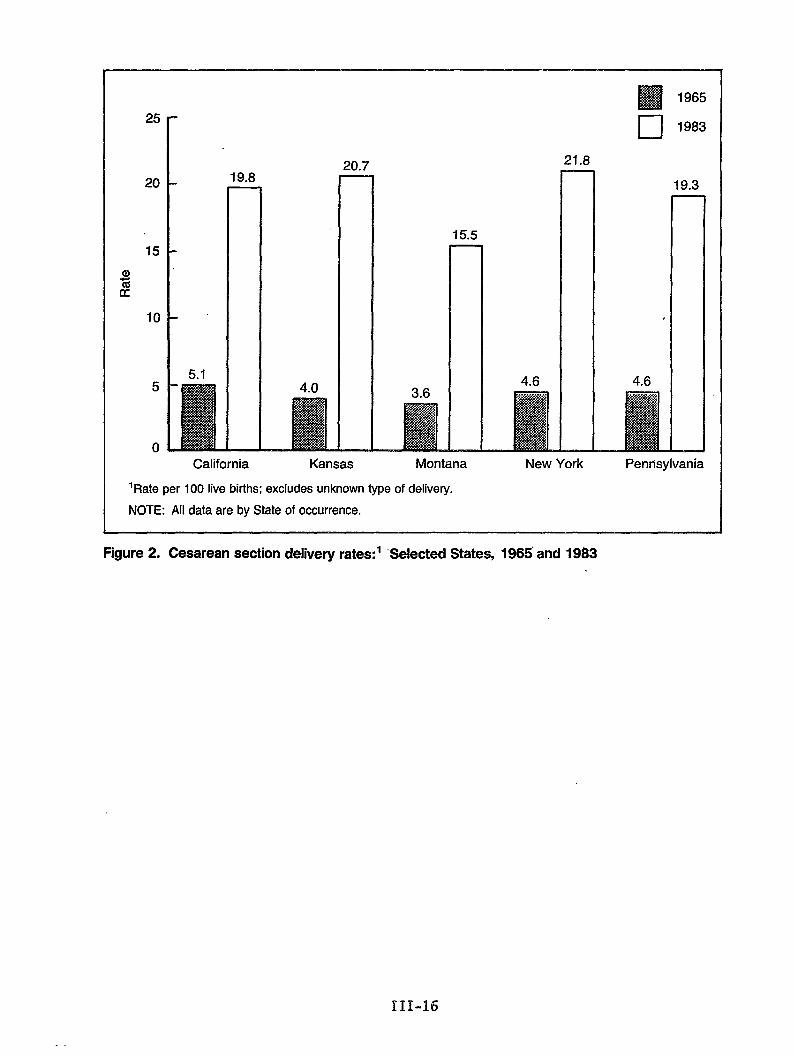
w 196525
20
15
aGK
10
5
0
.
19.8
5.1
15.5
4.63.6
—
21.8—
—
❑ 1983
9.3
4.6
—
—New YorkCalifornia Kansas Montana Pennsylvania
‘Rate per 100 live births; excludes unknown type of delivery.
NOTE: All data are by State of occurrence.
Figure 2. Cesarean section delivery rates: ‘ “Selected States, 1965’ and 1983
111-16
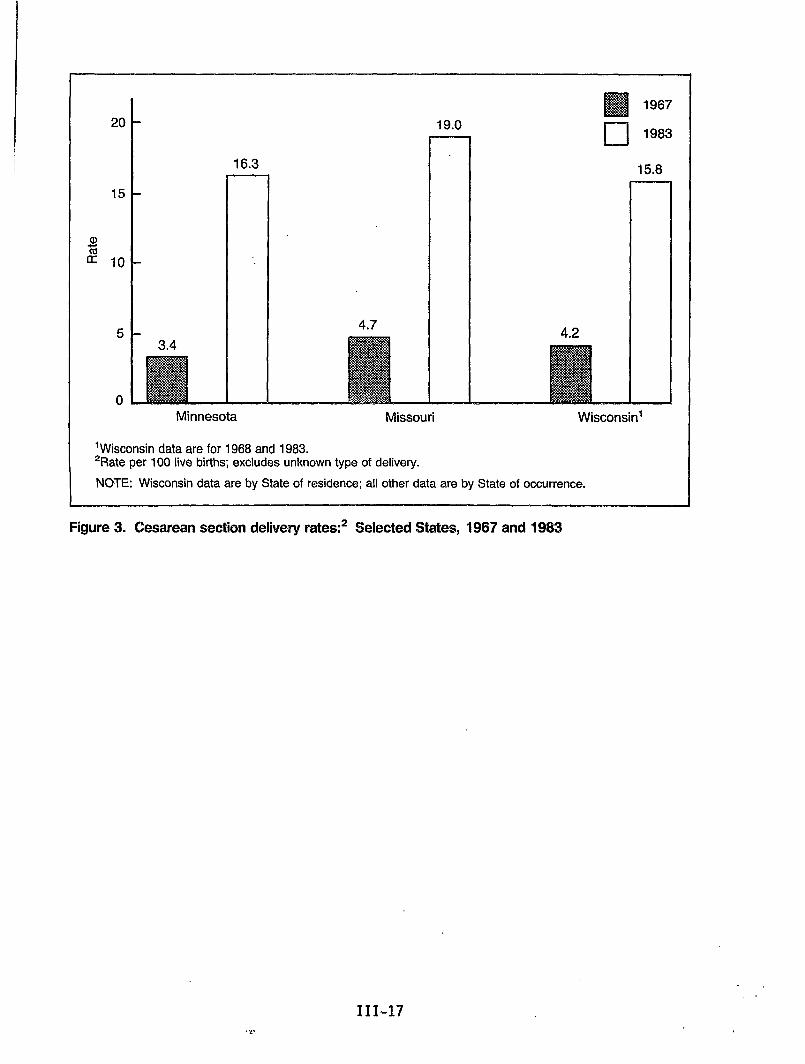
H 1967
20
15
CD
~ 10
5
0
16.3
Minnesota
19.0
4.7
Missouri
n 1983
15.8
4.2
Wisconsin’
‘Wkconsin data are for 1968 and 1983.2Rate per 100 live births; excludes unknown type of delivery.
NOTE: Wisconsin data are by State of residence; all other data are by State of occurrence.
Figure 3. Cesarean section delivery rates:2 Selected States, 1967 and fi983
111-17
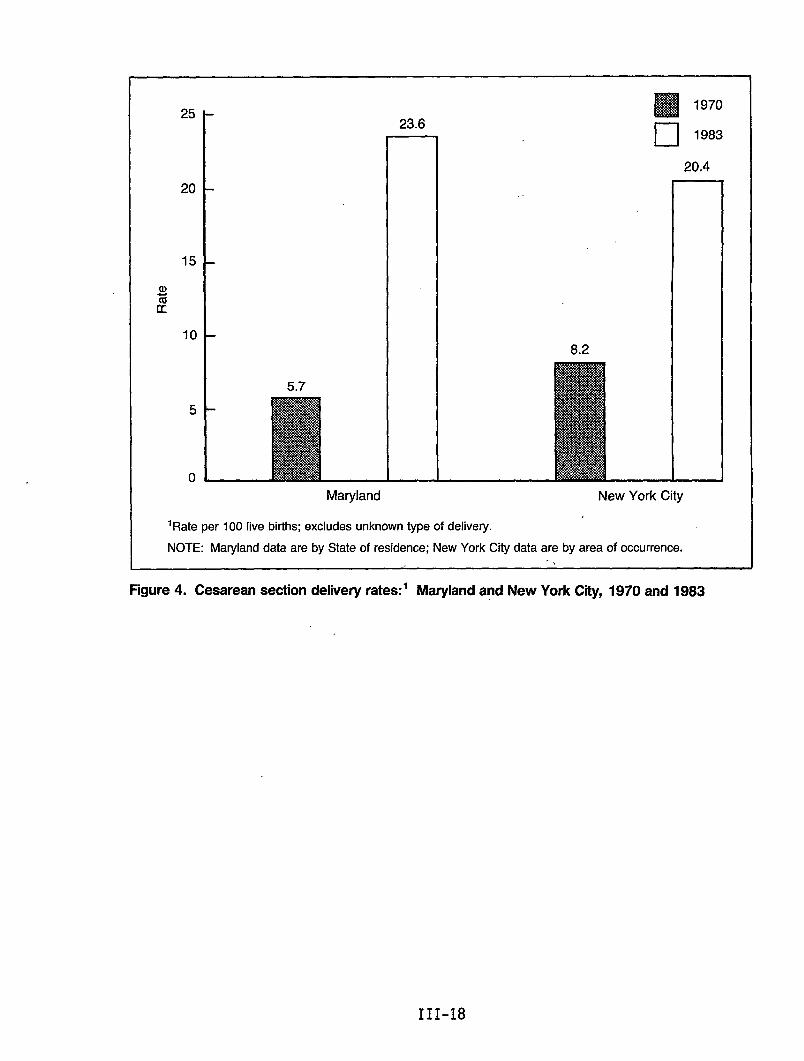
25
20
15
a)76a
10
5
0Maryland New York City
‘Rate per 100 live births; excludes unknown type of delivery.
NOTE: Maryland data are by State of residence; New York City data are by area of occurrence.
Figure 4. Cesarean section delivery rates:’ Maryland and New York City, 1970 and 1983
111-18
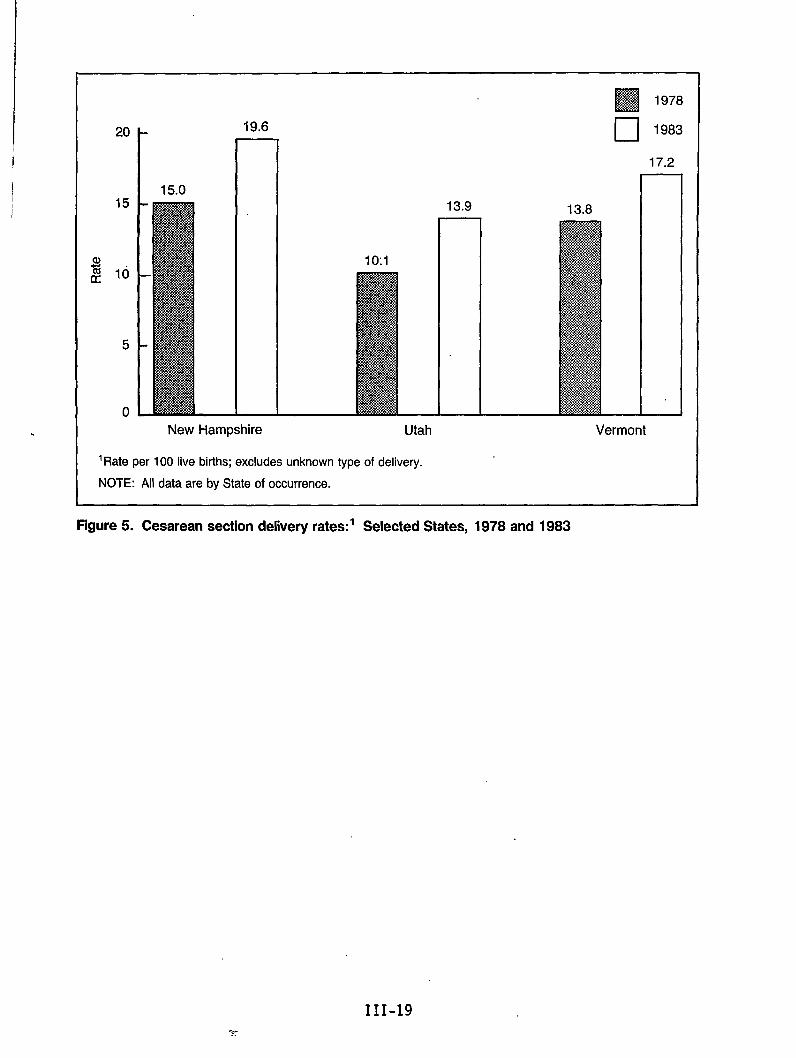
.
20
15
5
0
1- 19.6
15.0 n
New Hampshire Utah
13.9
‘Rate per 100 live births; excludes unknown type of delivery.
NOTE: All data are by State of occurrence.
❑ 1983
17.2
13.8 n
Vermont
Figure 5. Cesarean section delivery rates.o‘ Selected States, 1978 and 1983
111-19.=...
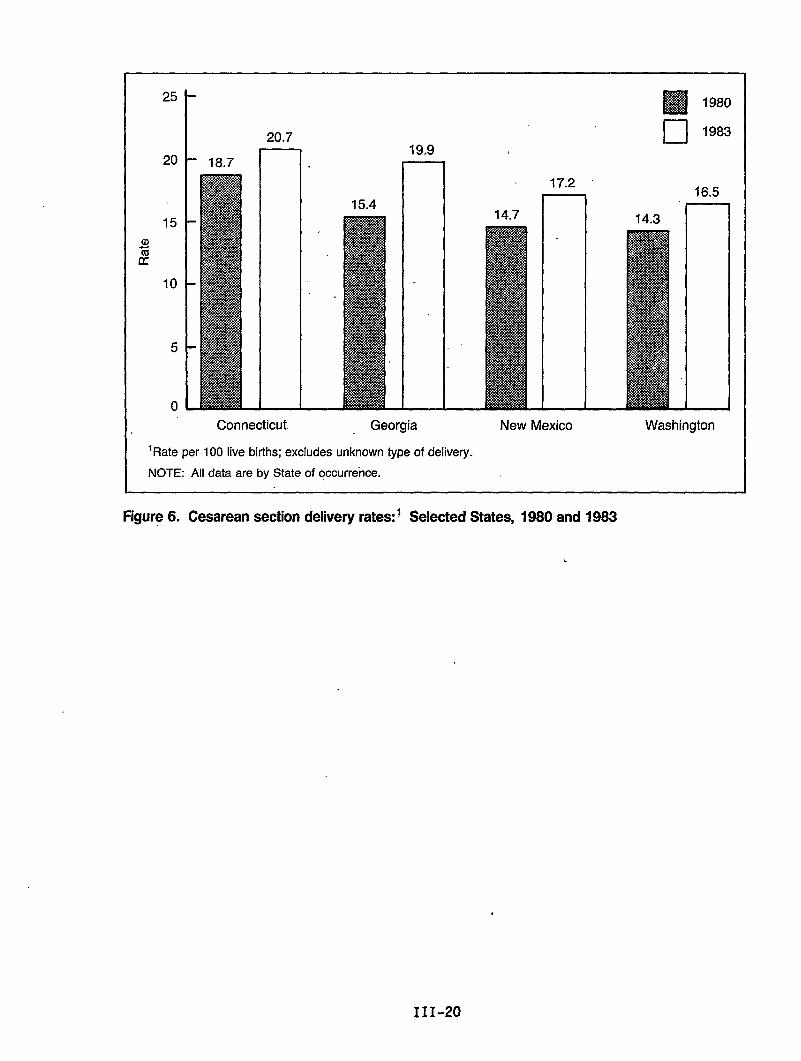
JIJ
2
25
t
I 20.7
20 18.7 n.19.9
I 1
15
10
5
0
Connecticut
15.4
. .
Georgia
‘Rate per 100 live births; excludes unknown type of delivery.
NOTE: All data are by State of occurrence.
17.2
14.7
New Mexico
❑ 1980
❑ 1983
16,5
14.3 II
Washington
Figure 6. Cesarean section delivery rates:i Selected States, 1980 and 1983
111-20
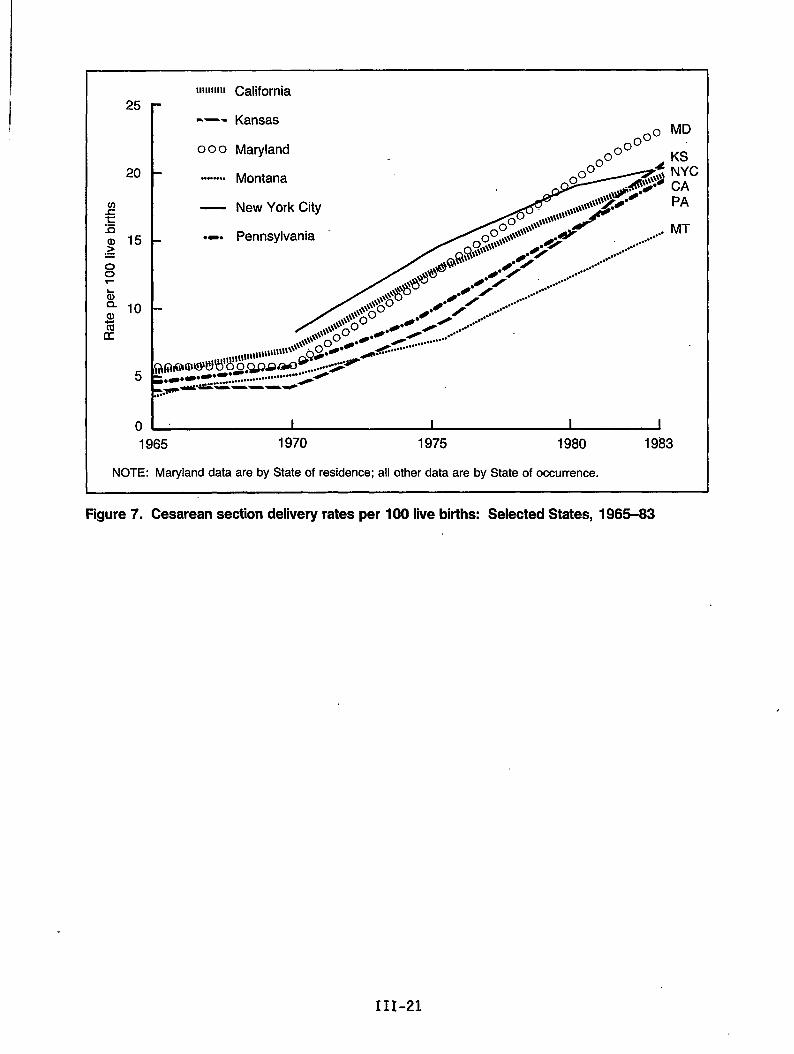
Ilmillll California25
20
(neEa) 15~
~
t): 10lacc
5
0
-—- Kansas
000 Maryland
““””o”.”Montana
— New York City
.. . Pennsylvania
~o” %,$- .*s\#.,\\\\,\\\\\>j$5#*/,,\,\\w”
& ........”””
/
.0>~QQcJg\w”” ....
/+ ,,..#
#“ / .+..
,py$ .4” / , .../....””””●4 /
@ .0 /....
.0 /....
.....@ /
.......”
●.0” @k/ .-.....”””””./
\\\\\\;?\\\\ o
\\\\\\>o\\\\
\@@@@,&ul8lllll1llltllll1ll..-””””’”-&........””..’”
0 ~&x3a~Q9:.:>4
;e-.-.--”-” ~s”+_...........o...”””””””””.*-6 —----P..
MD
KSNYCCAPA
MT
1965 1970 1975 1980 1983
NOTE: Maryland data are by State of residence; all other data are by State of occurrence.
Figure 7. Cesarean section delivery rates per 100 live births: Selected States, 1965-63
111-21
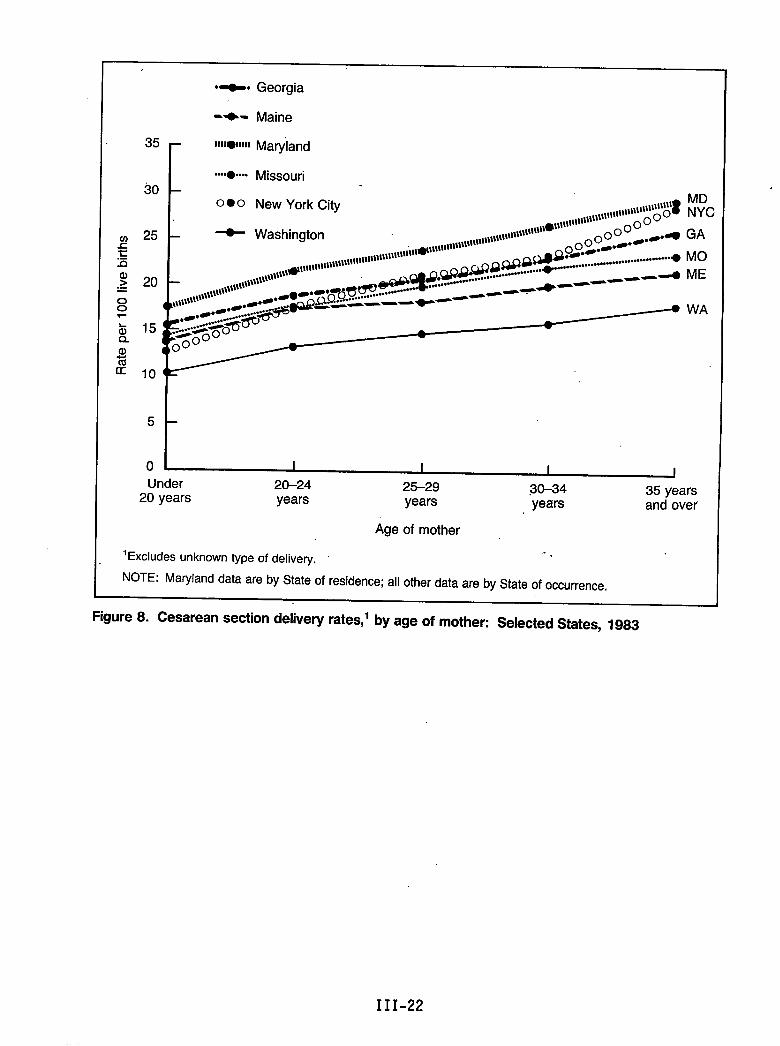
●o- Georgia
a)zcc
-+- Maine
35 r 1111.11111Mayland
L ‘o-o - Missouri●
300 ● O New York city
25
20
15
10
MDNYC
GA
MO
ME
WA
5
to I I I I IUnder 20-24 25-29
20 years30-34
years35 years
years years and over
Age of mother
‘Excludes unknown type of delivery. -.
NOTE: Maryland data are by State of residence; all other data are by State of occurrence.
Figure 8. Cesarean section delivery rates,’ by age of mother: Selected States, 1983
III-22
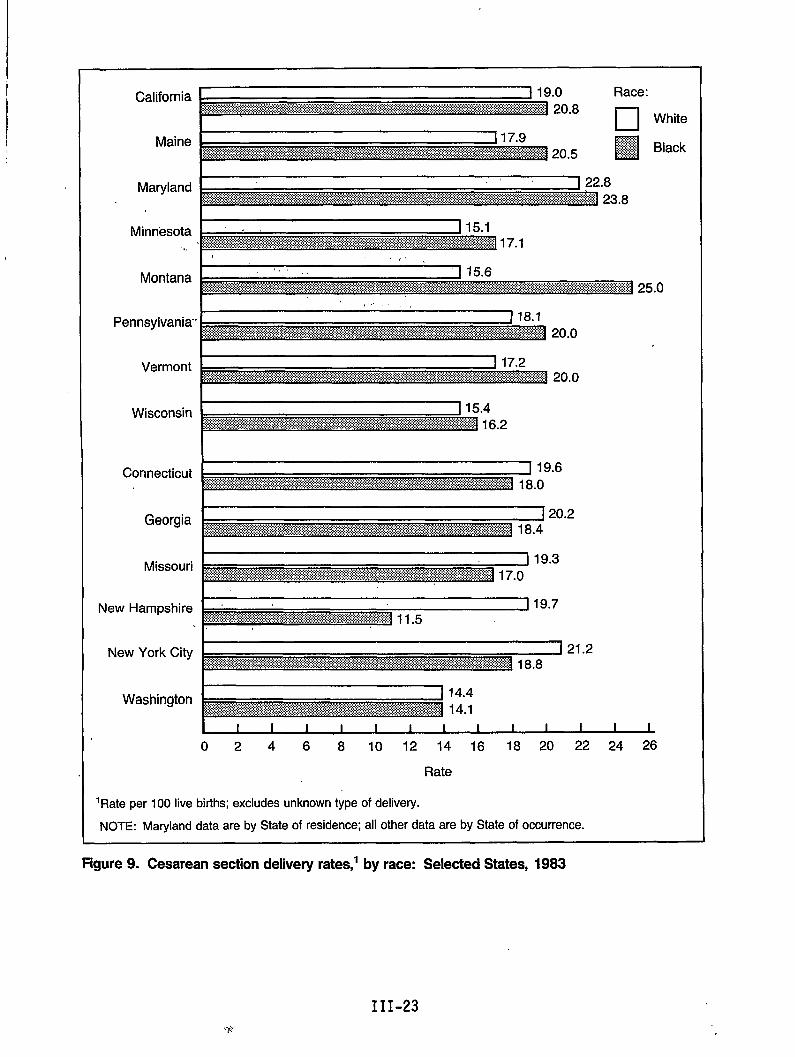
California
Maine
Maryland
Minnesota
Vermont
Wisconsin
Connecticut
Georgia
Missouri
New Hampshire
New York City
Washington
Rate
‘Rate per 100 live births; excludes unknown type of delivery.
NOTE: Ma@and data are by State of residence; all other data are by State of occurrence.
Figure 9. Cesarean section delivery rates; by race: Selected States, 1983
III-23
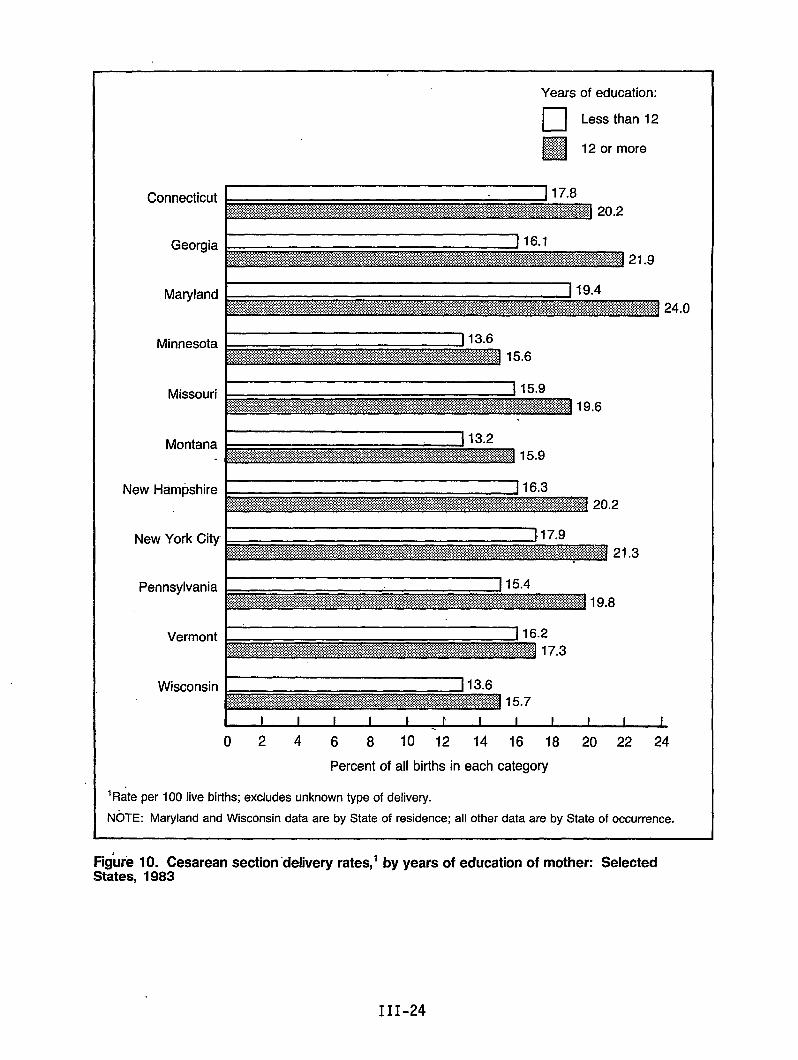
Connecticut
Georgia
Maryland
Minnesota
Missouri
Montana
New Hampshire
Years of education:
❑ Less than 12
❑$j#j#j 12 or more
I
New YorK Wy
Pennsylvania
Vermont
Wisconsin
02468 10 12 14 16 18 20 22 24
Percent of all births in each category
‘Rate per 100 live births; excludes unknown type of delivery.
NOTE: Maryland and Wisconsin data are by State of residence; all other data are by State of occurrence.
Figufe 10. Cesarean section ‘delivery rates,’ by years of education of mother: SelectedStates, 1983
III-24
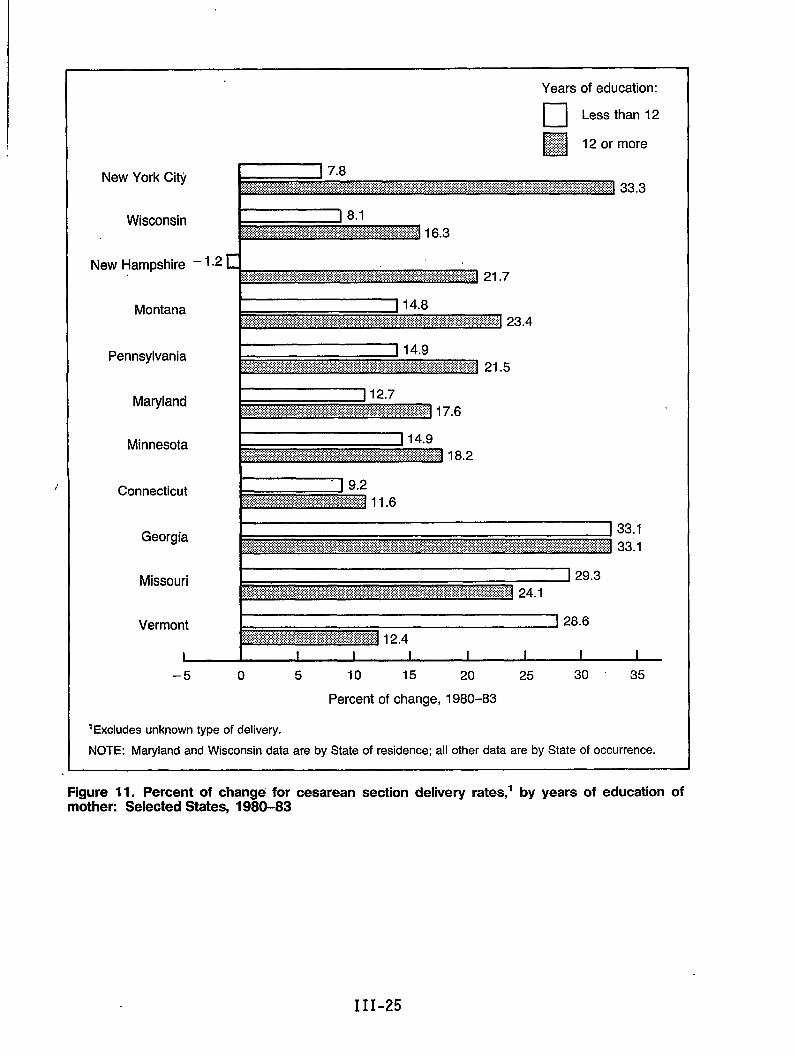
,.
Years of education:
m Less than 12
Georgia
Missouri
Vermorlt I 128.6
I I I I I I 1 I I
–5 o 5 10 15 20 25 30 ‘ 35
Percent of change, 1980–83
IE~~ludes unknown type of delivery.
NOTE: Marylandand Wisconsin data are by State of residence; all other data are by State of occurrence.
Figure 11. Percent of change for cesarean section delivery rates,’ by years of education ofmother: Selected States, 1980-83
III-25
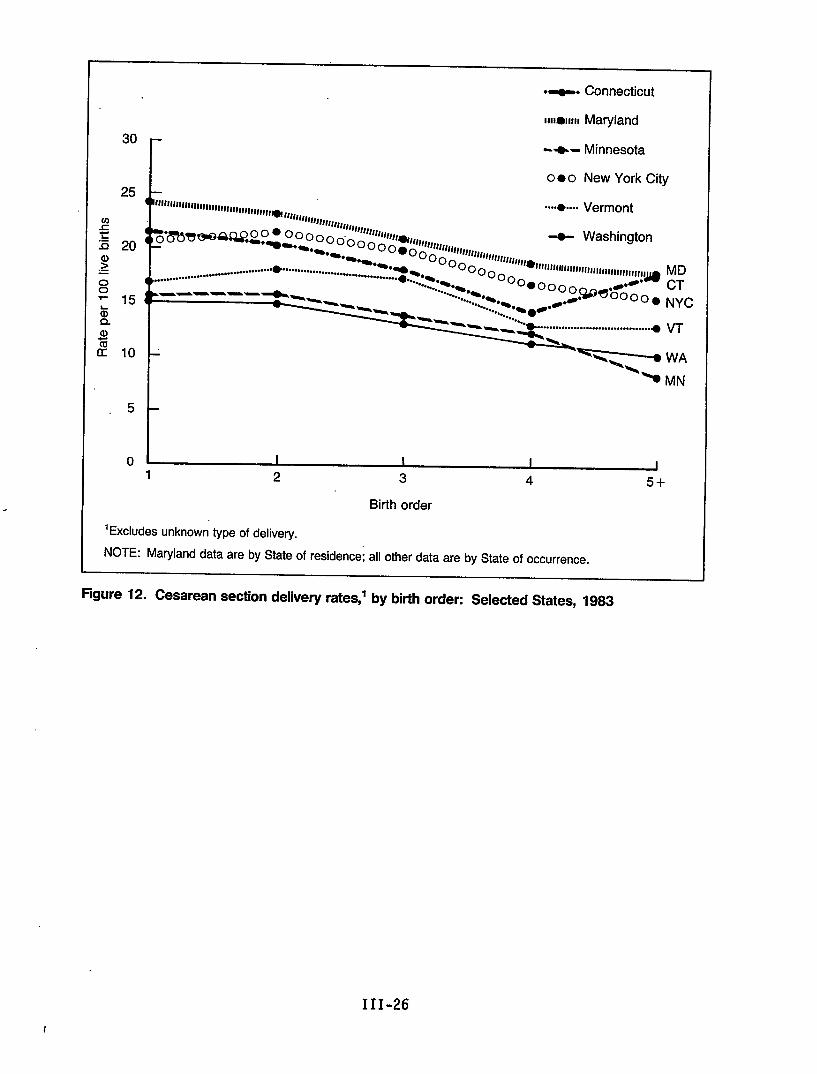
——
5
0
.z. Connecticut
1111011111 Maryland
-+- Minnesota
o ● o New York City
“+.... Vermont“’’’’’’’’’’’’’’’’’’’’’’’’’’’’’’’’’”
-8- Washington
......................................
.--————~”
.....................................g VT
1 I I I
1 2 3 4 5+
Birth order
‘Excludes unknown type of delivery.
NOTE: Maryland data are by State of residence; all other data are by State of occurrence.
Figure 12. Cesarean section delivery rates,’ by birth order: Selected States, 1983
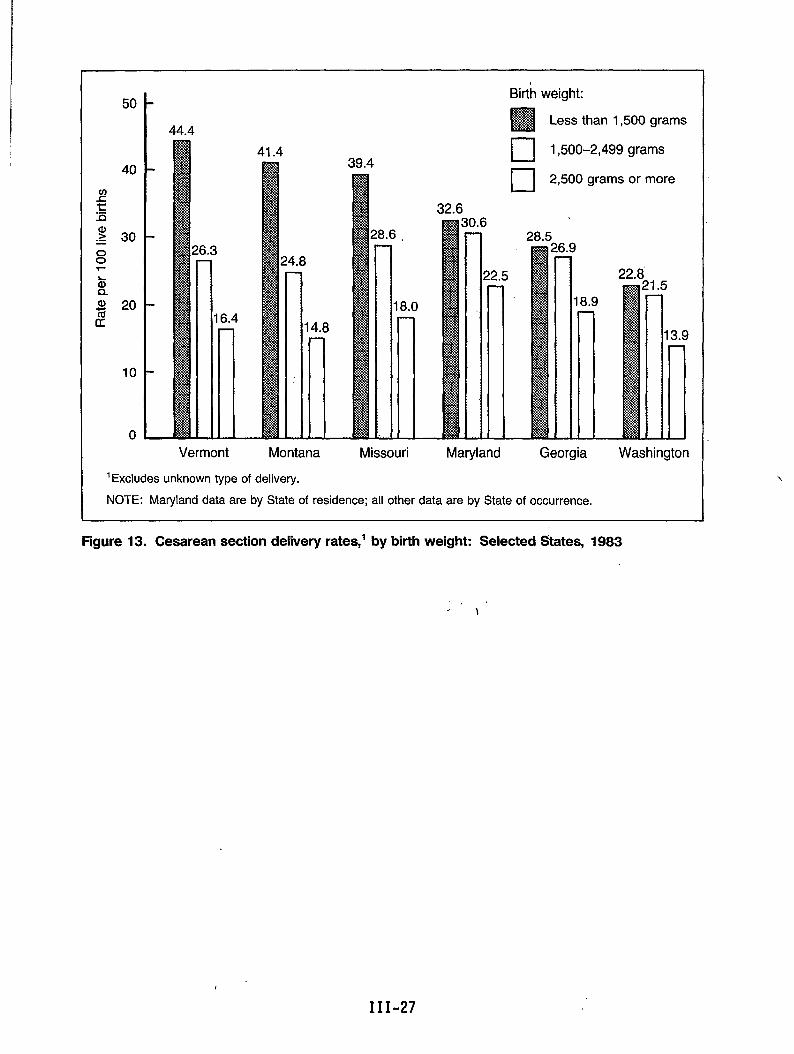
44.4
41.439.4
Birth weight:
H Less than 1,500 grams—u 1,500-2,499grams
[ [ 2,500 grams or more
32.6
28.5
22.8
Vermont Montana Missouri Maryland Georgia Washington
‘Excludes unknown type of delivery.
NOTE: Maryland data are by State of residence; all other data are by State of occurrence.
Figure 13. Cesarean section delivery rates,’ by birth weight: Selected States, 1983
III-27
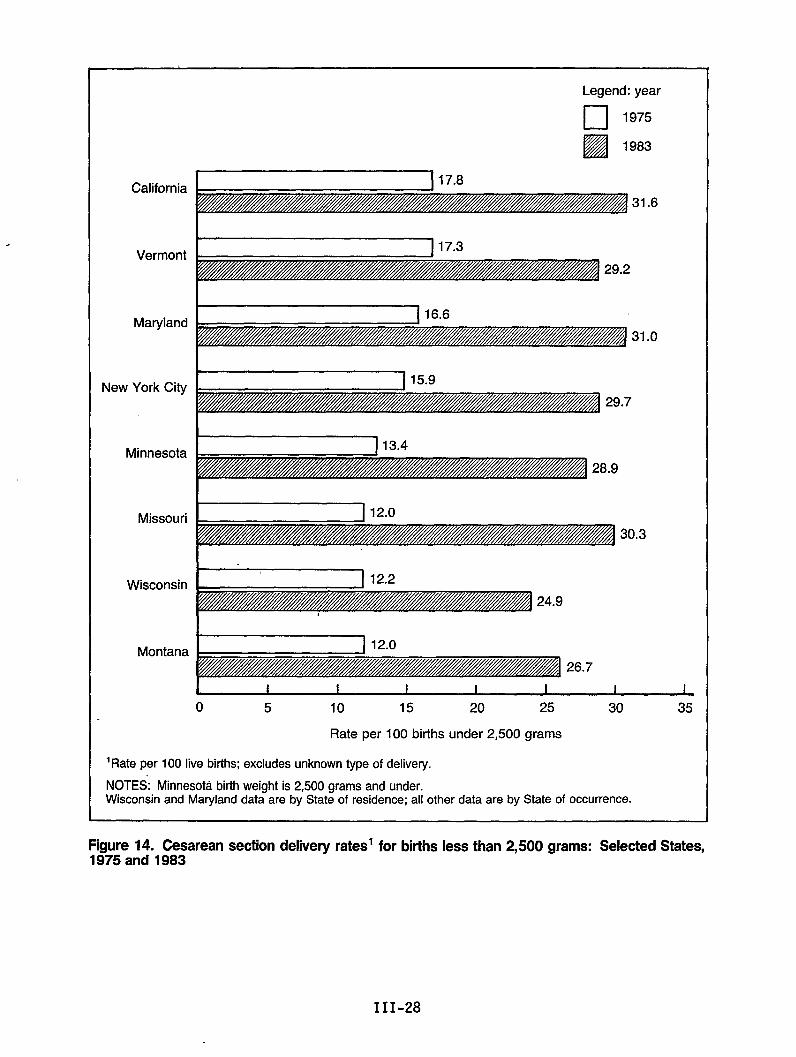
California
Vermont
Maryland
New York City
Minnesota
Missouri
Wisconsin
Montana
Legend: year
El1975
Ezl1983
31.6
29.2
31.0
28.9
I I 12.01
30.3
24.9
Lo 5 10 15 20 25 30
Rate per 100 births under 2,500 grams
‘Rate per 100 live births; excludes unknown type of delivery.
NOTES: Minnesota birth weight is 2,500 grams and under.Wisconsin and Maryland data are by State of residence; all other data are by State of occurrence.
35
I
Figure 14. Cesarean section delivew rates’ for births less than 2.500 arams: Selected States..1575 and 1983
.
III-28
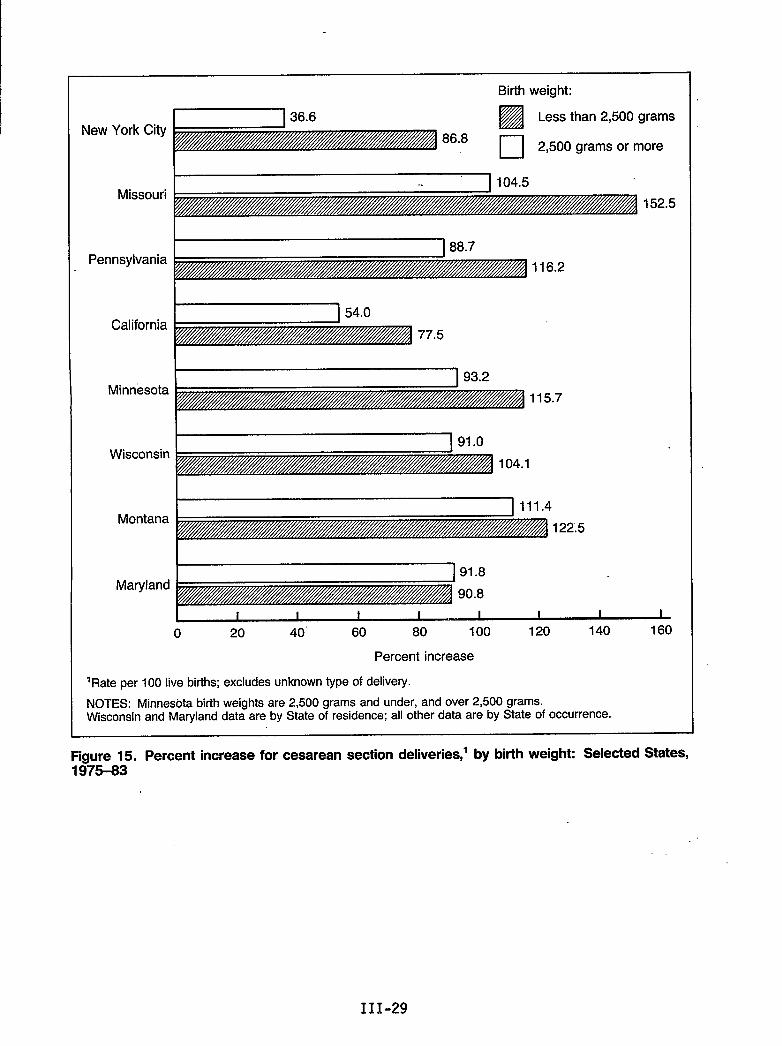
Birth weight:
New York CityEEil
Less than 2,500 grams
86.8❑ 2,500 grams or more
Missouri152.5
Pennsylvania
California
Minnesota115.7
Wisconsin104.1
~ 111.4Montana
122.5
Maryland
I I I I I I I I I
o 20 40” 60 80 100 120 140 160
Percent increase
‘Rate per 100 live births; excludes unknown type of delivery.
NOTES: Minnesota birth weights are 2,500 grams and under, and over 2,500 grams.Wisconsin and Maryland data are by State of residence; all other data are by State of occurrence.
Figure 15. Percent increase for cesarean section deliveries,’ by birth weight: Selected States,197543
111-29
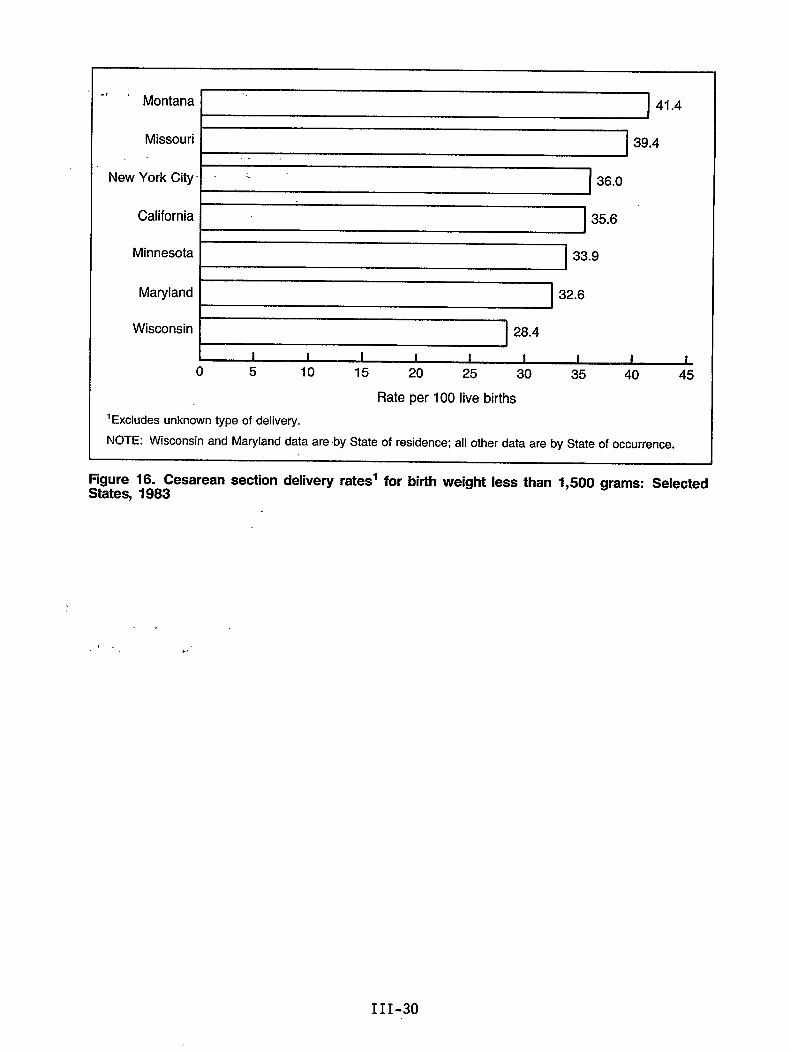
., ;Montana I ‘ I 41.4
I I
Missouri I. .
New York City
California
Minnesota
Maryland
I 39.4I
I I
36.0
35.6
I I 33.9
II
Wisconsin 28.4
1 I I I I I 1 I Io 5 10 15 20 25 30 35 40 45
Rate per 100 live births
‘Excludes unknown type of delivery.
NOTE: Wisconsin and Maryland data are by State of residence; all other data are by State of occurrence.
FigureStates,
16. Cesarean section delivery rates’ for birth weight less than 1,500 grams: Selected1983
. .
,.!, . . ‘
111-30
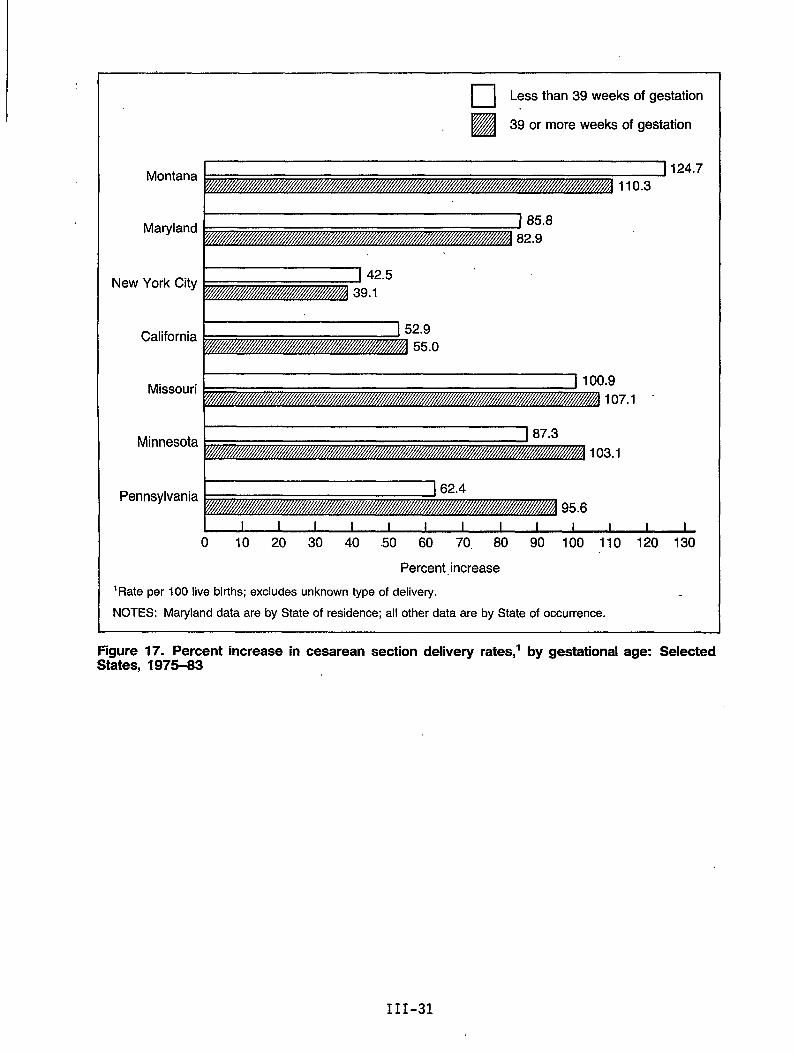
Montana
Maryland
❑ ✎Less than 39 weeks of gestation
H39 or more weeks of gestation
124.7
I New York City
Missouri
Minnesota
California
.9107.1
103.1
Pennsylvania162.4
95.6
1 I I I I I I I I I I I I
o 10 20 30 40 .50 60 70. 80 90 100 110 120 130
Percent increase
‘Rate per 100 live births; excludes unknown type of delivery.
NOTES: Maryland data are by State of residence; all other data are by State of occurrence.
Figure 17. Percent increase in cesarean section delivew rates,’ by gestational age: Selected.St%tes, 1975-83
111-31
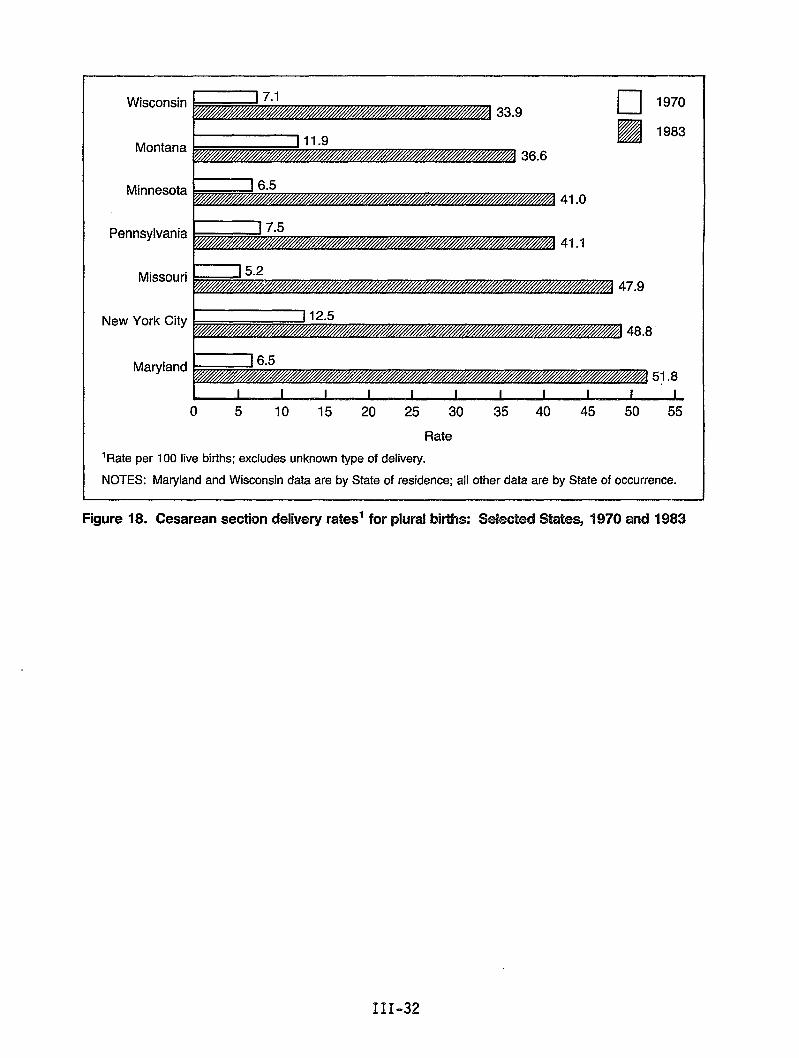
—.Wisconsin
I 7.133.9
Montana J 11.v36.6
❑ 1970
❑ 1983
41.0
41.1
Minnesota
I
Pennsylvania
Missouri 47.9
New York City[ 12.5
48,8
Maryland[ 6.5
0 5 10 15 20 25 30 35 40 45 50 55
Rate
‘Rate per 100 live births; excludes unknown type of delivery.
NOTES: Maryland and Wisconsin data are by State of residence; all other data are by State of occurrence.
Figure 18. Cesarean section delivery rates’ for plural births: %kcted Sates, 1970 and 1983
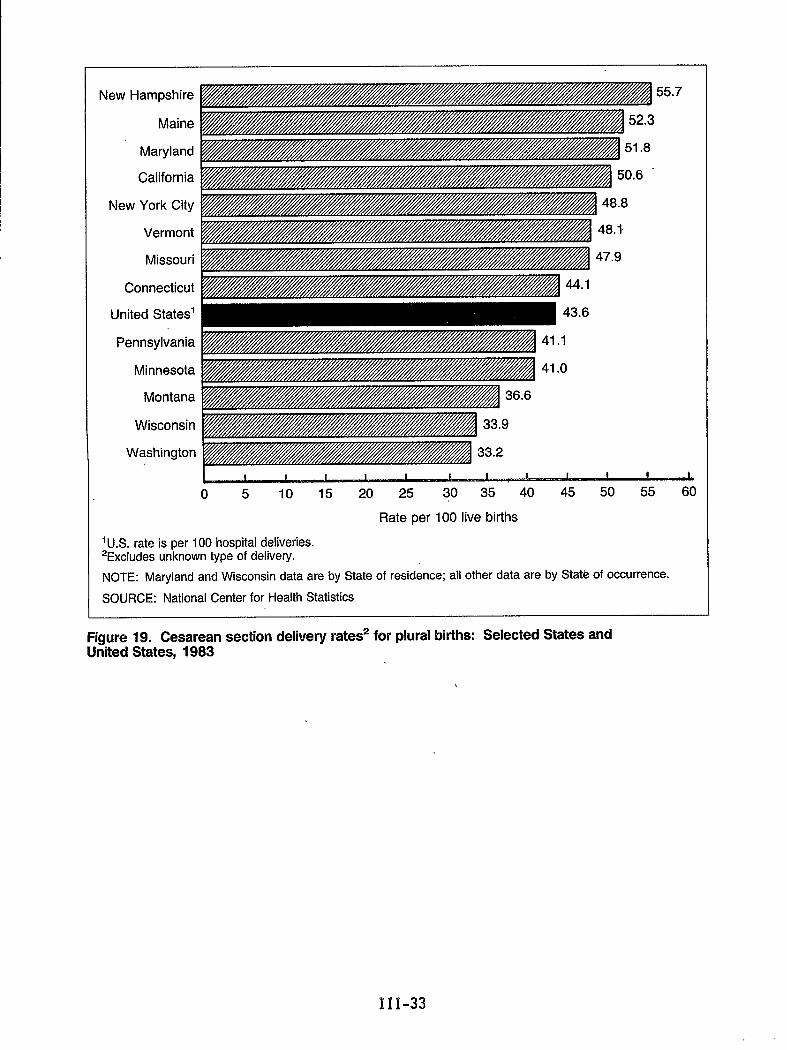
New Hampshire
Maine
Maryland
California
New York City
Vermont
Missouri
Connecticut
United States’
Pennsylvania
Minnesota
Montana
Wisconsin
Washington
O 5 10 15 20 25 30 35 40 45 50 55 60
Rate per 100 live births
‘U S rate is per 100 hospital deliveries.2Exciudes unknown type of delivery.
NOTE: Maryland and Wisconsin data are by State of residence; all other data are by State of occurrence.
SOURCE: National Center for Health Statistics
Figure 19. Cesarean section defivery rates2 for plural births: Selected States andUnited States, 1983
‘III-33
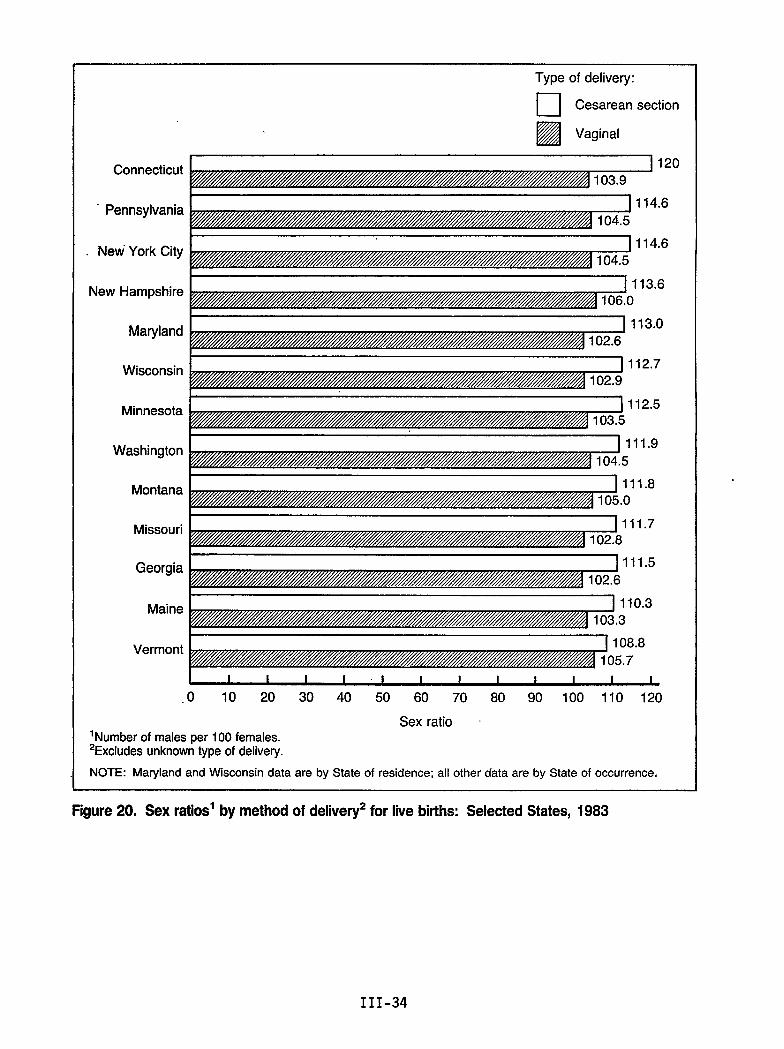
Connecticut
Pennsylvania
New York City
New Hampshire
Maryland
Wisconsin
Minnesota
Washington
Montana
Missouri
Georgia
Maine
Type of delivery:
❑ Cesarean section
EzlVaginal
120
.6
,6
11.5
10.3
VermontJ 108.8105.7
I 1 I I 1 I I 1 I I 1 I 1
.0 10 20 30 40 50 60 70 80 90 100 110 120
Sex ratio ~‘Number of males per 100 females.2Excludes unknown type of delivety.
NOTE: Maryland and Wisconsin data are by State of residence; all other data are by State of occurrence,
Figure20. Sex ratios’ by methodof delivery2for live births: Selected States, 1983
III-34
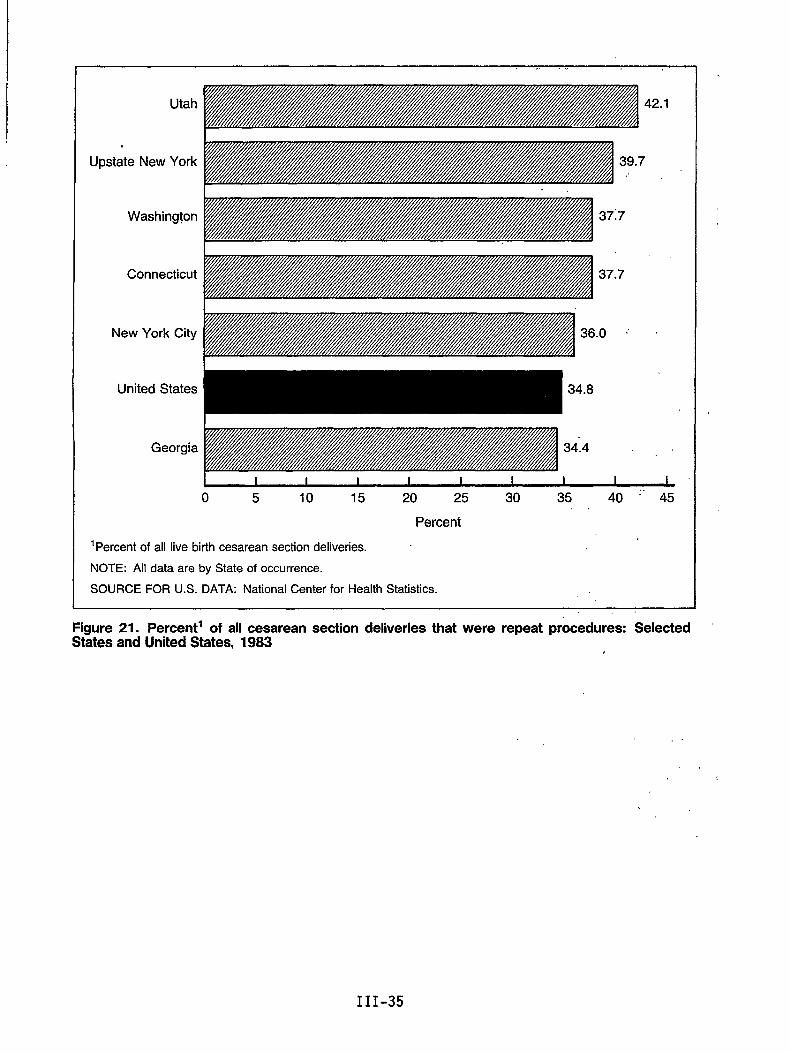
Utah 2.1
Upstate New York
Washington 37:7
.,
Connecticut 37.7
New York City .0 ‘ “
United States
Georgia
o 5 10 15 20 25 30 35 40 ‘“ 45. .
Percent
‘Percent of all live birth cesarean section deliveries.
NOTE: All data are by State of occurrence.
SOURCE FOR U.S. DATA: National Center for Health Statistics.
Figure 21. Percent’ of all cesarean section deliveries that were repeat procedures: SelectedStates andUnited States, 1983
. .
,,
III-35
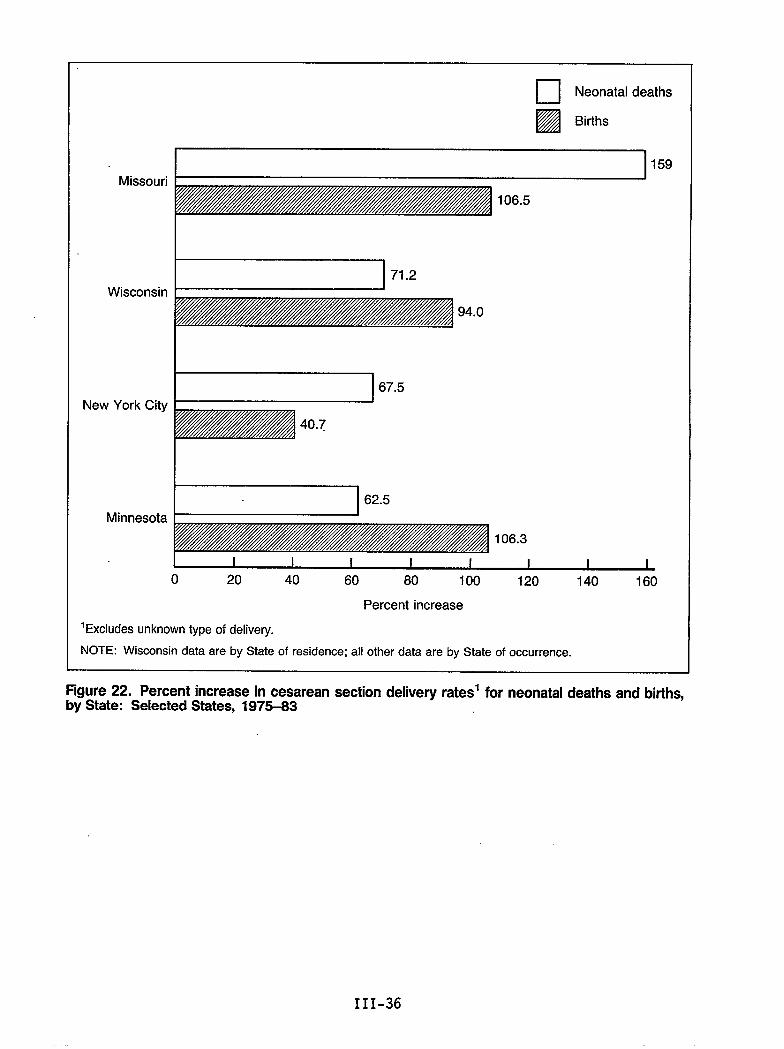
m Neonatal deaths~
I!zaBirths
Missouri
Wisconsin
New York City
Minnesota
‘Excludes
106.5
94.0
67.5
I I I I I I I I I
o 20 40 60 80 100 120 140 160
Percent increase
mknown type of delivery.
59
NOTE: Wisconsin data are by State of residence; all other data are by State of occurrence.
Figure 22. Percent increase in cesarean section delivery rates’ for neonatal deaths and births,by State: Selected States, 1975-33
III-36
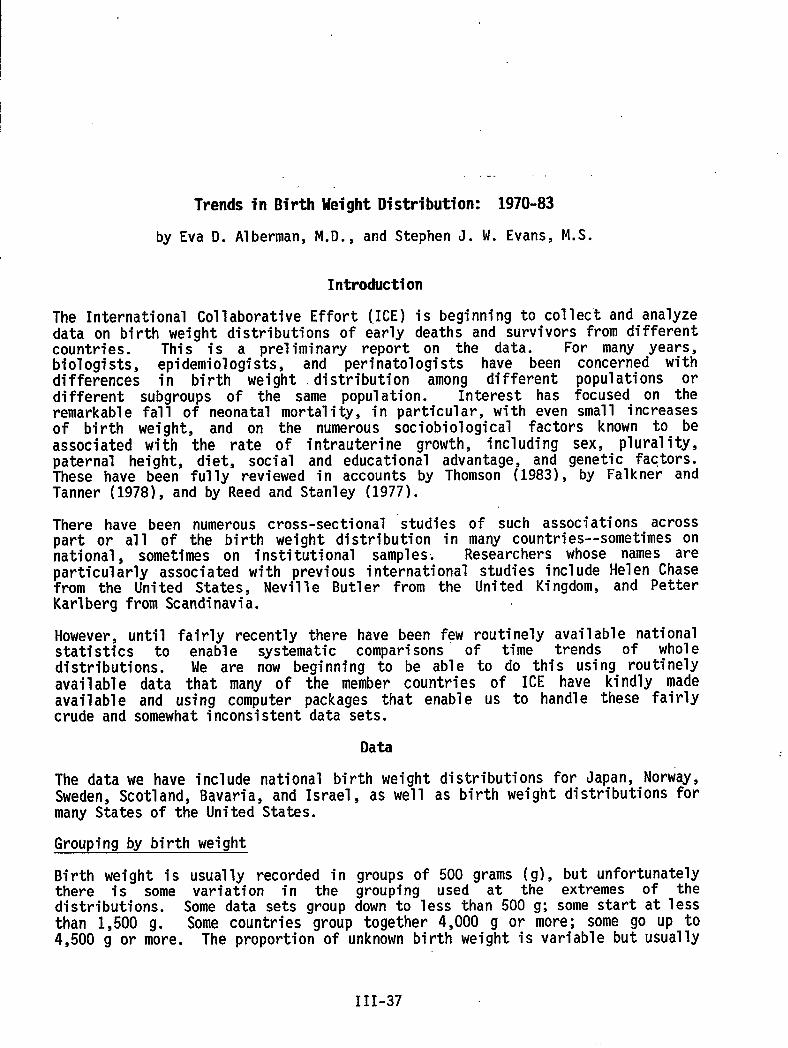
Trendsin BirthUeightDistribution:1970-83
by Eva D. Alberman, M.D., and Stephen J. W. Evans, M.S.
Introduction
The International Collaborative Effort (ICE)is beginning to collect and analyzedata on birth weight distributions of early deaths and survivors from differentcountries. This is a preliminary report on the data. For many years,biologists, epidemiologists, and perinatologists have been concerned withdifferences in birth weight distribution among different populations ordifferent subgroups of the same population. Interest has focused on theremarkable fall of neonatal mortality, in particular, with even small increasesof birth weight, and on the numerous sociobiological factors known to beassociated with the rate of intrauterine growth, including sex, plurality,paternal height, diet, social and educational advantage, and genetic factors.These have been fullY reviewed in accounts by Thomson (1983), by Falkner andTanner (1978), and by Reed and Stanley (1977).
There have been numerous cross-sectional “studies of such associations acrosspart or all of the birth weight distribution in many countries--sometimes onnational, sometimes on institutional samples: Researchers whose names areparticularly associated with previous international studies include Helen Chasefrom the United States, Neville Butler from the United Kingdom, and PetterKarlberg from Scandinavia.
However, until fairly recently there have been few routinely available nationalstatistics to enable systematic comparisons of time trends of wholedistributions. We are now beginning to be able to do this using routinelyavailable data that many of the member countries of ICE have kindly madeavailable and using computer packages that enable us to handle these fairlycrude and somewhat inconsistent data sets.
Data
The data we have include national birth weight distributions for Japan, Norway,Sweden,Scotland,Bavaria,and Israel,as well as birth weight distributions formany States of the United-States.
Grouping by birth weight
Birth weight is usually recorded inthere is some variation in thedistributions. Some data sets !roup
groups of 500 grams (g), but unfortunatelygrouping used at the extremes of thedown to less than 500 g; some start at less
than 1,500 g. Some countries-grouptogether4,000 g or more; some go up to4,500 g or more. The proportion of unknown birth weight is variable but usuallY
III-37

relatively smal1. It is clear from the England and Wales data that babies ofunknown weight include a disproportionate number of neonatal deaths, and theseare often of very low birth weight (Alberman, 1985), so their exclusion canaffect the lower end of the distribution; It is likely that this bias affectsdata from other countries also. “
Birth weights of stillbirths and infant deaths
We have distributions for 1ive births and stil1births, for singletons and al1births, and, for several countries, for eqrly neonatal, late neonatal, andpostneonatal deaths. We know that, for virtually all countries, the validity ofthe lower end of the distributions i’s doubtful because of problems ofdefinitions of viability, but this will have little effect on the overalldistribution.
Moreover, infant mortality rates calculated in the usual way may be misleading,for these rates are based on occurrences in a year rather than on deaths to aspecific birth cohort. Thus, the usual rates presented are the numbers ofinfant, neonatal, and postneonatal deaths occurring in a calendar year dividedby the number of live births occurring in the same calendar year. We have askedour members to present the data by birth cohorts so that the denominators becomethe number of infant, neonatal, or postneonatal deaths of those live births bornin a given calendar year, even if the relevant death occurred in the nextcalendar year. In practice, the rates do not differ from those derived fromcross-sectional data unless there have been sharp changes in the number ofbirths occurring from year to year. Even then, there will be no differences instillbirth rates and minimal differences in neonatal deaths, which are most1ikely to occur in the same calendar year as the year of birth, except forbirths in late December. The major differences will be found in postneonataldeath rates. However, data presentation by cohorts wil1 avoid possiblyartifactual differences among years or among countries where there have beenmarked variations in birth rate.
Multiple births
For our analyses, we have also asked for multiple-birth data to be presentedseparately, because differences in multiple-birth rates over the years or amongcountries could account for considerable changes in the lower end of the birthweight distribution.
Results
Only”a few examples of the results of the preliminary processing of some ofthese data are presented, showing some of the features that we think are themost interesting. First; the method gives us an ability to demonstrate howremarkably robust are these data. Smooth curves have been drawn by cubic splineinterpolation through.the actual data points, and figure 1 shows the smoothedcurve of the birth weight distribution of singleton live-birth deliveries inJapan and Norway in 1981, the former representing 1.5 million, the latter about50,000 births. In figure 2, there is what appears to be virtually the samecurve for Japan, but it is in fact all the curves fQr each year from 1973through 1983 superimposed on each other. Figure 3 gives the superimposition ofall Norwegian curves from 1973 through 1982. It would be difficult to find a
III-38
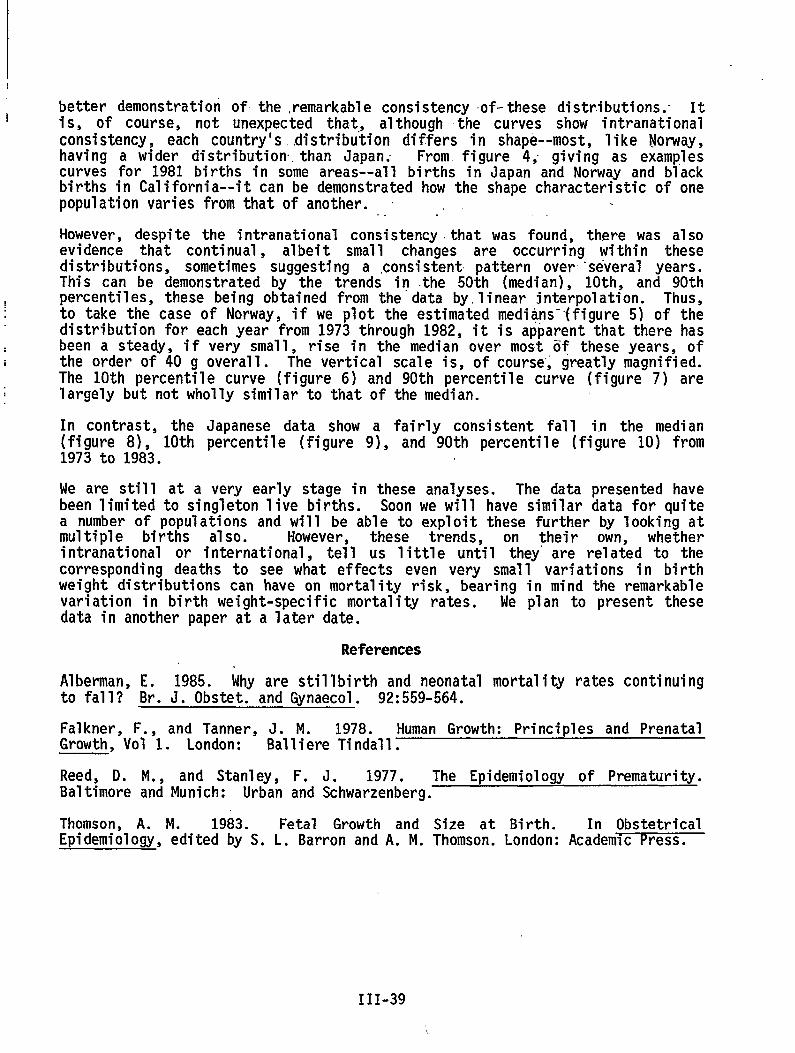
Ibetter demonstration of-the ,remarkableconsistency of-these distributions.- It
i is, of course, not unexpected that,, although the curves show intranationalconsistency, each country’s,,distributiondiffers in shape--most, like Norway,having a wider distribution-than Japan; From, figure 4; giving as examplescurves for 1981 births in some areas--all births in Japan and Norway and blackbirths in California--it can be demonstrated how the shape characteristic of onepopulation varies from that of another. “ .
However, despite the intranational consistencythat was found, there was alsoevidence that continual, albeit small changes are occurring within thesedistributions, sometimes suggesting a consistent pattern over-”several years.This can be demonstrated by the trends in the 50th (median), 10th, and 90thpercentiles, these being obtained from the data by.linear interpolation. Thus,to take the case of Norway, if we plot the estimated medians-ffigure 5) of thedistribution for each year from 1973 through 1982, it is apparent that there hasbeen a steady, if very small, rise in the median over most iifthese years, ofthe order of 40 g overal1. The vertical scale is, of course; greatly magnified.The 10th percentile curve (figure 6) and 90th percentile curve (figure 7) arelargely but not wholly similar to that of the median.
In contrast, the Japanese data show a fairly consistent fall in the median(figure 8), 10th percentile (figure 9), and 90th percentile (figure 10) from1973 to 1983.
We are still at a very early stage in these analyses. The data presented havebeen 1imited to singleton 1ive births. Soon we wil1 have similar data for quitea number of populations and will be able to exploit these further by looking atmultiple births also. However, these trends, on their own, whetherintranational or international, tell us little until they”are related to thecorresponding deaths to see what effects even very small variations in birthweight distributions can have on mortality risk, bearing in mind the remarkablevariation in birth weight-specific mortality rates. We plan to present thesedata in another paper at a 1ater date.
References
Alberman, E. 1985. Why are stillbirth and neonatal mortality rates continuingto fall? Br. J. Obstet. and Gynaecol. 92:559-564.
Falkner, F., and Tanner, J. M. 1978. Human Growth: Principles and PrenatalGrowth, Vol 1. London: Balliere Tindall.
Reed, D. M., and Stanley, F. J. 1977. The Epidemiology of Prematurity.Baltimore and Munich: Urban and Schwarzenberg.
Thomson, A. M. 1983. Fetal Growth and Size at Birth. In ObstetricalEpidemiology, edited by S. L. Barron and A. M. Thomson. London: Academic Press.
III-39
Hl-lu
50
40
20
10
0
Japan,--,
,’ R,,/ \8,t *t
It tst‘8 * Norway/ ‘t- -\
t’ /1,
: / t, ‘\: /; \/ t
// “ \I
r:/ /’
1’t’ //
t’:
: /’:)’ /’
I*It //t’
,t’//,/ /t ,/,,’
.“’ / /.-9-= -. —.——— .—-w’=’=---
“\\\\\
\\
\
0 500 1,000 1,500 2,000 2,500 3,000 3,500 4,000 4,500 5,000
Birth weight in grams
Rgure 1. Percent of singleton live births, by birth weight: Japan and Norway, 1981
. ——
l-lb-lH
-L
al
40
30
20
10
00 500 1,000 1,500 2,000 2,500 3,000 3,500 4,000 4,500
Birth weight in grams
Figure2. Percent ofsingleton live births, by birth weight: Japan, 1973-83
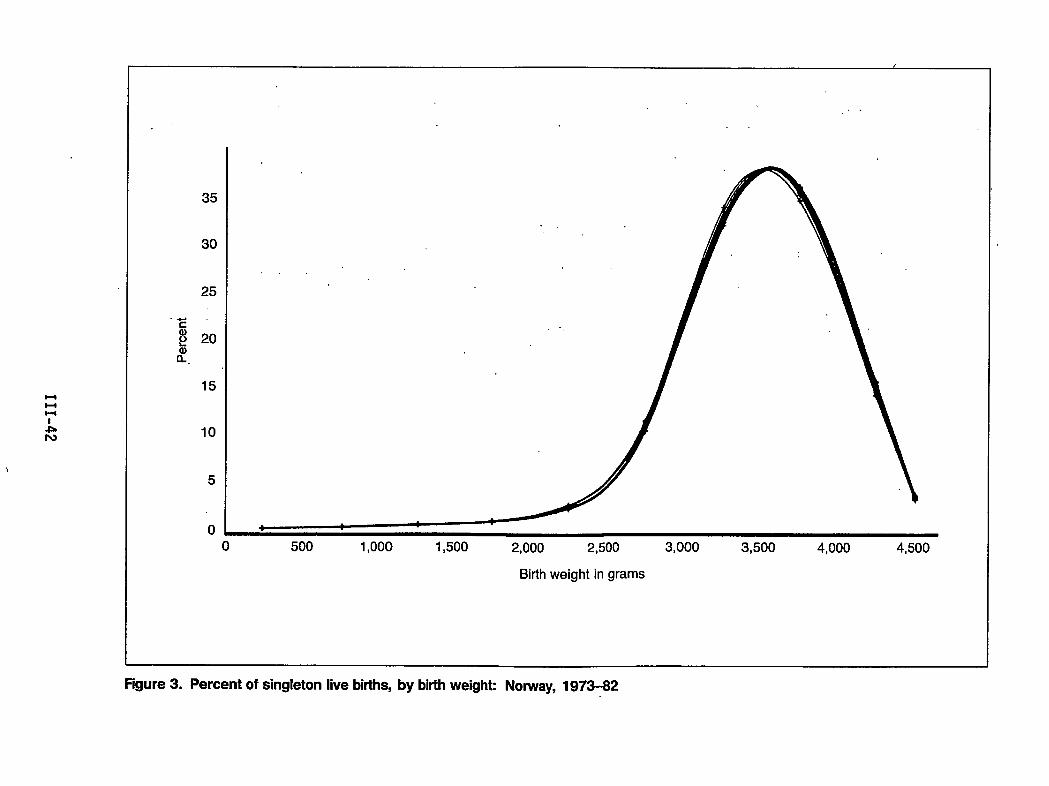
uul-l
.LIv
35
30
25
,4-.
c
g 20
8?.
15
10
5
0
,/.
-,
0 500 1,000 1,500 2,000 2,500 3,000 3,500 4,000 4,500
Birth weight in grams
Figure 3. Percent of singleton live births, by birth weighk Norway, 1973-82
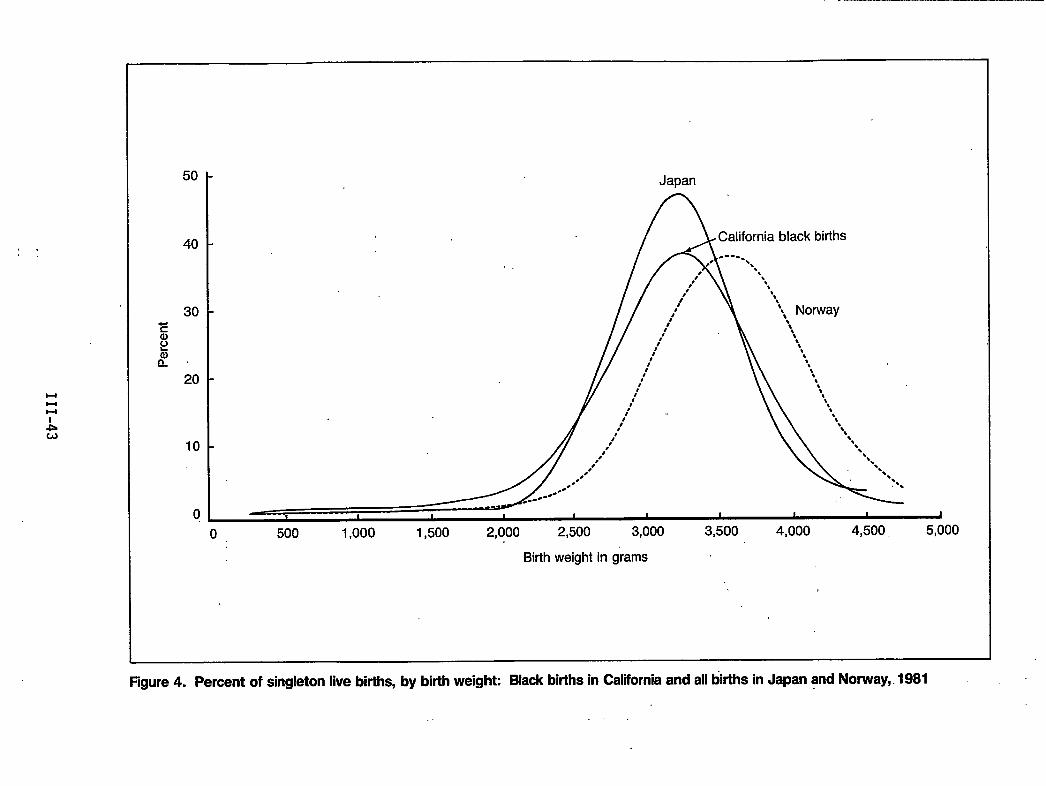
,=,.
HHu
50
40
30
20
10
0
Japan
ACalifornia black births-----,* ●.
0 ‘.,,’ ‘\
,8 \,t ‘s,
48 ‘t, Norway
B 1 1 1 1 1 1 I
o 500 1,000 1,500 2,000 2,500 3,000 3,500 4,000 4,500, 5,000
Birth weight in grams
figure 4. Percent of singleton live births, by birth weight Black births in California and all ~rths in Japan and Norway,. 1981
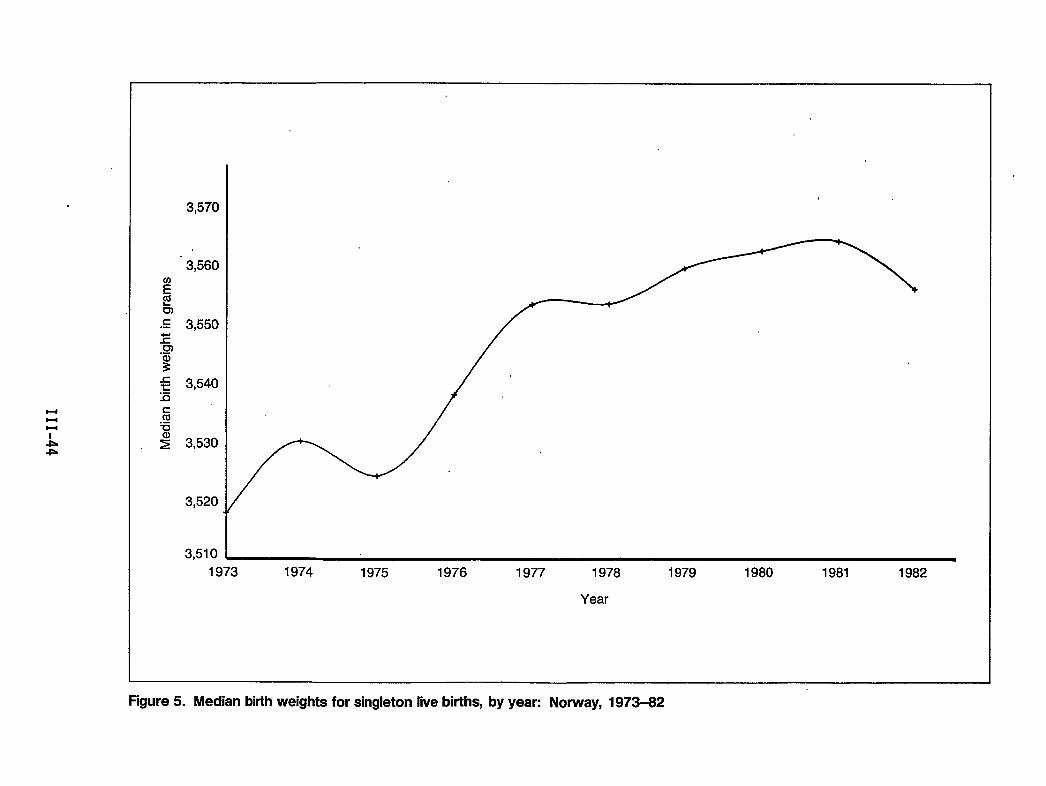
HHl-l
-lb*
c.-
3,570
3,560
3,550
3,540
3,530
3,520
3,5101973 1974 1975 1976 1977 1978 1979 1980 1981 1982
Year
Figure 5. Median birth weights for singleton live births, by year: Norway, 1973-82
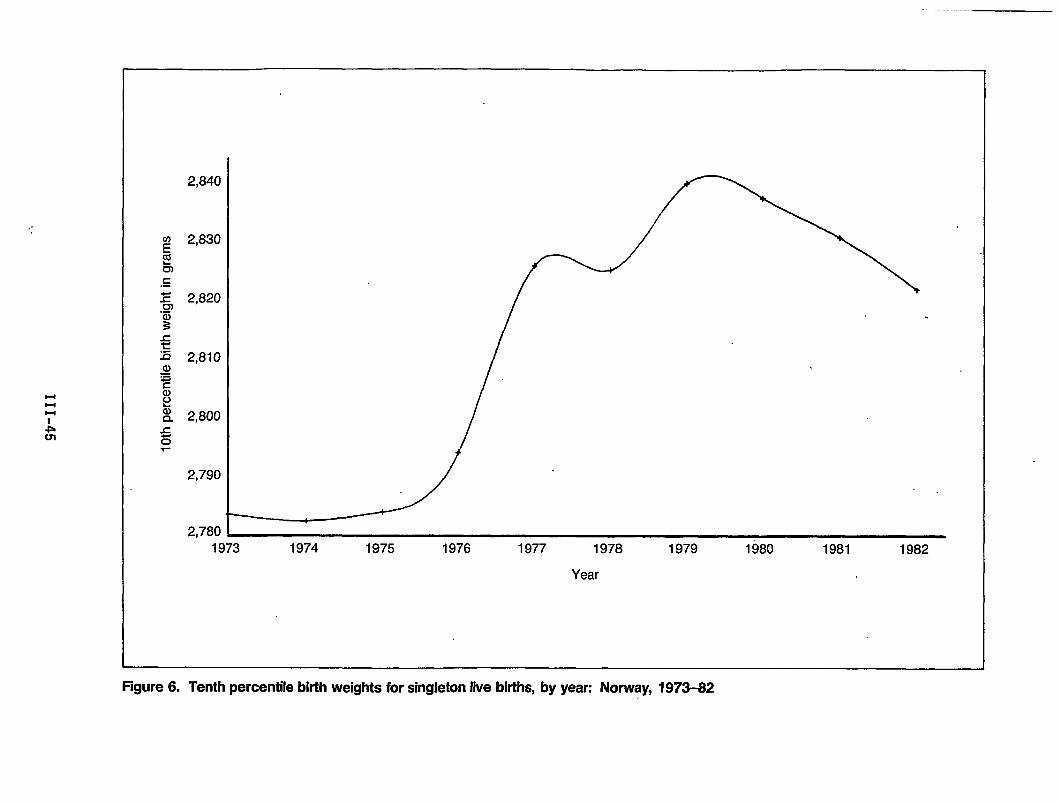
t-ll-lH
Am
2,840
2,830
2,820
2,810
2,800
2,780 ~1973 1974 1975 1976 1977 1978 1979 1980 1981 1982
Year
Figure 6. Tenth percentile birth weights for singleton live births, by year: Norway, 1973-62
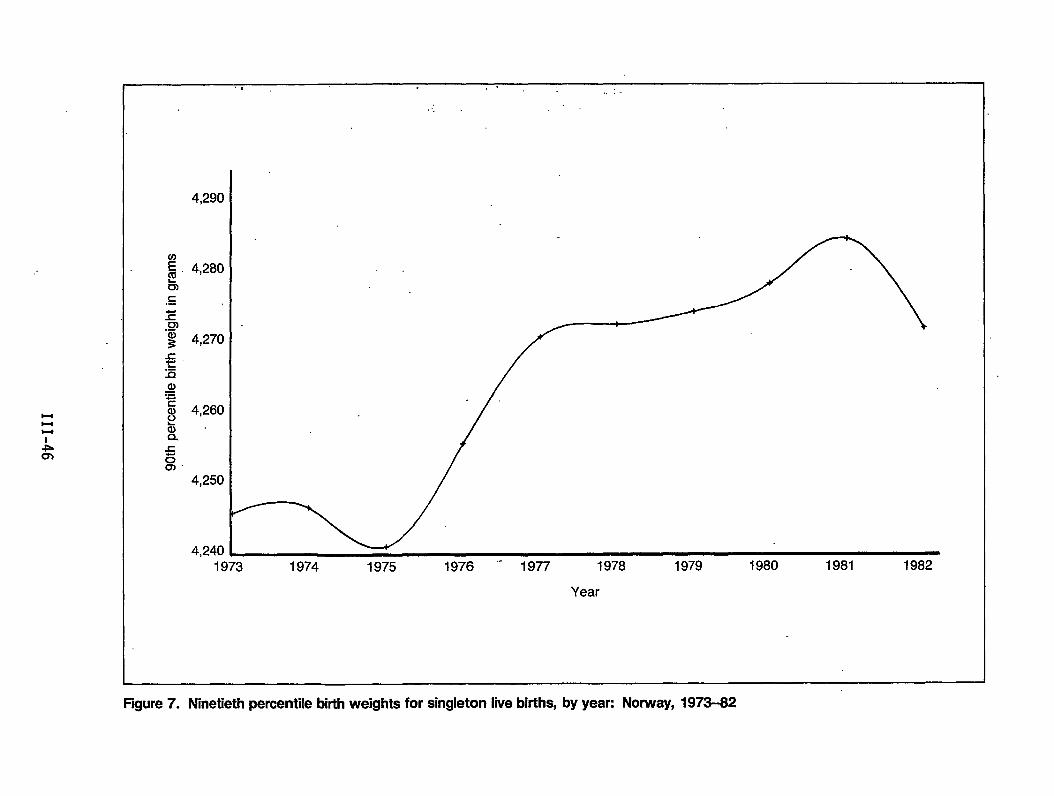
,.. ,.
1973 1974 1975 1976 ‘“ 1977 1978 1979 1980 1981 1982
Year
Figure 7. Ninetieth percentile birth weights for singleton live births, by yean Norway, 1973-82
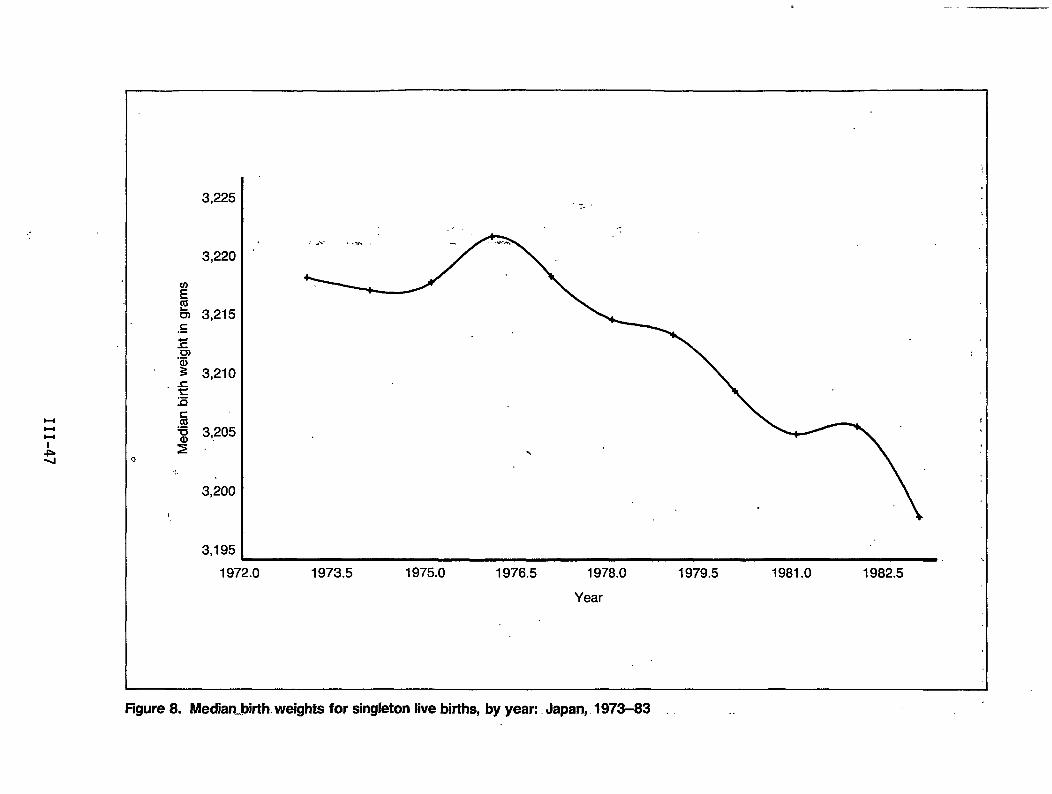
-..
..
$-4u
-k-1
.:,
,
3,225
3,220
3,215
3,210
3,205
3,200
3,195
..-..-
...,’
,,,.. .... .% .
1972.0 1973.5 1975.0 1976.5 1978.0 1979.5 1981.0 1982.5
Year
Figure 8. Median.bkth. weights for singleton live births, by year:. Japan, 1973-83
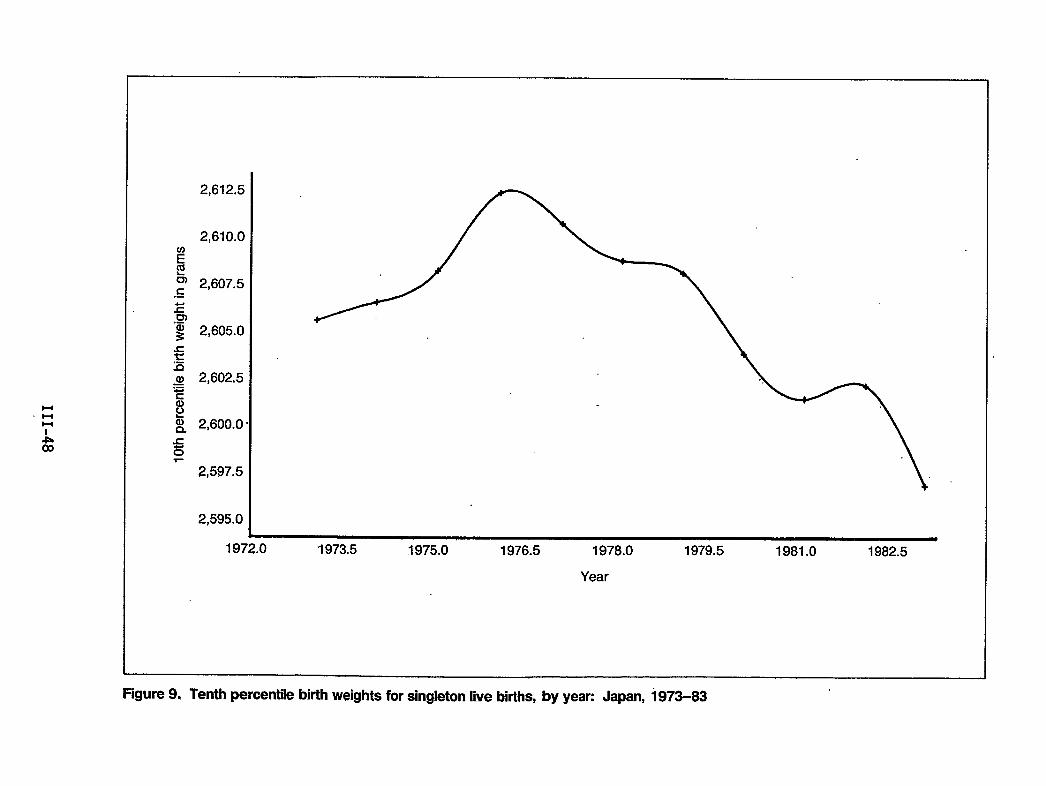
2,612.5
2,610.0
2,607.5
2,605.0
2,602,5
2,600.0
2,597.5
2,595.0
1972.0 1973.5 1975.0 1976.5 1978.0 1979.5 1981.0 1982.5
Year
Figure 9. Tenth percentile birth weights for singleton live births, by yean Japan, 1973-83
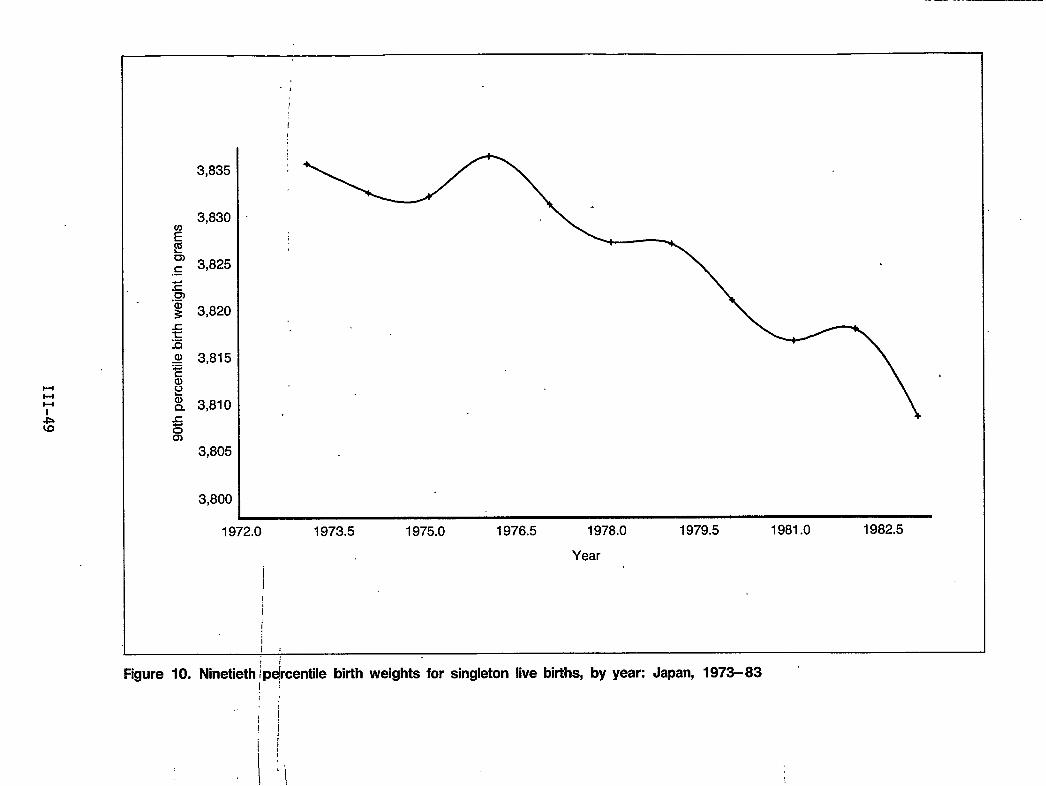
l-ll-ll-l
.,
1
1
3,835 ~
3,830 ‘
3,825
3,820
3,815
3,810
3,805
3,800●
1972.0 1973.5 1975.0 1976.5 1978.0 1979.5 1981.0 1982,5
Year
I
iI
,,Figure 10. Ninetieth /pPtile birth weights for singleton live births, by year: Japan, 1973-83
jIii1
1’ ‘\
Trends in Birth Weight-Specific Perinatal Hortality Rates: 1970-83
by Howard J. Hoffman, M.A., Per Bergsj@, M.D., and Daniel W. Denman III, M.A.
In the past two decades, perinatal and infant mortality rates have fallensteadily (National Center for Health Statistics, 1972; Kleinman et al., 1978;Bakketeig, Hoffman, and Oakley, 1984). Much of the explanation for this fallmay lie in the improvements made in the provision of medical care to high-risklow birth weight and very low birth weight infants. Such a claim seemswarranted for neonatal mortality, one of the two constituents of perinatalmortality (Lee et al., 1980; Williams and Chen, 1982). However, the othercomponent of perinatal mortality--fetal mortality--more likely has shown greaterimprovements for normal or high birth weight infants (Hoffman, Meirik, andBakketeig, 1984). When taken together, a nearly uniform improvement in birthweight-specific perinatal mortality rates has occurred over this time period inthe United States. The data presented in this report are used to compare therecent. improvements in perinatal. mortality rates in the United States andselected foreign countries during the past decade and a half, 1970-83.
Study Materials
Data for this study were provided by U.S. States and foreign countriesparticipatingin the InternationalCol1aborativeEfforton Perinataland InfantMortality, which is sponsored by the U.S. Public Health Service under theleadership of the International Statistics Staff, Office of Plannin9 andExtramural Programs, National Center for Health Statistics. Wherever possible,data on infant deaths were based on birth cohort year rather than year ofoccurrence. The basic data tables provided by participating States or countriesincluded live births, late fetal deaths (28 weeks and over), and infant deaths(under 1 week, 1-4 weeks, 4 weeks-1 year) by race and 500-gram birth weightcategories. Tables were provided separately for singleton and all births. Inthis report, the analysis is restricted to perinatal mortality rates (late fetaldeaths plus early neonatal deaths occurring during the first week of 1ife). Datain the tables include rates for1983 if available.However, for ease ofpresentation, the birth weight-specific perinatal mortality rates over time havebeen collapsed into four consecutive 3-year time periods, with data for 1970 and1983 deleted.
Time Trends
U.S. perinatal mortality rates by race (black and white) for 14 years are shownin figure 1. These data are derived from five States--California, Michigan,Missouri, Upstate New York, and North Carolina--which represent approximatelyone-fifth of the total number of births in the United States each year. Incomparison with perinatal mortality rate data from the total United States,these five States are consistently lower than average. They have a perinatal
111-51

. ...-..
. .
mortality rate about 10 percent lower than the rate for the total United Statesduring this time period.
During the 14-year period, the perinatal mortality rates (PMR’s) have beenreduced by almost one-half, regardless of race. on a standard scale, the blackPMR has fal1en somewhat more rapidly than the white PMR (see figure 1).However, in the relative sense of a logarithmic scale, the two races have nearlyidentical rates of change. The lower two lines in the figure (for black andwhite separately) represent late fetal mortality rates (FMR’s) for death of 28 .weeks gestation or more. The late FMR’s have not declined as rapidly as thePMR’s. By implication, the early neonatal mortality rates have contributed moreto the decline in the overal1 PMR during the past decade. Thus in 1983, bothblack and white 1ate fetal mortality rates were approximately 50 percent of the1970 level. However, early neonatal mortality rates in 1983 had declined toapproximately.,38percent of the 1970 level for both black and white U.S. births.
The PMR time trends shown for black births in each of the five States in table 1are generally similar. North Carolina and Upstate New York had consistentlyhigher black PMR’s during this time period than did California, Michigan, orMissouri. No one State was consistently better (lower PMR) throughout this timeperiod; however, North Carolina was ranked highest most years, with especiallymarked differences in the first 6 years of the time period. The PMR time trendsshown in table 2 for white births in these same five States indicate that NorthCarolina had consistently higher perinatal mortality than the other States and,. also, that Michigan had the lowest perinatal mortality rates for white births inmost years.
Time trends in perinatal mortality rates”in the six <countries participating inthe International Collaborative Effort on Perinatal and Infant Mortality areshown in table 3. In some countries, for example, England and Wales and Israel,birth weight-specific data are available only in the more recent years, since1979 and 1977, respectively. The perinatal mortality rate for Sweden isconsiderably lower than that for the remaining countries during this timeperiod. Japan and Norway have very similar PMR’s throughout this time period(see figure 2). Norway was S1ightly 1ower during most of the time period, butJapan caught up with Norway in 1982. Because infant mortality rates for Japanare similar to or lower than rates for Sweden in recent years (Wegman, 1985),this coincidence of the Japanese and Norwegian PMR’s is surprising. Thedifference is accounted for by the relatively 1arger number of 1ate fetal deathsin Japan than in Sweden. England and Wales and Scotland have quite similarPMR’s, as shown in table 3. Based on a review of earlier data for England andWales, it is clear that the convergence in PMR’s between England and Wales andScotland during this 7-year period (1973-79] results from a relative improvementin the Scottish PMR (Bakketeig,Hoffman, and Oakley, 1984).
Birth Ueight-Sp@fic IJerinatalUortality Rates
In order to compare improvements in birth weight-specific perinatal mortalityover the time period in which these international data were compiled, it wasdecided to combine the data in 3-year intervals, i.e., 1971-73, 1974-76, 1977-79, and 1980-82. The following tables and figures are all based on these fourtime periods.
.
III-52
Tables 4 and 5 provide birth weight-specific perinatal,mortality rates for allsingleton black and white births in the five U.S. States. These data are alsoshown graphically in figures 3 and 4. In the figures, perinatal mortality ratesare plotted on a logit (symmetrical logarithmic) scale in order that relativechanges in the PMR’s can be assessed more ap ropriately (Hoffman, Meirik, aqdBakketeig, 1984). From figure 3, !’it is c ear that birth weight-specificmortality rates for black births have improved (are lower) in each of thesuccessive time periods. The improvement is especially clear from the earliest(1971-73) to the most recent time period (1980-82). Also, the improvements haveoccurred throughout the entire range of birth weights, from small births,weighing 500-1,500 grams to the largest births, weighing more than 4,000 gramsat delivery.
The time trend comparisons for U.S. white births, shown in figure’4, aresimilar, although the improvements are less marked for births weighingapproximately 2,500 grams at birth. “These infants are frequently growth retardedin utero (small for gestational age). Births that are growth retarded in uteroare at an increased risk for fetal mortality compared with early neonatalmortality (McIlwaine et’ al., 1979). As noted previously, fetal mortalitydeclined more slowly than early neonatal mortality during this time period.
Comparisons in birth weight-specific perinatal mortality rates over time areshown in tables 6-8 and figures 5-7 for Japan, Norway, and Sweden. The birthweight-specific PMR comparisons for Japan indicate that the greatest relativeimprovement has occurred in the normal birth weight range, 2,500 grams or more.In Norway, the 1argest and steadiest improvement over time in birth weight-specific PMR’s has occurred in the low birth weight range and, especially, inthe very low birth weight range, less than 1,500 grams. This same pattern isevident also in Sweden. These different patterns in the relative improvement inbirth weight-specific PMR’s in Japan versus Norway and Sweden reflect the factthat late fetal mortality rates have improved relatively more in Japan whileearly neonatal mortality rates have improved relatively more in Scandinaviaddring this time period.
In table 9, a summary of the birth weight-specific perinatal mortality rates isprovided for the most recent time period, 1980-82, for Japan and Norway and forU.S. black and white births (five States). For this time period, the data arealso shown graphically in figure 8. Striking differences in birth weight-specific perinatal mortality are evident for these four different racial ornational population groups. For example, the perinatal mortality rate for verylow birth weight infants is highest for Japan, followed in succession by Norway,then U.S. white births and, finally, U.S. black birttis.Such apparent paradoxeshave been noted before (North and MacDonald, 1977; Erickson and Bjerkedal, 1982;Wilcox and Russel1, 1983a and 1983b; Hoffman, Meirik and Bakketeig, 1984).
The explanation offered to account for most of this effect is that theunderlying birth weight distributions for each of the different racial ornational population groups are also markedly different. Table 10 and figure 9document these differences by providing the cumulative birth weightdistributions for the same racial or national groups as shown in table 9 andfigure 8. The United States has the highest proportion of 1ow weight births (andthe proportion is especially high for black births); Japan and Norway have thefewest such births. Thus, interracial or international comparisons of birth
III-53..+-
weight-specific perinatal mortality rates without attention to differences inthe underlying birth weight distribution can be quite misleading.
Within the field of perinatal epidemiology it is well known that twin birthshave a lower perinatal mortality rate at 37-38 weeks gestation than singletonbirths have (Hoffman and”Bakketeig, 1984). Similar results are documented in thedata provided for the International Collaborative Effort on Perinatal and InfantMortality. The majority of twin births are delivered S1ightly before term, andthese infants are not at the same risk of dying in the perinatal period as arecomparable birth weight and gestational age singleton births, which, for totallydifferent reasons, may-be delivered preterm. Similarly, the larger number ofU.S. black or white births of low birth weight, as compared with either Japaneseor Norwegian births, do not experience the same high perinatal mortality atthese low birth weights.
Conclusion‘,.,
The causes’’of~lowbirth weight’delivery among U.S. black or white births may bequite different from the causes of low birth weight in either Japan or Norway.An investigation of cause-specific mortality, including changes over time incause-sp”ecific mortality rates, will bq necessary to answer many of thequestions raised by the inspection of the data contained in this report.However, the preparation of comparably defined data sets, both across States andacross countries, -is a prerequisite to any more detailed inquiry into theunderlying basis for differences. In this sense, the International CollaborativeEffort on Perinatal and Infant Mortality has provided a strong stimulus forjoint research undertakings in the maternal and child health field.
Several ‘important questions could not be addressed with the data that wereprovided by participating States and countries. The inability to examine causeof death is one example. Another limitation was the .lack’of gestational ageinformation, which is required in order to properly distinguish growth-retardedsmall babies from preterm small babies. The importance of this distinction hasbeen stressed in both clinical and public health terms (Philip et al., 1981;David and Siegel, 1983). However, future studies wil1 be able to supply theneeded information in this area, particularly for the years 1980 and beyond.
References
Bakketeig;:~L.S., Hoffman, H. J., and Oakley, A. T. 1984. Perinatal Mortality.In Perinatal Epidemiology, edited by M. B. Bracken. New- York: OxfordUniversity Press.
David, R. J., and Siegel, E. 1983. Decline in neonatal mortality, 1968 to1977, Better babies or better care? Pediatrics. 72:531-540.
Erickson, J. D., and Bjerkedal, T. 1982. Fetal and infant mortality in Norwayand the United States. JAMA 247:987-991.
Hoffman, H. J., and Bakketeig, L. S. 1984. Risk factors associated with theoccurrence of preterm birth. Clin. Obstet. Gynecol. 27:539-552.
III-54
Hoffman, H. J., Meirik. O. and Bakketeia. L. S. 1984. ,Methodoloqicalconsiderations in the Analysis of Perinat~j Mortality Rates. In Peri~atalEpidemiology, edited by M. B. Bracken. New York: Oxford University Press. pp:91-530.
.,
Kleinman, J. C., Kovar, M. G., Feldman, J. J., .et al. 1978. A compar.~mon~f ..1960 and 1973-1974 early neonatal mortality in selected states. . ..Epidemiol. 108:454-469. ..
,-, ,,Lee, K.-S.;
,-Paneth, N.,-”Gartner,L.’M.,” et-al. 1980.. Neonatal rnortal{ty:‘An~~
analysis of recent improvement ,in the United. States. Am. J. Public Health70:15-21. ,..
McIlwaine, G. M., Howat, R. C. L., Dunn, F., and MacNaughton, M. C. 1979. The .Scottish perinatal mortality survey. Br. Med. J. 2:1103-1105.
National Center for Health Statistics,-H. C. Chase. 1972. A study of infantmortality from linked records;.comparison of neonatal,mortality..form two:cohortstudies, United States, January-March 1950 and 1960: Vital and HealthStatistics. Series 20, No. 13. DHEW Pub..No. (HSM) 72-1056. Health Servicesand MentaT Health Administration. Washington: U.S..GovernmentPrinting Office.
North, A. F!.,and MacDonald, H. M. 1977. Why are neonatal mortality “rateslower in small black infants than in infants of similar.birthweight? J.Pediatr. 90:809-810.
—J..
Philip, A. G, S.j~,Little, G. A., Polivy, D. R.y et al. ‘1981. Neonatalmortality risk for the eighties: The importance of birth weight/gestational agegroups. Pediatrics 68:122-130.
.-,Wegman, M. E. 1985. Annual sunnnaryof vital statistics--l984. Pediatrics76:861-871.
Wilcox, A. J., and Russell, I. T. 1983a. Birthweight and perinatal mortality,II: On weight-specific mortality. Int. J. Epidemiol. 12:319-325.
Wilcox, A. J., and Russell, I. T. 1983b. Perinatal mortality: Standardizingfor birthweight is biased. Am. J. Epidemiol. 118:857-864.
Williams, R. L:,and-Chen, P. M. 1982. Identifying the sources of the ..recent.decline in perinatal mortality rates in California. N. Engl. J. Med. 306:207-214.
111-55.“ .
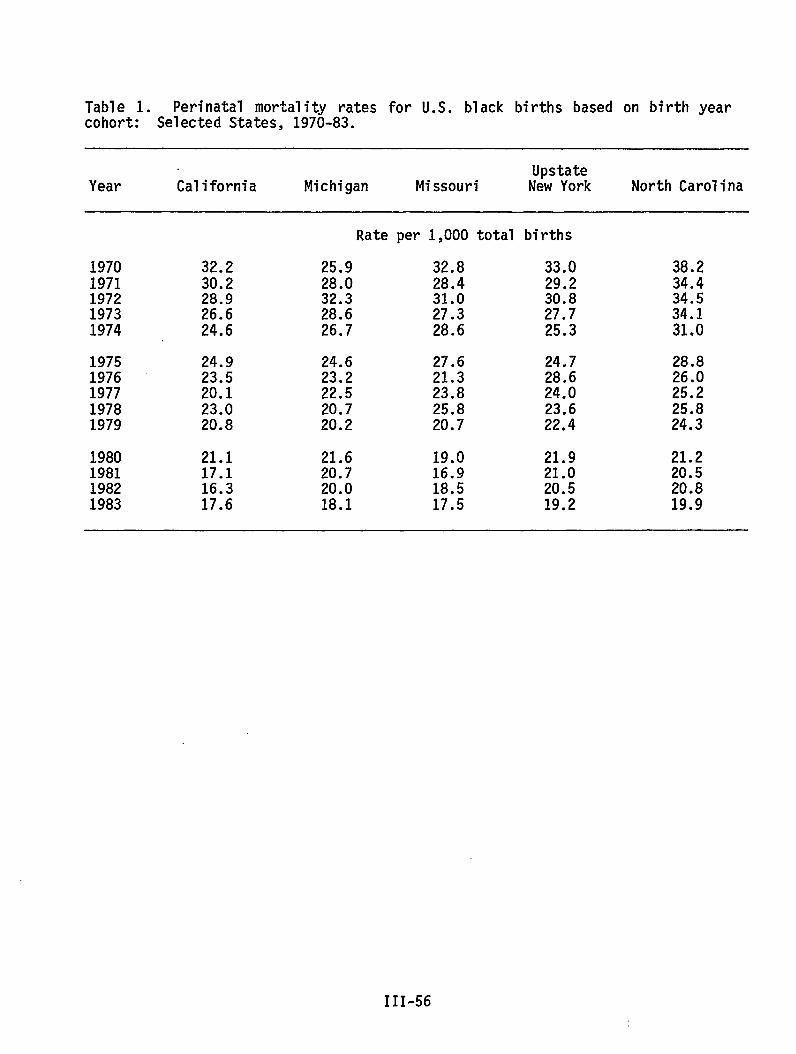
Table 1. Perinatal mortality rates for U.S. black births based on birth yearcohort: Selected States, 1970-83.
UpstateYear California Michigan Missouri New York North Carolina
19701971197219731974
19751976197719781979
1980198119821983
32.230.228.926.624.6
24.923.520.123.020.8
21.117.116.317.6
Rate per 1,000 total births
25.9 32.8 33.028.0 28.4 29.232.3 31.0 30.828.6 27.3 27.726.7 28.6 25.3
24.6 27.6 24.723.2 21.3 28.622.5 23.8 24.020.7 25.8 23.620.2 20.7 22.4
21.6 19.0 21.920.7 16.9 21.020.0 18.5 20.518.1 17.5 19.2
38.234.434.534.131.0
28.826.025.225.824.3
21.220.520.819.9
III-56
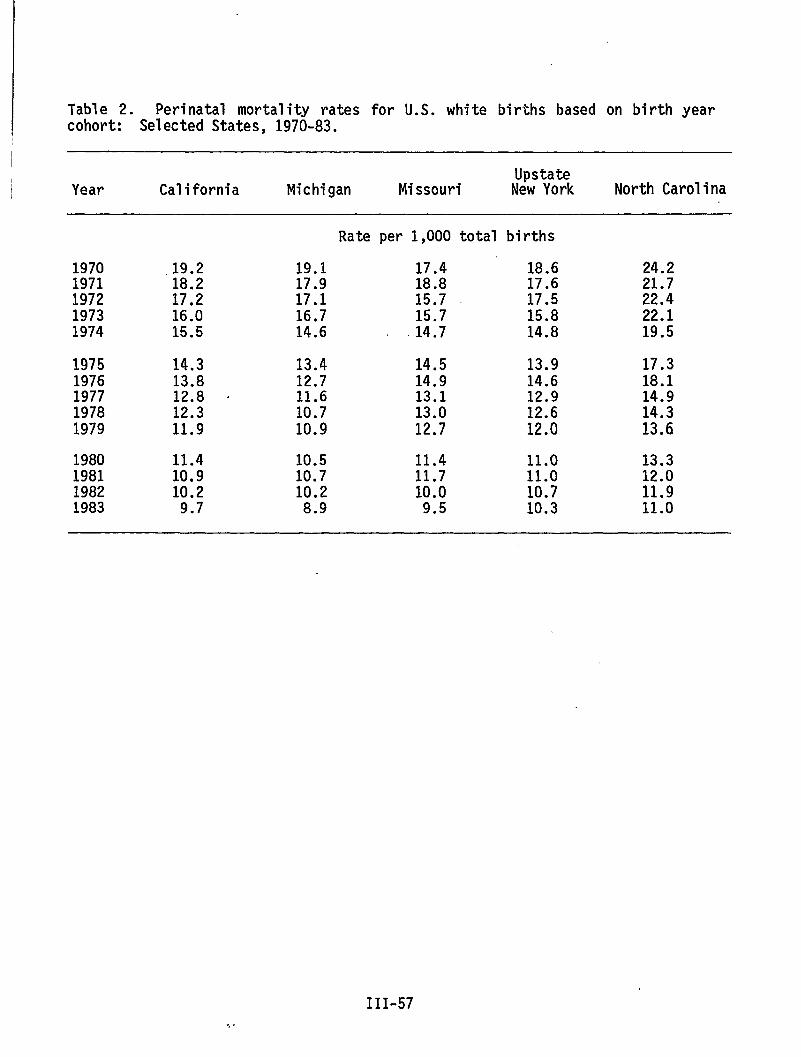
Table 2. Perinatal mortality rates for U.S. white births based on birth yearcohort: Selected States, 1970-83.
I
I
I.hstateYear California Michigan Missouri New York North Carolina
Rate per 1,000 total births
1970 .19.2 19.1 17.4 18.6 24.21971 18.2 17.9 18.8 17.6 21.71972 17.2 17.1 15.7 17.5 22.41973 16.0 16.7 15.7 15.8 22.11974 15.5 14.6 14.7 14.8 19.5
1975 14.3 13.4 14.5 13.9 17.31976 13.8 12.7 14.9 14.6 18.11977 12.8 “ 11.6 13.1 12.9 14.91978 12.3 10.7 13.0 12.6 14.31979 11.9 10.9 12.7 12.0 13.6
1980 11.4 10.5 11.4 11.0 13.319811982
10.910.2
10.710.2
11.710.0
11.010.7
12.011.9
1983 9.7 8.9 9.5 10.3 11.0
III-57
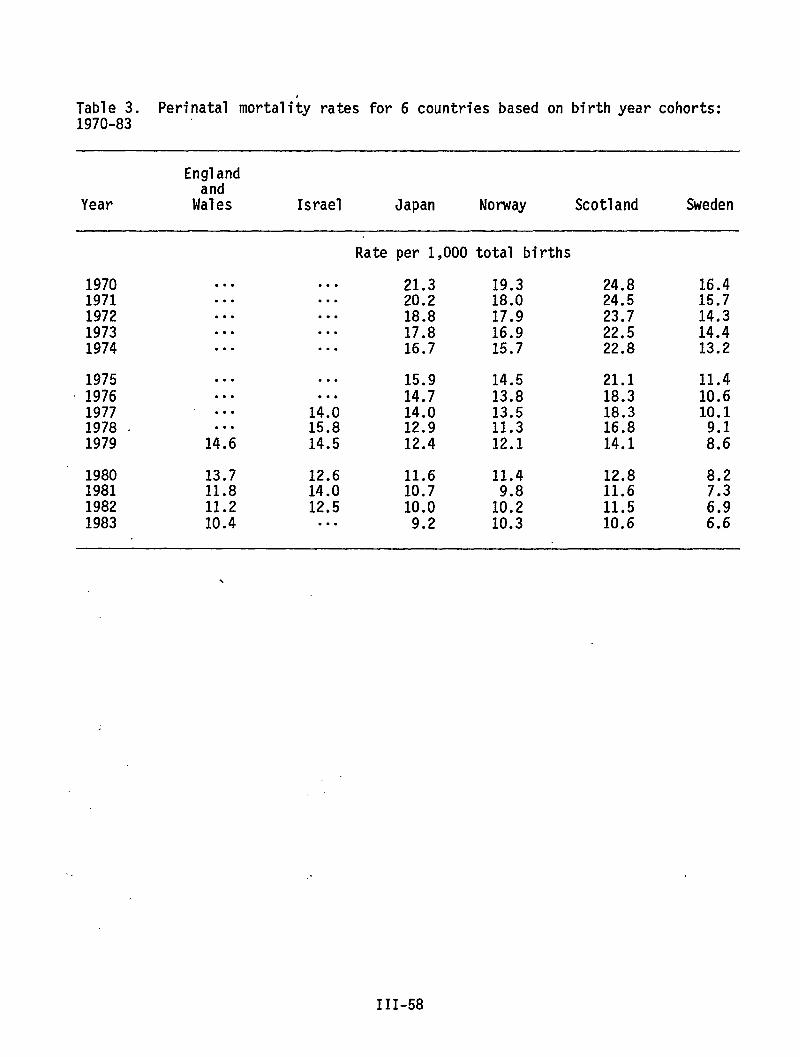
Table 3. Perinatal mortality rates for 6 countries based on birth year cohorts:1970-83 ‘
Englandand
Year Wales Israel Japan Norway Scotland Sweden
Rate per 1,000 total births
1970 . . . . . . 21.3 19.3 24.8 16.41971 . . . . . . 20.2 18.0 24.5 15.71972 .*. . . . 18.8 17.9 23.7 14.31973 . . . . . . 17.8 16.9 22.5 14.41974 . . . ● . . 16.7 15.7 22.8 13.2
1975 . . . .*. 15.9 14.5 21.1 11.41976 . . . ● . . 14.7 13.8 18.3 10.61977 . . . 14.0 14.0 13.5 18.3 10.11978 , . . . 15.8 12.9 11.3 16.81979 14.6 14.5 12.4 12.1 14.1 ;::
1980 13.7 12.6 11.6 11.4 12.8 8.21981 11.8 14.0 10.7 11.61982 11.2 12.5 10.0 1::; 11.5 ;:;1983 10.4 . . . 9.2 10.3 10.6 6.6
\
.,
III-58
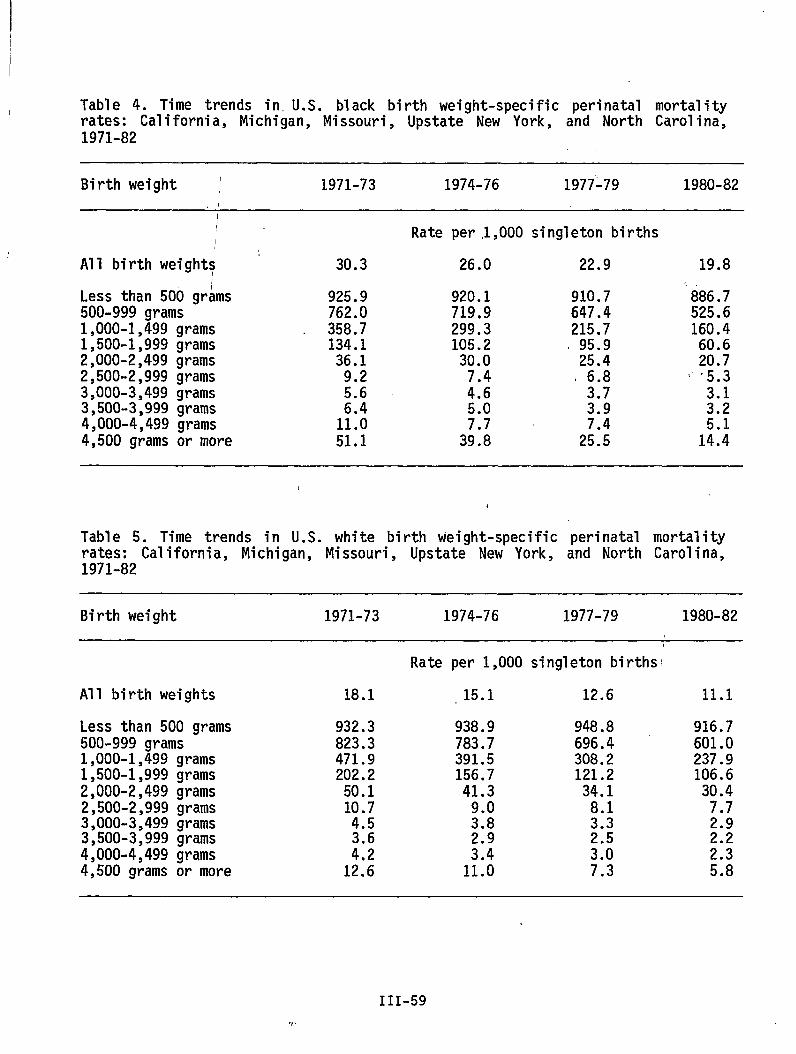
Table 4. Time trends in.U.S. black birth weight-specific perinatal mortalityIrates: California, Michigan, Missouri, Upstate New York, and North Carolina,1971-82
Birth weight ~ 1971-73 1974-76 1977-79 1980-82
All birth weights
Rate per .1,000singleton birthsI
Less than 500 gr~ms500-999 grams1,000-1,499 grams1,500-1,999 grams2,000-2,499 grams2,500-2,999 grams3,000-3,499 grams3,500-3,999 grams4,000-4,499 grams4,500 grams or more
30.3
925.9762.0358.7134.1
36.19.25.6
1;::51.1
26.0
920.1719.9299.3105.2
30.07.44.65.07.7
39.8
22.9
910.7647.4215.7
. 95.925.4
, 6.83.73.9
2;::
19.8
886.7525.6160.4
60.620.7
( ‘5.3
u
1:::
1
Table 5. Time trends in U.S. white birth weight-specific perinatal mortalityrates: California, Michigan, Missouri, Upstate New York, and North Carolina,1971-82
Birth weight 1971-73 1974-76 1977-79 1980-82
All birth weights
Less than 500 grams500-999 grams1,000-1,499 grams1,500-1,999 grams2,000-2,499 grams2,500-2,999 grams3,000-3,499 grams3,500-3,999 grams4,000-4,499 grams4,500 grams or more
Rate per 1,000 singleton births’
18.1 15.1 12.6
932.3823.3471.9202.250.110.74.5
i:;12.6
938.9783.7391.5156.741.3
9.03.8
:::11.0
948.8696.4308.2121.2
34.18.13.3
:::7.3
11.1
916.7601.0237.9106.630.47.72.9
H5.8
III-59
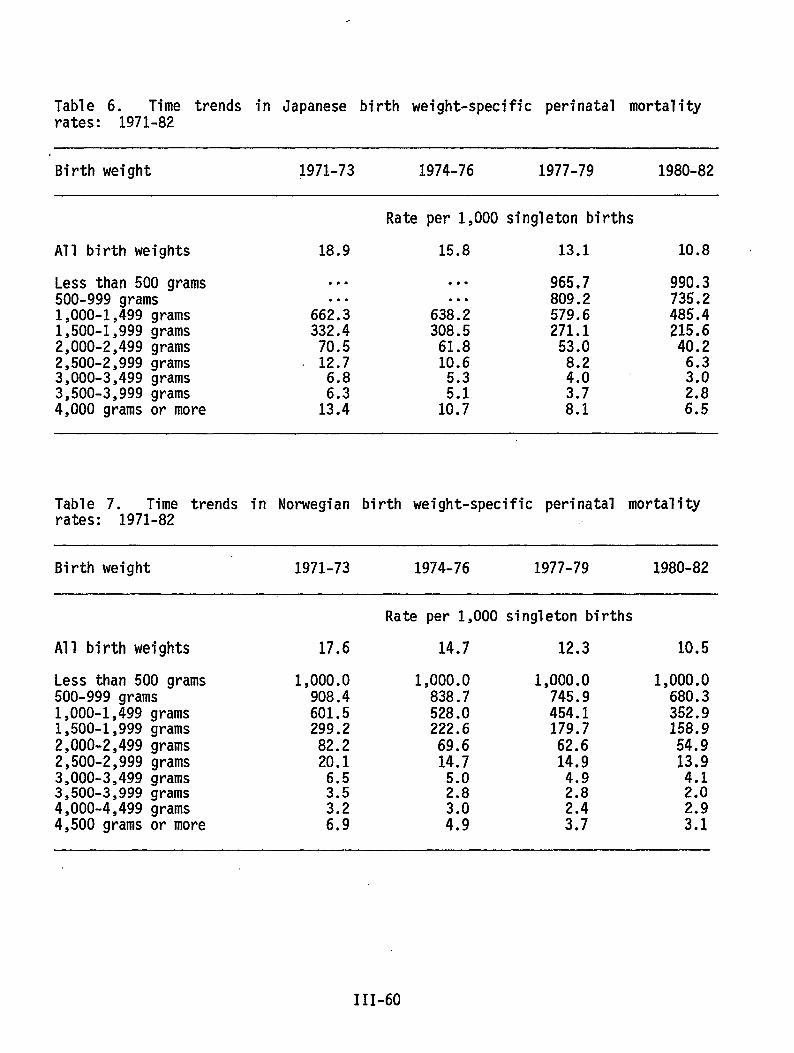
Table 6. Time trends in Japanese birth weight-specific perinatal mortalityrates: 1971-82
Birth weight 1971-73 1974-76 1977-79 1980-82
Rate per 1,000singletonbirths
All birth weights 18.9 15.8 13.1 10.8 ~
Less than 500 grams500-999 grams1,000-1,499 grams1,500-1,999 grams2,000-2,499 grams2,500-2,999 grams3,000-3,499 grams3,500-3,999 grams4,000 grams or more
. . .
. . .
662.3332.470.512.76.8
12::
. . .
. . .
638.2308.561.810.65.3
1;:;
965.7809.2579.6271.153.08.24.0
H
990.3735.2485.4215.640.2
Table 7. Time trends in Norwegian birth weight-specific perinatal mortalityrates: 1971-82 .,
Birth weight 1971-73 1974-76 1977-79 1980-82
Rate per 1,000 singleton births
All birth weights 17.6 14.7 12.3 10.5
Less than 500 grams500-999 grams1,000-1,499 grams1,500-1,999grams2,000-2,499 grams2,500-2,999 grams3,000-3,499 grams3,500-3,999 grams4,000-4,499 grams4,500 grams or more
1,000.0908.4601.5299.282.220.16.53.53.26.9
1,000.0838.7528.0222.669.614.75.02.8
;::
1,000.0745.9454.1179.762.614.94.92.8
::;
1,000.0680.3352.9158.954.913094.12.0
::;
111-60
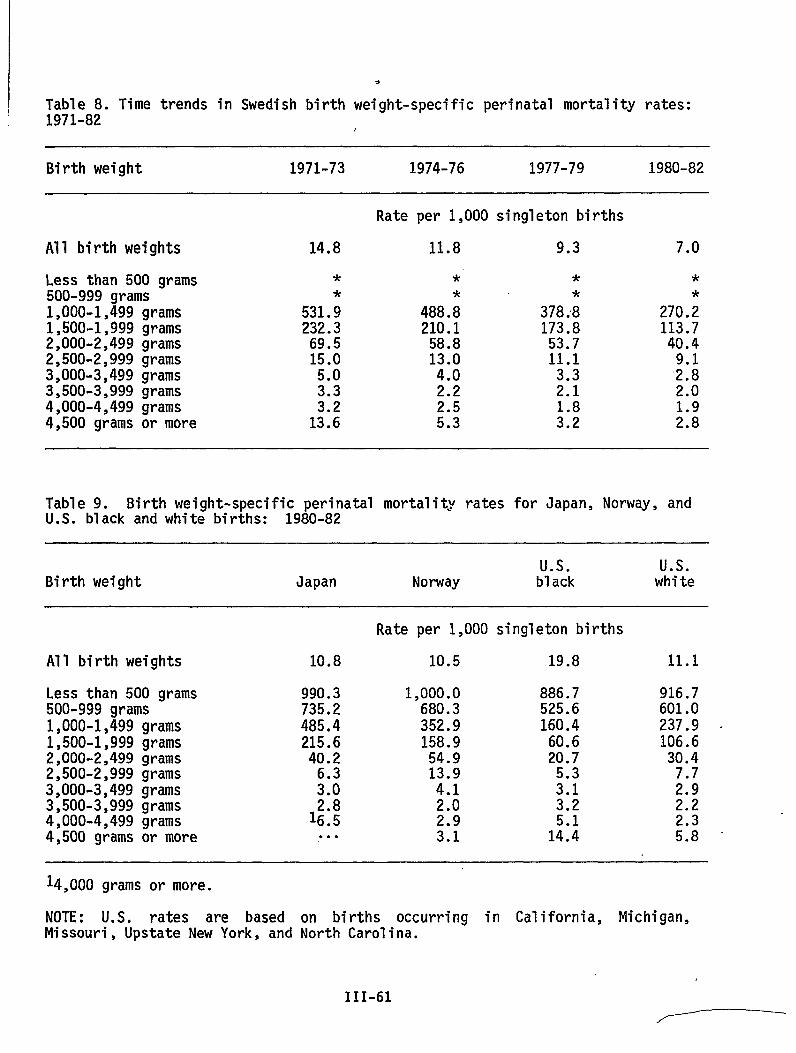
e
Table 8. Time trends in Swedish birth weight-specific perinatal mortality rates:1971-82
Birth weight 1971-73 1974-76 1977-79 1980-82
Rate per 1,000 singleton births
All birth weights 14.8 11.8 9.3 7.0
Less than 500 grams500-999 grams1,000-1,499 grams1,500-1,999 grams2,000-2,499 grams2,500-2,999 grams3,000-3,499 grams3,500-3,999 grams4,000-4,499 grams4,500 grams or more
*
531.;232.369.515.05.0
::;13.6
*
488 .;210.1
58.813.04.02.2
::;
**
378 ;8173.853.711.1
3.32.1
::;
*
270.;113.740.4
;:;2.0
;:;
Table 9. Birth weight-specific perinatal mortality rates for Japan, Norway, andU.S. black and white births: 1980-82
Us. Us.Birth weight Japan Norway black white
Rate per 1,000 singleton births
All birth weights 10.8 10.5 19.8 11.1
Less than 500 grams500-999 grams1,000-1,499 grams1,500-1,999 grams2,000-2,499 grams2,500-2,999 grams3,000-3,499 grams3,500-3,999 grams4,000-4,499 grams4,500 grams or more
990.3735.2485.4215.6
40.2
:::
1$;. . .
1,000.0680.3352.9158.954.913.94.12.02.93.1
886.7525.6160.4
60.620.7
5.33.13.25.114.4
916.7601.0237.9 .106.630.47.72.92.2
::;
14,000 grams or more.
NOTE: U.S. rates are based on births occurring in California, Michigan,Missouri, Upstate New York, and North Carolina.
111-61
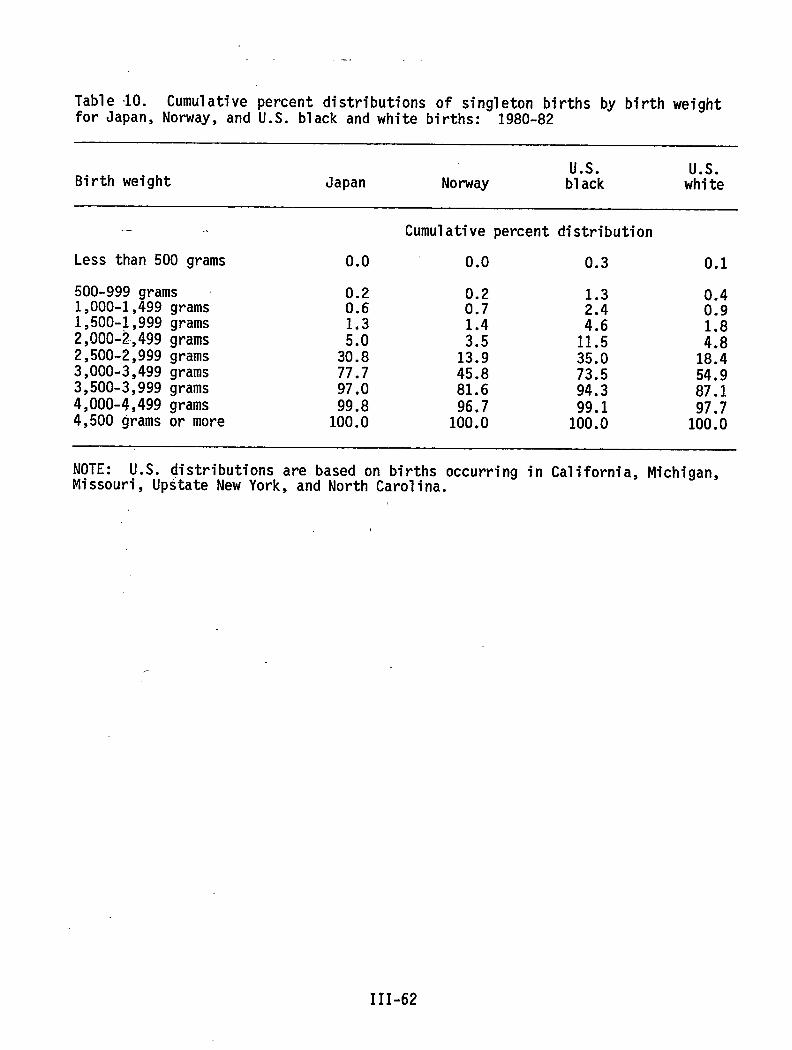
.-.
Table 10. Cumulative percent distributions of singleton births by birth weightfor Japan, Norway, and U.S. black and white births: 1980-82
Us. Us.Birth weight Japan Norway black white
. .. .’
Less than 500 grams
500-999 grams1,000-1,499 grams1,500-1,999 grams2,000-2,499 grams2,500-,2,999grams3,000-3,499 grams3,500-3,999 grams4,000-4,499 grams4,500 grams or more
0.0
0.20.6
H30.877.797.099.8100.0
Cumulative percent distribution
0.0 0.3 0.1
0.20.7
:::13.945.881.696.7100.0
;::
1:::35.073.594.399.1100.0
0.40.9
:::18.454.987.197.7100.0
NOTE: U.S. distributions are based on births occurring in California, Michigan,Missouri, Upstate New York, and North Carolina.
III-62
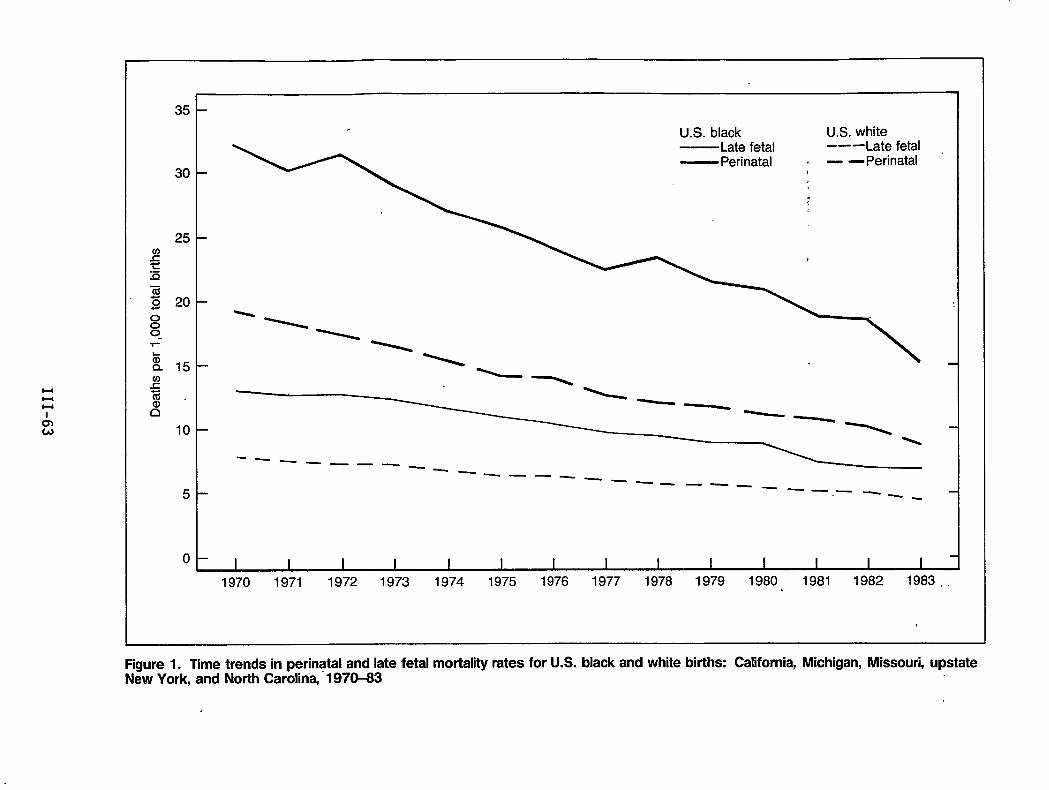
35
30
25
20
15
10
5
0 I I I I 1 1 I I I I I 1 I I
1970 1971 1972 1973 1974 1975 1976 1977 1978 1979 1980 1981 1982 1983..
Figure 1. Time trends in perinatal and late fetal mortality rates for U.S. black and white births: California, Michigan, Missouri, upstateNew York, and North Carolina, 1970-83
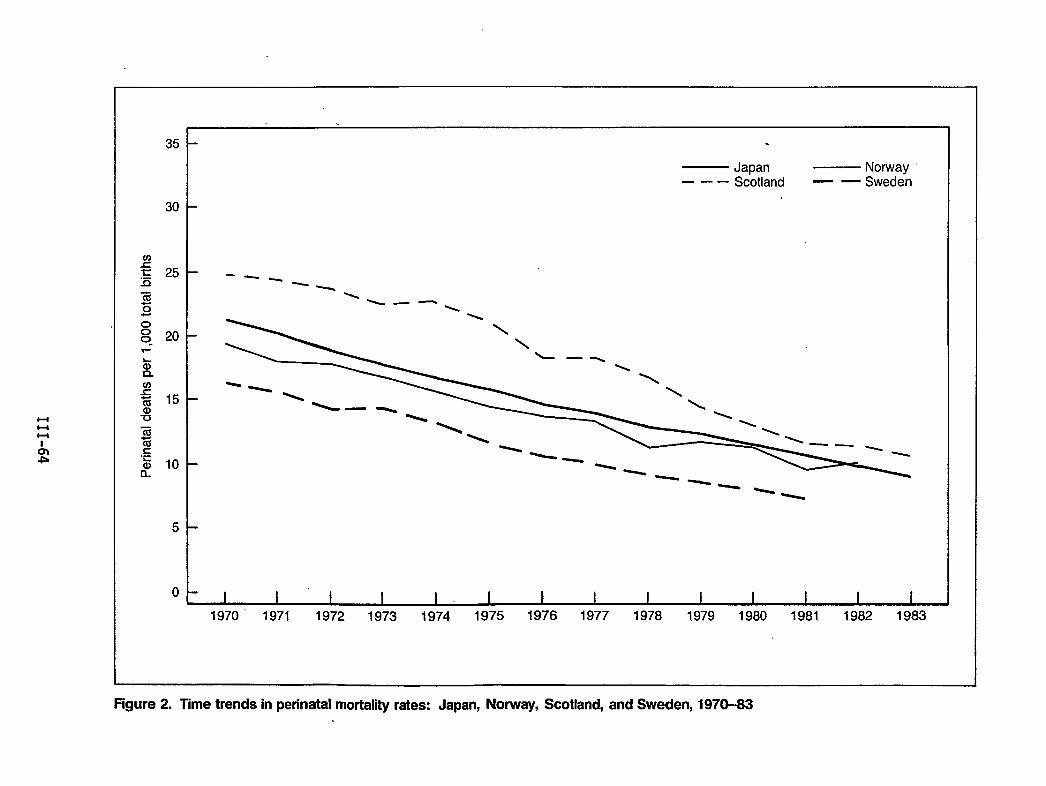
uH
o00-
35
30
25
20
15
10
5
0
.
— Japan — Norway ~—.. Scotland — —Sweden
---
—-%
‘\ \
--
1970” 1971 1972 1973 1974 1975 1976 1977 1978 1979 1980 1981 1982 1983
Figure2. Timetrends inperinatal mortalkyrates: Japan, Norway, Scotland, and Sweden, 1970-83
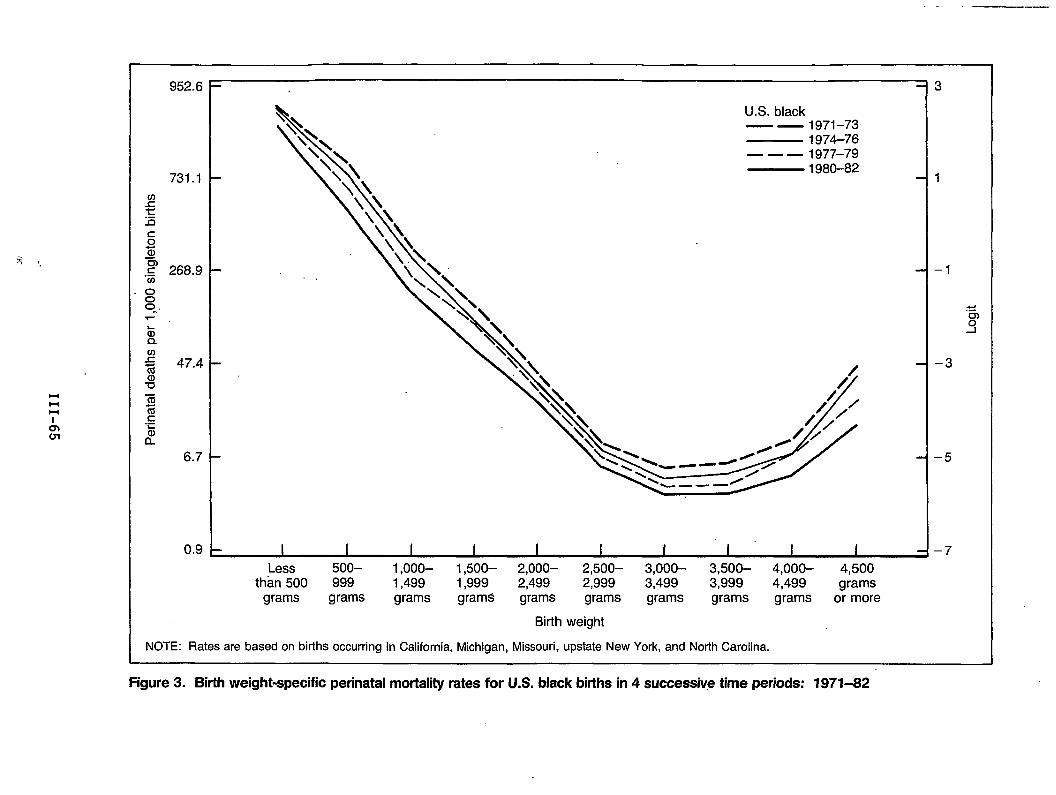
l-ll-lHI
tinWI
952.6
so~
.: 268.9
6.7
0.9
\
\\U.S. black
\\ — — 1971-73\\
\\— 1974-76
\, \— — — 1977–79— 1980-82
1-
1 I I I I I I I I ILess 5oo– 1,ooo– 1,500– 2,000– 2,500– 3,000- 3,500– 4,000– 4,500
than 500 999 1,499 1,999 2,499 2,999 3,499 3,999 4,499 gramsgrams grams grams grams grams grams grams grams grams or more
Birth weight
NOTE: Rates are based on births occurring in California, Michigan, Missouri, upstate New York, and North Carolina.
3
1
–1
.“s.5
–3
–5
–7
Figure 3. Birth weight-specific perinatal mortality rates for U.S. black births in 4 successive time periods: 1971-82
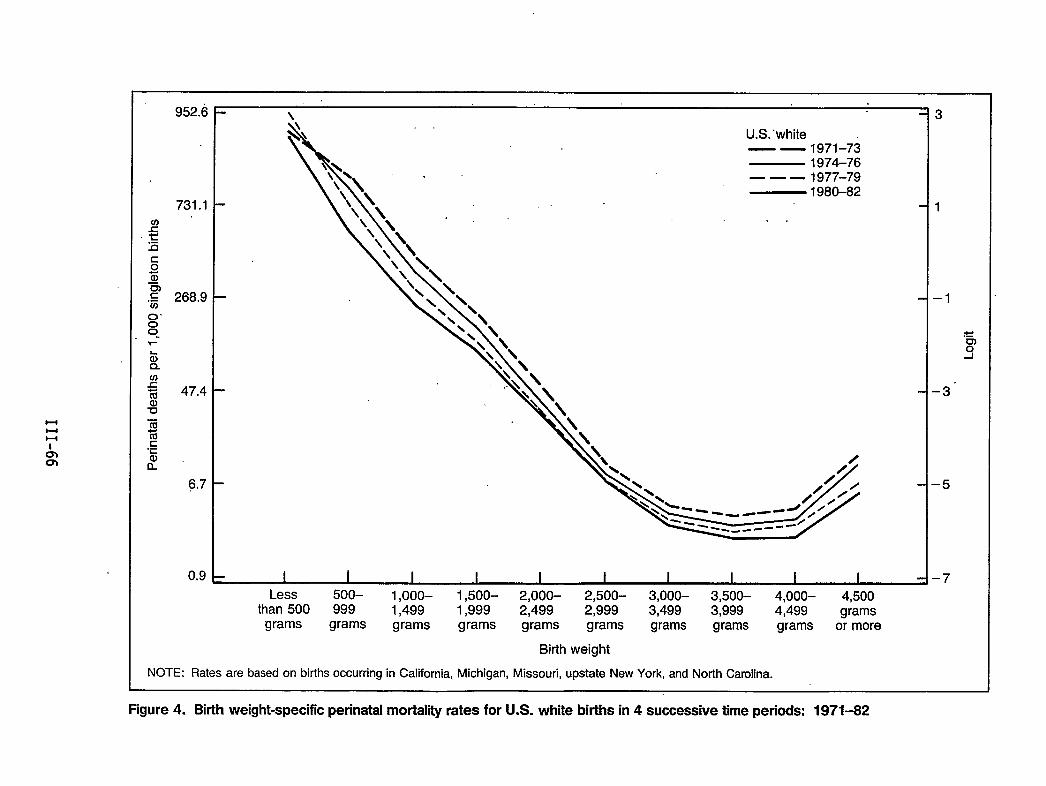
uuu
,,\
o’00-
952.6
731.1
268.9
47.4
6,7
0,9
<\
\
U.S.-white—— 1971–73
\\ 1974-76
‘\’\ -— — — 1977-79
‘\ \— 1980-82
\\\*.:. . .
.
Less 5oo- 1,ooo– 1,500- 2,000– 2,500- 3,000- 3,500- 4,000- 4,500than 500 999 1,499 1,999 2,499 2,999 3,499 3,999 4,499 grams
grams grams grams grams grams grams grams grams grams or more
Birth weight
NOTE: Rates are based on births occurring in California, Michigan, Missouri, upstate New York, and North Carolina.
3
1
-1
.E).9
-3”
-5
-7
Figure 4. Birth weight-specific perinatal mortality rates for U.S. white births in 4 successive time periods: 1971-82
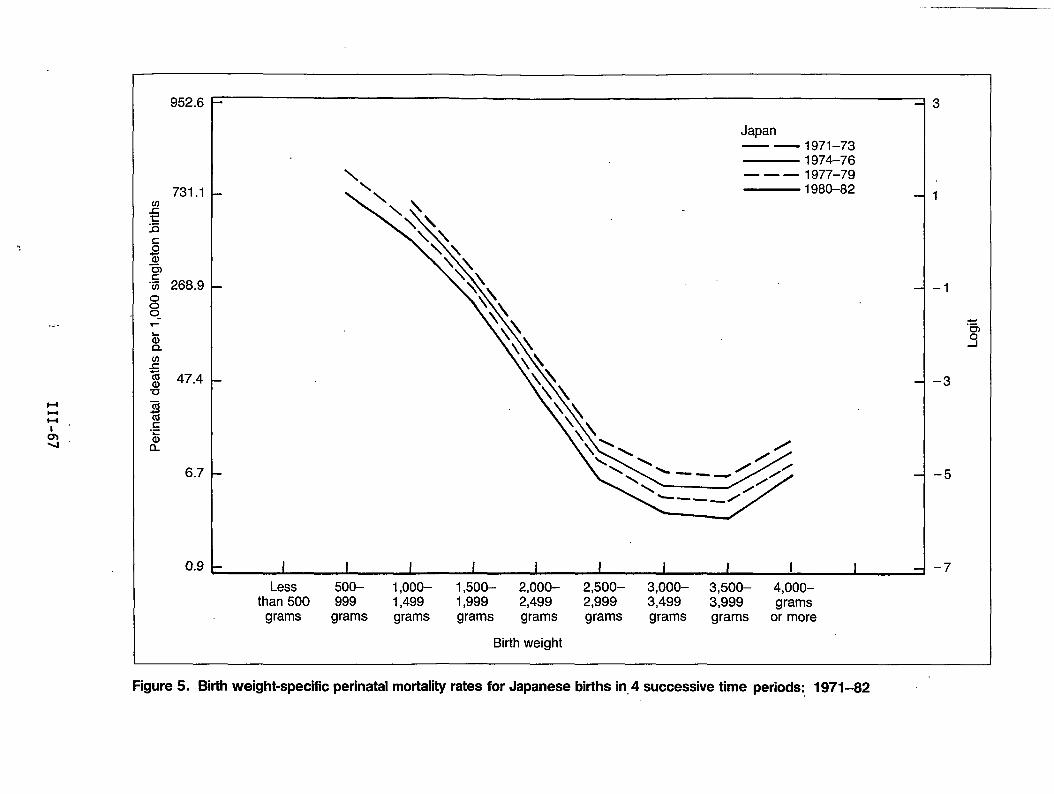
.<-
HHu,
Au’
952.6
731.1
268.9
47.4
6.7
0.9
Japan1971–731974-761977–791980-82
Less 5oo– 1,ooo– 1,500– 2,000- 2,500– 3,000– 3,500– 4,000–than 500 999 1,499 1,999 2,499 2,999 3,499 3,999 grams
grams grams grams grams grams grams grams grams or more
Birth weight
3
1
–1
–3
–5
–7
Figure 5. Birth weight-specific perinatal mortality rates for Japanese births in,4 successive time periods: 1971-82
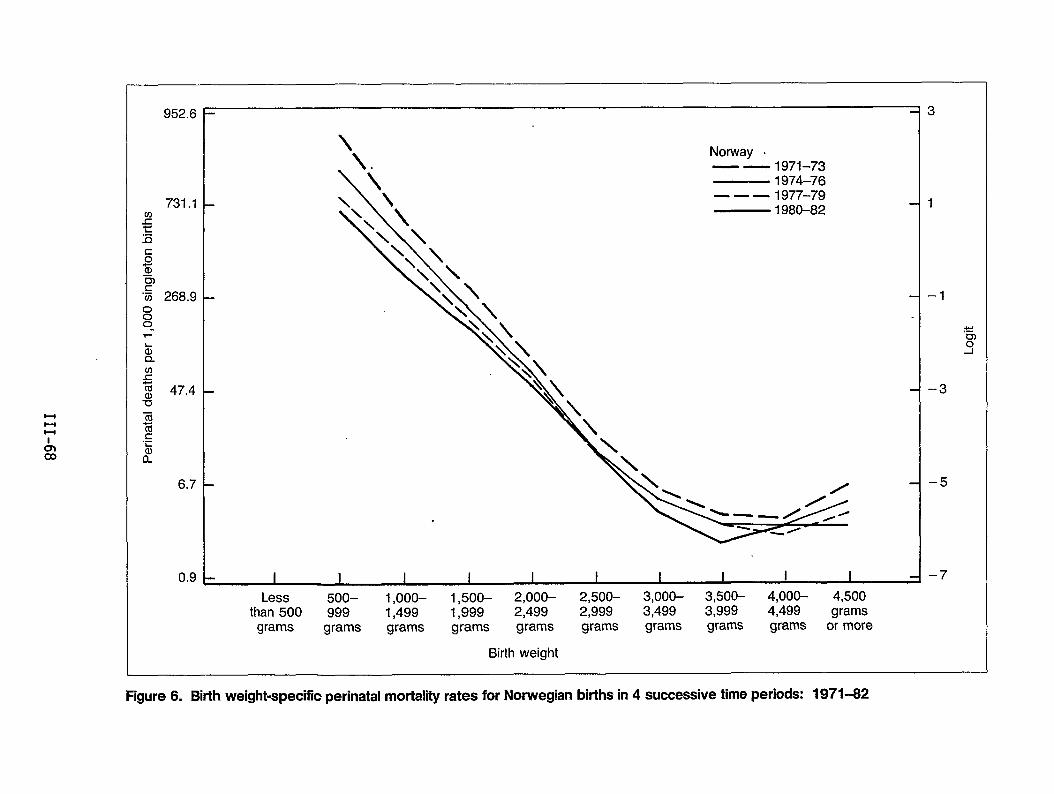
Hl-lH
Aco
952.6
731.1
268.9
47,4
6.7
0.9
.
.
\
\.Norway .
\
\
— — 1971-73— 1974-76
\ \ — — — 1977-79\\ \ — 1980-82
. i I I I I I I I I I
Less 5oo– 1,ooo– 1,500– 2,000– 2,500– 3,000- 3,500– 4,000- 4,500than 500 999 1,499 1,999 2,499 2,999 3,499 3,999 4,499 grams
grams grams grams grams grams grams grams grams grams or more
Birth weight
3
1
–1
–3
–5
–7
Figure 6. Bhth weight-specific perinatal mortality rates for Norwegian births in 4 successive time periods: 1971-62
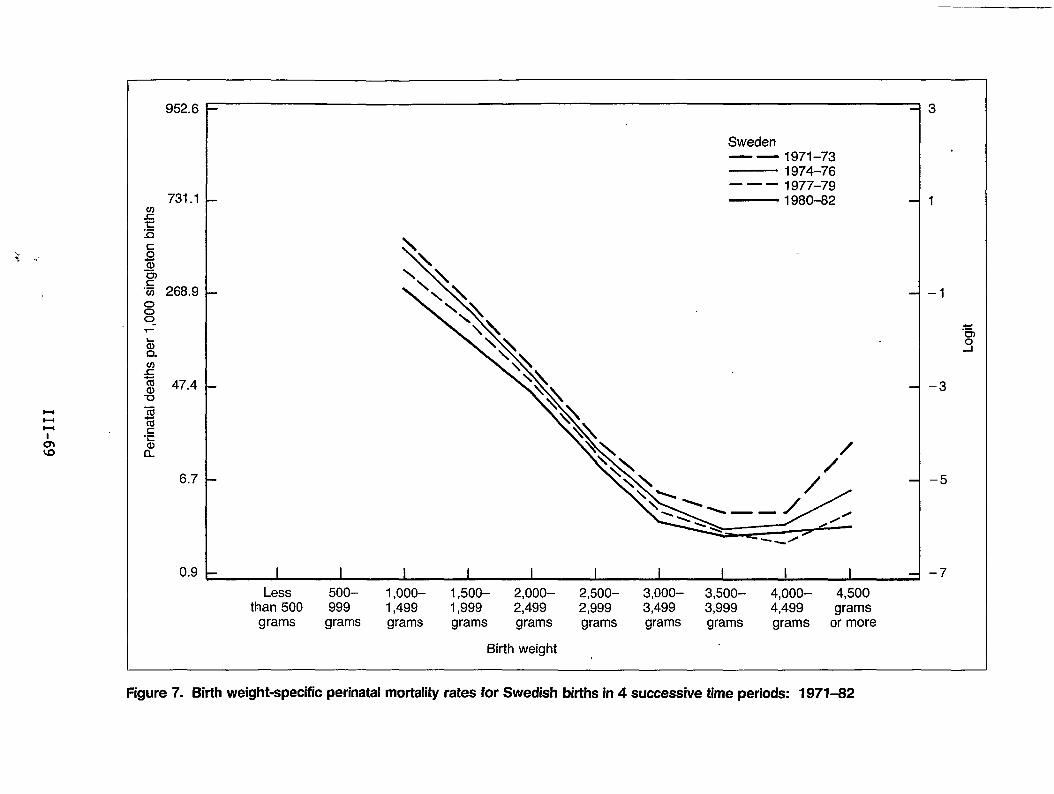
HHl-l
I
952.6
731.1
000“
47.4
6.7
0.9
Sweden— — 1971–73— 1974-76——— 1977–79— 1980-82
.
. 1 1 I I I I i I I I
Less 5oo– 1,ooo– 1,500– 2,000– 2,500– 3,000– 3,500– 4,000– 4,500than 500 999 1,499 1,999 2,499 2,999 3,499 3,999 4,499 grams
grams grams grams grams grams grams grams grams grams or more
Birth weight
3
1
–1
–3
–5
–7
Figure 7. Birth weight-specific perinatal mortality rates for Swedish births in 4 successive time periods: 1971-82
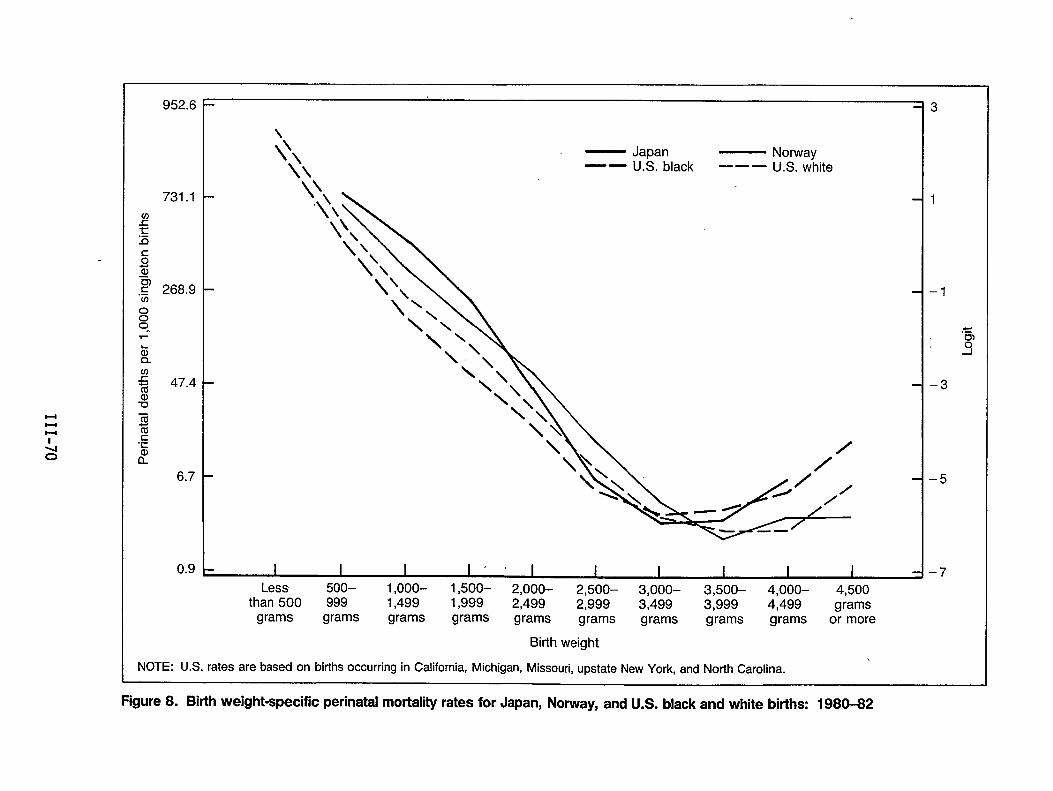
Hl-ll-c
952.6
73 .1
268.9
47.4
6.7
0.9
\
Q\\\
— Japan — Norway‘— U.S. black ——— U.S. white
I I I I ,, I I I I I ILess 5oo– 1,000- 1,500– 2,000- 2,500– 3,000– 3,500– 4,000- 4,500
than 500 999 1,499 1,999 2,499 2,999 3,499 3,999 4,499 gramsgrams grams grams grams grams grams grams grams grams or more
Birth weight
NOTE: U.S. rates are based on births occurring in California, Michigan, Missouri, upstate New York, and North Carolina.
3
1
–1
.“63
–3
–5
–7
Figure 8. Birth weight-specific perinatal mortality rates for Japan, Norway, and U.S. black and white births: 1980-82
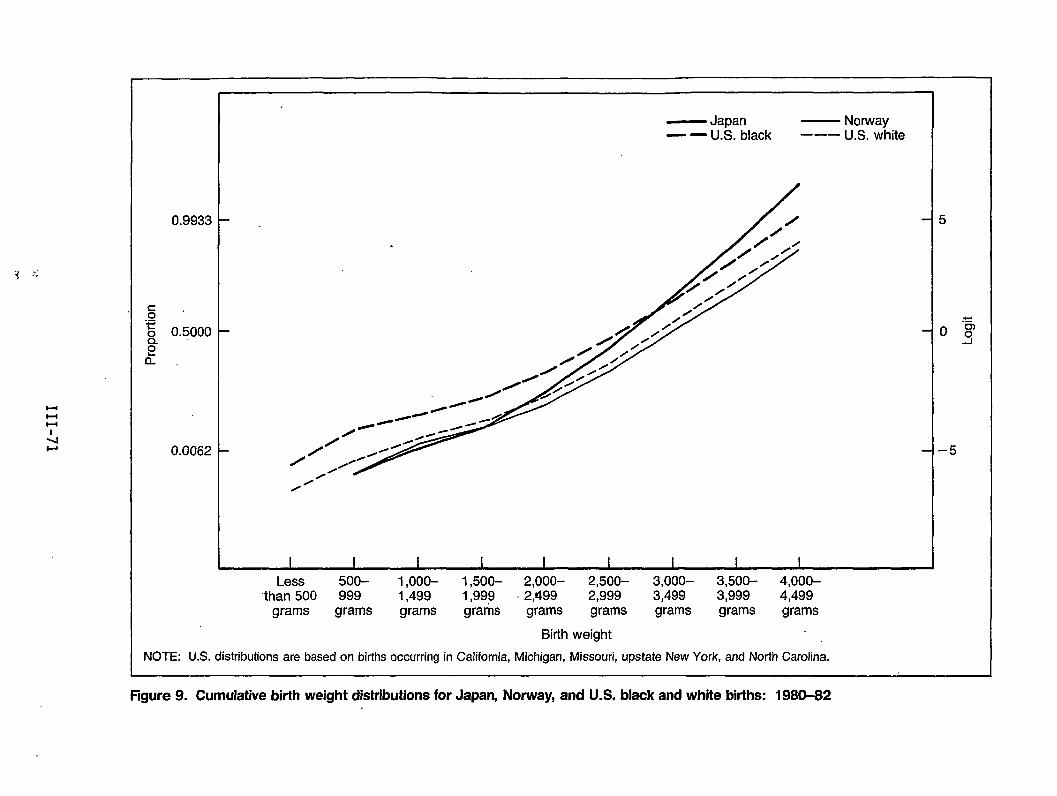
1, ,.$ .,
0.9933
0.5000
0.0062 1-
.
— Japan — Norway— — U.S. black ——– U.S. white
I I I I I I I I I
Less 5oo– 1 ,ooo– 1,500- 2,000- 2,500– 3,000- 3,500- 4,000-“than 500 999 1,499 1,999 2,499 2,999 3,499 3,999 4,499
grams grams grams grams grams grams grams grams grams
Birth weight
NOTE: U.S. distributions are based on births occurring in California, Michigan, Missouri, upstate New York, and North Carolina.
Figure 9. Cumulative birth weight distributions for Japan, Norway, and U.S. black and white births: 1980-82
Chapter IV: Comparative HealthCare Systems
,,.
Having a Baby in Europe: Lessons for North America
by Marsden Wagner, M.D., M.R.H.
Introduction
In 1979, maternal and child health issues were discussed at the annual meetingof the 33 Member States of the European Region of the World Health Organization(WHO). During this discussion, many countries expressed concern about theservices offered for pregnancy, birth, and following birth. The countriesrecognized that, as yet, unsolved problems remain which must be examined, andthey asked the European Regional Office of WHO to mount activities to study andreport on these problems surrounding birth and birth care. In response to thisrequest, the maternal and child health unit of the European Regional Officeorganized a Perinatal Study Group. The Group’s 15 members came from 10countries and spanned 10 professional disciplines: economics, epidemiology,health administration, midwifery, nursing, obstetrics, pediatrics, psychology,sociology, and statistics. For 5 years, the Group conducted surveys, reviewedthe literature, and brought its own personal and professional experience todiscussions of the health services for women and their babies during pregnancy,birth, and fol1owing birth. The entire group met together at least once a year,and findings from the previous year’s work were presented, followed by lengthy,sometimes heated, open and free discussions. No member of the Group remainedunchanged by this process.
Methodology
The material presented and discussed in this paper is based on three surveysconducted by the Perinatal Study Group. The first survey was an initial studyof the official perinatal services, i.e., those services provided by themedical, midwifery, and allied professions and recognized by law and governmentsas the appropriate means of safeguarding maternal . and child health. Aquestionnaire was sent to 31 of 33 countries of the European Region of WHO andreplies were received from 23 countries. After a preliminary analysis of theraw data from this questionnaire had been completed, it was clear that there wasa need for more detailed information about hospital practices during pregnancyand birth which have psychosocial implications. Consequently, in the secondsurvey, a shorter psychosocial questionnaire was prepared and sent tq 10representative countries.
The third survey came after the first 2 years of work, when the Perinatal StudyGroup realized that they were overlooking a part of the picture. While themajority of mothers and babies received care from the official services, asignificant minority were turning to a range of services that lie outside or atthe margin of the official system. These services, here termed “alternative,”exist in most if not all of the countries of the Region. Although these
IV-3
alternative services are the source of care for a relatively small proportion ofthe Region’s mothers and babies, these services nevertheless represent animportant commentary on the shape of the official services themselves, andespecially on the extent to which the official services can be consideredadequately to be meeting the expressed needs of those whoConsequently, eight countries in Europe and two countries inUnited States and Canada) were visited by a research midwifea medical sociologist, conducted this survey of alternativein Europe and North America.
The information from all of these surveys, as well as the “
use the services.North America (thewho, together withperinatal services
iterature reviews,has been drawn together in an official ‘WHO report, Having a Baby in Europe,which was published by the European Regional Office of World HealthOrganization in Copenhagen, Denmark (World Health Organizationy 1;85).
In this paper, five aspects of perinatal care have been selected for which itappears that the lengthy and varied experience of the countries in the EuropeanRegion with regard to perinatal services has direct implications for the furtherdevelopment of perinatal care in North America: prenatal care, maternityprotection, obstetrical intervention, midwifery, and perinatal data systems.The paper will present first the information on the European situation for eachof these issues, followed by a discussion of implications for North Amerfca.
Prenatal Care
There are considerablee data on the number of visits for official care duringpregnancy in the European Region. Twenty-one out of 23 survey countriesregulate the officially recommended number of visits during pregnancy. Therecommended number of routine visits for uncomplicated ‘pregnancyranges from 3to 4 visits in two central European countries to 30 visits in one easternEuropean country. (In this report, “uncomplicated” pregnancy or birth refers tothe judgment made by the doctor and/or midwife. The judgment made by thepregnant woman herself may be quite different.) Ten countries reconnnendbetween10 to 12 routine visits and the mean for all 21 countries is 12 visits. Thedistribution of the recommended number of visits is shown in table 1.
The recommended number of visits for women whose pregnancies are complicated orjudged to be at increased risk is reported as “unlimited” or “as necessary” by10 countries. Those countries giving figures for recommended visits forcomplicated or risky pregnancies range from 16 visits to 37 visits.
In 15 of the surveyed countries, data were reported on the actual (as opposed torecommended) number of routine visits of women with uncommed pregnancies.These data are also shown in table 1. In 5 countries, this information is basedon national data, while in 10 countries it is based on regional data or surveys.The 9 countries with monopolistic health care systems all have data onattendance and show actual numbers of visits quite close to the recommendednumbers. In fact, in 5 of these countries, the actual number of visits washigher than the recommended number. Only 6 of 14 countries with pluralistichealth care systems have data on attendance, and there is considerable variationamong countries with regard to actual versus recommended number of visits. Onecountry reports that 30 percent of women make the recommended 10 routine visits,while 11.4 percent make less than 6 visits. Another country finds that private
IV-4
institutions are visited more frequently (7 actual visits when 12-15 arerecommended) than state institutions (5.5 actual visits).
Out of 23 survey countries, 12 report.policies directed toward pregnant womenwho never receive care or who fail to return for care. One country reports noneed for such a policy because of almost 100-percent participation (0.02 percentnonattendance). In 9 countries, the policy consists of home visiting if thereis nonattendance. The effectiveness of this policy seems to vary widely. Ofthe 6 of these 9 countries that have information on attendance, the percent ofwomen who do not attend is re orted as:
[O percent, 0.4 percent, 4.7 percent, 20
percent, and 10-50 percent. This last country is a less developed country withvast rural areas and shortage of personnel.)
In 2 countries, the policy consists of withdrawing financial benefits frompregnant women who fail to make visits. (See section on maternity benefits.)The percentage of pregnant women who do not attend is reported by these 2countries as 0.5 percent and 0.6 percent. Among the 10 countries with noofficial policy for nonattendance, 5 do not know the percentage of pregnantwomen who do not attend care, and the remaining 5 countries report nonattendingwomen as: 1 percent, 4.3-15 percent, 5 percent, and 35 percent.
It is not possible with the data presented to draw definite ‘conclusionsregarding the effectiveness of these policies for pregnant women who do notattend this official care. It is interesting to note, however, that for thosecountries with attendance data, in countries with monopolistic health caresystems the mean percentage of nonattending women is 4.4 percent, as opposed to15 percent in those countries with pluralistic health care systems.
It was about 50 years ago that countries in the European Region began toformalize systems of health care for pregnant women based on routine visits toan officially approved doctor or midwife at regular specified intervals. Theextraordinary fact is that this basic scheme has not changed over the years.With the coming of ever more sophisticated laboratory and electronicinnovations, more tests have been added and changes made in place of visit, butthere has been little or no questioning of the basic ideas behind the scheme.Today, every European Region country has a legally mandated or recommendedsystem of visits for all pregnant women. In all but one of the countriesincluded in the official survey, the woman is not required to pay directly outof her own purse for the officially sanctioned visits. The recommended numberof visits for an uncomplicated pregnancy, however, varies enormously--from 4 to30, with an average of 12 visits.
Except for the more developing countries in the Region, a vast majority ofpregnant women with uncomplicated pregnancies attend all recommended visits.Most countries follow up nonattendance with a home visit. The reasons why allof these women choose to go to all of these visits has not been extensivelystudied. Some countries provide financial incentives, but attendance is equallyhigh in other countries without them. It is possible that a strong motivatingfactor to attend is the need for social support--to share the experience ofpregnancy with others outside the family.
Why does every country have a system of visits for pregnant women? Why do mostwomen attend? Why are nonattenders pursued? Why is there such variation among
IV-5
countries concerning number of visits? Clearly, there must be a widespreadbelief that more is better--that increasing the number of visits means a betteroutcome. Is this true? Figures to support this claim have mainly beencomparisons between one time period and a later one, and comparisons amongcountries or regions with different economic and social backgrounds. In fact, asignificant relationship betweenincreased number of visits during pregnancy anddecreased perinatal mortality has never been convincingly shown. (Indeed, onestudy including over a quarter of a million births found an increasing number ofvisits associated with more complications during birth.) The inverse, thatfewer visits are associated with higher mortality, has been shown, but this mayprove to mean nothing, since premature birth (a major contributor to mortality)automatically means a shorter pregnancy with less time for scheduled visits.Furthermore, it has been repeatedly shown that women least likely to havetrouble during pregnancy go earlier for care and therefore have more visits.
These systems of many visits involve very large amounts of money and humanresources and yet mist in the face of inadequate proof of value. Since thequantity of care given during pregnancy is no guarantee of quality, it seemsmost reasonable to pay more,attention to quality (i.e., content) and reduce thequantity to the optimal minimum. In this regard, it is interesting to note thatmany studies and many programs have involved increasing visits to pregnant womenwith problems (or increased risk of problems), while little or no attention hasbeen given to decreasing the number of visits for women with no complications,Based on the work of the Perinatal Study Group, it seems worthwhile toexperiment, through randomized clinical trials, with a system of reduced visitsfor a woman with an uncomplicated pregnancy. Such an experimental system offewer medical visits should be combined with other forms of social support forthe pregnant woman. It is also important.to experiment with user choice withregard to number of visits. ‘.
There is very 1ittle information on :the actual content of care for pregnantwomen. Of the 23 survey countries, 18 “report having guidelines on routineservices to be provided.. In 12 countries, detailed government regulations areavailable, while the remaining 6 countries have more general recommendationsoutlined by university centers. But even where detailed regulations exist, it isnot known what the actual practices are. Little is known about the actual face-to-face interaction between the pregnant woman and the helper. A few studieshave shown that the pregnant woman tends to be intimidated by a physician andoften hesitates to bring forward her concerns. Midwives are reported to besensitive to social needs and to provide health education. But there remains aneed for investigation of what goes on between helper and pregnant woman and itsrelevance to the content of care. Clearly, a rational system of care must bebased on who does what best.
What are the implications for North America .of the European experience withprenatal care? The United States and Canada are both rightly concerned aboutthe fact that their perinatal mortality rates are significantly higher than therates found in many countries in the European Region. These North American,countries have organized expert committees of various kinds to assess thesituation and make recommendations. Again and again, the recommendation is madethat there is a need for more prenatal care if there is to be an improvement inperinatal mortality in North America. Does the European experience support thisproposal? The answer is no. There is no apparent relationship in Europe
IV-6
between the amount of prenatal care that a woman receives and the outcomeof the.pregnancy, either for herself or for her baby. Furthermore, if prenatal-caredoes any good, we certainly do not know what parts of it are-useful and whatparts are not. One would hope that, before rushing off to mount more extensiveprenatal care systems in North America, there could be careful assessment of thecontent of the prenatal care and its relationship to outcome. .For example”,thetwo factors most correlated with low birth weight newborns (the major cause’g.fperinatal mortality in Europe and in the United States and Canada) are smokingand lack of social support. Perhaps programs to address these two issues among,pregnant women might be far more cost effective than expanding the traditionalmedically oriented prenatal care. “.
Maternity Protection ‘., 7
..,.
All 23 survey countries in Europe have laws or regulations for the protection ofpregnancy and motherhood., The picture is a complicated one, and one scheme doesnot fit all countries. Even within a country, hardly any 1aws apply to,allwomen, since particular.circumstances lead to exclusions. Eligibi.1ity for andextent of benefits depend on many factors, including how.long the woman hasheld her present job, what type of work she does outside the home, familyincome, and number of children. The countries with monopolistic systemsgenerally provide the most generous benefits. The Scandinavian countries havethe most progressive legislation.
Prenatal and postnatal paid maternity leave in 22 countries is shown infigure 1. In all countries, the combined period is at least 12 weeks. Thelength of prenatal leave varies less than postnatal leave, and in 4countr.i.esunused prenatal leave may be carried over into ‘the postnatal period. Somecountries offer a choice between short or long leave, with less money per monthfor the longer leave. Many countries automatically extend the postnatal leavein case of certain conditions such as premature birth and.multiple birth. Insome countries, the length of postnatal leave grants depends on the numbe~ ofchildren; the more children a woman has, the longer her leave.. Most recently,the Scandinavian countries have led the way in extending these benefits: to.fathers. The usual pattern is to allow the mother and father to choose whichparent will stay home during which parts of the postnatal leave period. ~~ , ~
Beyond continuing to receive a job salary, or part of a salary, while.onmaternity leave, mothers in nearly all countries receive other special benefits,financial or otherwise. Some of these benefits are shown in table 2. Nineteencountries provide a grant of money foreach child born to help with expenses..The size of the grant may vary, increasing in certain countries, for example, ifthere are more children, the new baby is sick or handicapped, the mother is’breast feeding or the mother is a student. Several countries make the paymentof the money contingent on attendance at prenatal visits. (See earlier sectionon prenatal care.) In addition to the lump sum of money, many countries alsoprovide a “familyal1owance”consistingof regularmonthly paymentsfor eachchild. The amountsvary widely among countries: For two children, the amountranges from 2 percent to 20 percent of the average monthly industrial wage forthat country. The amount usually increases progressively.with each subsequentchild. ;,’
“IV-7

In addition to financial benefits, a number of other diverse social benefits areavailable. Twenty surveyed countries mentioned additional benefits duringpregnancy and after childbirth, including special privileges when traveling bypublic transport; priorities for.loans; priorities for housing; permission tochange jobs; free milk, vitamins, baby equipment; and special working hours.
Most survey countries have laws and regulations regarding the working conditionsof women during pregnancy and after childbirth. (Most often the protection ofworking conditions does not include agricultural workers and, to date, it neverincludes work at home.) Often nighttime work, overtime work, and dangerous workare prohibited, and women are often transferred automatically to a lessdemanding job. In this regard, it is important that in some countries the womanis protected from unfair dismissal because of pregnancy, and in most countriesher right to reinstatement after maternity leave is ensured.
With regard to working conditions for women who are pregnant or have youngchildren, all survey countries provide various types of leave. If the pregnantwoman is sick, she has, on medical certification, sick leave with partial orfull salary for as long as necessary in all countries. If, on the other hand,the baby is sick, most countries provide for leave from work for either parent.The number of days per year allowed for the care of the sick child varies from 5days to 6 weeks (with partial or full salary). Some countries have unlimitedunpaid leave with job protection when a child is sick. Fourteen of the surveyedcountries provide paid time off from work to allow women to attend officialhealth care visits during pregnancy. In addition, several countries also offerpaid time off for women (and sometimes men) to attend pregnancy classes.
An important final aspect of working conditions for women to be mentioned isregulations for breast-feeding women. Nursing breaks from-work are provided inmost countries and counted as fully paid hours of work. The durations of thenursing breaks vary from two l/2-hour breaks to two l-hour breaks. In a fewcountries, the breast-feeding mother is entitled to a shorter working day atfull pay.
Single mothers, on the increase in most countries, are eligible for specialrights in nearly all countries. These rights include longer maternity leave,increased financial benefits, loans and education grants, and priority forplacement for her child in day care centers.
There are important implications for North America with regard to the Europeanexperience with maternity protection. As indicated earlier in this paper, thereis growing evidence of an important correlation between social support forpregnant women and pregnancy outcome. European countries have made a majorcommitment to provide adequate maternity benefits during pregnancy and afterbirth to reduce workload, to provide an economic safety net for the family, andto provide adequate parental caring for the young infant. All 23 surveycountries in the European Region, including a number of countries which aredeveloping or only partially industrialized and with a gross national productfar below that of the United States and Canada, have made this commitment tomaternity protection. In terms of cost benefit, it might be more effective forthe North American countries to consider promoting such maternity protection asa higher priority than expanding the highly costly prenatal care systems.
Iv-8
ObstetricalInterventionRates
A major component of the content of birth care is the operative delivery--whenthe baby is either pulled out by forceps or. vacuum extractor or lifted outthrough a surgical cut in cesarean section. The data CO11ected by the PerinatalStudy Group on these procedures are contained in table 3. Of the 13 countriesthat supplied national data, only about half claimed to have some sort ofnational registration, while the others gave collected hospital reports or dataon representative samples. Just looking at these figures in table 3 clearlydemonstrates great variation: The operative vaginal rate (forceps and/orvacuum) varied from 1 percent to 13 percent; the cesarean section rate variedfrom 4 percent to 12 percent.
The overall operative delivery rate (forceps plus vacuum plus cesarean section)varied from 6 percent to 24 percent; It is clear that this fourfold differencein operative rates cannot be explained by differences in women in thesecountries but must rather represent differences in medical practice customs.Such differences in professional customs take on significance since, in general,expanding the indications for a procedure usually means a decreasing benefit ofthe procedure, while th’ere is no similar decrease in the hazards of theprocedure. Our survey of alternative birth care showed a definite drop inoperative delivery rates in 7 out of 10 countries if the birth took place in asetting where there was alternative care. There is also a trend for theseintervention rates to be lower in those countrieswhere midwifery is independentand/or stronger in its contribution to maternity care.
The rationale for operative delivery is to minimize the risk of injury, disease,and death for mother and child. The only practical yardstick for internationalcomparison is the perinatal mortality rate. When these operative delivery ratesare compared with national perinatal mortality rates in the 11 countries forwhich data are available, only very weak correlations are found. This meansthat the frequencies of operative delivery do not contribute much, if anything,to the variation in perinatal mortality rates among the countries in question.Interestingly, the association was actually weakened when the vaginal operativedeliveries were added to the cesarean section rates.
Our questionnaire also asked about the frequency of induction of labor. Onlyfour countries had national data on the frequency of induction, these beingDenmark (12 percent), Poland (15 percent), Norway (17.5 percent), and Englandand Wales (36 percent). All these values represent the years 1977, 1978, and1979. Finland, quoting annual reports from health centers, had 15 percentinductions in 1979. Regional data were recorded by three countries, with valuesof 5,8 percent, 20 percent, 25 percent, and 30 percent from four differentItalian regions; 25.4 percent from the municipality of Bucharest, Romania; and25 percent from a regional study in Munich, Federal Republic of Germany. Fivecountries gave national estimates, and two quoted data from large hospitals.These ranged from “rather rare” to 83 percent. Eight countries gave no data.The difference in the reported frequency of induction of labor is great, rangingfrom 5.8 percent to 36 percent. Problems of definition exist. (For example,stimulation of ongoing labor with drugs should not be confused with induction.)However, the wide range of figures points to real differences far beyond therange of faulty definitions. These differences obviously reflect differentmedical opinions on the value of induction. Few physicians would
IV-9

dispute the value of.inducing labor in some, perhaps up to 10 percent of womenhaving babies. But in the remainder, the indications are doubtful and can becontested. Attempts to prove a causal relationship between rising inductionrates and falling perinatal mortality rates have failed.
All of these obstetrical interventions -have been increasing in a number ofcountries in Europe to an extent that the practices are causing concern. Thegreat variation which has been demonstrated in the use of these interventionsalso suggests reason for concern. The data from North America suggest thatthese obstetrical intervention rates are as high or higher than the highestintervention rates presented here for Europe. There is little or no evidence tosupport the notion that increasing these interventions to such high levels has asignificant impact on the overall mortality rates. The European experience inthis regard strongly supports the need both in Europe and, especially, in NorthAmerica to carefully reassess the use of all of these interventions. It is forthis reason that a World Health Organization meeting in 1985 made the followingrecommendations for perinatal services worldwide:
Countries with some of the lowest perinatal mortality rates in theworld have cesarean section rates of less than 10%. There is nojustification for any Region to have a rate higher than 10% to 15%.
The induction of labor should be reserved for’ specific medicalindications. No Region should have rates of induced labor higher than10%(Lancet, 1984).-
Midwifery
In 17 of 21 survey countries in the Europeanbirth attendant for uncomplicated births.
Region, the midwife is the primaryThe obstetrician is the birth
attendant in the great majo;ity of complicated births in the European countries.Five countries indicated, however, that either the midwife or the generalpractitioner was the attendant for some complicated births. Furthermore, in thegreat majority of European countries, the midwife is also the principalcaregiver for prenatal and postnatal care.
This European pattern of midwives providing the majority of prenatal andpostnatal care as well as being <the principal birth attendant at uncomplicatedbirths is fundamental to the entire perinatal care system in the EuropeanRegion. This division of labor is important, since midwives and doctors, ingeneral, have quite different styles of care during pregnancy and birth. Themidwife stays with the woman during all stages of labor and birth and sees herrole as encouraging and assisting the woman without taking over, while alsoserving as the woman’s advocate when needed. This is a more social as well asnoninterventionist clinical approach.z The physician does not stay with thewoman but rather comes when called by the midwife to diagnose and treat anyundesirable deviation. The physician’srole is more interventionist and medicalin nature. These two styles have nicely complemented each other. In severalcountries, the midwifeis presence, even at complicated births, is an essentialreminder to all those present that most of what is going on is still normal.
The implications of midwifery practice in Europe for the situation in NorthAmerica are profound. The United States and Canada are the only two developed
Iv-lo
countries in the world where midwifery is not widely practiced. Every singlecountry in the world with perinatal mortality rates lower than the United Statesand Canada uses midwives as the principal or only birth attendant for at least70 percent of all births. This fact alone should dispel any notions thatobstetricians are preferable to midwives as birth attendants at uncomplicatedbirths.~ As mentioned earlier, there is also.evidence that a strong independentmidwifery profession is an important counterbalance to the obstetricalprofession in preventing excessive interventions into the normal birth process.Consequently, it-is perhaps not surprising that in the United States and Canada,one finds the highest obstetrical intervention rates,as well as serious problemswith malpractice suits. The European experience and our data stronglyisupportthe urgent need for an introduction of widespread independent midwifery practicein North America as a most important”counterbalanceto the present situation.
Perinatal Data Systems ,
The past decade has seen the beginning of cross-national studies of perinatalservices and their benefits, hazards, and outcomes. Mention has already beenmade of the work of the European Regional Office of the World HealthOrganization in gathering and analyzing such data. The European Perinatal StudyGroup evaluated the systems for CO1letting routine perinatal data, and theresults are available (Mugford, 1983). The Nordic countries have been involvednow for a number of years in comparing their perinatal statistics and perinatalservice systems and then actually carrying out various kinds of experimentalprograms. The Nordic experience in this regard appears to have been quitefruitful (Bergsj@ and Bakketeig, 1984). The National Center for HealthStatistics in the United States has also recently mounted an ,internationalcollaborative effort and has begun with an important cross-national evaluationof perinatal data. All of these efforts appear to be important in furtherunderstanding the need for improvements in pe,rinatalservices. The Europeanexperience with perinatal data systems suggests the need for increasingcollaboration at the international level if we are all to learn from each otherabout the best ways to have a baby.
.!References
Bergsj~, P., and Bakketeig, L. 1984. International Collaboration in Perinatal .Surveillance: The Nordic Experience. Paper presented at the PAHO/EUROConference of Appropriate Prenatal Technology. Washington.
Lancet. 1984. Appropriate technology for birth.
Mugford, M. A. 1983. Comparison qf reported differences in definitions ofvital events and statistics. World Health Statisties Quarterly 36(5):201-12.
World Health Organization. 1985. Having a Baby in Europe: Report on a Study.(Public Health in Europe 26) Copenhagen: World Health Organlzatlon RegionalOffice for Europe.
IV-11
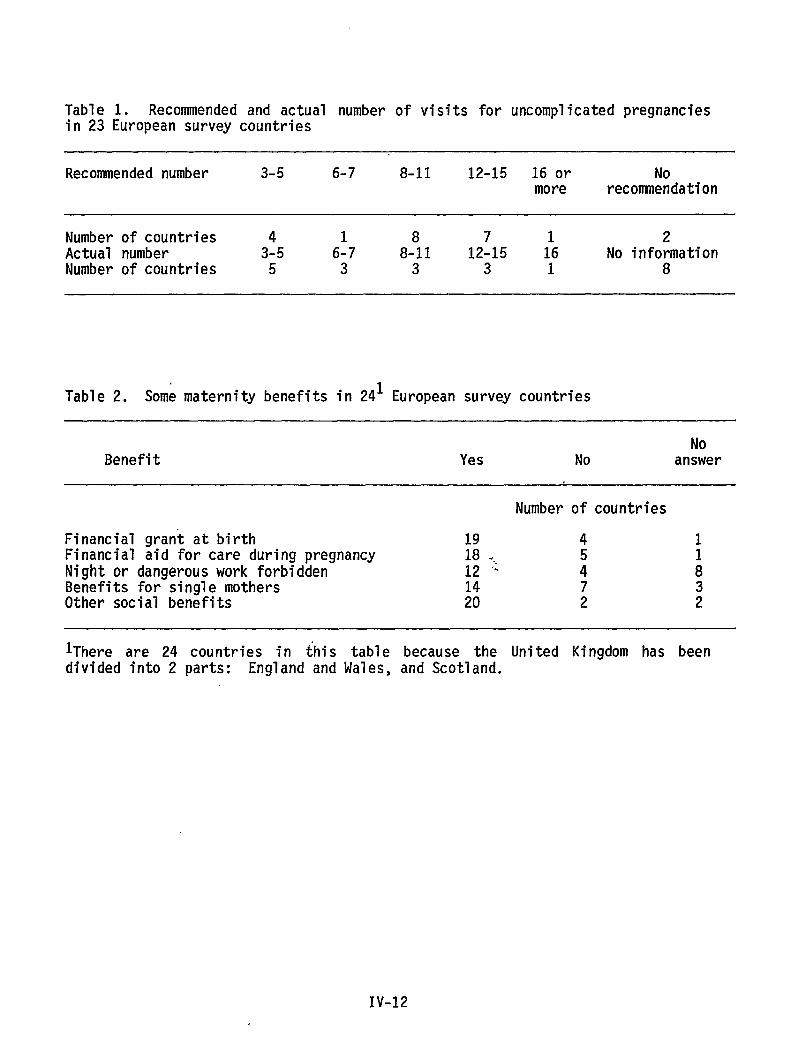
Table 1. Recommended and actual number of visits for uncomplicated pregnanciesin 23 European survey countries
Recommended number 3-5 6-7 8-11 12-15 16 or Nomore recommendation
Number of countries 2Actual number 3:5 6:7 8-!11 12:15 ;6 No informationNumber of countries 5 3 3 3 1 8
Table 2. Some maternity benefits in 241 European survey countries
NoBenefit Yes No answer
Number of countries
Financial grant at birth 19 4 1Financial aid for care during pregnancy 18 ... 5Night or dangerous work forbidden 12 ‘% 4 :Benefits for single mothers 7 3Other social benefits H 2 2
lThere are 24 countries in {his table because the United Kingdom has beendivided into 2 parts: England andllales, and Scotland.
IV-12
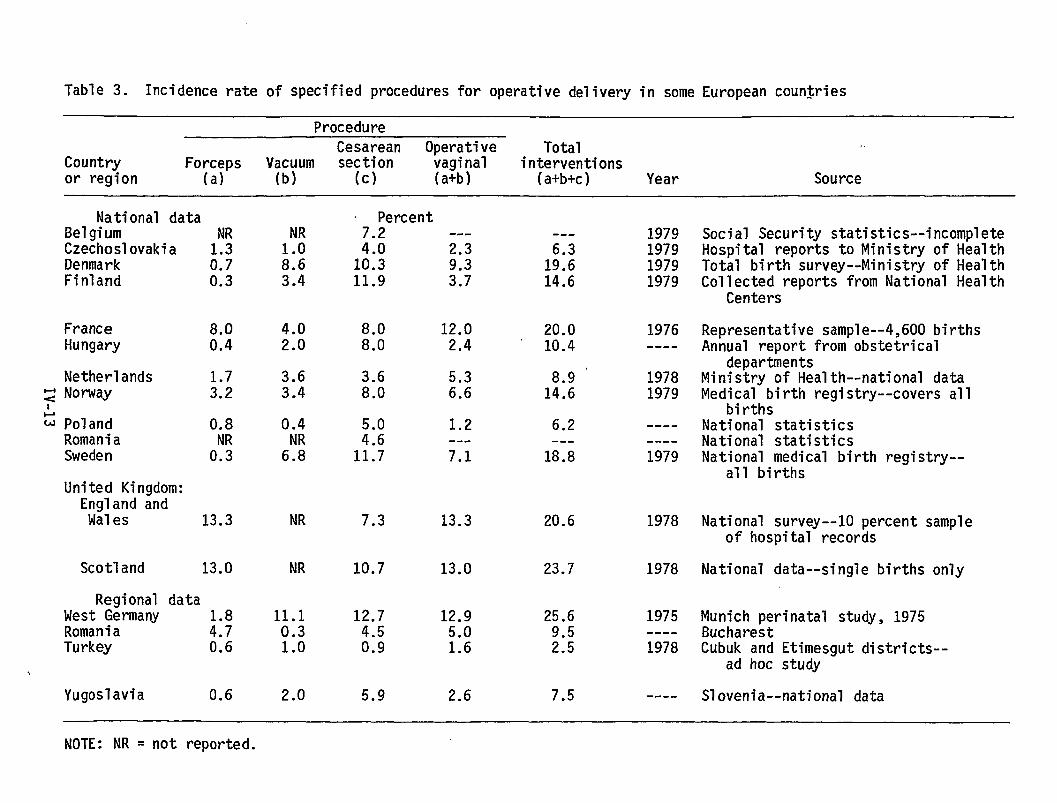
Table 3. Incidence rate of specified procedures for operative delivery in some European countries
ProcedureCesarean Operative Total
Country Forceps Vacuum section vaginal interventionsor region (a) (b) (c) (a+b) (a+b+c) Year Source
National dataBelgium NRCzechoslovakia 1.3Denmark 0.7Finland 0.3
~ Percent---
::6 2.310.311.9 ::;
NR1.08.63.4
4.02.0
3.63.4
0.4
6N;
NR
NR
11.10.31.0
2.0
1979197919791979
Social Security statistics--incompleteHospital reports to Ministry of HealthTotal birth survey--Ministryof HealthCollected reports from National Health
Centers
Representative sample--4,6OO birthsAnnual report from obstetrical
departmentsMinistry of Health--nationaldataMedical birth registry--coversall
birthsNational statisticsNational statisticsNational medical birth registry--
all births
---
1:::14.6
FranceHungary
8.00.4
8.0 12.08.0 2.4
20.010.4
1976----
8.9 ‘14.6
Netherlands~ NorwayI
3.6 5.38.0 6.6
19781979
~ PolandRomaniaSweden
0.8NR0.3
1.2::: ---11.7 7.1
6.2---18.8
--------
1979
United Kingdom:England andWales 13.3 7.3 13.3 20.6 1978 National survey--10 percent sample
of hospital records
National data--single births onlyScotland 13.0
Regional dataWest GermanyRomania ::;Turkey 0.6
10.7 13.0 23.7 1978
12.7 12.94.5 5.00.9 1.6
25.69.52.5
1975----1978
Munich perinatal study, 1975BucharestCubuk and Etimesgut districts--
ad hoc study
Slovenia--national dataYugoslavia 0.6 5.9 2.6 7.5 ----
NOTE: NR = not reported.
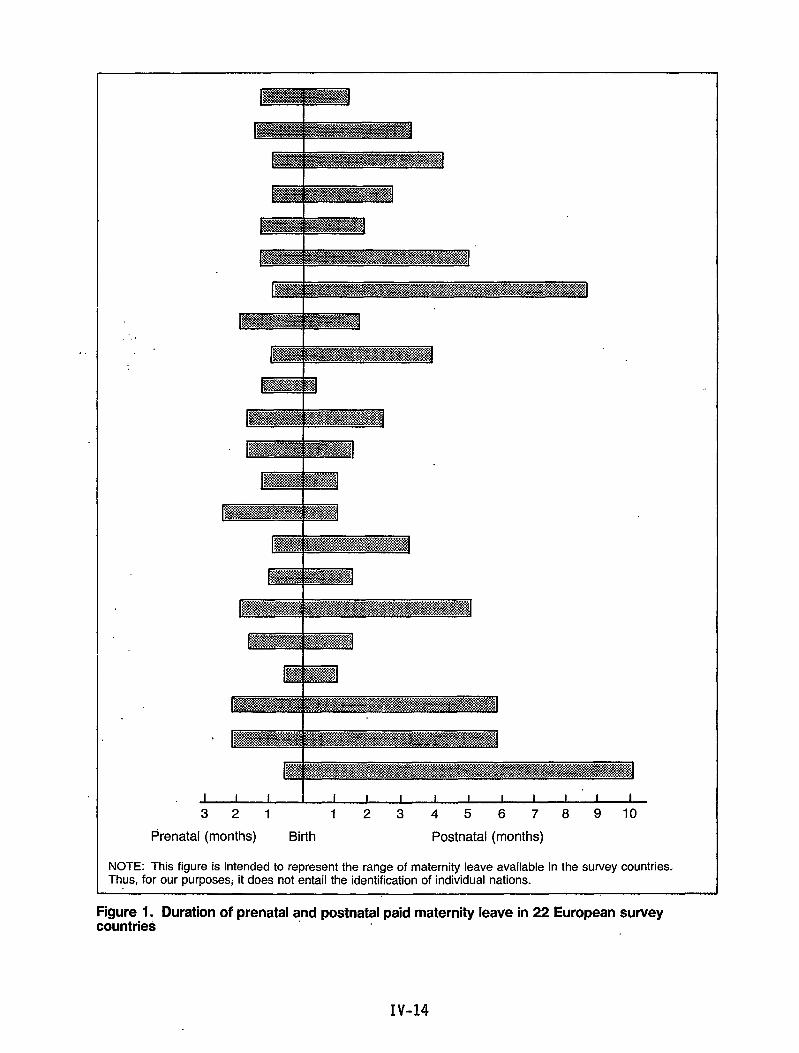
,.
321 12345678 910
Prenatal (months) Birth Postnatal (months)
1.NOTE: This figure is intended to represent the range of maternity leave available in the survey countries.Thus, for our purposesj it does not entail the identification of individual nations.
Figure 1. Duration of prenatal and postnatal paid maternity leave in 22 European surveycountries
Birth Ueight-Specific Mortality Through theFifth Year of Life in Sweden: 1973-81
by Olav Meirik, M.D., Ph.D., and Anders Ericson, M.SC.
There is a well-documented negative correlation between birth weight andneonatal morbidity and mortality. This correlation also holds for thepostneonatal period. Very little is known, however, about childhood morbidityand mortality relative to birth weight. We present here preliminary data onmortality from birth through the fifth year of life relative to birth weight forSwedish 1ive births from 1973 through 1976.
Material and Methods
Two Swedish data bases were utilized in this study: the Medical Birth Registryat the National Board of Health and Welfare and the Registry of Causes of Deathat the National Central Bureau of Statistics. The Medical Birth Registrycontains sociodemographic, anthropometric, and medical data for all births inSweden since 1973; among other items recorded is the newborn’s birth weight.Mothers and infants are identifiable through their unique personalidentification numbers. The National Registry of Causes of Death similarlycontains data on causes of all deaths occurring in Sweden. Also, individualsare identifiable through the personal identification number in this registry.
Each year, the two registries are linked to each other, primarily to verifycases of neonatal death. For the purpose of this study, we compiled data onmortality from birth through the fifth year of life according to the infants’birth weight. The data presented here refer to infants born from 1973 through1976 and their mortality through 1981. All mortality rates referring to aspecific age (e.g. 12-23 months) include in the denominator only infants who hadsurvived to that specific age. A total of 418,595 live births were included inthe analyses, of whom 4.3 percent were low birth weight (less than 2,500 grams)and 0.6 percent were very low birth weight (less than 1,500 grams).
Results
Figure 1 summarizes the findings. The well known relationships between earlyneonatal (O-6 days) and late neonatal (7-27 days) mortality, on the one hand,and birth weight, on the other, appear clearly. Also, postneonatal (1-11months) mortality is strongly related to birth weight.
Judging from the rates for the second year of 1ife (12-23 months), there isstill a gradient in mortality for the various birth weight categories. Thedifferentials in mortality seem to disappear for al”l birth weight categoriesexcept for the very low birth weight infants in the fifth year of life (48-59months). In theirfifthyearof 1ife,theverylow birthweightchildrenhadan
IV-15
approximately threefold excess in mortality compared to other birth weightcategories.
Comnents
The results of this analysis suggest that infant birth weight not only iscorrelated to mortality through the first year of life but continues to beassociated with it in the second, third, and even fourth and fifth years oflife. In this context, it must be emphasized, however, that the mortality ratesfor the fourth and fifth year of 1ife in this study were based on very smal1numbers of deaths, and the influence of chance should be kept in mind. On theother hand, the trends that appear are suggestive of a true relationship.
It is beyond the scope of this preliminary study to determine whether theincreased mortality for low and very low birth weight infants in their secondyear of life and thereafter is attributable to birth weight per se or to the csame genetic and environmental factors leading to low birth weight, which mayalso operate in childhood and cause the higher mortality.
The importance of our findings from a Swedish public health perspective isdifficult to assess until more detailed data relating to causes of death andoccurrence of severe malformations among the deceased infants are available.The birth weight distribution in Sweden is favorable compared to many othercountries, and very few deaths actually occurred in the low and very low birthweight categories beyond the first year of life because of small numbers ofinfants and low mortality rates. If our finding reflects a true pattern, it maybe of more importance in populations with less favorable birth weightdistributions.
IV-16
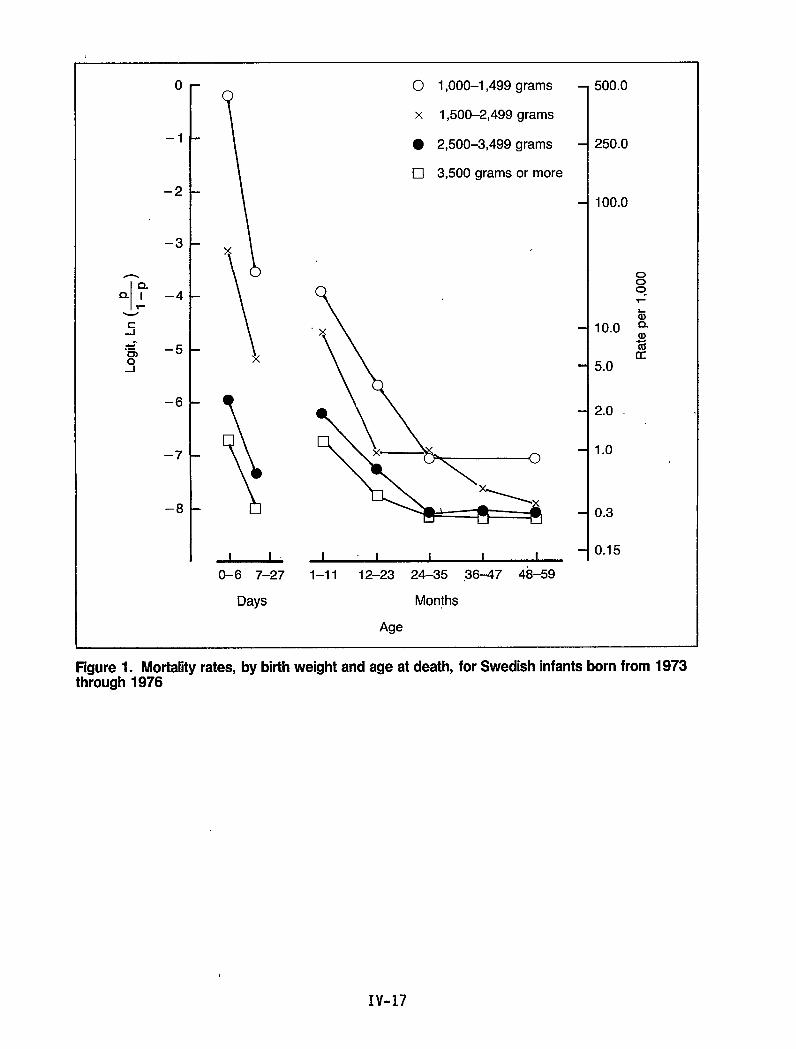
o
–1
–2
–3
n
Q- ?--41-
.5
–6
–7
–8
\
x
\ x
\!5I I
0-6 7-27
Days
O 1,000–1 ,499 grams
x 1,500-2,499 grams
. 2,500–3,499 grams
•l 3,500 grams or more
I 1 I I I
1–11 12-23 24–35 ,36-47 48-59
Months
Age
500.0
250.0
100.0
000“Y
a10.0 :
%u
5.0
2.0
1.0
0.3
0.15
Figure 1. Mortalityrates, by birthweight and age at death, for Swedish infantsborn from 1973through 1976
IV-17
Detection, Monitoring, and Care of High-RiskPregnancies in Sweden
by Olav Meirik, M.D., Ph.D., and Gunilla Lindmark, M.D., Ph.D. r .
Since the late 1950’s, the perinatal mortality rate in Sweden has been among thelowest in the world. This has been attributed to a generally high standard ofliving, a homogeneous and healthy population, a high level of education, andequality in access to qualified antenatal, obstetric, and neonatal care(Alberman, 1980; Hein, 1982; Rooth, 1979). The Swedish model for antenatal carehas in this context received attention because it is mainly run by midwives,contrary to the practice in many other developed countries, where medicaldoctors have the main responsibility for the antenatal care. In this paper, theorganization and the content of Swedish antenatal care are presented, and thepotentials of this Swedish model to detect high-risk pregnancies are discussed.
Organization of Antenatal Care
In general, health care is regarded as being a task for the public sector inSweden. Twenty-three county councils and three large municipalities areresponsible for individual health services and medical care. In health careterms, these units are called principal health care districts. These principaldistricts have populations ranging from 60,000 to 1,500,000 people, with anaverage of about 300,000. Each principal district has at least one hospitalwith departments of obstetrics and gynecology and of pediatrics.
The principal districts are divided into primary health care districts foroutpatient care, each with a number of primary health care clinics servingpopulations of 5,000 to 50,000 people. Antenatal care is a separate activitywithin the framework of primary health care, and each primary health caredistrict has at least one clinic for antenatal care. Table 1 outlines thestructure of this organization.
The antenatal care clinics are staffed with midwives, and there is usually onemidwife per 2,000 women aged 15-44 years. The general fertility rate is about0.055; thus, a midwife takes care of 100-120 pregnant women per year on average.
Each antenatal care clinic is supervised by a general practitioner or anobstetrician. As many as 85 percent of the doctors engaged in antenatal caresupervision are obstetricians who pay regular visits to the clinics and areconsulted by the pregnant women themselves.
During the 1970’s, when obstetrical and neonatal care was centralized (NationalBoard of Health and Welfare, 1973) to a greater extent than before, the need was”felt for a highly qualified antenatal care system with the ability to detect andrefer high-risk pregnancies to adequate levels of care for delivery.
IV-19
Consequently, many of the county councils created posts for senior obstetricianswith the responsibility to organize and supervise antenatal care within theprincipal districts of health care. These senior obstetricians now providecontinuous postgraduate training to the midwives and are in charge of referralantenatal clinics, usually located at the largest hospital in the principaldistricts. At the referral antenatal clinic, the obstetricians work in closecollaboration with pediatricians,midwives, and social workers, as well as otherspecialists (e.g., specialists in internal medicine at the hospital).
Content of Antenatal Care
General guidelines for the personnel working in antenatal care have been givenby the National Board of Health and Welfare. They reconmend two visits to amedical doctor during pregnancy, as outlined in table 2. The guidelines alsoadvise that high-risk pregnancies should be transferred to referral antenatalcare clinics. Among the indications for such transferal are previousstillbirth, previous premature or 1ow birth weight infants, and repeatedspontaneous abortion. Also, older and young pregnant women should, as a rule,have at least one visit to a referral antenatal clinic.
Pregnant women registered at the antenatal clinics are seen by a midwife attheir first visit, when a careful interview is taken accordinci to a standardizedcase record used in all of Sweden. The interview includes i
factors that might increase the risk for preterm bretardation, or other complications in pregnancy or labor.and obstetric history, the interview also focuses on thesocial situation, her working conditions, and lifestyle,smoking and use of alcoholic beverages.
n-active search forrth, fetal growthBesides the medicalwoman’s family andsuch as cigarette
Table 3.gives an overview of the various laboratory tests and examinations usedat the visits in antenatal care. At all visits hemoglobin, blood pressure,dipsticks for protein and glucose in urine, and symphysis-fundus measurementsare taken. In addition, several other tests are used, as outlined in figure 1.In this context, it should also be stressed that every visit to the antenatalclinic is used for health information and education and discussions about thepregnant woman’s general situation. The father is also encouraged toparticipate whenever possible.
Antenatal Care Attendance
In Sweden, antenatal care has a relatively long tradition, and attendance andacceptance of it arevery high. It is rare to find a pregnant woman who has nothad any antenatal care, and no pregnant woman could admit she had not visitedthe antenatal care clinic without getting reproaches from friends and familymembers for jeopardizing her own and her baby’s health. Most women are alsofamiliar with the antenatal clinics, as they may have visited them forcontraceptive advice or cervical cytological screening. As many as 85 percentof pregnant women register before the 14th week of pregnancy.
Comnents
The present organization and content of antenatal care in Sweden have theirroots in the 1970’s. In the early 1970’s, the organization and, to some extent,
IV-20
the content of care were evaluated by the National Board of Health and Welfare(1973). The concept of high-risk pregnancies was reinforced, and the idea ofspecial referral antenatal clinics was raised. Also, in the 1970’s,new methodsfor monitoring fetal growth, such as symphysis-fundus measurements andultrasound screening, were introduced and came into conmon use. Improvedmethods for biochemical and electronic monitoring during pregnancy and deliverywere also utilized on a broader basis, and the number of obstetricians engagedin antenatal care increased.
Another important factor in this context is the Swedish social insurance system.All Swedish citizens and foreign nationals resident in Sweden--adults andchildren--are insured under the National Insurance Act, which includesallowances for medical expenses, sickness benefits, parental insurance, andunemployment insurance as well. This means that no woman need deprive herselfof medical treatment, hospital care, or leave from work for economic reasons.
It is hard to determine to what extent these aforementioned changes toward thepresent organization and content of care have contributed to the continuousdecline in perinatal mortality in Sweden or to what extent they have increasedthe detection of’ high-risk pregnancies and transferal” of these cases toadequately equipped hospitals for care and delivery.
All studies examining possible causality of these shifts over time are bynecessity observational and have their weaknesses. It is irrefutable, however,that there have been decreasing rates of low birth weight infants and pretermbirths at the small’erand less equipped hospitals but not at the better equippedreferral hospitals (National Board of Health and Welfare, various years). Also,differences in perinatal mortality among primary catchment areas for varioustypes of hospitals (with and without pediatric departments), reported earlier(Falk and Wranne, 1973), have disappeared (Meirik, 1986). Thus, available datasuggest that improved detection of high-risk pregnancies may have had an impacton referral of these pregnancies, and the leveling out of mortality might alsobe a consequence of appropriate referral decisions.
Theoretically, the fine-meshed net for detection of high-risk pregnancies in thepresent Swedish antenatal care system should work with high sensitivity. On theother hand, this high sensitivity, or potentially high yield, might work withcorrespondingly low specificity, leading to unnecessary examinations and eveninterventions. On the whole, such a situation might create equal amounts ofharm and benefit. It is apparent, however, that through the system of referralantenatal care clinics, the diagnostic precision is increased. Thus, redundantand potentially harmful examinations and interventions are avoided in low-riskpregnancies.
References
Alberman, E. 1980. Prospects for better perinatal health. Lancet 1:189-92.
Falk, V., and Wranne, L. 1973. Perinatal mortality in Oerebro County, 1969-1971. Ltikartidningen 10:2539-41. In Swedish.
Hein, H. 1982. Secrets-from Sweden. JAMA 247:984-5:-
IV-21
Meirik, O. 1986. Effects of Centralized Obstetrical Care. In Care Before,During and After Delivery. PM 151/86. Stockholm: National Board of Health andWelfare. In Swedish.
National Board of Health and Welfare. 1973. Organization of obstetrical care.AB Allm~nna Fdrlaget. Stockholm. In Swedish.
National Board of Health and Welfare. Various years. Medical BirthRegistration 1973-74, Statistical Reports HS: 1977:6; Medical BirthRegistration 1975-76, Statistical Reports HS: 1980:2; Medical BirthRegistration 1977-78, Statistical Reports HS: 1981:2; Medical BirthRegistration 1979-80, Statistical Reports HS: 1983:4; National Central Bureauof Statistics, Stockholm, 1977, 1980, 1981, 1983.
Rooth, G..1979. Better perinatal health, Sweden. Lancet 2:1170-2.
IV-22
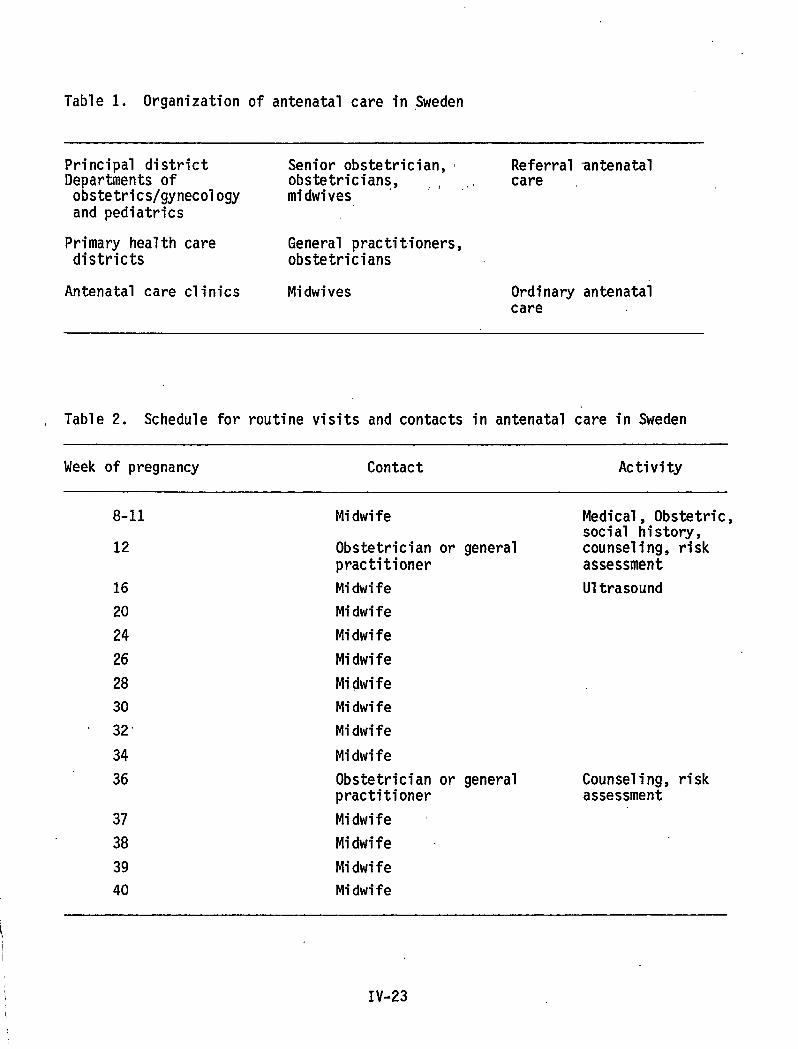
Table 1. Organization of antenatal care in $weden
Principal district Senior obstetrician, Referral antenatalDepartments of obstetricians, ,, ,, careobstetrics/gynecology midwivesand pediatrics
Primary health care General practitioners,districts obstetricians
Antenatal care clinics Midwives Ordinary antenatalcare
, Table2. Schedule for routine visits and contacts in antenatal care in Sweden
Week of pregnancy Contact Activity
8-11 Midwife Medical, Obstetric,social history,
12 Obstetrician or general counseling, riskpractitioner assessment
16 Midwife Ultrasound
20 Midwife
24 Midwife
26 Midwife
28 Midwife
30 Midwife
32“ Midwife
34 Midwife
36 Obstetrician or general Counseling, riskpractitioner assessment
37 Midwife ~
38 Midwife
39 Midwife
40 MidwifeI
\ IV-23
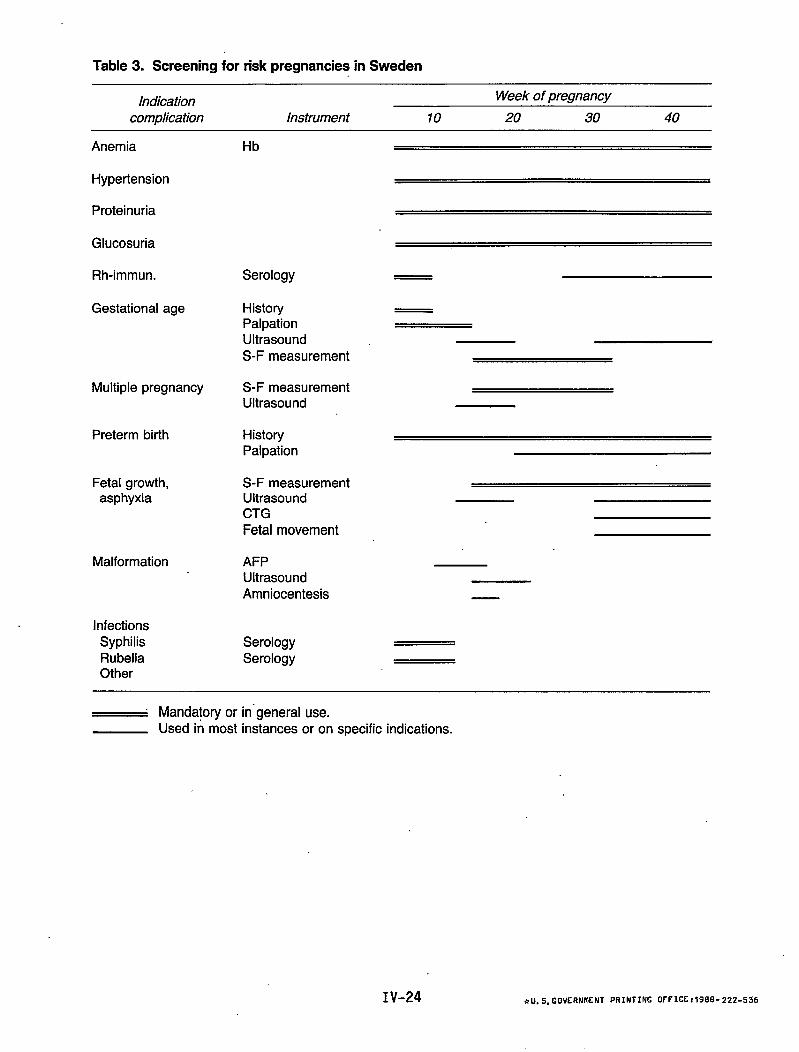
Table 3. Screening for risk pregnancies in Sweden
IndicationWeek of pregnancy
complication Instrument 10 20 30 40
Anemia
Hypertension
Proteinuria
Glucosuria
Rh-immun.
Gestational age
Multiple pregnancy
Preterm birth
Fetal growth,asphyxia
Malformation
InfectionsSyphilisRubellaOther
Hb
Serology
HistoryPalpationUltrasoundS-F measurement
S-F measurementUltrasound
HistoryPalpation
S-F measurementUltrasoundCTGFetal movement
AFPUltrasoundAmniocentesis
SerologySerology
~ Mandatory or in”general use.Used in most instances or on specific indications.
IV-24 *u. S. GoVERNMNT PRINTING fJf FICC:1988- 222-536

DEPARTMENT OF HEALTH ANDHUMAN SERVICESPublic Health ServiceCenters for Disease ControlNational Center for Health Statistics3700 East-West HighwayHyattsville, Maryland 20782
OFFICIAL BUSINESSPENALTY FOR PRIVATE USE, $300
DHHS Publication No. (PHS)88-1252-I