proceedings of the 2016 wisconsin crop management conference
TRANSCRIPT

Proc. of the 2016 Wisconsin Crop Management Conference, Vol. 55 i
Proceedings of the 2016 Wisconsin Crop Management Conference
12-14 January 2016 Exposition Hall, Alliant Energy Center
Madison, Wisconsin
Program Co-Chairs:
Matthew D. Ruark Shawn P. Conley Department of Soil Science Department of Agronomy
Cooperative Extension
University of Wisconsin-Extension and
College of Agricultural and Life Sciences University of Wisconsin-Madison
Appreciation is expressed to the Wisconsin fertilizer industry for the support provided through the Wisconsin Fertilizer Research Fund for research conducted by faculty within the University of Wisconsin System. The assistance provided by Carol Duffy and Geoff Siemering in preparation of this document is appreciated.
THESE PROCEEDINGS ARE AVAILABLE ONLINE IN A SEARCHABLE FORMAT AT: http://www.soils.wisc.edu/extension/wcmc/
“University of Wisconsin-Extension, U.S. Department of Agriculture, Wisconsin counties cooperating and providing equal opportunities in employment and programming including Title XI requirements.”

Proc. of the 2016 Wisconsin Crop Management Conference, Vol. 55 ii

Proc. of the 2016 Wisconsin Crop Management Conference, Vol. 55 iii
2016 Wisconsin Agri-Business Association Distinguished Service Awards
Distinguished Organization Award Insight FS
{For Exemplary Industry Professionalism}
Education Award Mike Wang, Milwaukee Inspection Service
{For Leadership & Commitment to Educational Excellence}
Outstanding Service to Industry Pat Murphy, USDA-NRCS
{For Dedication & Support to WABA and Its Members}
Friend of WABA Award Senator Terry Moulton
{Wisconsin Senate}
Board Member Service Award Bruce Andersen, Bio Gro Inc.
{For Full-Term Board of Director Service}
President’s Service Award Scott Firlus, Allied Cooperative
{For Dedication, Service, & Leadership}

Proc. of the 2016 Wisconsin Crop Management Conference, Vol. 55 iv
2015 – 2016 Scholarship Recipients
Wisconsin Crop Production Association Scholarships
Lauren Baker Jenna Hershberger
UW-Madison
Mikayla Horstman UW-Platteville
Jacob Zwiefelhofer UW-River Falls
Brent T. Levash
UW-Stevens Point
Brittany Wethal Southwest Wisconsin Tech
April Lake
Chippewa Valley Tech
Sara Eberhardt Western Wisconsin Tech
Casey L. Pietz
Heidi J. Meverden North Central Tech
Wisconsin FFA Foundation
Trent Dado Taylor Thoeny Kelly Wilfert
Grace Skarlupka
Mike Turner Memorial Scholarship
Hanna Sorenson Hann Vassar
Fox Valley Technical College

Proc. of the 2016 Wisconsin Crop Management Conference, Vol. 55 v
TABLE OF CONTENTS Papers are in the order of presentation at the conference. Not all speakers submitted a paper; thus their presentations are not listed here. TITLE/AUTHORS PAGE
SOIL AND WATER MANAGEMENT How Soil Erosion Impacts Farm Productivity and What to Do About It Francisco Arriaga………………………………………………………………… 1 Technologies in Tile Drainage Water Treatment Eric Cooley and Matt Ruark…………………………………………………….. 2 Extreme Rainfall and Soil Erosion Bill Bland………………………………………………………………………… 9 Updates to Wisconsin Soil Survey Jason Nemecek and Judy Derricks………………………………………………. 11 El Nino’s Influences in Global and Midwestern Climates Bill Bland………………………………………………………………………… 12
SEEDS AND TRAITS
The RNAi Pipeline Greg Heck…………………………………………………………………………. 14 Revamping Soybean Nutrient Uptake Partitioning, and Removal Data with Modern High Yielding Genetics and Production Practices Adam P. Gaspar, Carrie A.M. Laboski, Seth L. Naeve, and Shawn P. Conley……………………………………………………………… 15 Do More Inputs Increase Soybean Yield and Profitability? David A. Marburger, Bryson J. Haverkamp, Randy G. Laurenz, John M. Orlowski, Eric W. Wilson, Shaun N. Casteel, Chad D. Lee, Seth L. Naeve, Emerson D. Nafziger, Kraig L. Roozeboom, William J. Ross, Kurt D. Thelen, and Shawn P. Conley……………………………………………. 16 Capitalizing on the Rotation Effect to Increase Yield Joe Lauer, Maciek Kazula, and Thierno Diallo…………………………………… 22
WEED MANAGEMENT Herbicide Resistance Update in Wisconsin Devin Hammer, Nathan Drewitz, Vince Davis, Shawn Conley, and Dave Stoltenberg………………………………………………………………….. 25
Proc. of the 2016 Wisconsin Crop Management Conference, Vol. 55 vi
TITLE/AUTHORS PAGE Spread of Herbicide Resistant Weeds in Illinois – and – Factors That Prevent Presence of Herbicide Resistance in Illinois Fields Aaron Hager…………………………………………………………………….. 29 Herbicide Resistant Weed Seedbank Dynamics Influenced by Crop Rotation? The Value of Alfalfa as a Tool Jared J. Goplen………………………………………………………………….. 30
GRAIN MANAGEMENT
Basic Grain Marketing Workshop and Market Outlook Brian Rydlund……………………………………………………………………. 32 Grain Quality – Things to Remember When Storing/Handling the 2015 Crop Nick Friant……………………………………………………………………….. 33 GMO 101: Facts to Educate You and Help You to Educate Others About GMO Crops and Food Travis Frey……………………………………………………………………….. 34
MANURE AND FERTILIZER
Controlling Nutrient Loss Amber Radatz……………………………………………………………………. 36 A New Tool for Estimating Phosphorus Loss from Cattle Barnyards and Outdoor Lots Peter Vadas, Laura Good, John Panuska, Dennis Busch, and Rebecca Larson…………………………………………………………………. 39 Manure on Perennial Forages: Benefits and Challenges Bill Jokela……………………………………………………………………….. 45 Evaluating N Loss After Heavy Rainfall Carrie A.M. Laboski…………………………………………………………….. 51 Base Saturation: What Is It? Should I Be Concerned? Does It Affect My Fertility Program? Adam P. Gaspar and Carrie A.M. Laboski……………………………………… 55
FORAGES AND COVER CROPS
Sorghum as a Forage in Wisconsin Elizabeth Remick, Matt Akins, Huawei Su, and Wayne Coblentz……………... 63 Forage Harvest Process Time Motion Analysis and Optimization Brian D. Luck and Joshua Harmon……………………………………………… 67 Reduced Lignin Alfalfa Yoana C. Newman and Veronica Justen……………………………………….. 69

Proc. of the 2016 Wisconsin Crop Management Conference, Vol. 55 vii
TITLE/AUTHORS PAGE Connecting the Agronomist and the Nutritionist to Make Management Decisions Randy Shaver…………………………………………………………………… 73 Do Cover Crops Increase or Decrease Crop Yields? Matt Ruark……………………………………………………………………… 74 Interseeding Cover Crops into Corn in Wisconsin Daniel H. Smith, Matt Ruark, Francisco Arriaga, and Mark Renz……………… 75
DISEASE MANAGENET Integrated Management of Soybean Sudden Death Syndrome Daren Mueller……………………………………………………………………. 78 Integrated Management of White Mold of Soybean Jaime Willbur, Chris Bloomingdale, Scott Chapman, Medhi Kabbage, and Damon L. Smith…………………………………………………………….. 79 2015 Wisconsin Plant Disease Update Anette Phibbs, Susan Lueloff and Adrian Barta………………………………… 84 Winter Wheat Disease Management: Lessons from 2015 Brian Mueller, Scott Chapman, Chris Bloomingdale, and Damon Smith……….. 86 Fungicide Resistance in Field Crops Daren Mueller……………………………………………………………………. 91 Managing Corn Diseases in Wisconsin Damon L. Smith, Scott Chapman, Brian Mueller, and Chris Bloomingdale…….. 93
AGRIBUSINESS MANAGEMENT
Business Code of Ethics Workshop Jeff Brandenburg………………………………………………………………… 96
VEGETABLE CROPS Snap Bean Insect Pest Management Russell Groves………………………………………………………………….. 97 Integrated Weed Management in Carrot Production Jed Colquhoun, Richard Rittmeyer, and Daniel Heider………………………… 98 Fine-tuning Nitrogen Recommendations for Sweet Corn Matt Ruark……………………………………………………………………… 99 White Mold Management Update in Processing Snap Beans Amanda Gevens and Stephen Jordan …………………………………………… 102

Proc. of the 2016 Wisconsin Crop Management Conference, Vol. 55 viii
TITLE/AUTHORS PAGE
NITROGEN AND NUTRIENT MANAGEMENT Government Panel on Nutrient Management Sara Walling, Judy Derricks, Joe Baeten – Panel………………………………. 106 Fertilizer Outlook Joe Dillier……………………………………………………………………….. 107 Implementing Adaptive Nutrient Management as Part of a 590 Plan Carrie A.M. Laboski…………………………………………………………….. 110
INSECT MANAGEMENT Managing Dry Grain in Storage Scott Sanford……………………………………………………………………. 114 Managing Insect Pests in Stored Grains P.J. Liesch………………………………………………………………………. 117 2015 Wisconsin Plant Insect Updates Krista Hamilton…………………………………………………………………. 118 Corn Rootworm Resistance Management Bryan Jensen……………………………………………………………………. 122 ECB 101: Managing ECB in the Absence of Traits Bryan Jensen……………………………………………………………………. 125
ECONOMICS AND TECHNOLOGY U2U Based Decision Tools Chad Hart……………………………………………………………………….. 127
POLLINATORS Pollinator Program Update Elizabeth Meils, Mike Dummer, and Mike Murray…………………………….. 128

HOW SOIL EROSION IMPACTS FARM PRODUCTIVITY AND WHAT TO DO ABOUT IT
Francisco J. Arriaga 1/
Soil erosion continues to be a significant issue that affects farm productivity. Impacts of soil erosion on soil productivity are short- and long-term. Short-term, plant nutrient losses lower the fertility of the land, requiring additional fertilizer inputs to correct the decreased soil fertility. As soil erodes the depth of the soil profile is reduced, effectively decreasing the volume of soil crop roots have to explore for water and nutrients, which causes long-term productivity concerns. Both of these short- and long-term concerns are highlighted by the renewed interest in practices that promote soil health, such as reduced tillage, crop rotations, and cover crops. The Universal Soil Loss Equation (USLE), now the RUSLE2, can be used as a framework to explain the complexities of production fields, erosion and impacts of management practices. The USLE is defined as;
Soil loss in tons per acre = R x K x LS x C x P where R is the erosivity of rainfall, K is the erodibility of the soil, L is slope length, S the slope pitch (angle), C is the cropping factor which includes crop rotation and tillage type, and P is other crop management practices. Of these six factors, we can mainly control the cropping factor (C) and the other management practices factor (P). Tillage practices and use of cover crops are two examples of management factors that affect crop productivity and erosion short- and long-term. This presentation will focus on short- and long-term impacts of erosion on crop yields and management options that can help reduce soil erosion and increase productivity in Wisconsin. ___________________________ 1/ Assistant Professor and Extension Soils Specialist, Dept. of Soil Science, Univ. of Wisconsin-Madison, 1525 Observatory Dr., Madison, WI 53706.
Proc. of the 2016 Wisconsin Crop Management Conference, Vol. 55 1

TECHNOLOGIES IN TILE DRAINAGE WATER TREATMENT
Eric Cooley and Matt Ruark1/ Tile-drained agricultural land must be well-managed to reduce the loss of nutrients to surface waters. Nutrient management practices must be carefully followed to minimize the risk of nutrient loss and to maximize fertilizer use efficiency. This is of particular importance to farmers, as this water can also transport essential plant nutrients, specifically nitrogen and phosphorus, out of the root zone. Once nutrients reach the tile drain, they have a direct conduit to surface waters. Emerging technologies in drainage water treatment can mitigate nutrient transport from tile drainage systems. Some of these technologies include drainage water management, constructed wetlands, bioreactors, and saturated buffers. The information provided will briefly assess the cost and effectiveness of nitrogen and phosphorus removal of these tile drainage treatment options.
Drainage Water Management Drainage water management is the practice of controlling water table elevation to desired levels throughout the year to retain water and nutrients in the soil profile (Fig. 1). Water level control structures are used to maintain the water level higher in the soil profile after crops are removed to minimize nitrogen loss, predominantly in nitrate form, to surface water. The control elevation is then lowered in the spring to remove excess water from the soil profile and to allow the soil to dry out for field access and planting. Once crops are planted, the control elevation is often raised to hold the water level closer to the root zone (a practice known as subsurface irrigation), especially for crops that are prone to drought stress. Once crops are removed, the control elevation is raised farther to store more water and to prevent nutrient loss until spring. Additional information on drainage water management can be found in Drainage water management for the Midwest: Questions and answers about drainage water management for the Midwest.
Figure 1. Drainage water management controlling water table elevation (Frankenberger et al., 2006).
______________________
1/ Co-Director, Univ. of Wisconsin Discovery Farms, 1150 Bellevue St., Green Bay, WI 54302 and Associate Professor, Dept. of Soil Science, Univ. of Wisconsin-Madison, Madison, WI 53706, respectively.
The outlet is raised after harvest to reduce nitrate delivery.
The outlet is lowered a few weeks before planting and harvest to allow the field to drain more fully.
The outlet is raised after planting to potentially store water for crops.
Proc. of the 2016 Wisconsin Crop Management Conference, Vol. 55 2

Water table management in many of Wisconsin’s tile-drained landscapes is limited by the slope of the land. Slopes of less than ½% are suitable for drainage control structures to be practical. Slopes greater than ½% will only allow for drainage control on a small portion of the land surface and may result in high fluid head pressures in tile systems and tile blowouts. Many of Wisconsin’s tile-drained landscapes have 2 to 6% slopes. New technologies allow for infield drainage control for lands with higher slopes (AgriDrain - Water GatesTM). This type of system has two benefits: It is installed underground so as not to interfere with field operations, including deep tillage, and it can be “stair-stepped” to control drainage on higher sloped land up to 2% (Fig. 2). The level in each of the structures is controlled by the downstream water control structure located either at a field boundary or tile outlet.
Figure 2. AgriDrain - Water GatesTM “stair-stepped” controlled drainage (Image courtesy of AgriDrain, Adair, IA).
Constructed Wetlands
Constructed wetland treatment of tile drainage flow has been shown to be effective for nitrogen and phosphorus removal (Fisher and Acreman, 2004; Jin et al., 2002), but there are many limitations with this practice (Miller et al., 2002). Constructed wetlands have also been shown to reduce biochemical oxygen demand (BOD) that can contribute to decreased dissolved oxygen levels, which can be detrimental to aquatic life (Jin et al., 2002; Lee et al., 2004). Additionally, total coliform and E. Coli bacteria concentrations have undergone significant reductions, over 90% concentration reduction, with constructed wetland treatment (Jin et al., 2002).
Reported phosphorus removal and nitrogen concentration reductions vary due to a number of factors, including system design, retention time, and local climatic and physical conditions. Temperature effects on microbial activity may have large influence on nitrogen removal capacity, especially in the cold temperature extremes of the northern regions, such as Wisconsin (Jin et al., 2002). The total phosphorus removal potential of constructed wetlands is limited and highly dependent on the nature of materials used for construction. In fact, during constructed wetland establishment, increases of ammonium nitrogen, dissolved reactive phosphorus, and total phosphorus have been seen in wetland effluent (Tanner et al., 2005).
Constructed wetlands are engineered to develop optimal physical, biological, and chemical conditions to mimic treatment properties of natural wetland systems. The aerobic water portion
Proc. of the 2016 Wisconsin Crop Management Conference, Vol. 55 3
and upper layers of sediment carry out the formation of insoluble P-metal precipitates and allow for nitrification. The anaerobic, underlying layers of sediment support denitrification and ammonification. It has been shown that constructed wetlands will often have less diverse vegetation, large deviations in water chemistry, and will likely respond differently to environmental stresses such as drought which can affect nutrient removal capabilities (Hunt, 2001). Vegetation is important to constructed wetland systems by encouraging sedimentation, providing a carbon source for denitrification, and controlling sediment oxygen.
Wetland shape has a large effect on residence time, thus treatment efficiency (Worman and Kronnas, 2005). Additionally, vegetation and bottom roughness are additional factors in residence times. It is important to design wetlands to prohibit channeling of flow. Wide wetlands tend to form a central channel that dominates residence times. In one study, a narrow wetland was three times more effective of nitrogen removal as a wide wetland (Worman and Kronnas, 2005). Wetlands can be designed using several parallel ponds or using several inlets and outlets on a single pond to maximize residence times and treatment efficiency of nitrogen.
Conversely for particulate matter and phosphorus, wetland efficiency increases with surface area and increased hydraulic load or sediment input, with exception of extreme episodes (Braskerud et al., 2000). The depth of settling ponds may have little to no influence on sedimentation and shallow wetlands have small settling distance and best efficiency. Relative surface area of constructed sedimentation wetlands for one study on silty clay loam soils was 0.03 to 0.07% of the watershed with detention times of 2 to 10 hours and retention of particles of 8 to 23% respectively (Braskerud et al., 2000).
Phosphorus reductions in constructed wetlands can be initially high, but as concentration build in wetland sediments, higher effluent concentrations can occur especially under low influent phosphorus concentrations (Dunne et al., 2005). High initial removal of phosphorus can also be attributed to microbial vegetation uptake, but both processes are exhausted quickly (Jaimeson et al., 2002). Sharp declines in phosphorus removal efficiency can be observed after 2 to 5 years (Drizo et al., 1999; Kadlec and Knight, 1996) with total phosphorus saturation at 8 years (Jaimeson et al., 2002). Sedimentation of constructed wetlands can severely limit nutrient removal and can occur in 8 to 20 years of installation (Braskerud et al., 2000).
Phosphorus sorption capacity of constructed wetlands varied considerably for different substrates (Xu et al., 2006). Chemical composition as well as grain size effect phosphorus sorption capacity. Fine grain sizes have increased surface areas thus enhanced phosphorus sorption. Organic matter accumulation decreased phosphorus sorption capacity as substrate pores are clogged by the organic matter. Shallow reservoirs with calcareous clay loam substrate have shown to effectively remove soluble phosphorus from overlying floodwaters (Reddy and Graetz, 1981). Water flowing through peat land has removed orthophosphate and total phosphorus up to 100% (Kellog and Bridgeham, 2003). Phosphorus can be precipitated and adsorbed by reactions with calcium, aluminum and iron (Jaimeson et al., 2002; Zhu et al., 1997). A possible source of calcium is milk house waste.
Denitrification, a form of anaerobic bacterial respiration, produces nitrous oxide which is a greenhouse gas. Anaerobic respiration tends to preclude and inhibit methanogenesis due to the competitive superiority of denitrifiers and sulfate reducers (Conrad, 1996). It is possible that nitrate removal is not only due to respiratory denitrification, but conversion to ammonium (Whitmire and Hamilton, 2005). Reported nitrate removal rates were observed in 5 to 20 hours and were rate dependent on concentration (Whitmire and Hamilton, 2005).
Proc. of the 2016 Wisconsin Crop Management Conference, Vol. 55 4

A main consideration for constructed wetland treatment is the removal of large amounts of land out of production that may be required for effective treatment sizing.
Bioreactors The following italicized text is an excerpt from Conservation Drainage for the Midwest web site: https://engineering.purdue.edu/watersheds/conservationdrainage/bioreactors.html Bioreactors are essentially subsurface trenches filled with a carbon source, mainly wood chips, through which water is allowed to flow just before leaving the drain to enter a surface water body. The carbon source in the trench serves as a substrate for bacteria that break down the nitrate through denitrification or other biochemical processes. Bioreactors provide many advantages:
• They use proven technology • They require no modification of current practices • No land needs to be taken out of production • There is no decrease in drainage effectiveness • They require little or no maintenance • They last for up to 20 years
How do bioreactors work? Organisms from the soil colonize the woodchips. Some of them break down the woodchips into smaller organic particles. Others “eat” the carbon produced by the woodchips, and “breathe” the nitrate from the water. Just as humans breathe in oxygen and breathe out carbon dioxide, these microorganisms breathe in nitrate and breathe out nitrogen gas, which exits the bioreactor into the atmosphere. Through this mechanism, nitrate is removed from the tile water before it can enter surface waters.
Figure 3. Nitrate in tile drainage water is converted to nitrogen gas by bacteria in the bioreactor. The wood chips provide habitation and food source for bacteria (Laura Christianson, Iowa State University Ph.D. candidate, 2012).
Multiple studies indicate ranges of effectiveness of bioreactors between 15 - 80 percent of the annual nitrate load (Christianson, L. and M. Helmers. 2011; Janes et al., 2009). A bioreactor design program has been developed by R. Cooke and N.L. Bell at University of Illinois, and is available at: http://www.wq.illinois.edu/dg/
Proc. of the 2016 Wisconsin Crop Management Conference, Vol. 55 5
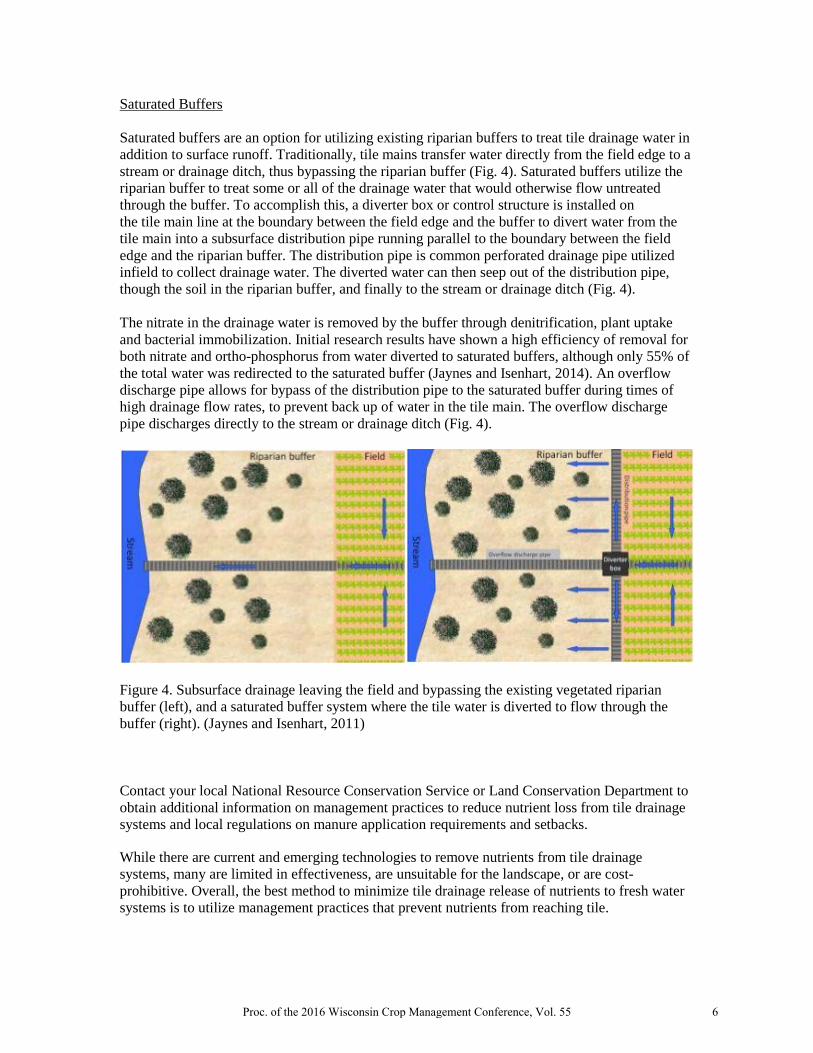
Saturated Buffers Saturated buffers are an option for utilizing existing riparian buffers to treat tile drainage water in addition to surface runoff. Traditionally, tile mains transfer water directly from the field edge to a stream or drainage ditch, thus bypassing the riparian buffer (Fig. 4). Saturated buffers utilize the riparian buffer to treat some or all of the drainage water that would otherwise flow untreated through the buffer. To accomplish this, a diverter box or control structure is installed on the tile main line at the boundary between the field edge and the buffer to divert water from the tile main into a subsurface distribution pipe running parallel to the boundary between the field edge and the riparian buffer. The distribution pipe is common perforated drainage pipe utilized infield to collect drainage water. The diverted water can then seep out of the distribution pipe, though the soil in the riparian buffer, and finally to the stream or drainage ditch (Fig. 4). The nitrate in the drainage water is removed by the buffer through denitrification, plant uptake and bacterial immobilization. Initial research results have shown a high efficiency of removal for both nitrate and ortho-phosphorus from water diverted to saturated buffers, although only 55% of the total water was redirected to the saturated buffer (Jaynes and Isenhart, 2014). An overflow discharge pipe allows for bypass of the distribution pipe to the saturated buffer during times of high drainage flow rates, to prevent back up of water in the tile main. The overflow discharge pipe discharges directly to the stream or drainage ditch (Fig. 4).
Figure 4. Subsurface drainage leaving the field and bypassing the existing vegetated riparian buffer (left), and a saturated buffer system where the tile water is diverted to flow through the buffer (right). (Jaynes and Isenhart, 2011) Contact your local National Resource Conservation Service or Land Conservation Department to obtain additional information on management practices to reduce nutrient loss from tile drainage systems and local regulations on manure application requirements and setbacks.
While there are current and emerging technologies to remove nutrients from tile drainage systems, many are limited in effectiveness, are unsuitable for the landscape, or are cost-prohibitive. Overall, the best method to minimize tile drainage release of nutrients to fresh water systems is to utilize management practices that prevent nutrients from reaching tile.
Proc. of the 2016 Wisconsin Crop Management Conference, Vol. 55 6

A series of three fact sheets on tile drainage are available for download at Discover Farms and The Learning Store websites.
Tile drainage in Wisconsin:
1. Understanding and locating tile drainage systems (Ruark et al., 2009) 2. Maintaining tile drainage systems (Panuska et al., 2009) 3. Managing Tile-Drained Landscapes to Prevent Nutrient Loss (Cooley et al., 2013)
References Braskerud, B.C., H. Lundekvam, and T. Krogstad. 2000. The impact of hydraulic load and
aggregation on sedimentation of soil particles in small constructed wetlands. J. Environ. Qual. 29:2013-2020.
Christianson, L., and M. Helmers. 2011. Iowa State Univ. Ext. Publ. PMR 1008. http://www.leopold.iastate.edu/sites/default/files/pubs-and-papers/2011-11-woodchip-bioreactors-nitrate-agricultural-drainage.pdf
Conrad, R. 1996. Soil microorganism as controllers of atmospheric trace gasses (H2, CO, CH4, OCS, N2O and NO). Microbiol. Rev. 60:609-640.
Cooley, E.T., M.D. Ruark, and J.C. Panuska. 2013. Tile drainage in Wisconsin: Managing tile-drained landscapes to prevent nutrient loss: Univ. of Wisconsin-Extension Publ. GWQ064. http://learningstore.uwex.edu/Assets/pdfs/GWQ064.pdf.
Drizo, A., C.A. Frost, J. Grace, and K.A. Smith. 1999. Physico-chemical screening of phosphate removing substrates for use in constructed wetland systems. Water Res. 33:3595-3602.
Dunne, E.J., N. Culleton, G. O’Donovan, R. Harrington, and K. Daly. 2005. Phosphorus retention and sorption by constructed wetland soils in Southeast Ireland. Water Res. 39:4355-4362.
Fisher, J., and M.C. Acreman. 2004. Wetland nutrient removal: a review of the evidence. Hydrol. Earth Syst. Sci. 8:673-685.
Frankenberger, J., E. Kladivko, G. Sands, D. Jaynes, N. Fausey, M. Helmers, R. Cooke, J. Strock, K. Nelson, and L. Brown. 2006. Drainage water management for the Midwest: Questions and answers about drainage water management for the Midwest. Purdue Extension Publ. WQ-44. https://www.extension.purdue.edu/extmedia/wq/wq-44.pdf
Hunt, R.J. 2001. Do created wetlands replace the wetlands that are destroyed? USGS Fact Sheet FS-246-96. 4 p.
Jamieson, T.S., G.W. Stratton, R. Gordon, and A. Madani. 2002. Phosphorus adsorption characteristics of a constructed wetland soil receiving dairy farm waste water. Can. J. Soil Sci. 82:97-104.
Jaynes. D.B., and T.M. Isenhart. 2014. Reconnecting tile drainage to riparian buffer hydrology for enhanced nitrate removal. J. Environ. Qual. 43:631-638.
Proc. of the 2016 Wisconsin Crop Management Conference, Vol. 55 7
Jaynes. D.B., and T.M. Isenhart. 2011. Re-saturating riparian buffers in tile drained landscapes. IAMN-SD Drainage Research Forum, 22 Nov. 2011, Okoboji, IA.
Jaynes, D.B., T.C. Kaspar, T.B. Moorman, and T.B. Parkin. 2008. In situ bioreactors and deep drain-pipe installation to reduce nitrate losses in artificially drained fields. J. Environ. Qual. 37:429-436.
Jin, G., T. Kelley, M. Freeman, and M. Callahan. 2002. Removal of N, P, BOD5 and coliform in pilot-scale constructed wetland systems. Internatl. J. Phytoremed. 4:127-141.
Kadlec, R.H., and R.L. Knight. 1996. Treatment wetlands. Lewis-CRC Press, Boca Raton, FL. 893 p.
Kellogg L.E., and S.D. Bridgham. 2003. Phosphorus retention and movement across an ombrotrophic-minerotrophic peatland gradient. Biogeochemistry 63:299-315.
Lee, C.Y., C.C. Lee, F.Y. Lee, S.K. Tseng, and C.J. Liao. 2004. Performance of subsurface flow constructed wetland taking pretreated swine effluent under heavy loads. Bioresource Tech. 92:173-179.
Miller, P.S., J.K. Mitchell, R.A. Cooke, and B.A. Engel. 2002. A wetland to improve agricultural subsurface drainage water quality. Trans. ASAE 45:1305-1317.
Panuska, J.C., M.D. Ruark, and E.T. Cooley. 2009. Tile drainage in Wisconsin: Maintaining tile drainage systems. Univ. of Wisconsin-Extension Publ. GWQ056. http://learningstore.uwex.edu/Assets/pdfs/GWQ056.pdf.
Reddy, K.R., and D.A. Graetz. 1981. Use of shallow reservoir and flooded organic soil systems for wastewater treatment: nitrogen and phosphorus transformations. J. Environ. Qual. 10:113-119.
Ruark, M.D., J.C. Panuska, E.T. Cooley, and J. Pagel. 2009. Tile drainage in Wisconsin: Understanding and locating tile drainage systems. Univ. of Wisconsin-Extension Publ. GWQ054. http://learningstore.uwex.edu/Assets/pdfs/GWQ054.pdf.
Tanner, C.C., M.L. Nguyen, and J.P.S. Sukias. 2005. Nutrient removal by a constructed wetland treating subsurface drainage from grazed dairy pasture. Agric., Ecosyst. Environ. 105:145-162.
Whitmire, S.L., and S.K. Hamilton. 2005. Rapid removal of nitrate and sulfate in freshwater wetland sediments. J. Environ. Qual. 34:2026-2071.
Worman, A., and V. Kronnas. 2005. Effect of pond shape and vegetation heterogeneity on flow and treatment performance of constructed wetlands. J. Hydrol. 301:123-138.
Xu, D., J. Xu, J. Wu, and A. Muhammad. 2006. Studies on the phosphorus sorption capacity of substrates used in constructed wetland systems. Chemosphere. 63:344-352.
Zhu, T., T. Jenssen, T. Maelum, and T. Krogstad. 1997. Phosphorus sorption and chemical characteristics of lightweight aggregates (LWA) - potential filter media in treatment wetlands, Water Sci. Technol. 35:103-108.
Proc. of the 2016 Wisconsin Crop Management Conference, Vol. 55 8

EXTREME RAINFALL AND SOIL EROSION William L. Bland 1
Introduction Precipitation matters a lot for agriculture. The right amounts of rainfall at the right times
work in concert with the water holding capacity of the soil to provide crop plants with the water they need to be productive. The agricultural crops and practices of a place evolve to make the most of the local precipitation. Many factors about how this precipitation arrives matter: annual amount, seasonal amounts, duration of rain-free periods, number of rain days, and the nature of the heaviest rainfall events. The heaviest rainfalls lead to flooding and the potential for great soil erosion damage.
As Earth’s atmosphere warms—as we know it is—more water vapor can be held there, available to fall as precipitation. This increase in the amount of water held in the atmosphere is happening, at about the rate expected. And, also as expected, the annual precipitation over the whole Earth is increasing (about 0.09”/decade) as well as over the contiguous US (about 0.15”/decade) (EPA, 2015).
Changes to precipitation go beyond the average annual amount. It seems that more of the precipitation that falls on a place now comes within the heaviest events — those days of very heavy rainfalls—than did some decades ago. The heaviest rainfall days (and stretches of days) of a year or decade are often the most damaging for flooding and soil erosion.
A recent analysis (Wu 2015) of daily rainfall records for the lower 48 states of the US revealed increases in total amount, frequency of precipitation days, average intensity, and the fractions of the precipitation that fell in the 5% most intense days (Table 1). The results show that it is the heaviest rainfall events that bring the increased annual precipitation, and that spring and summer bring the most new heavy rain. (The change in heavy winter precipitation is large in % terms, but smaller than the other in terms of actual water.)
Soil erosion is a key concern for farmers and conservationists, and this process is very sensitive to rainfall intensity. We can assess how changing precipitation patterns in Table 1 might influence soil erosion using models such as RUSLE2, the erosion prediction model that is part of SNAP-PLUS. Among the inputs that this model requires are annual precipitation, erosivity (a measure of rainfall intensity at a place), and the size of the “10-yr, 24-hour” storm (the amount of
Professor, Dept. of Soil Science, University of Wisconsin-Madison and Extension Soil and 1
Water conservation Specialist, UWEx
Period Total Light Moderate Heavy
(%/decade) (%/decade) (%/decade) (%/decade)
Annual 2.1 1.0 1.3 4.4
Spring 2.7 0.1 1.1 8.3
Summer 0.8 0.0 0.2 2.6
Fall 2.6 1.6 1.6 5.3
Winter 3.7 1.2 2.8 7.5
Table 1. Changes to Total precipitation, and the fractions in the light, moderate, and heaviest days (from Wu 2015).
Proc. of the 2016 Wisconsin Crop Management Conference, Vol. 55 9

rain that we should expect in a 24-hour period, at a 10% probability of occurring in any year). A recent analysis of this for a watershed in Iowa showed how sensitive soil erosion is to rainfall (Table 2) (Dabney et al. 2012). We can see that the soil loss can increase by a factor of 1.5 if all four parameters increase. Such increases are expected in the coming decades.
In summary, warming of Earth’s atmosphere has increased the amount of water vapor that it holds, and this has increased precipitation for the region, the US as a whole, and globally. Additionally, precipitation is arriving in more intense events, increasing the possibilities for soil erosion and flooding. As a result we must redouble our efforts at good soil erosion control to maintain and improve this key part of agricultural management for environmental quality.
REFERENCES EPA 2015. http://www3.epa.gov/climatechange/science/indicators/weather-climate/
precipitation.html Dabney, S.M., D.C. Yoder, and D.A.N. Vieira. 2012. The application of the Revised Universal
Soil Loss Equation, Version 2, to evaluate the impacts of alternative climate change scenarios on runoff and sediment yield. Journal of Soil and Water Conservation 67(5): 343–353.
Wu, S.-Y. 2015. Changing characteristics of precipitation for the contiguous United States. Climatic Change 132(4): 677–692.
Sediment Yield Soil Loss Runoff
Scenario (% change)
P+10% 1.18 1.7 1.26
andE+10%
1.33 1.33 1.32
andS10-y, 24-hr+10%T+10%
1.46 1.47 1.33
Table 2. The effects of three precipitation pattern changes to soil erosion and runoff in an Iowa watershed for a 10% increase in annual precipitation (P), a 10% increase in erosivity (E), and 10% changes in a 10-y, 24-hour storm (S, and temperature (T). (after Dabney, et al. 2012)
Proc. of the 2016 Wisconsin Crop Management Conference, Vol. 55 10

UPDATES TO WISCONSIN SOIL SURVEY
Jason Nemecek and Judy Derrick 1/ Soil Survey interpretations predict soil behavior for specific soil uses. The soil survey is used to assist in planning of broad categories of land use and specific management practices that are applied to soils such as nutrient management. As with everything we do in conservation planning, the most critical piece of using soil survey products is making sure we are recording observable site specific criteria along with the predictive models. Each year soil science is updated based on additional studies and efforts to make a uniform quality product. In recent years, the Soil Data Join Recorrelation (SDJR) has been instrumental in making sure there is uniformity across county and state lines. As a result of this effort, there have been changes to the T (maximum tolerable soil loss that sustains crop productivity) and K (Soil’s susceptibility to erosion). The purpose behind updates to the Soil Survey is to provide a quality foundation for the next generation of soil survey users where discrepancies are corrected and soil properties are identified uniformly across the state.
_________________________ 1/ State Soil Scientist and State Resource Conservationist for Natural Resources Conservation Service at Madison State NRCS Office.
Proc. of the 2016 Wisconsin Crop Management Conference, Vol. 55 11
EL NINO’S INFLUENCE ON GLOBAL AND MIDWESTERN CLIMATES
William L. Bland 1/
Introduction Every few days a low pressure system rambles across the US, and if it passes close enough to us and is strong enough, we may see some clouds and precipitation, followed by blue skies and cooler temperatures. Such fluctuations are a feature of our Midwest climate. At the global scale, there are also semi-regular disruptions that change the weather, and none is better known than ENSO — the El Niño-Southern Oscillation. We expect ENSO events every 3 to 7 years. When a strong ENSO event occurs, its fingerprints can be seen many places around the globe. If you are a farmer in Australia, Indonesia, South Africa, or northern South America, plan for a dry spell. In the southern third of the US, expect more rain than usual. The global average temperature is always warmer than average during an ENSO. As with passing storm systems, there are some regular features, but also lots of unknowns about how ENSO will affect a given place. An ENSO event is identified by unusual sea surface temperatures in the Pacific along the Equator, by the speed and direction of the trade winds in the same region, and from the difference in atmospheric pressure across the region. All three of these are linked by the physics of the atmosphere and oceans, so all are part of the picture, and they generally vary together. Some effects of ENSO are tied directly to them (like drought in Australia), but others, such as those experienced in North America, occur because of less direct effects on the jet streams that direct so much of our weather. We are currently in the midst of what will likely prove to be one of the three strongest ENSO events since the start of good records in 1950. The competition for top spot is 1997/98 and 1982/83. ENSO events typically appear in summer and build to a peak November-January, before tailing off about May. For those of us in the upper Midwest, the ENSO fingerprint is not clear. Some strong events lead to relatively warm winters — certainly the case as I write this in late December — but other ENSO events have not affected us appreciably. Looking to the summers after strong ENSO events, there is no noticeable impact on June-August temperature or precipitation. There is some evidence that as an ENSO dies out (May-June), the region may be slightly cooler and wetter than average (MRCC 2015). _____________________ 1/ Professor, Dept. of Soil Science, Univ. of Wisconsin-Madison and Extension Soil and Water Conservation Specialist, Univ. of Wisconsin-Extension.
Proc. of the 2016 Wisconsin Crop Management Conference, Vol. 55 12

Global commodity grain prices have not historically been directly affected by ENSO (World Bank 2015). Local supplies and prices will be affected, but these impacts do not seem to translate into global impacts. This year there are ample stocks so no change from this is expected.
References MRCC. Midwest Regional Climate Center. 2015. From: http://mrcc.isws.illinois.edu/mw_climate/elNino/impacts.jsp World Bank. 2015. Understanding El Nino: What does it mean for commodity markets? World Bank. From: http://pubdocs.worldbank.org/pubdocs/publicdoc/ 2015/10/916451445285454750/CMO-Oct-2015-Feature-El-Nino.pdf
Proc. of the 2016 Wisconsin Crop Management Conference, Vol. 55 13

THE RNAi PIPELINE
Gregory Heck 1/
Abstract RNA-based technologies (e.g., initiation of RNAi via the engineered production or plant surface application of double-stranded RNA, dsRNA) can be applied to a wide range of agricultural improvement objectives. These applications range from the modification of harvestable plant phenotype to crop protection scenarios. Examples are present in current agricultural production while additional applications such as plant-produced dsRNA targeting insect predators are advancing pending regulatory approvals for commercial release. Numerous considerations are taken into account as such products develop that bring forward efficacy, robustness, specificity, and safety of dsRNA as an active agent. A historical perspective, current applications, and prospects will be discussed. _________________ 1/ Weed Control Platform Lead, Plant Biology Program of Monsanto’s Chemistry organization ([email protected]).
Proc. of the 2016 Wisconsin Crop Management Conference, Vol. 55 14
REVAMPING SOYBEAN NUTRIENT UPTAKE, PARTITIONING, AND REMOVAL DATA OF MODERN HIGH YIELDING GENETICS AND PRODUCTION PRACTICES
Adam P. Gaspar1, Carrie A.M. Laboski2, Seth L. Naeve3, and Shawn P. Conley1
Abstract
The base of all soil fertility build, maintain, and drawdown programs are crop nutrient
uptake and removal estimates. Unfortunately, soybean [Glycine max (L.) Merr.] nutrient uptake and partitioning models are primarily built from work conducted in the early 1960’s with obsolete soybean genetics and production practices. Since the 1960’s, yields have nearly doubled to 47.5 bu acre-1 in 2014 and soybean physiology has been altered with approximately one more week of reproductive growth and greater harvest index’s for currently cultivated varieties. These changes in soybean development along with new production practices warrant re-evaluating soybean nutrient uptake, partitioning, and removal to better guide soybean fertility recommendations in the Upper Midwest. This study’s objective was to re-evaluate these factors across a wide yield range of 40 to 90 bu acre-1. Trials were conducted at three locations (Arlington and Hancock, WI and St. Paul, MN) during 2014. Plant samples were taken at the V4, R1, R4, R5.5, R6.5, and R8 growth stage and partitioned into stems, petioles, leaves, pods, seeds, fallen leaves, and fallen petioles, totaling about 4,000 samples annually. Preliminary 2014 results indicate that dry matter accumulation at R6.5 was only 86% of the total and that as yield increased the harvest index changed from 40% at 40 bu acre-1 to 55% at 80 bu acre-1. Nutrient uptake for N, P2O5, and K2O was 220, 52, and 141 lb acre-1, respectively and crop removal was 187, 43, and 75 lbs. a-1, respectively at a yield level of 60 bu acre-1. Preliminary 2014 data showed that the extended reproductive growth phase (~7 days), greater nutrient remobilization efficiencies (>70%), and a higher harvest index with increasing yields helped contribute to higher yields without greatly increasing total nutrient uptake. Data from 2015 are currently being analyzed.
1Grad Research Assistant and Professor, Dept. of Agronomy, 1575 Linden Dr. Univ. of Wisconsin-Madison, Madison, WI, 53706 2Professor, Dept. of Soil Science, 1525 Observatory Dr. Univ. of Wisconsin-Madison, Madison, WI, 53706 3Associate Professor, Dept. of Agronomy and Plant Genetics, 1991 Upper Buford Circle, Univ. of Minnesota, St. Paul, MN, 55108
Proc. of the 2016 Wisconsin Crop Management Conference, Vol. 55 15

_____________________________________________________________________________ 1 Funded by the United Soybean Board. 2 Graduate Research Assistant and Professor, University of Wisconsin-Madison, 1575 Linden Drive, Madison, WI 53706. 3 Graduate Research Assistant and Professor, Kansas State University, 1712 Claflin Road, Manhattan, KS 66506. 4 Graduate Research Assistant and Professor, Michigan State University, 1066 Bogue Street, East Lansing, MI 48824. 5 Assistant Professor, Mississippi State University, P.O. Box 197, Stoneville, MS 38776. 6 Associate Professor, University of Kentucky, 1405 Veterans Drive, Lexington, KY 40546. 7 Graduate Research Assistant and Associate Professor, University of Minnesota-Twin Cities, 1991 Upper Buford Circle, St. Paul, MN 55108. 8 Associate Professor, Purdue University, 915 West State Street, West Lafayette, IN 47907. 9 Professor, University of Illinois at Urbana-Champaign, 1102 South Goodwin Avenue, Urbana, IL 61801. 10 Associate Professor, University of Arkansas, P.O. Box 391, Little Rock, AR 72203.
DO MORE INPUTS INCREASE SOYBEAN YIELD AND PROFITABILITY?1
David A. Marburger2, Bryson J. Haverkamp3, Randy G. Laurenz4, John M. Orlowski5, Eric W.
Wilson6, Shaun N. Casteel7, Chad D. Lee8, Seth L. Naeve6, Emerson D. Nafziger9, Kraig L. Roozeboom3, William J. Ross10, Kurt D. Thelen4, and Shawn P. Conley2
Introduction
Increased soybean commodity prices in recent years have generated interest in
developing high-input systems to increase yield. However, little peer-reviewed information exists about the effects of input-intensive, high-yield management on soybean yield and profitability, as well as interactions with basic agronomic practices.
Field Experiments
Three separate field experiments were established at 20 locations spanning 9 states (Arkansas, Illinois, Indiana, Iowa, Kansas, Kentucky, Michigan, Minnesota, and Wisconsin) from 2012 to 2014. Study locations were managed by cooperating researchers at the major land-grant universities in the participating states. Experiment 1: Evaluating Input-intensive Management Systems The objective of this study was to investigate the effects of individual inputs and combinations of inputs as part of high-input systems (nicknamed ‘SOYA’) on soybean yield, yield components, and break-even probabilities compared to a standard practice (SP, current university recommendations for fertilizer and herbicide programs). The inputs evaluated including seed treatments, growth promoters, defoliant, nitrogen, foliar fertilizer, N,N’-diformyl urea, foliar fungicides, and foliar insecticides. Products and rates used are listed in Table 1, and the product costs are listed in Table 2. Individual site-year analysis found that the different input systems affected yield in 26 of 60 site-years (43%), and the majority of the responsive site-years were in the northern Midwest. Regional analysis showed no yield responses in the South region (AR, KS, and KY), but yield responses to the different input systems were found in the Central (IA, IL, and IN) and North regions (MI, MN, and WI) (Table 3). In general, the combination ‘SOYA’ resulted in the greatest yield increases, but Bayesian economic analysis indicated SOYA had low-breakeven probabilities due to high-input costs. Foliar insecticide had the greatest break-even probabilities across all environments (Table 4).
Proc. of the 2016 Wisconsin Crop Management Conference, Vol. 55 16

Experiment 2: Evaluating Cultivar × Input System Interactions The objective of this study was to evaluate cultivar × input system interactions on
soybean yield and yield components. Six soybean cultivars, representing high-yield potential cultivars suitable for each specific location, were chosen by the collaborating university agronomist from each state. The six chosen cultivars were evaluated under three input systems (Table 1): (1) “Standard Practice” (SP, current university recommendations for fertilizer and herbicide programs), (2) “SOYA” [high-input treatment consisting of university recommendations for fertilizer and herbicide programs; seed treatment fungicide, insecticide, nematistat, inoculant, and lipo-chitooligosaccharide (LCO); soil-applied nitrogen fertilizer; foliar LCO, fertilizer, antioxidant, fungicide and insecticide], and (3) “SOYA-FF” (SOYA minus foliar fungicide).
An individual site-year yield analysis found only 3 of 53 (5.7%) site-years examined had a significant cultivar × input system interaction, suggesting cultivar selection and input system decisions can remain independent. Regional analysis showed both high-input systems (SOYA and SOYA-FF) increased yield over the SP within each region, but a yield increase from fungicide use (i.e. SOYA) was only observed in the North region. Across all site-years, the SOYA and SOYA-FF treatments yielded 3.4 (5.5%) and 2.2 bu ac-1 (3.5%) more than the SP, and differences in response to input systems were found among maturity groups. Yield component measurements (seeds m-2, seed mass, early-season and final plant stand, pods plant-1, and seeds pod-1) indicated positive yield responses were due to increased seeds m-2 and seed mass.
Experiment 3: Evaluating Seeding Rate × Input System Interactions
The objective of this study was to evaluate seeding rate × input system interactions on soybean yield. Six different seeding rates (50000, 80000, 110000, 140000, 170000, and 200000 seeds ac-1) were evaluated under two management systems (Standard Practice and SOYA).
Results showed no interaction between seeding rate and input system within average- (≥45 and <78 bu ac-1) and high- (≥78 bu ac-1) yielding site-years. However, in low-yielding site-years (<45 bu ac-1), yields were found to be maximized at lower plant populations with the high-input system (SOYA) versus the control (Standard Practice). Across all site-years, 29 of 59 site-years examined showed a yield increase due to the SOYA management system across all tested seeding rates.
Conclusions and Recommendations
Following established soybean management recommendations developed by university research and Extension programs will allow soybean producers to maximize soybean yield and profitability under most circumstances. Growers in the Mid-South and lower Midwest are unlikely to see positive economic returns from prophylactic use of inputs in their soybean management systems, especially in the absence of pest pressure. Meanwhile, growers in the upper Midwest may see responses to certain additional inputs, especially at higher yield levels and soybean prices, but downward turns in soybean prices (i.e. a low-margin year) will significantly lower break-even probabilities for individual and combinations of inputs. Soybean producers should focus on ensuring that basic agronomic practices, such as adequate seeding rates, adapted cultivars, proper soil fertility, and integrated pest management principles are optimized and should not expect dramatic increases in yield and profitability solely from the inclusion of additional inputs into their management systems.
Proc. of the 2016 Wisconsin Crop Management Conference, Vol. 55 17

Table 1. Component products, active ingredients, rates, and timings for experiments across the Midwest and Mid-South from 2012 to 2014.
Seed
Treatment§ Foliar Input§ Combination
Product† Active Ingredient Rate Timing SP‡ F
ST F+I ST
Max ST D N F
N-N' urea FF FI
FF + FI SOYA
SOYA + D
SOYA- N
SOYA- FF
SOYA-FF and
FI
mL lb seed -1
Acceleron F pyraclostrobin + metalaxyl + fluxapyroxad 0.47 Seed - + + + - - - - - - - + + + + +
Acceleron I imidacloprid 1.18 Seed - - + + - - - - - - - + + + + + Poncho/Votivo Clothiaidin + Bacillus
firmus 0.29 Seed - - + + - - - - - - - + + + + + Optimize Bradyrhizobium
japonicum + LCO§ 0.83 Seed - - - + - - - - - - - + + + + + lb ac-1 Urea¶ 46-0-0 %N-P2O5-K20 75 V4 - - - - - + - - - - - + + - + + ESN 44-0-0 %N-P2O5-K20 75 V4 - - - - - + - - - - - + + - + + fl oz ac-1 Cobra# lactofen 12 V4 - - - - + - - - - - - - + - - - Ratchet LCO 4 V4-V6 - - - + - - - - - - - + + + + +
Task Force II 11-8-5-0.1-0.05-0.040.02-
0.00025-0.00025 %N-P2O5-K20- Fe-Mn-Zn-B-
Co-Mo 64 R1 - - - - - - + - - - - + + + + +
Bio-Forge N,N'-diformyl urea 16 R3 - - - - - - - + - - - + + + + + Headline†† pyraclostrobin 6 R3 - - - - - - - - + - + + + + - - Priaxor †† pyraclostrobin +
fluxapyroxad 8 R3 - - - - - - - - + - + + + + - - Warrior II ‡‡ lambda-cyhalothrin 1.92 R3 - - - - - - - - - + + + + + + - Endigo‡‡ lambda-cyhalothrin +
thiamethoxam 4 R3 - - - - - - - - - + + + + + + - † Acceleron® (Monsanto Co., St. Louis, MO); Poncho®/Votivo® (Bayer Crop Science, Research Triangle Park, NC); Optimize® (Novozymes, Brookfield, WI); ESN [environmentally smart nitrogen (polymer-coated urea)] (Agrium, Calgary, Alberta, Canada); Ratchet™ (Novozymes, Brookfield, WI); Cobra® (Valent USA Corp., Walnut Creek, CA); Task Force® 2 (Loveland Products, Inc., Greeley, CO); Bio-Forge® (Stoller USA, Inc., Houston, TX); Headline® (BASF Corp., Florham Park, NJ) used in 2012; Priaxor™ (BASF Corp., Florham Park, NJ) used in 2013-2014; Warrior II® (Syngenta Crop Protection, LLC, Greensboro, NC) used in 2012; Endigo® (Syngenta Crop Protection, LLC, Greensboro, NC) used in 2013-2014. ‡ SP, standard practice (current university recommendations for fertilizer and weed control programs. § F ST, fungicide seed treatment; F+I ST, fungicide + insecticide seed treatment; D, defoliant; N, soil-applied nitrogen fertilizer; F, foliar fertilizer; FF, foliar fungicide; FI foliar insecticide; FF + FI, foliar fungicide + foliar insecticide; LCO, lipo-chitooligosaccharide. ¶ Treated with Agrotain® [N-(n-butyl) thiophosphoric triamide] (Koch Agronomic Services, LLC, Wichita, KS) at 1.4 mL lb urea-1. # Tank mixed with 1% v/v crop oil concentrate. †† Headline® was used in 2012, and Priaxor™ was used in 2013 and 2014. ‡‡ Warrior II® was used in 2012, and Endigo® was used in 2013 and 2014.
Proc. of the 2016 Wisconsin Crop Management Conference, Vol. 55 18
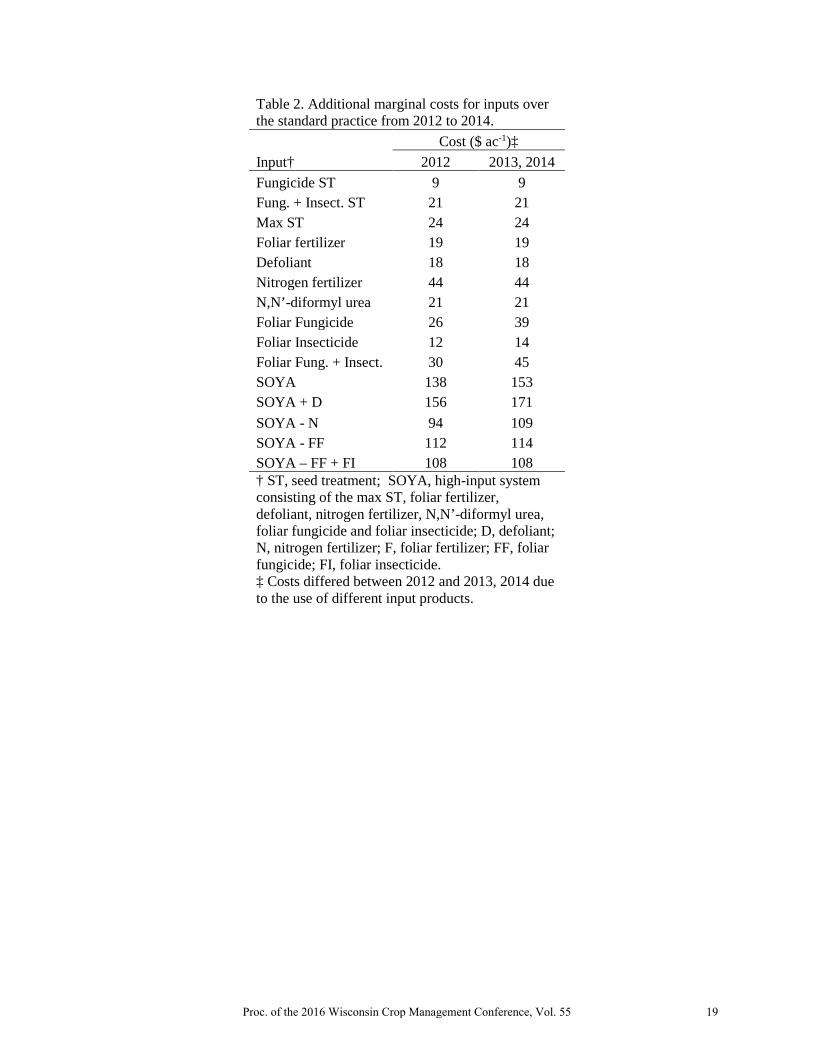
Table 2. Additional marginal costs for inputs over the standard practice from 2012 to 2014. Cost ($ ac-1)‡ Input† 2012 2013, 2014 Fungicide ST 9 9 Fung. + Insect. ST 21 21 Max ST 24 24 Foliar fertilizer 19 19 Defoliant 18 18 Nitrogen fertilizer 44 44 N,N’-diformyl urea 21 21 Foliar Fungicide 26 39 Foliar Insecticide 12 14 Foliar Fung. + Insect. 30 45 SOYA 138 153 SOYA + D 156 171 SOYA - N 94 109 SOYA - FF 112 114 SOYA – FF + FI 108 108 † ST, seed treatment; SOYA, high-input system consisting of the max ST, foliar fertilizer, defoliant, nitrogen fertilizer, N,N’-diformyl urea, foliar fungicide and foliar insecticide; D, defoliant; N, nitrogen fertilizer; F, foliar fertilizer; FF, foliar fungicide; FI, foliar insecticide. ‡ Costs differed between 2012 and 2013, 2014 due to the use of different input products.
Proc. of the 2016 Wisconsin Crop Management Conference, Vol. 55 19

Table 3. Seed yield, seed number, seed mass and final stand values for inputs across environments in the South (Arkansas, Kansas, Kentucky), Central (Illinois, Indiana, Iowa), and North (Michigan, Minnesota, Wisconsin) regions from 2012 to 2014. South Central North
Inputs† Seed yield
Seed number Seed mass Final stands
Seed yield
Seed number Seed mass Final stands
Seed yield
Seed number Seed mass Final stands
bu ac-1 seeds m-2 mg seed-1 plants ac-1 bu ac-1 seeds m-2 mg seed-1 plants ac-1 bu ac-1 seeds m-2 mg seed-1 plants ac-1 Standard Practice 61.0 2633 154.4 112370 60.0 2445 163.4 135030 61.0 2515 164.4 129940 Fung ST 60.1 2595 154.9 119440 59.7 2438 165.3 134670 61.6 2504 167.0 134830 Fung. + Insect. ST 60.4 2635 153.0 113510 60.3 2454 164.0 135730 62.1 2533 166.5 139070 Max ST 61.8 2683 154.6 114700 59.7 2429 164.6 133460 63.4 2564 168.8 141170 Foliar Fertilizer 61.2 2638 155.2 118630 59.5 2428 165.4 132590 62.5 2568 165.0 134350 Defoliant 61.8 2673 156.1 116520 57.2 2368 161.6 130370 58.5 2449 162.6 135640 Nitrogen fertilizer 61.0 2655 154.2 112800 60.7 2492 163.6 131110 63.4 2581 166.6 133920 N,N’-diformyl urea 61.3 2670 155.0 116510 59.8 2416 164.7 135410 61.6 2507 166.9 134500 Foliar Fungicide 61.3 2606 157.7 114800 61.5 2457 167.8 132630 63.8 2548 170.1 132530 Foliar Insecticide 60.1 2639 154.6 112520 60.9 2457 166.7 133080 65.3 2596 170.7 132910 Foliar F + I 61.0 2617 156.4 115890 62.1 2479 168.5 131990 67.8 2646 174.2 131730 SOYA 63.7 2737 157.1 115080 63.1 2519 168.3 131870 68.3 2625 176.5 135470 SOYA + D 63.2 2708 157.0 113480 61.9 2492 166.1 134870 65.6 2581 172.0 140970 SOYA - N 62.8 2662 157.8 115630 62.1 2474 165.9 135910 66.5 2567 175.8 140680 SOYA - FF 63.1 2689 156.6 111940 61.6 2485 166.1 136200 67.5 2646 174.0 142830 SOYA - FF + FI 61.9 2671 155.8 113520 61.6 2514 165.6 132720 64.9 2580 170.2 141250 LSD‡ NS§ NS NS NS 2.2 NS§ 2.6 NS 1.9 64 3.4 2880 † ST, seed treatment; SOYA, high-input system consisting of the max ST, foliar fertilizer, defoliant, nitrogen fertilizer, N,N’-diformyl urea, foliar fungicide and foliar insecticide; D, defoliant; N, nitrogen fertilizer; F, foliar fertilizer; FF, foliar fungicide; FI, foliar insecticide. ‡ LSD, least significant difference. § NS, not significant (P ≤ 0.05).
Proc. of the 2016 Wisconsin Crop Management Conference, Vol. 55 20
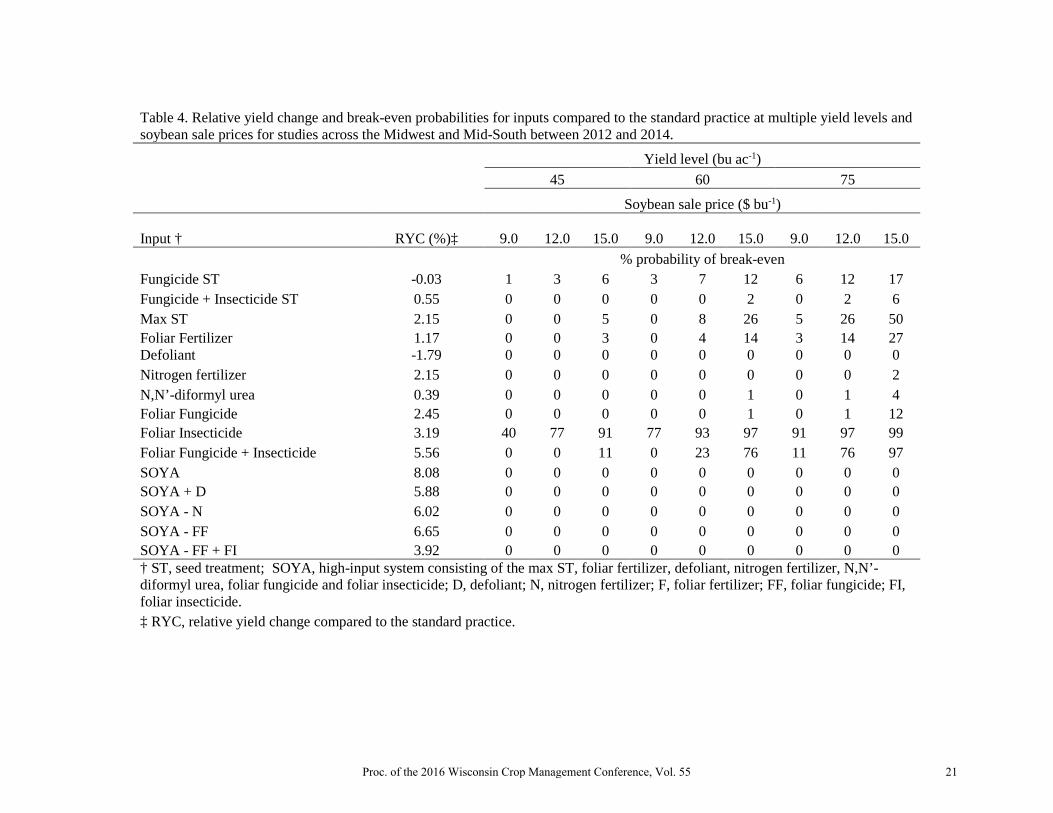
Table 4. Relative yield change and break-even probabilities for inputs compared to the standard practice at multiple yield levels and soybean sale prices for studies across the Midwest and Mid-South between 2012 and 2014.
Yield level (bu ac-1) 45 60 75
Soybean sale price ($ bu-1) Input † RYC (%)‡ 9.0 12.0 15.0 9.0 12.0 15.0 9.0 12.0 15.0 % probability of break-even Fungicide ST -0.03 1 3 6 3 7 12 6 12 17 Fungicide + Insecticide ST 0.55 0 0 0 0 0 2 0 2 6 Max ST 2.15 0 0 5 0 8 26 5 26 50 Foliar Fertilizer 1.17 0 0 3 0 4 14 3 14 27 Defoliant -1.79 0 0 0 0 0 0 0 0 0 Nitrogen fertilizer 2.15 0 0 0 0 0 0 0 0 2 N,N’-diformyl urea 0.39 0 0 0 0 0 1 0 1 4 Foliar Fungicide 2.45 0 0 0 0 0 1 0 1 12 Foliar Insecticide 3.19 40 77 91 77 93 97 91 97 99 Foliar Fungicide + Insecticide 5.56 0 0 11 0 23 76 11 76 97 SOYA 8.08 0 0 0 0 0 0 0 0 0 SOYA + D 5.88 0 0 0 0 0 0 0 0 0 SOYA - N 6.02 0 0 0 0 0 0 0 0 0 SOYA - FF 6.65 0 0 0 0 0 0 0 0 0 SOYA - FF + FI 3.92 0 0 0 0 0 0 0 0 0 † ST, seed treatment; SOYA, high-input system consisting of the max ST, foliar fertilizer, defoliant, nitrogen fertilizer, N,N’-diformyl urea, foliar fungicide and foliar insecticide; D, defoliant; N, nitrogen fertilizer; F, foliar fertilizer; FF, foliar fungicide; FI, foliar insecticide. ‡ RYC, relative yield change compared to the standard practice.
Proc. of the 2016 Wisconsin Crop Management Conference, Vol. 55 21

CAPITALIZING ON THE ROTATION EFFECT TO INCREASE YIELD: THE ROTATION EFFECT ON GREENHOUSE GAS
EMISSION FROM WISCONSIN SOILS
Joe Lauer, Maciek Kazula, and Thierno Diallo 1
Climate change projections suggest an increased variability of extreme climate condi-tions, such as sustained drought or prolonged precipitation (IPCC, 2007; USDA, 2012). The early growing season for 2012 and 2013 contrasted significantly in Wisconsin, where 2012 was one of the driest seasons ever recorded while 2013 was one of the wettest. These events had a negative effect on Wisconsin crop production. Agriculture plays a significant role in the global flux of three major greenhouse gasses (GHG - CO2, N2O and CH4), which when trapped in the atmosphere warms the surface of the Earth via infrared radiation (IPCC, 2007; USDA, 2012). A large amount of these gas fluxes are thought to be derived from soil through crop intensification (USDA, 2012). Improved management practices like reduced tillage, controlled fertilization (Snyder et al., 2009) or extended crop rotation (Drury et al., 2008) are of particular interest because they have a high potential to mitigate gas emissions. Corn rotation is a management practice of high mitigating potential, but due to recent economic influences is often neglected. The effect of crop rotation on GHG emissions is usually positive for mitigation (Drury et al., 2008; Adviento-Borbe et al., 2007; Venterea et al., 2005). Unlike nitrogen fertilizer and tillage management practices, crop rotation effects are often overlooked by farmers in gas emissions. Our objective was to compare early-season GHG emissions between 2012 to 2014 of six rotation treatments at the Arlington Research Station, WI. Sufficient time has passed to allow these extended crop rotation experiments to equilibrate differences within treatments.
Materials and Methods Three fields at different locations in Wisconsin, were established (i) to assess potential opportunities in mitigating GHGs emission by comparing the fluxes from monoculture corn (C), 2-yr corn-soybean rotation (CS), and 3-yr corn-soybean-wheat rotation (CSW) (ii) to compare GHG emission of different corn phases within rotations with each phase measured, and (iii) to determine how seasonal and spatial variability during crop production influences emissions under identical N fertilizer management. The experimental design was a randomized complete block in a split-plot arrangement, with three replications. Whole plot factors were rotation treatment, and the split plot factor was the chamber placement. Sufficient time has passed since plot establishment in 2000 to allow these extended crop rotation experiments to equilibrate differences within 1 Professor, Graduate Student, and Research Technician, Dept. of Agronomy, Univ. of Wisconsin-Madison, 1575 Linden Dr., Madison, WI 53706.
Proc. of the 2016 Wisconsin Crop Management Conference, Vol. 55 22
treatments. Gas fluxes were measured using in situ closed-cover flux chambers at four 20-minute sampling intervals permanently installed in the rows (IR) and between the rows (BR). Samples are taken from gas traps by inserting a 30-mL syringe into the rubber septa from where 20 mL was used to flush a vented 5-mL glass vial and remaining 10-mL was placed in the glass vial, giving the vial a gas overpressure. Sampling was done on weekly or biweekly schedules between March and November. Gas fluxes were measured using a gas chromatograph. GHG emissions were influenced by weather conditions and peaks of N2O additionally followed N application. Analysis of variance for the factors location, treatment, chamber placement, and replications as blocks was performed using the PROC MIXED procedure of SAS (SAS Inst., 2008).
Results and Discussion We observed significant (p<0.05) rotation and chambers placement effects on CO2 and N2O fluxes in all locations. Generally, across locations and rotations, CO2 and N2O fluxes from corn plots were significantly (p<0.05) higher than from soybean which was significantly higher than from wheat. Even though there was no difference between rotation treatments in CH4 emission, they all appeared to be a slight sink differing between locations. These results suggest that application of extended corn rotations, preferably CSW rotation, may potentially contribute to global GHG mitigation. At Lancaster, chambers placed between rows emitted 36 and 33% more CO2, 75 and 35% more N2O and captured 49 and 64% more CH4 than Arlington and Marshfield, respectively. Chambers placed in-row at Lancaster emitted 41 and 37% more CO2, 69 and 13% more N2O and captured 2 and 41% more CH4 than Arlington and Marshfield, respectively. Arlington noticeably contributed the least N2O, which might be explained with unusually dry weather conditions. Generally, across locations and chamber placement, the rotation treatments cS, cSw, and csW, compared to continuous corn, emitted to the environment less CO2 by 34, 27, and 29%, and less N2O by 38, 25, and 48%, respectively. N2O emissions were highly controlled by soil moisture. Under very wet conditions in 2013, averaged emissions were 132% higher IR and 385% higher BR compare to 2012, where winter wheat surprisingly had the highest emissions. There was an effect (p<0.05) of year, treatment, chamber placement and year x place. Averaged between all treatments, 2013 had 43% higher emissions BR and similar IR to 2012. Across chamber placements all 2012 treatments where corn was grown had the highest CO2 emissions, whereas in 2013 the lowest, except C and CSWc treatments placed BR. Averaged within all treatments, soils were a minor CH4 sink where 2012 was significantly greater. In 2013, positive CH4 emissions were recorded under C, CSWs, and CSWw treatments in both chamber placements.
Proc. of the 2016 Wisconsin Crop Management Conference, Vol. 55 23
Conclusions
• These results provide an important understanding on how different weather conditions might affect GHG emissions from agricultural soils.
• These results will help develop best-management recommendations for minimizing GHG emissions from corn-based systems.
Literature Cited
1. IPCC. 2007. Climate Change 2007. Synthesis Report. Contribution of Working
Groups I, II, and III to the Fourth Assessment Report of the Intergovernmental Panel on Climate Change. IPCC: Geneva.
2. USDA. 2012. Climate change and agriculture in the United States: Effects and adaptation. USDA Tech. Bull. 1935. Washington, DC. 186 p.
3. Snyder C.S., T.W. Bruulsema, T.L. Jensen, and P.E. Fixen. 2009. Review of green-house gas emission from crop production systems and fertilizer management effects. Agric. Ecosyst. Environ. 133:247-266.
4. Drury, C., X. Yang, W. Reynolds, and N. McLaughlin. 2008. Nitrous oxide and carbon dioxide emissions from monoculture and rotational cropping of corn, soybean and winter wheat. Can. J. Soil Sci. 88:163-174.
5. Adviento-Borbe, M., M. Haddix, D. Binder, D. Walters and A. Dobermann. 2007. Soil greenhouse gas fluxes and global warming potential in four high-yielding maize systems. Global Change Biol. 13:1972-1988.
6. Venterea R.T., M. Burger, and K.A. Spokas. 2005. Nitrogen oxide and methane emissions under varying tillage and fertilizer management. J. Environ. Qual. 34:1467-1477.
Proc. of the 2016 Wisconsin Crop Management Conference, Vol. 55 24
HERBICIDE RESISTANCE UPDATE FOR WISCONSIN
Devin Hammer1, Nathan Drewitz1, Vince Davis2, Shawn Conley1, and Dave Stoltenberg1
The first confirmed case of herbicide resistance in Wisconsin was atrazine-resistant common lambsquarters in 1979 (Heap 2015). Since then, herbicide resistance has been confirmed in 12 other weed species in Wisconsin. Resistance to photosystem II inhibitors such as atrazine and other triazine herbicides has been confirmed in smooth pigweed (1985), kochia (1987), and velvetleaf (1990), in addition to common lambsquarters in 1979. Resistance to ACCase inhibitors has been confirmed in only two species: giant foxtail (1991) and large crabgrass (1992). In contrast, resistance to ALS inhibitors has been confirmed in many species including kochia (1995) and eastern black nightshade, giant foxtail, green foxtail, and common waterhemp, all in 1999. More recently, resistance to ALS inhibitors has been found in giant ragweed (Marion et al. 2013; Stoltenberg et al. 2015) and common ragweed (Butts et al. 2015).
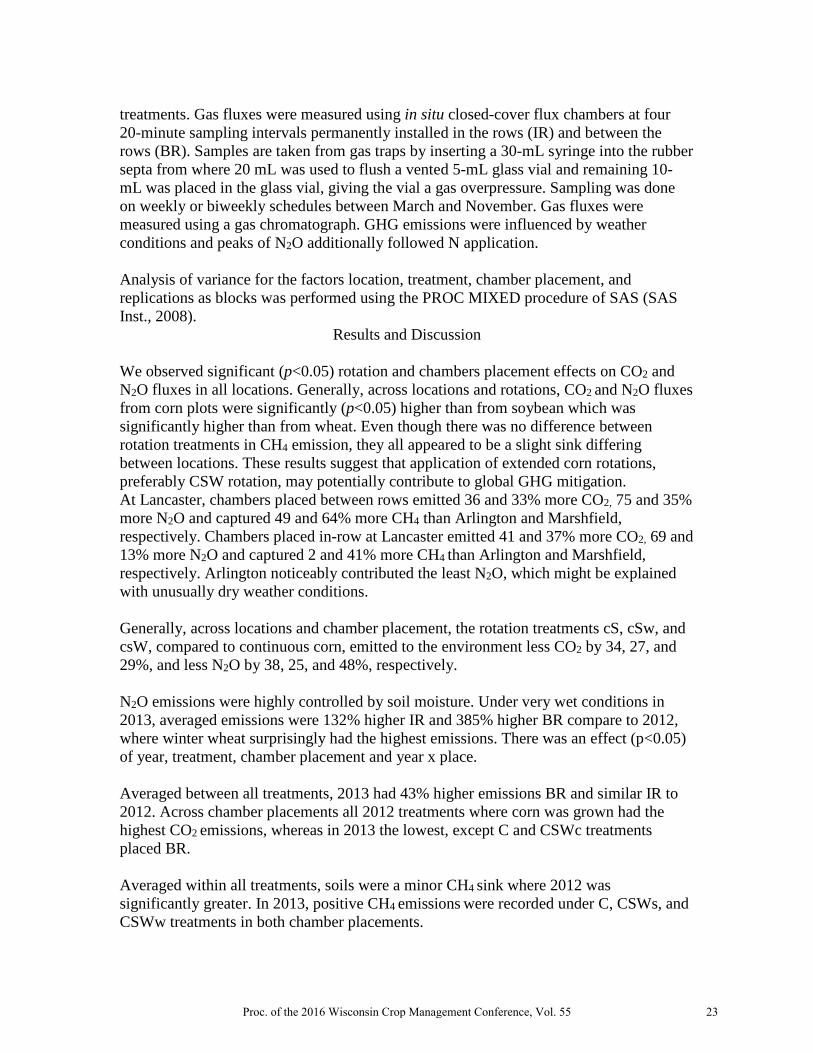
Glyphosate resistance in Wisconsin is a relatively recent occurrence compared to the instances of photosystem II inhibitor, ACCase inhibitor, and ALS inhibitor resistance noted above. The first confirmed case of glyphosate resistance occurred in 2011 in a giant ragweed population in Rock County (Glettner et al. 2012; Stoltenberg et al. 2015). Glyphosate resistance was subsequently confirmed in horseweed populations found in Jefferson County (Recker et al. 2013) and Columbia County (Recker et al. 2014). Following confirmation of glyphosate-resistant common waterhemp populations in Eau Claire and Pierce Counties (Butts and Davis 2015a, 2015b) and Palmer amaranth in Dane County (Butts and Davis 2015b, 2015c), glyphosate resistance concerns in Wisconsin have focused mostly on pigweeds (Amaranthus spp.). In 2015, there were 18 new reports of suspected glyphosate-resistant common waterhemp populations, bringing the total to 30 counties in which glyphosate resistance has been investigated since 2012 (Figure 1). In addition to the previously confirmed glyphosate-resistant common waterhemp in Eau Claire and Pierce Counties, molecular screening indicated glyphosate resistance in seven more counties in 2015. Glyphosate resistance in these seven cases has yet to be confirmed by whole-plant dose-response analysis at UW-Madison, but preliminary research indicates that whole-plant dose-response results are consistent with findings from molecular screening.
1 Graduate Research Assistant, Graduate Research Assistant, Professor, and Professor, Dept. of Agronomy, 1575 Linden Drive, Univ. of Wisconsin-Madison, Madison, WI, 53706. 2 Technical Service Representative, BASF, 707 Ariel Lane, Verona, WI, 53593.
Proc. of the 2016 Wisconsin Crop Management Conference, Vol. 55 25
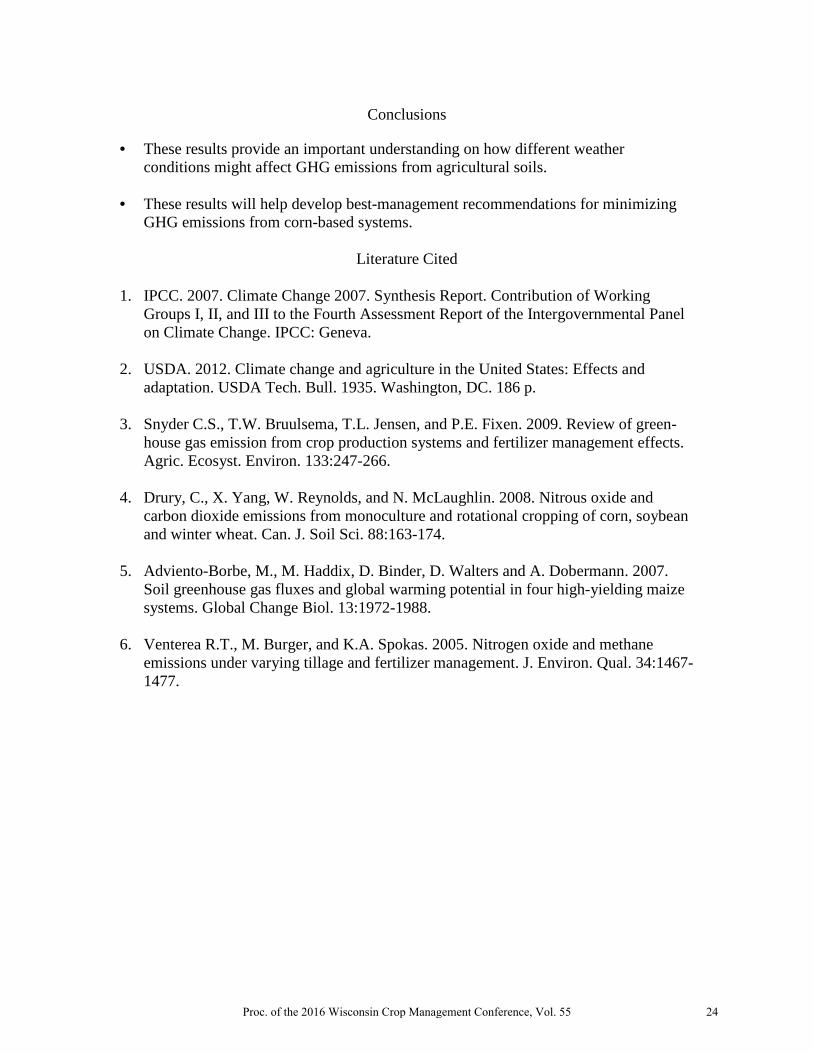
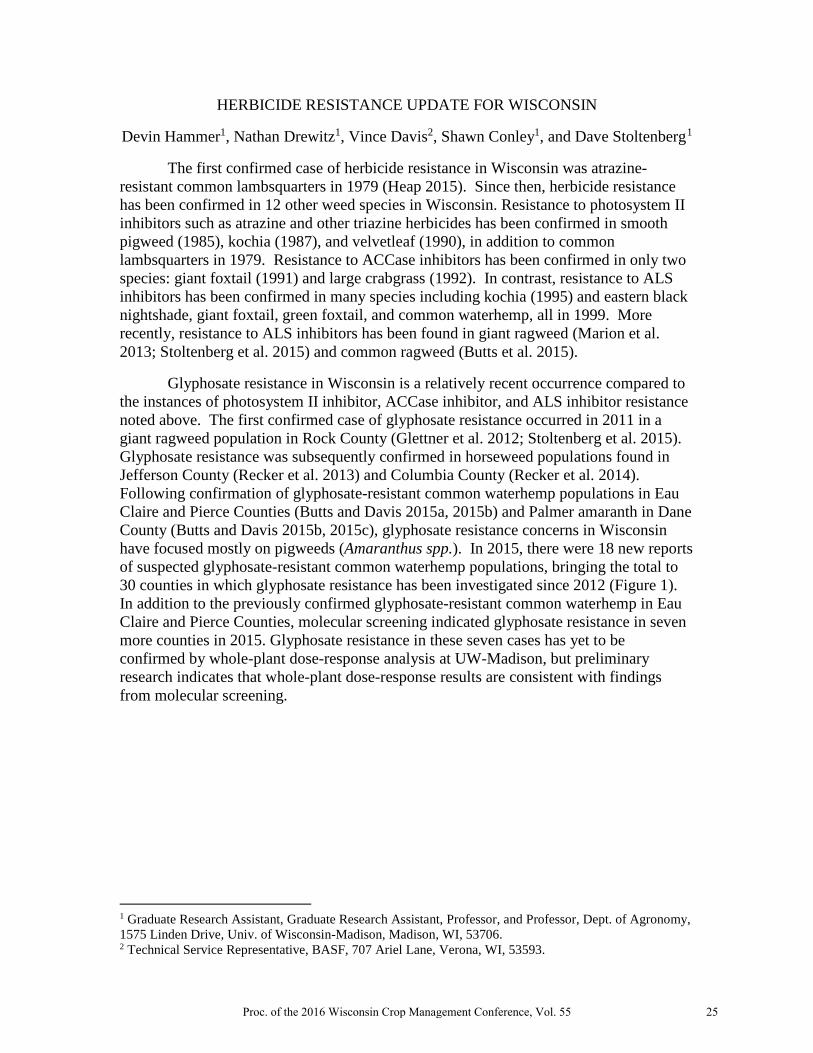
For example, recent results indicate that the waterhemp population from Outagamie County is 6.5-fold resistant to glyphosate compared to a known susceptible population based on ED50 values (Figure 2). Shoot dry biomass of the Outagamie County population was greater than that of the known susceptible population at glyphosate doses of 0.43 kg ae ha-1 or greater (Table 1).
Figure 2. Shoot dry biomass of Outagamie County and known susceptible common waterhemp populations 28 days after treatment with glyphosate. Vertical bars represent standard error of mean values. The ED50 value is the effective glyphosate dose that reduced shoot dry biomass 50% relative to non-treated plants.
Figure 1. Herbicide-resistant common waterhemp cases in Wisconsin as of 2015. An asterisk (*) denotes that glyphosate resistance was indicated by molecular screening conducted at the University of Illinois Plant Clinic.
Proc. of the 2016 Wisconsin Crop Management Conference, Vol. 55 26

In addition to the previously reported case of glyphosate-resistant Palmer amaranth in Dane County (Butts and Davis 2015b, 2015c), suspected glyphosate-resistant Palmer amaranth populations in Sauk and Grant Counties were reported in 2015 (Figure 3). Molecular screening indicated that the Sauk County population is resistant to glyphosate. Whole-plant dose-response experiments are currently being conducted at UW-Madison on the Palmer amaranth populations from Grant and Iowa Counties.
In conclusion, there were 18 new reports of suspected glyphosate-resistant common waterhemp populations in Wisconsin in 2015. To date, results from molecular screening and/or whole-plant dose-response experiments indicate that common waterhemp populations in seven of these 18 cases are resistant to glyphosate. Additional experiments are currently being conducted. It is important to note that results have shown no indication of glyphosate resistance in some suspected glyphosate-resistant common waterhemp populations, suggesting that factors other than resistance contributed to inadequate control. Even so, the high number of reports of suspected resistance is an indication of increasing abundance of common waterhemp in Wisconsin cropping systems. These developments along with confirmation of glyphosate-resistant Palmer amaranth in Wisconsin, and new reports of suspected herbicide-resistant populations of Palmer amaranth noted above, highlight the critical need for effective herbicide-resistance management.
Programs for herbicide-resistance management should consider use of all cultural, mechanical, and herbicidal options available for effective weed control in each situation and employ the following best management practices (Norsworthy et al. 2012).
1. Understand the biology of the weeds present. 2. Use a diversified approach toward weed management focused on preventing
weed seed production and reducing the number of weed seed in the soil seedbank.
3. Plant into weed-free fields and then keep fields as weed free as possible. 4. Plant weed-free crop seed.
Figure 3. Herbicide-resistant palmer amaranth cases in Wisconsin as of 2015. An asterisk (*) denotes that glyphosate resistance was indicated by molecular screening conducted at the University of Illinois Plant Clinic.
Proc. of the 2016 Wisconsin Crop Management Conference, Vol. 55 27

5. Scout fields routinely. 6. Use multiple herbicide mechanisms of action that are effective against the
most troublesome weeds or those most prone to herbicide resistance. 7. Apply the labeled herbicide rate at recommended weed sizes. 8. Emphasize cultural practices that suppress weeds by using crop
competitiveness. 9. Use mechanical and biological management practices where appropriate. 10. Prevent field-to-field and within-field movement of weed seed or vegetative
propagules. 11. Manage weed seed at harvest and after harvest to prevent a buildup of the
weed seedbank. 12. Prevent an influx of weeds into the field by managing field borders.
References
Butts TR, Davis VM (2015a) Glyphosate resistance confirmed in two Wisconsin common waterhemp (Amaranthus rudis) populations. Wisc Crop Manager http://ipcm.wisc.edu/blog/2015/02/
Butts TR, Davis VM (2015b) Herbicide-resistant pigweeds (Amaranthus spp.) are in Wisconsin, How serious is it? Proc Wisc Crop Management Conf 54:59-63
Butts TR, Davis VM (2015c) Palmer amaranth (Amaranthus palmeri) confirmed glyphosate-resistant in Dane County, Wisconsin. Wisc Crop Manager http://ipcm.wisc.edu/blog/2015/02/
Butts TR, Davis VM, Stoltenberg DE (2015) Common ragweed (Ambrosia artemisiifolia) confirmed ALS inhibitor-resistant in Brown County, Wisconsin. Wisc Crop Manager http://ipcm.wisc.edu/blog/2015/03/
Glettner CE, Yerka MK, Stute JK, Trower TL, Stoltenberg DE (2012) Giant ragweed resistance to glyphosate in Wisconsin. Proc North Central Weed Sci Soc 67:79
Heap I (2015) International Survey of Herbicide Resistant Weeds. http://www.weedscience.org
Marion S, Glettner C, Trower T, Davis V, Stoltenberg D (2013) Acetolactate synthase (ALS) inhibitor resistance in Wisconsin giant ragweed. Wisc Crop Manager 20:52-53 http://www.ipcm.wisc.edu
Norsworthy JK, Ward SM, Shaw DR, Llewellyn RS, Nichols RL, Webster TM, Bradley KW, Frisvold G, Powles SB, Burgos NR, Witt WW, Barrett M (2012) Reducing the risks of herbicide resistance: Best management practices and recommendations. Weed Sci Special Issue:31-62
Recker R, Buol J, Davis V (2014) Late-season weed escape survey in Wisconsin identifies a second county with a glyphosate-resistant horseweed population. http://wcws.cals.wisc.edu/late-season-weed-escape-survey-in-wisconsin-identifies-a-second-county-with-a-glyphosate-resistant-horseweed-population/
Recker R, Stoltenberg D, Davis V (2013) A horseweed population in Wisconsin is confirmed resistant to glyphosate. Wisc Crop Manager 20:71-72 http://www.ipcm.wisc.edu
Stoltenberg DE, Marion SM, Glettner CE, Davis VM (2015) Research progress on understanding herbicide resistance in Wisconsin giant ragweed. Proc Wisc Crop Management Conf 54:51-58
Proc. of the 2016 Wisconsin Crop Management Conference, Vol. 55 28
Spread of Herbicide Resistant Weeds in Illinois and
Factors that Prevent Presence of Herbicide Resistance in Illinois Fields
Aaron Hager 1/
Abstract The continual evolution of weed species and populations resistant to herbicides from one or more mechanism-of-action families represents one of the most daunting chal-lenges faced by weed management practitioners. Currently in Illinois, biotypes of 12 weed species have been confirmed resistant to one or more herbicide mechanisms of action. Resistance to herbicides that inhibit the ALS enzyme is the most common type of resistance in Illinois. Waterhemp has evolved resistance to more herbicide mechan-isms of action than any other Illinois weed species, including resistance to inhibitors of acetolactate synthase (ALS), photosystem II (PSII), protoporphyrinogen oxidase (PPO), enolpyruvyl shikimate-3-phosphate synthase (EPSPS) and hydroxyphenyl pyruvate dioxygenase (HPPD). Not every individual waterhemp plant is resistant to one or more herbicides, but the majority of field-level waterhemp populations contain one or more types of herbicide resistance. Perhaps even more daunting is the occurrence of multiple herbicide resistances within individual plants and/or fields. Waterhemp plants and populations demonstrating multiple herbicide resistance are becoming increasingly common and greatly reduce the number of herbicide options that remain effective for their control. Integrated weed management programs offer the greatest potential for long-term, sustainable solutions for weed populations demonstrating resistance to herbicides from multiple families. _____________________________ 1/ Associate Professor of Extension Weed Science, Dept. of Crop Sciences, Univ. of Illinois, Champaign-Urbana, IL 61801.
Proc. of the 2016 Wisconsin Crop Management Conference, Vol. 55 29
HERBICIDE RESISTANT WEED SEEDBANK DYNAMICS INFLUENCED BY CROP ROTATION? THE VALUE OF ALFALFA AS A TOOL
Jared J. Goplen 1/
Abstract
Across the Midwest, weeds resistant to multiple herbicides continue to become more widespread. Not only do weeds with resistance to multiple herbicides reduce the utility of existing herbicides, but they also necessitate the use of alternative weed control strategies. From 2012-2015 in southern Minnesota, we determined the effect of six 3-year crop rotations containing corn (C), soybean (S), alfalfa (A), and wheat (W): (CCC, SCC, CSC, SWC, SAC, AAC) on herbicide-resistant giant ragweed seed bank depletion and emergence patterns. Crop rotation had no effect on the amount of seed bank depletion when a zero weed threshold was maintained, with 96% of the giant ragweed seed bank being depleted within 2 years (Table 1). However, this quantity of seed bank depletion was primarily through seedling emergence in annual crop rotation treatments. Multiple years of alfalfa exhibited less seedling emergence while maintaining a high level of seed bank depletion, possibly indicating an increase in seed predation or fatal germination of seedlings (Table 1). In comparison to rotations containing just corn or soybean, total emergence of giant ragweed was reduced by an average of 38% when wheat or alfalfa were included in the rotation (Table 1). Giant ragweed emerged early across all treatments, with 90% emergence occurring by 4 June on average. These results indicate that corn and soybean rotations are more conducive to giant ragweed emergence than rotations containing wheat and alfalfa, and that adopting a zero weed threshold is a viable approach to depleting the weed seed bank. This presentation will discuss current research focusing on how crop rotation and timing of field operations can be used as part of an integrated weed management plan to improve herbicide-resistant giant ragweed control. Specifically, alfalfa will be highlighted as being an important tool to deplete the weed seed-bank while maintaining profitability.
____________________
1/ Graduate PhD student in Agronomy and Agroecology at the University of Minnesota.
Proc. of the 2016 Wisconsin Crop Management Conference, Vol. 55 30

Table 1. Total seedling emergence in each year, percentage of seed bank depletion, and the percentage of depletion accounted for by emergence in each crop rotation system from two experimental locations. Total seedling emergence in each year are corrected means from the seed bank density covariate. Means with different letters indicate a significant difference at the 0.05 level calculated using Fisher’s protected LSD.
Emergenceb Seed bankc
Treatmenta Yr 1 Yr 2 Yr 3 Depletion Emergence Seedlings
m-2 %
CCC 3.4ns 5.6ab 1.1ab 97.7ns 100ab SCC 7.0 10.5a 0.1c 95.7 100a CSC 4.7 4.8b 1.5a 90.6 96bc
SWC 6.5 4.1b 0.5abc 94.7 61bc
SAC 7.1 4.6b 0.5bc 98.4 74bc AAC 4.4 0.8c 0.3bc 99.0 41c
aC, S, W, and A represent the sequence of corn, soybean, wheat, and alfalfa in each 3-year rotation.
bEmergence in each year corresponds to the total seedlings emerged by year in each crop rotation treatment.
cSeed bank depletion represents the percentage of seeds depleted between the first and third year of the crop rotation treatments, while emergence represents the percentage of the seed bank depletion that was accounted for by emergence over the same time period.
Proc. of the 2016 Wisconsin Crop Management Conference, Vol. 55 31
Basic Train Marketing Workshop and Market Outlook
Brian Rydlund 1/
ABSTRACT
Grain marketing from a very basic standpoint, including: the components of price, hedging tools, basis, & strategies will be discussed. Market outlook for corn, soybeans and wheat, primarily futures, will also be discussed. _________________________ 1/ Market Analyst, CHS Hedging, St. Paul, Minnesota; 800-328-6530; 651-355-6503; 651-355-3723 fax; www.chshedging.com.
Proc. of the 2016 Wisconsin Crop Management Conference, Vol. 55 32
GRAIN QUALITY – THINGS TO REMEMBER WHEN STORING/HANDLING THE 2015 CROP
Nick Friant 1/
ABSTRACT
Grain quality management touches every aspect of the grain industry. From
elevator to seller, managing the quality of your stored grain impacts selling price, operating costs, company reputation, and more. This session will cover handling and storage best practices such as shrink, binning/blending, and ground piles and temporary storage, as well as methods for preventing and responding to either a handling or storage incident. _____________________________ 1/ Food Safety, Quality, Regulator Leader, Cargill, Minneapolis, MN.
Proc. of the 2016 Wisconsin Crop Management Conference, Vol. 55 33

GMO 101: Facts to Educate You and Help You to Educate Others about GMO Crops and Foods
Travis Frey, Danielle Fuchs, Chelsey Robinson, and Brittania Lebbing 1/
Experts agree that to keep up with the demands of a growing global population, we will need to grow as much food in the next 50 years as we did in the past 10,000 years combined. We will need to do so under the pressures of a changing climate which has created a more volatile environment for farming, including increased drought, insect populations and new and renewed disease threats, among other challenges. Climate change is also allowing farmers to grow crops in areas where they’ve not historically been grown. We need to study these changes and apply our knowledge to enable more food production on these new lands and regions. Science plays a key role in agriculture. Biotechnology provides a very versatile tool to combat many of these challenges in partnership with breeding, crop protection technologies, climate data, precision agriculture, microbials and other technologies. Science also plays a key role in our lives. Cheese became the first GMO food product on the market because prior to biotech solutions, these enzymes were extracted from the stomachs of cows. The fourth stomach, to be exact. Naturally occurring rennet often contained impurities that could result in less-than-ideal results. Biotech has enabled production of more predictable rennet that help cheese-makers to deliver the flavors and consistency that they, and we, are looking for. Now 90% of our cheese are produced using biotechnology. Biotechnology also helps in production of yeast used for bread and beer. Again, biotech helps to provide a more precise product that delivers the flavor profile that a baker or brewer is seeking. We also depend on biotechnology for production of life-saving medications, most notably, insulin. Prior to biotech solutions, insulin was extracted from the pancreas of a pig or cow. Prior to that, it was extracted from human cadavers. Six out of ten of new pharmaceutical drugs on the market are created through biotechnology. Understanding of the history of GMOs, what they are and how they’re used, helps to put a lot of the current discussion into better perspective. A lot of people aren’t aware of how broadly they are used, of the many benefits they provide, how long they’ve been around and how extensively they’ve been tested. We know from history, and we know from exhaustive research and testing that food from GM crops has a thoroughly tested, spotless record for safety. A wealth of research and more than 30 years of experience backs up
________________________
1/ Monsanto Company.
Proc. of the 2016 Wisconsin Crop Management Conference, Vol. 55 34

this safety record. With over 4 billion acres of farmland used for GMO crops with over 30 years of research and more than 18 years of commercial GMO crops resulting in more than 1,000 peer-reviewed studies on GMO safety there has not been a single food safety issue associated with GMOs. These areas and others will be reviewed in the keynote address. While all of your questions may not be covered in the time allotted additional sources of information and answers to your GMO questions can be found at the following links: International Service for the Acquisition of Agri-Biotech Applications (ISAAA): http://isaaa.org/
Genetic Literacy Project: https://www.geneticliteracyproject.org/
BioFortified: http://www.biofortified.org/
Grocery Manufacturers Association (GMAOnline): http://factsaboutgmos.org/
GMO Answers: https://gmoanswers.com/
Biotechnology Industry Organization (BIO): http://www.bio.org/
Common Ground: http://findourcommonground.com/food-facts/gmo-foods/
Food Insight from the International Food Information Council (IFIC): http://www.foodinsight.org/
Science not Fiction: http://www.europabio.org/science-not-fiction-time-think-again-about-gm
Proc. of the 2016 Wisconsin Crop Management Conference, Vol. 55 35

CONTROLLING NUTRIENT LOSS Amber Radatz1
UW Discovery Farms, part of UW-Extension, works with Wisconsin farmers to identify the water quality impacts of different farming systems around the state. Discovery Farms programs of Wisconsin and Minnesota have collected water quality information from a wide variety of farming systems. There are many management styles and landscapes represented in the monitored fields.
Discovery Farms has a large edge-of-field dataset from working farms.
Edge-of-field water quality information has been collected from over 17 farms and 21 fields starting in 2002. In total, Discovery Farms has 200 site years of data, and 85 site years of surface runoff data. This surface runoff data is valuable in making conclusions and recommendations about farming systems’ impacts on water quality.
There are several clear lessons learned from the dataset.
Conservation practices still work and are still important. The first step to reducing phosphorus loss is to control soil loss. This means paying attention to farmed areas, non-farmed areas, and the points where these two intersect. Upland practices alone, like conservation tillage or no-till, are not enough to eliminate erosion. These beneficial upland practices must be paired with treatment practices like waterways for maximum erosion protection.
There are areas where tillage does not lead to large soil loss. Overall, our data shows that the soil losses for tillage sites and no-till sites are usually pretty similar. However, there are fields where tillage was too intense for the landscape conditions in which large soil losses were monitored. No-till practices do a good job of eliminating overall soil loss when paired with the appropriate conservation practices.
Once soil loss is controlled, the next step to reducing phosphorus loss involves fine tuning nutrient timing and placement. The average total phosphorus loss values between tillage and no-till farms is not significantly different. Some of the largest phosphorus losses monitored have resulted from nutrient applications shortly before runoff. When nutrients are applied to the surface, careful attention to the risk for runoff in the near future is necessary. Discovery Farms data indicate that the risk for runoff is highest in March and June.
_______________________ 1Co-Director, UW Discovery Farms Program, UW Extension.
Proc. of the 2016 Wisconsin Crop Management Conference, Vol. 55 36
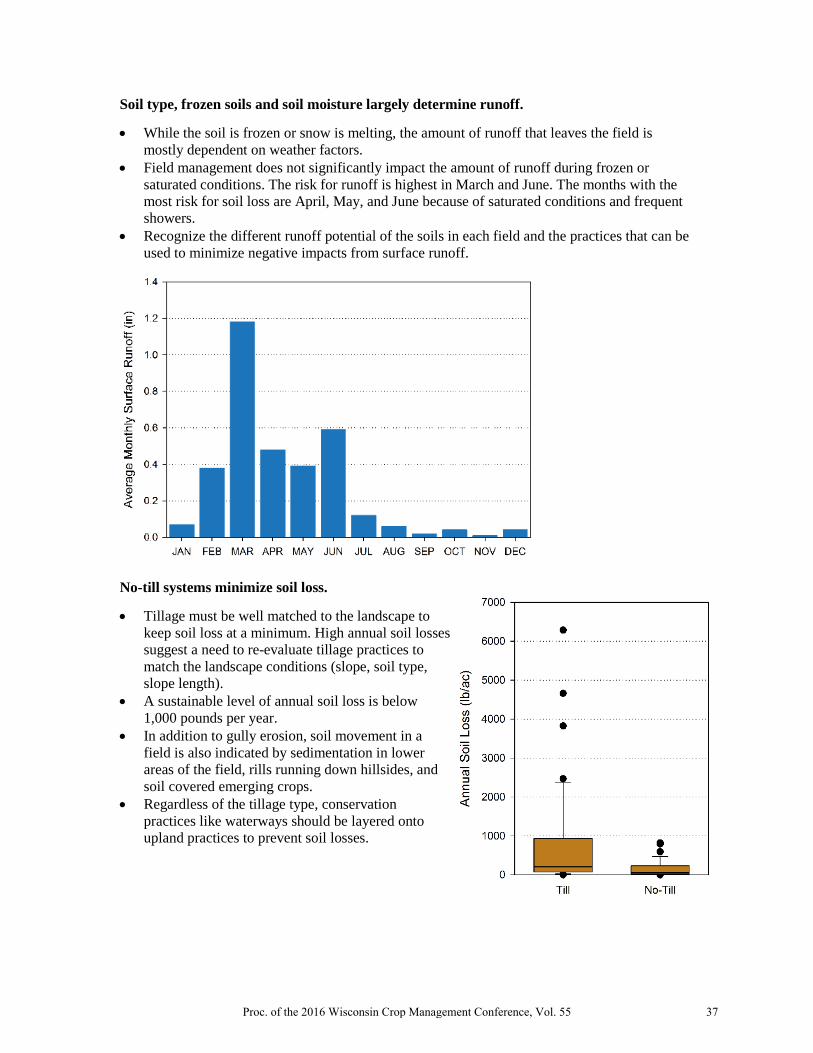
Soil type, frozen soils and soil moisture largely determine runoff.
• While the soil is frozen or snow is melting, the amount of runoff that leaves the field is mostly dependent on weather factors.
• Field management does not significantly impact the amount of runoff during frozen or saturated conditions. The risk for runoff is highest in March and June. The months with the most risk for soil loss are April, May, and June because of saturated conditions and frequent showers.
• Recognize the different runoff potential of the soils in each field and the practices that can be used to minimize negative impacts from surface runoff.
No-till systems minimize soil loss.
• Tillage must be well matched to the landscape to keep soil loss at a minimum. High annual soil losses suggest a need to re-evaluate tillage practices to match the landscape conditions (slope, soil type, slope length).
• A sustainable level of annual soil loss is below 1,000 pounds per year.
• In addition to gully erosion, soil movement in a field is also indicated by sedimentation in lower areas of the field, rills running down hillsides, and soil covered emerging crops.
• Regardless of the tillage type, conservation practices like waterways should be layered onto upland practices to prevent soil losses.
Proc. of the 2016 Wisconsin Crop Management Conference, Vol. 55 37
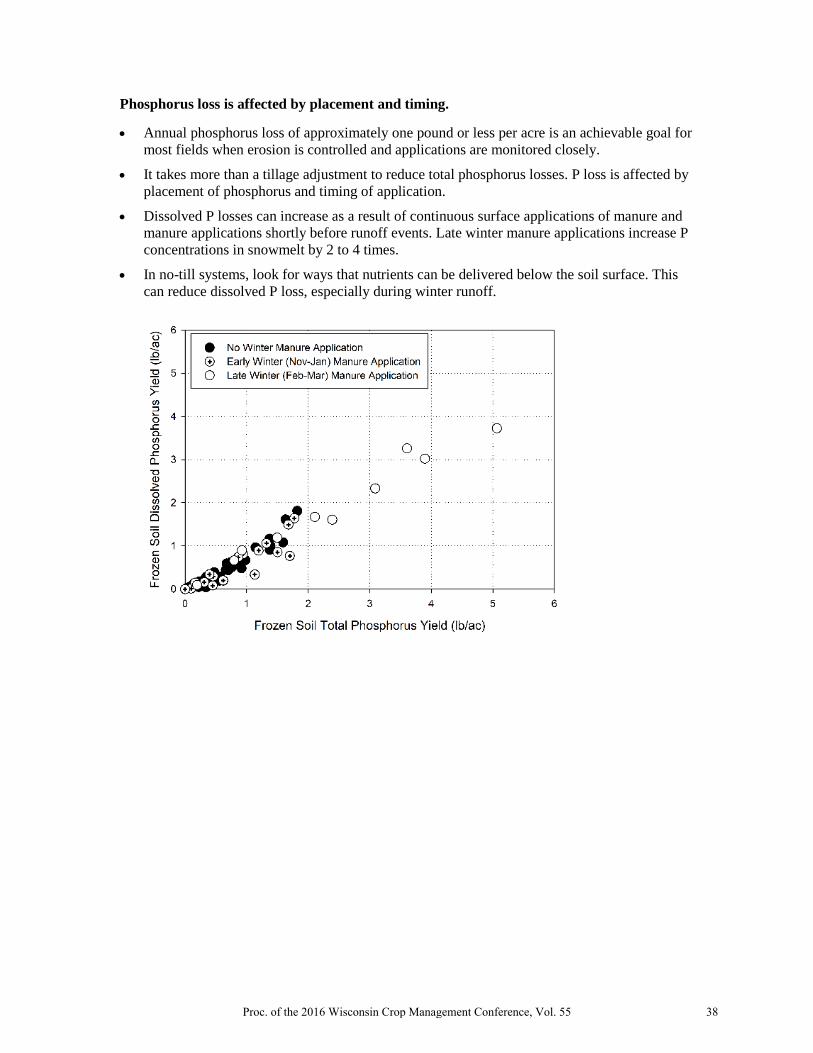
Phosphorus loss is affected by placement and timing.
• Annual phosphorus loss of approximately one pound or less per acre is an achievable goal for most fields when erosion is controlled and applications are monitored closely.
• It takes more than a tillage adjustment to reduce total phosphorus losses. P loss is affected by placement of phosphorus and timing of application.
• Dissolved P losses can increase as a result of continuous surface applications of manure and manure applications shortly before runoff events. Late winter manure applications increase P concentrations in snowmelt by 2 to 4 times.
• In no-till systems, look for ways that nutrients can be delivered below the soil surface. This can reduce dissolved P loss, especially during winter runoff.
Proc. of the 2016 Wisconsin Crop Management Conference, Vol. 55 38
A NEW TOOL FOR ESTIMATING PHOSPHOURS LOSS FROM CATTLE BARNYARDS AND OUTDOOR LOTS
Peter Vadas1, Laura Good2, John Panuska2, Dennis Busch3, and Rebecca Larson4
Introduction
Agricultural nutrient management continues to be an important area of research and policy due to concerns of phosphorus (P) loss in runoff and water quality impacts. For dairy and beef farms, outdoor cattle lots (feedlots, barnyards, exercise lots, over-wintering lots) can be significant sources of P loss (Koelsch et al., 2006). There is a need to assess P loss from lots, especially relative to other farm areas (cropland, pastures), to see if alternative lot management is needed and cost-effective. Computer models can be effective tools to help quantify P loss from cattle lots. Despite quite a bit of physical monitoring research on P loss from lots since the 1970’s, there has been little development of models to predict P loss from these areas. To our knowledge, the only two examples of runoff and P loss models for cattle lots are in the AGNPS model (Young et al., 1989) and the APEX model (Gassman et al., 2010; Williams et al., 2006). Barnyard runoff models such as BARNY in Wisconsin and MinnFarm in Minnesota use the same approach as AGNPS. Both AGNPS and APEX have had only minimal testing for P loss from lots (Kizil et al., 2006; Williams et al., 2006), so it is not clear if they are reliable across a range of cattle lot managements, conditions, and locations. Our objectives were to:
1. Develop a relatively simple, annual model to estimate P loss in runoff from cattle lots 2. Test the model with data available in the published literature 3. Compare the new model to BARNY and MinnFarm.
The name of our new model is APLE-Lots. A flow chart of APLE-Lots is shown in Figure 1. The goal of the model is to estimate annual dissolved and solids-bound P loss from lots. APLE-Lots is intended to be user-friendly and does not require extensive input data to operate. All data are input directly into a spreadsheet (available to download at: http://www.ars.usda.gov/Services/docs.htm?docid=25452). User-input data include:
• Soil test P for earthen lots • Area of the lot • Annual precipitation for the lot location • Number and type of cattle in the lot, including beef cattle and calves, dairy lactating and
dry cows, and dairy heifers and calves. • Number of days between lot cleanouts. • Surface type (paved or earthen), and the % vegetative cover for earthen lots.
Proc. of the 2016 Wisconsin Crop Management Conference, Vol. 55 39
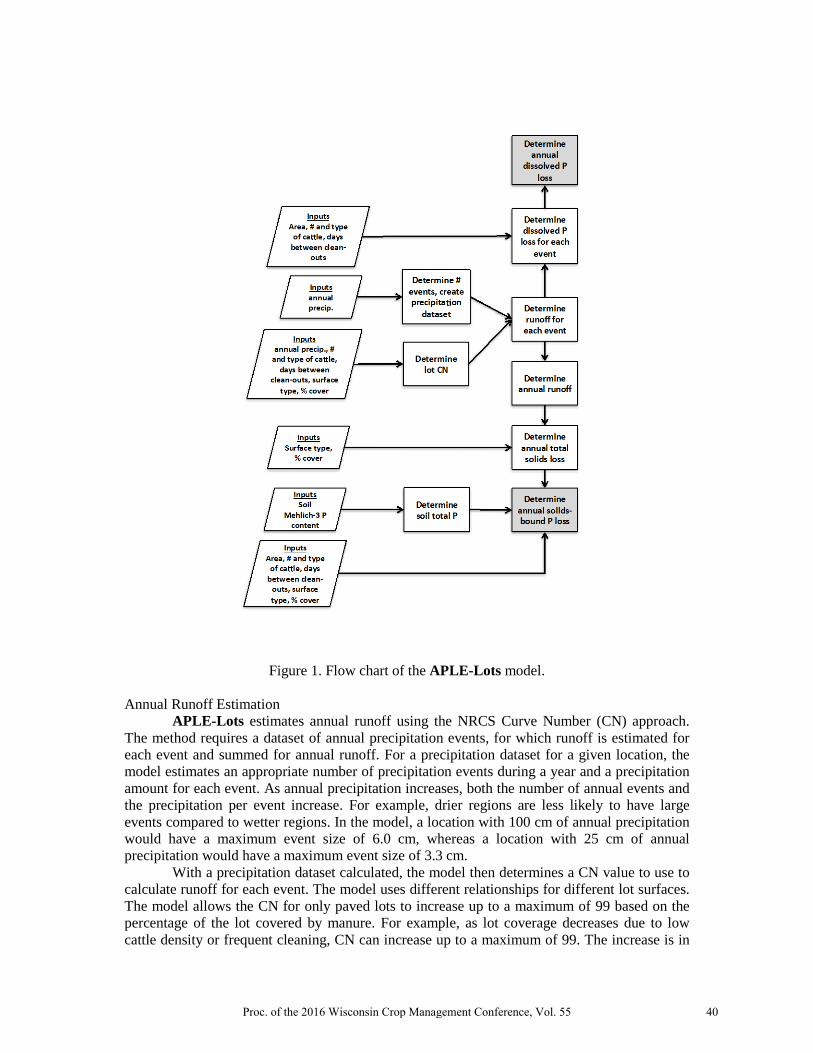
Figure 1. Flow chart of the APLE-Lots model.
Annual Runoff Estimation
APLE-Lots estimates annual runoff using the NRCS Curve Number (CN) approach. The method requires a dataset of annual precipitation events, for which runoff is estimated for each event and summed for annual runoff. For a precipitation dataset for a given location, the model estimates an appropriate number of precipitation events during a year and a precipitation amount for each event. As annual precipitation increases, both the number of annual events and the precipitation per event increase. For example, drier regions are less likely to have large events compared to wetter regions. In the model, a location with 100 cm of annual precipitation would have a maximum event size of 6.0 cm, whereas a location with 25 cm of annual precipitation would have a maximum event size of 3.3 cm.
With a precipitation dataset calculated, the model then determines a CN value to use to calculate runoff for each event. The model uses different relationships for different lot surfaces. The model allows the CN for only paved lots to increase up to a maximum of 99 based on the percentage of the lot covered by manure. For example, as lot coverage decreases due to low cattle density or frequent cleaning, CN can increase up to a maximum of 99. The increase is in
Proc. of the 2016 Wisconsin Crop Management Conference, Vol. 55 40

direct proportion the percent of the total lot area covered. The logic is that paved lots with more manure have a more uneven surface that can hold water and thus have less runoff. Finally, research has shown that increasing vegetative cover can decrease runoff amounts. Accordingly for earthen lots, CN and runoff will decrease as vegetation increases. Annual Total Solids Loss Estimation
The model estimates annual eroded solids loss from a cattle lot as a function of how much runoff water moves across the surface. For earthen lots, the model also allows total solids loss to fluctuate down to a minimal amount based on % vegetative cover of the lot. There is a non-linear relationship between runoff and total solids loss, which is logical because greater runoff volumes are likely due to a greater occurrence of larger storms, which may generate more sediment transport. The model adjusts solids loss for paved cattle lots that have manure consistently removed by cleaning because such lots have less manure on the surface and therefore less manure solids loss in runoff. For example, if a lot is cleaned once per week, and only 23% of the total lot area is covered in a week, annual solids loss is reduced by multiplying by 0.23. Annual Solids-bound and Dissolved P Loss Estimation
In the model, annual solid P loss is determined by multiplying annual solids loss by solids P content. For paved or concrete lots, the dominant source of eroded solids is cattle manure; and the eroded solids P content is the same as manure P content. The model estimates manure P content based on information about the type and number of cattle on the lot, and cattle type, daily manure production, and manure P content. On earthen lots, both manure and soil are sources of solids P loss, and the P content of eroded solids is generally less than the P content of manure. Thus for earthen lots, the model assumes eroded solids is 30% from manure and 70% from soil. The model then calculates eroded solids P content based on manure P content, soil P content, and the 30/70 ratio. The model also allows this 30/70 ratio to fluctuate to account for the lot area covered by manure. For example, if manure covers 50% of the lot area, the ratio is 15/85. At 75% manure coverage, the ratio is 25.5/74.5. For dissolved P loss estimation, the model estimates how much P is released from manure during a precipitation event. Then, an estimate is made of how much of that released P infiltrates into soil and how much is lost in runoff. The model then sums the estimates of runoff dissolved P for all runoff events in the precipitation dataset to estimate annual loss of dissolved P from manure on the lot surface. Model Testing We tested the model with lot runoff monitoring data from the scientific literature to see how well it estimates runoff, solids loss, and P loss. Figure 2 shows results for model testing for annual runoff, Figure 3 for annual solids loss, Figure 4 for annual total P loss, and Figure 5 for annual dissolved P loss.
Proc. of the 2016 Wisconsin Crop Management Conference, Vol. 55 41

Figure 2. Data from 12 studies showing the relationship between measured annual runoff from cattle lots and predicted runoff using the new model.
Figure 3. Data from 5 studies showing the relationship between measured annual total solids loss from cattle lots and predicted solids loss using the new model.
y = 0.91x + 42.9r² = 0.75
0
100
200
300
400
500
600
700
0 100 200 300 400 500 600 700
Pred
icte
d A
nnua
l Run
off (
mm
)
Measured Annual Runoff (mm)
y = 0.95x + 4.25r² = 0.87
0
20
40
60
80
100
120
0 20 40 60 80 100 120
Pred
icte
d A
nnua
l Sol
ids L
oss
(Mg/
ha)
Measured Annual Solids Loss (Mg/ha)
Proc. of the 2016 Wisconsin Crop Management Conference, Vol. 55 42

Figure 4. Data from 12 studies showing the relationship between measured annual total P loss from cattle lots and predicted total P loss using the new model.
Figure 5. Data from 12 studies showing the relationship between measured annual dissolved P loss from cattle lots and predicted dissolved P loss using the new model.
y = 0.97x + 24.2r² = 0.91
0
200
400
600
800
1000
1200
1400
0 200 400 600 800 1000 1200 1400
Pred
icte
d To
tal P
Los
s (k
g/ha
)
Measured Total P Loss (kg/ha)
y = 1.14x + 4.8r² = 0.88
0
50
100
150
200
250
0 50 100 150 200 250
Sim
ulat
ed D
isso
lved
P L
oss
(kg/
ha)
Measured Dissolved P Loss (kg/ha)
Proc. of the 2016 Wisconsin Crop Management Conference, Vol. 55 43
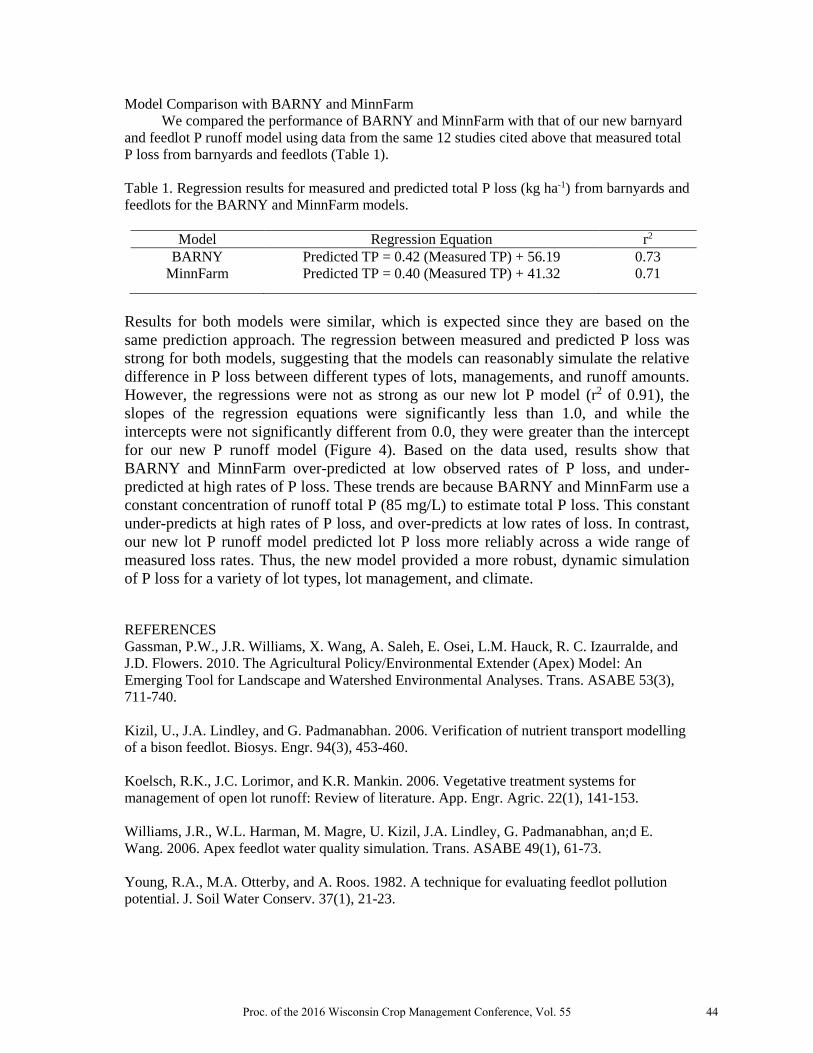
Model Comparison with BARNY and MinnFarm We compared the performance of BARNY and MinnFarm with that of our new barnyard and feedlot P runoff model using data from the same 12 studies cited above that measured total P loss from barnyards and feedlots (Table 1). Table 1. Regression results for measured and predicted total P loss (kg ha-1) from barnyards and feedlots for the BARNY and MinnFarm models.
Model Regression Equation r2 BARNY Predicted TP = 0.42 (Measured TP) + 56.19 0.73
MinnFarm Predicted TP = 0.40 (Measured TP) + 41.32 0.71
Results for both models were similar, which is expected since they are based on the same prediction approach. The regression between measured and predicted P loss was strong for both models, suggesting that the models can reasonably simulate the relative difference in P loss between different types of lots, managements, and runoff amounts. However, the regressions were not as strong as our new lot P model (r2 of 0.91), the slopes of the regression equations were significantly less than 1.0, and while the intercepts were not significantly different from 0.0, they were greater than the intercept for our new P runoff model (Figure 4). Based on the data used, results show that BARNY and MinnFarm over-predicted at low observed rates of P loss, and under-predicted at high rates of P loss. These trends are because BARNY and MinnFarm use a constant concentration of runoff total P (85 mg/L) to estimate total P loss. This constant under-predicts at high rates of P loss, and over-predicts at low rates of loss. In contrast, our new lot P runoff model predicted lot P loss more reliably across a wide range of measured loss rates. Thus, the new model provided a more robust, dynamic simulation of P loss for a variety of lot types, lot management, and climate. REFERENCES Gassman, P.W., J.R. Williams, X. Wang, A. Saleh, E. Osei, L.M. Hauck, R. C. Izaurralde, and J.D. Flowers. 2010. The Agricultural Policy/Environmental Extender (Apex) Model: An Emerging Tool for Landscape and Watershed Environmental Analyses. Trans. ASABE 53(3), 711-740. Kizil, U., J.A. Lindley, and G. Padmanabhan. 2006. Verification of nutrient transport modelling of a bison feedlot. Biosys. Engr. 94(3), 453-460. Koelsch, R.K., J.C. Lorimor, and K.R. Mankin. 2006. Vegetative treatment systems for management of open lot runoff: Review of literature. App. Engr. Agric. 22(1), 141-153. Williams, J.R., W.L. Harman, M. Magre, U. Kizil, J.A. Lindley, G. Padmanabhan, an;d E. Wang. 2006. Apex feedlot water quality simulation. Trans. ASABE 49(1), 61-73. Young, R.A., M.A. Otterby, and A. Roos. 1982. A technique for evaluating feedlot pollution potential. J. Soil Water Conserv. 37(1), 21-23.
Proc. of the 2016 Wisconsin Crop Management Conference, Vol. 55 44
MANURE ON PERENNIAL FORAGES: BENEFITS AND CHALLENGES
Bill Jokela1
Introduction Why apply manure on alfalfa and other perennial forage crops? There are several benefits, but also some concerns or challenges to be considered. Alfalfa and other forages have a large nutrient need – potassium, phosphorus, sulfur, micronutrients, and for grass forages, nitrogen. Manure is a good source of these nutrients and can produce yield increases if nutrients are deficient. Application of manure to forage crops increases the acreage base, which may be important to meet nutrient management plan requirements and avoid over application of P. And applying manure after harvest during the growing season opens up windows of time for manure application not available with most annual crops. While alfalfa and other legumes don’t benefit from nitrogen in manure, applied N reduces the amount of symbiotic N fixation, helping to buffer N availability and reducing the risk of nitrate leaching due to N application from manure. And the deep rooting pattern of alfalfa can capture nitrate that leached beneath the root zone other crops from excessive manure or fertilizer N application. (See Russelle and Jokela, 2013, for more detail.) There are also some challenges or limitations associated with manure application on forages – smothering and leaf coating, soil compaction and crown damage from wheel traffic, pathogens and feed contamination, surface runoff of nutrients, and odor and ammonia emission. Most of these concerns are associated with broadcast application after harvest and will be discussed in a later section. There are three general manure application strategies or times of application: preplant (before forage seeding), following last harvest at termination of the stand, and after harvest during the season.
Manure Application before Seeding Before planting is a good time to apply manure, especially on medium- to fine-textured soils deficient in P and/or K, so that the manure can be incorporated. Manure applied at this time must be thoroughly mixed with the soil to avoid seedling damage from manure-seed contact. Research has shown yield benefits from preplant application. Liquid dairy manure was applied before seeding of alfalfa at three sites in Minnesota (Rosemount and Waseca) and Wisconsin (Marshfield) (Kelling and Schmitt, 2003). Seeding year yields were greater or equal to those from the treatment with P and K fertilizer and the no-fertilizer control at two of the sites. At the Waseca location manure did not increase yields because of severe compaction with the large equipment. During the first full production year yields from manure were greater than both control and fertilizer treatments at all sites. The yield benefit from manure compared to that from P and K fertilizer was attributed to some combination of other nutrients (e.g., S, B), soil physical and/or microbial effects, and possibly N in the seeding year. 1 Research Soil Scientist, USDA-Agricultural Research Service, Marshfield, WI.
Proc. of the 2016 Wisconsin Crop Management Conference, Vol. 55 45

Application before Stand Termination or Plowdown
Manure application after the last harvest just before termination of alfalfa or other perennial forage is a favored time of manure application because it avoids any potential damage to the forage stand and provides N for the following crop (e.g., corn). However, N mineralization after alfalfa termination often meets or exceeds the need of the following crop, resulting in high levels of soil N and increased risk of nitrate leaching. The extent of this phenomenon depends on soil texture, the characteristics of the manure and how much is applied, as well as the density and quality of legume in the forage crop. A summary of research results from 61 sites in Iowa, Wisconsin, Minnesota, and Pennsylvania showed only seven sites showed any corn yield response to fertilizer N the first year following alfalfa plowdown (Kelling and Schmitt, 2003). A comprehensive review of recent research in Minnesota, as well as many other published results (Yost et al., 2015: 259 trials total) also concluded that first-year corn after alfalfa is not likely to respond to N application on medium textured soils, but the response depends on specific factors such as length of alfalfa stand and early season soil conditions.
Topdress Application after Harvest during the Season Surface broadcast is the dominant method of manure application for alfalfa and other perennial forages in North America. The wide spreading pattern of broadcast application reduces wheel traffic over the field and increases the speed of application. Broadcast slurry can also increase yields of forages, especially grasses. Much of the research on manure application on grass forages has been done in Europe, where most of the forage production is grasses, but there has been some work done in North America. Research in the Upper Midwest (MN, WI, IA) showed grass forage yield increases of 150% or more from broadcast manure compared to a no N control (Schmitt et., 1999). In research from Vermont (Carter et al., 2010) and British Columbia (Bittman et al., 2007) liquid dairy manure increased grass yields 90 to 100%, approximately equal to that from fertilizer N Application of liquid manure on established stands of alfalfa has had mixed results, showing yields with topdressed slurry increasing, decreasing, or having no effect in research in Minnesota and Wisconsin (Kelling and Schmitt, 2003; Coblentz et al., 2014), Italy (Ceotto and Spallacci, 2006), and Maryland (Min et al., 1999). Probably the most comprehensive study was one in Ontario, in which liquid dairy manure was band-applied using drop-hoses with fan nozzles twice annually to 49 alfalfa cultivars at 4500 gal/acre for three years (Bowley et al., 2009). Average alfalfa yields were increased 14% with manure compared to the no-manure control, with some cultivars showing much larger yield responses to manure than others. While topdress application of manure may increase forage yields and provide other benefits, there are a number of challenges or concerns associated with broadcast application after harvest. Excessive manure rates can cause smothering and coating of plants that can result in leaf scorching and clogging of pores. Wheel traffic from loaded spreaders can damage crowns and compact soil, especially under wet soil conditions. This can sometimes result in stand loss and yield decline. Manure often contains pathogens, so there is a risk of feed contamination and aerial or runoff transport. Odor from broadcast application is a nuisance issue that may affect neighbors in the vicinity of
Proc. of the 2016 Wisconsin Crop Management Conference, Vol. 55 46

manured fields. Ammonia emission can represent a significant economic loss for grass forage production, and is a growing environmental concern because of potential adverse effects on air quality, specifically fine particulate formation, and re-deposition onto nitrogen-sensitive water or land areas. And transport of nutrients via surface runoff can contribute to eutrophication of lakes and streams, especially with late fall and winter applications. While these are very real concerns, their impact can be minimized by careful management, including use of alternative methods of application, since most of these are the most serious with surface broadcast application.
Alternatives to Broadcast Application Concerns about odor, gaseous emissions, feed contamination, smothering of plants, and runoff of nutrients and pathogens from broadcast manure have led to development of alternative application methods. These include shallow injection, surface banding above the canopy, banding on the soil surface with drag-shoe or trailing-foot, and band application with tine aeration. These methods can reduce the potential for pathogen con-tamination and plant damage from smothering or leaf burn because manure is applied in narrow bands directly into the soil or on the soil surface, often underneath crop canopy, thereby limiting direct contact of foliage with manure. Other possible benefits are reduced odor, nutrient runoff, and gaseous emissions. These benefits need to be balanced against the potential for stand or yield loss from soil disturbance and mechanical damage to plants. Grass forage yields in British Columbia were increased by an average of 7% by banding dairy slurry with a drag-shoe compared to broadcast application, but were increased even more by banding manure with tine aeration (Bittman et al., 2005). Banded manure/tine aeration also reduced ammonia emission by almost 50% and runoff N and P loss by 50 to 90% (Bittman et al., 2005; van Vliet, 2006). Band application of liquid dairy manure in Vermont reduced ammonia emission by 27 to 46% (depending on rate) and increased yields in two of four site-years compared to broadcast application (Pfluke et al., 2011; Carter et al., 2010). There has been only limited research with alternative application methods on alfalfa. The research from Ontario discussed earlier (Bowley et al., 2009) that showed a 14% yield increase from surface-banded dairy slurry compared to a no-manure control, showed only a 10% yield increase from banded manure following tine-aeration. The authors suggested that this may have been the result of increased manure-root contact by infiltration of manure into the aerator slots. In another study in Saskatchewan (PAMI, 2001) injection of manure increased alfalfa yields on a low fertility site but decreased yields on a high fertility site due to stand damage, suggesting that the yield effect depended on the balance between yield response to manure nutrients and mechanical damage from injection.
Manure Application Methods for Alfalfa: Ongoing Wisconsin Research2 We have completed 2 years of a 3-year study evaluating different methods for applying liquid dairy manure on alfalfa at the Marshfield Agricultural Research Station. The following treatments were applied to an established alfalfa site on a Withee silt loam (somewhat poorly drained, 1 to 3% slope): a) control (no manure; fertilizer based on need); b) broadcast liquid dairy manure; c) surface banded manure; d) aerator/banded 2 Partial funding for ongoing research provided by USDA-NIFA Dairy CAP project.
Proc. of the 2016 Wisconsin Crop Management Conference, Vol. 55 47

manure (AerWay SSD); and e) shallow injection (Yetter Avenger) (see Fig. 1). Manure was applied annually after first (2015) or second (2014) harvest with an 1800-gallon research model spreader (Nuhn Industries, Ltd.; Sebringville, ON, Canada) with a quick-attach feature that allows changing of implements for different application treatments. Fifteen 24 x 42 ft plots were arranged in a randomized complete block design with three replicates. Target manure application rate was 4000 to 5000 gal/acre, but a flow meter equipment failure in 2014 resulted in an excessive rate that year (approximately 10,000 gal/acre).
Alfalfa yields for individual harvests ranged from 1 to 1.5 ton/acre for third cut to over 3 ton/acre for first harvest with no significant yield differences in most cases (Table 1). There were no significant treatment effects on yields in the first harvest after the Aug 7, 2014, manure application, nor on the next harvest in June of 2015. This would suggest that there was little or no damage to the stand due to manure or mechanical effects of application equipment (despite the high application rate); neither was there a yield benefit from manure nutrients. However, yield from shallow injection was significantly lower than most other treatments in the first harvest (22 July) following the 2015 manure application. But the yield effect had disappeared by the next harvest in August. Ammonia emission was greatly reduced (95% or more) by shallow injection compared to other manure application methods. Emission of N2O, a potent greenhouse gas, was increased by manure application, that increase limited primarily to a few-week period following application. Treatment effects were somewhat variable, but in 2015 N2O emission was significantly greater from the injection and aerator-band treatments. In summary, preliminary results from the first 2 years of this study show minimal effects of manure application on yield compared to the no-manure control (optimum or higher soil test P and K); however, there was some indication of a short-term (one harvest) decrease in yield from the injection treatment. Injection greatly decreased ammonia emission, but there may be a trade-off with increased greenhouse gas (N2O) emission.
Figure 1. Aerator/banded manure (Aerway SSD; left) and shallow injection (Yetter Avenger; right) application implements.
Proc. of the 2016 Wisconsin Crop Management Conference, Vol. 55 48

Table 1. Alfalfa yield (DM basis) for individual harvests in 2014 and 2015. Manure treatments were applied after second harvest in 2014 (Aug 7) and after first harvest in 2015 (June 30). 2014 2015
Treatment Jun 24
Aug 5 Sep 8 Jun 25
Jul 22 Aug 25
ton/acre
Control 2.89 2.03 c† 1.44 2.85 1.85 a 0.96 Broadcast 3.13 2.36 ab 1.39 2.93 1.84 a 1.00 Surface band 3.07 2.23 b 1.10 2.86 1.82 a 0.95 Aerator/band 3.10 2.46 a 1.46 3.03 1.76 ab 0.83 Shallow inject 3.14 2.29 ab 1.47 3.05 1.63 b 1.00 CV 6 4 5 7 5 25 P value NS 0.01 NS NS 0.06 NS † In each column, least square means followed by the same letter are not statistically different at p-value=0.05.
Conclusion
There are potential benefits of applying manure on perennial forages, in particular, increasing acreage for manure application and more flexibility in timing. Yields may be increased, especially for grass forages and on sites in need of nutrients, but yields may be unaffected or even decreased in some cases. The potential advantages of manure application on forages need to be considered in the context of some concerns – plant damage from manure or wheel traffic, nutrient runoff, excessive N at stand termination, and others. Most of these risks can be minimized by careful management, for example by spreading soon after harvest, avoiding traffic on wet soils, and avoiding application at stand termination if the N credit from the forage is adequate for the next crop. Several innovative liquid manure application methods offer additional options to improve N utilization, minimize forage contamination, decrease nutrient runoff, and provide more uniform manure application. To a large extent, however, the success of manure application on alfalfa depends on the specific conditions at the site and good decision-making by the manager.
References
Bittman, S., C.G. Kowalenko, T. Forge, D.E. Hunt, F. Bounaix, and N. Patni. 2007. Agronomic effects of multi-year surface-banding of dairy slurry on grass. Bioresource Technol. 98:3249-3258. Bittman, S., L.J.P. van Vliet, C.G. Kowalenko, S. McGinn, D.E. Hunt, and F. Bounaix. 2005. Surface-banding liquid manure over aeration slots: A new low-disturbance method for reducing ammonia emissions and improving yield of perennial grasses. Agron. J. 97:1304-1313.
Proc. of the 2016 Wisconsin Crop Management Conference, Vol. 55 49
Bowley, S.R., A. Bowman, and D. Hancock. 2009. Evaluation of forage varieties for tolerance to management stress. Final report CORD IV Project to Ontario Forage Council. Available online: www.ontarioforagecouncil.com/component/docman/doc_download/76-cordiv-report-bowley-26april2009.html Carter, J.E., W.E. Jokela, and S.C. Bosworth. 2010. Grass forage response to broadcast or surface-banded liquid dairy manure and nitrogen fertilizer. Agron. J. 102:1123-1131. Ceotto, E., and P. Spallacci. 2006. Pig slurry applications to alfalfa: Productivity, solar radiation utilization, N and P removal. Field Crops Res. 95:135-155. Coblentz, W.K., R.. Muck, M.A. Borchardt, S.K. Spencer, W.E. Jokela, M.G. Bertram, and K.P. Coffey. 2014. Effects of dairy slurry on silage fermentation characteristics and nutritive value of alfalfa. J. Dairy Sci. 97:7197-7211.
Kelling, K.A., and M.A. Schmitt. 2003. Applying manure to Alfalfa. North Central Regional Research Report 346. College of Agricultural and Life Sciences, Univ. of Wisconsin-Madison. http://www.soils.wisc.edu/extension/pubs/Manure%20Alfalfa.pdf Min, D.H., L.R. Vough, T. Chekol, and D.A. Kim. 1999. Effects of surface-applied dairy slurry on herbage yield and stand persistence: II. Alfalfa, orchardgrass, tall fescue, and alfalfa-orchardgrass. Asian-Aus. J. Anim. Sci. 12:766-771.
PAMI. 2001. Is swine manure injection into alfalfa stands a good idea? PAMI Research Update 751. Prairie Agricultural Machinery Institute, Humboldt, Saskatchewan. Available online: www.pami.ca/pdfs/reports_reasearch_updates/pami751.pdf Pfluke, P.D., W.E. Jokela, and S.C. Bosworth. 2011. Ammonia volatilization from surface-banded and broadcast application of liquid dairy manure on grass forage. J. Environ. Qual. 40:374-382. Russelle, M., and B. Jokela. 2013. Manure on alfalfa. In Bittman, S. (ed.) Advanced forage management. Pacific Field Corn Assoc., Agassiz, BC. Schmitt, M.A., M.P. Russelle, G.W. Randall, C.C. Sheaffer, L.J. Greub, and P.D. Clayton. 1999. Effects of rate, timing, and placement of liquid dairy manure on reed canarygrass yield. J. Prod. Agric. 12:239-243. van Vliet, L.J.P., S. Bittman, G. Derksen, and C.G. Kowalenko. 2006. Aerating grassland before manure application reduces runoff nutrient loads in a high rainfall environment. J. Environ. Qual. 35:903-911. Yost, M.A., J.A. Coulter, and M.P. Russelle. 2015. Managing the rotation from alfalfa to corn. Univ. of Minnesota Extension. http://www.extension.umn.edu/agriculture/corn/cropping-systems/managing-rotation-from-alfalfa-to-corn/docs/managing-rotation-from-alfalfa-to-corn.pdf
Proc. of the 2016 Wisconsin Crop Management Conference, Vol. 55 50

EVALUATING NITROGEN LOSS AFTER HEAVY RAINFALL
Carrie A.M. Laboski1
Introduction
The purpose of this paper is to explain how to evaluate the potential for N loss after heavy rainfall and determine corrective measures that may be taken.
Denitrification
Denitrification is the process whereby nitrate is converted to the gases dinitrogen or nitrous oxide and subsequently released to the atmosphere. This conversion is carried out by soil bacteria. Denitrification can be a significant mechanism for N loss on medium- and fine-textured soil. It is generally not an issue on coarse-textured soils because they do not remain saturated for any length of time. There are several environmental factors that determine if denitrification occurs and to what extent.
1. Nitrate. Nitrate must be present for denitrification to occur. If nitrate is not present or is in low concentrations, denitrifiaction losses will be minimal.
2. Soil water content and aeration. Denitrification occurs in wet soils with low oxygen concentrations. Denitrification increase with the length of time the soil is saturated. Standing water may result in a greater percentage of nitrate being denitrified.
3. Temperature. Denitrification proceeds faster on warmer soils, particularly when soil temperature is greater than 75oF.
4. Organic matter. Denitrification occurs because soil bacteria are breaking down organic matter under low oxygen conditions and the bacteria use nitrate in a biochemical process. Soils with low soluble organic carbon will have less potential for denitrification than soils with high soluble organic carbon. Thus, nitrate that resides deeper in the soil profile (e.g., below 12 inches) where there is less organic matter will have a greatly reduced or minimal probability of being denitrified.
5. Soil pH. Denitrification is negligible in soils with a pH < 5.0. Thus, pH likely does not limit denitrification on most of our cropland in Wisconsin.
Table 1 shows the combined effect of soil temperature and days of saturated soil on N loss. Soil at a temperature of 50oF that is saturated for four days is expected to denitrify a relatively small amount of the nitrate in the soil. Denitrification loss increase substantially as the duration of saturation increases from 4 to 10 days at 77oF soil temperature. Keep in mind that soil saturation causes physiological damage to a corn crop. Nielsen (2015) explains that young corn can survive four days of ponding if temperatures are below the mid-60’s°F, but if temperatures are over the mid-70’soF, then corn survival will be less than four days. Thus, depending on the temperature it may not matter how much N has been lost, the corn crop may never fully recover even if supplemental N is applied.
It is important to keep in mind that nitrate must be present for denitrification to occur. So N
losses will depend on the form of N that was applied and the time between application and saturated soil conditions. Table 2 provides estimates of the time it takes for various N fertilizer materials to transform to nitrate. Conversion of ammonium based fertilizers to nitrate takes 1 to 2
1 Professor, Dept. of Soil Science, 1525 Observatory Dr., Univ. of Wisconsin-Madison, Madison, WI, 53706
Proc. of the 2016 Wisconsin Crop Management Conference, Vol. 55 51
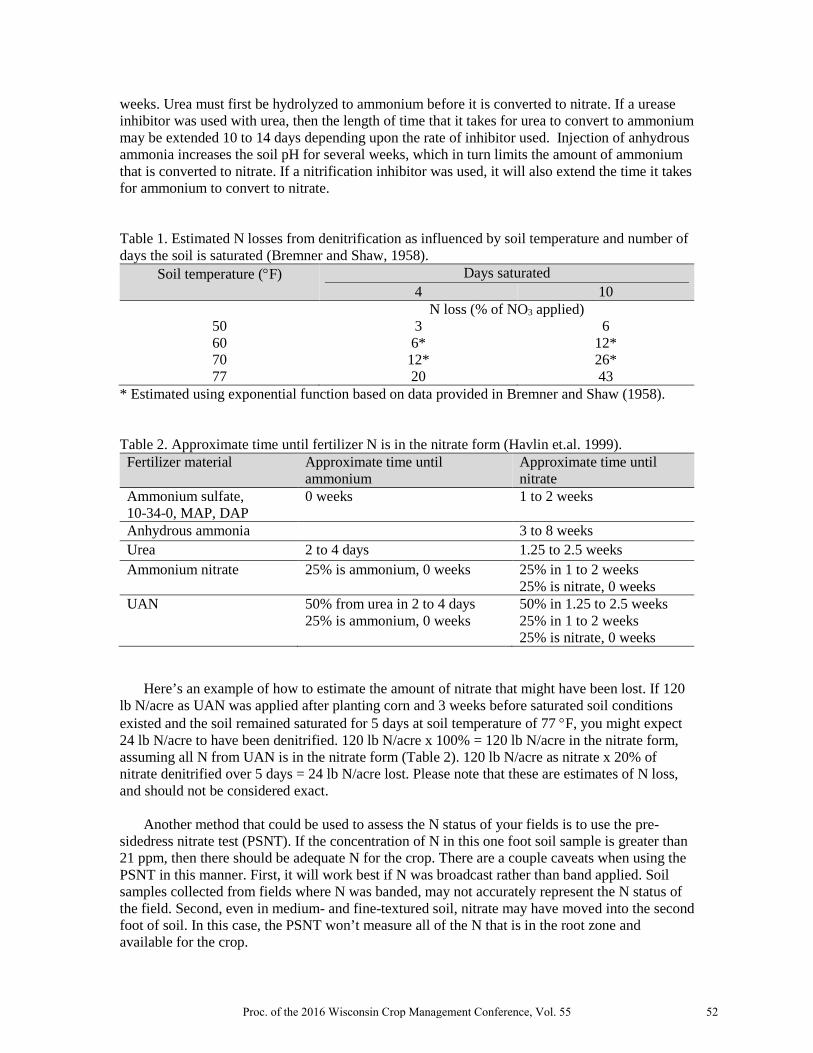
weeks. Urea must first be hydrolyzed to ammonium before it is converted to nitrate. If a urease inhibitor was used with urea, then the length of time that it takes for urea to convert to ammonium may be extended 10 to 14 days depending upon the rate of inhibitor used. Injection of anhydrous ammonia increases the soil pH for several weeks, which in turn limits the amount of ammonium that is converted to nitrate. If a nitrification inhibitor was used, it will also extend the time it takes for ammonium to convert to nitrate.
Table 1. Estimated N losses from denitrification as influenced by soil temperature and number of days the soil is saturated (Bremner and Shaw, 1958).
Soil temperature (°F) Days saturated 4 10
N loss (% of NO3 applied) 50 3 6 60 6* 12* 70 12* 26* 77 20 43
* Estimated using exponential function based on data provided in Bremner and Shaw (1958). Table 2. Approximate time until fertilizer N is in the nitrate form (Havlin et.al. 1999). Fertilizer material Approximate time until
ammonium Approximate time until nitrate
Ammonium sulfate, 10-34-0, MAP, DAP
0 weeks 1 to 2 weeks
Anhydrous ammonia 3 to 8 weeks Urea 2 to 4 days 1.25 to 2.5 weeks Ammonium nitrate 25% is ammonium, 0 weeks 25% in 1 to 2 weeks
25% is nitrate, 0 weeks UAN 50% from urea in 2 to 4 days
25% is ammonium, 0 weeks 50% in 1.25 to 2.5 weeks 25% in 1 to 2 weeks 25% is nitrate, 0 weeks
Here’s an example of how to estimate the amount of nitrate that might have been lost. If 120 lb N/acre as UAN was applied after planting corn and 3 weeks before saturated soil conditions existed and the soil remained saturated for 5 days at soil temperature of 77 °F, you might expect 24 lb N/acre to have been denitrified. 120 lb N/acre x 100% = 120 lb N/acre in the nitrate form, assuming all N from UAN is in the nitrate form (Table 2). 120 lb N/acre as nitrate x 20% of nitrate denitrified over 5 days = 24 lb N/acre lost. Please note that these are estimates of N loss, and should not be considered exact.
Another method that could be used to assess the N status of your fields is to use the pre-
sidedress nitrate test (PSNT). If the concentration of N in this one foot soil sample is greater than 21 ppm, then there should be adequate N for the crop. There are a couple caveats when using the PSNT in this manner. First, it will work best if N was broadcast rather than band applied. Soil samples collected from fields where N was banded, may not accurately represent the N status of the field. Second, even in medium- and fine-textured soil, nitrate may have moved into the second foot of soil. In this case, the PSNT won’t measure all of the N that is in the root zone and available for the crop.
Proc. of the 2016 Wisconsin Crop Management Conference, Vol. 55 52

If all or most of your N for corn is coming from an organic N source (manure and/or forage legume), then the PSNT can still be used to estimate N credits that are subtracted from your selected maximum return to N (MRTN) N rate. Note: when average May-June soil temperatures are more than 1°F below the long-term average, the N credit is often underestimated. For more details on how to use the PSNT see UWEX Publication A2809 Nutrient application guidelines for field, vegetable, and fruit crops in Wisconsin (http://www.soils.wisc.edu/extension/).
If all of the N was applied prior to the heavy rainfall, try to determine how much N loss may
have occurred using one or a combination of the methods just described. The next step is to decide whether or not you need or want to apply supplemental N fertilizer to your corn crop. When making this decision, compare the amount of N loss (in lb N/acre) that you think may have occurred to MRTN rate and profitable range of N rates for your N:corn price ratio. For example, let’s say that corn follows soybean on a high yield potential soil and you applied 130 lb N/acre preplant and now estimate that you lost 25 lb N/acre. If your N:corn price ratio is 0.10, then the profitable range of N rates is 105 to 130 lb N/acre. Thus, even with some N loss, you might still be within the profitable range of N rates. For more information on the MRTN, see UWEX Publication A2809 Nutrient application guidelines for field, vegetable, and fruit crops in Wisconsin (http://www.soils.wisc.edu/extension/).
Yield loss from under application or loss of N is real. When looking at N rate research at 35
sites across Wisconsin in 2006 and 2007, we found that using the MRTN rate for the 0.15 N:corn price ratio resulted in yield losses ranging from 6 to 11% at 20% of the sites. By comparison, 48% of the sites experienced 0 to 1% yield loss at the MRTN rate for the 0.15 N:corn price ratio. Note that these yield losses do not take into consideration the cost of N, so they should not be confused with a loss in profitability. If you are uncertain how much N may have been lost and the corn is clearly deficient in N, then application of 50 lb N/acre should result in profitable yield increases.
If you are not yet comfortable using the MRTN approach to selecting N rates, remember the
greatest yield increase comes from the first 50 lb N/acre applied to the crop. Thus, if you estimate that 100 lb N/acre or more may have been lost then apply supplemental N at a rate equal to about 50% of the amount of N lost.
Where the entire crop N requirement has not yet been applied, sidedress or other post-
emergence applications should contain the balance of the crop N requirement plus 25 to 50% of the fertilizer N that was already applied.
Options for applying supplemental N when it is needed include traditional sidedressing with anhydrous ammonia or N solutions. UAN solutions can also be applied as a surface band or as a broadcast spray over the growing crop. Dry N fertilizers (urea, ammonium sulfate, or ammonium nitrate) can also be broadcast applied to the crop. Leaf burning from solution or dry broadcast applications should be expected. Appling the dry materials when foliage is dry will help minimize burning. Broadcast N rates should be limited to 90 lb N/acre for corn with 4 to 5 leaves and to 60 lb N/acre for corn at the 8-leaf stage. Under N deficient conditions, corn will respond to supplemental N applications through the tassel stage of development if the N can be applied.
Leaching
Nitrate is the form of N that can be leached when precipitation (or irrigation) exceeds the
soil’s ability to hold water in the crop root zone. Leaching is a much bigger issue on sandy soils that typically hold 1 inch of water per foot of soil compared to medium- and fine-textured soils
Proc. of the 2016 Wisconsin Crop Management Conference, Vol. 55 53
that hold 2.5 to 3 inches of water per foot of soil. To determine if nitrate could leach out of the root zone, compare the rainfall totals in your area to the number of inches of water that your soil can hold in the crop root zone.
The amount of N loss from leaching is dependent not only on rainfall, but also on the amount
of N in the nitrate form. Using the information in Table 2, it is possible to estimate how much nitrate may have been leached. For example, if 75 lb N/acer as ammonium sulfate was applied when potatoes were planted 4 weeks prior to the rainfall, and 125 lb N/acre as ammonium nitrate was applied 3 days before the rainfall, then 135 to 140 lb N/acre may have leached. The 75 lb N/acre as ammonium sulfate at planting would have already been converted to nitrate plus 50% of the 125 lb N/acre as ammonium nitrate is in the nitrate form = 137.5 lb N/acre. The potato crop will have used some of the N that was applied at planting, thus leaching losses will be less than 135 lb N/acre.
Urea is highly water soluble. If the leaching rainfall occurred before urea had time to
hydrolyze (2 to 4 days), then urea may have leached. However, if there were more than 4 days between urea application and the leaching rainfall, then it is likely that all of the N would have converted to ammonium and remains within the root zone.
Nitrogen best management practices for corn on sandy soils is to sidedress or split apply N. If
sidedress N applications have not yet occurred, then growers should proceed as planned. If split N applications have occurred, supplemental N should be applied and should equal the approximate amount of nitrate that may have leached out of the root zone. Corn grown on irrigated sandy soils are highly responsive to N fertilization. On non-irrigated sandy soils, water (usually too little) limits crop yield more than N. Under N deficient conditions, corn will respond to supplemental N applications through the tassel stage of development if the N can be applied.
For a potato crop, N can be applied up to 60 days after emergence; later applications may not
improve yield or quality. Supplemental N application rates could be in the range of the amount of nitrate that was leached from all N applications applied after planting. Monitor the crop’s N status using the petiole nitrate test to determine if later N applications may be needed. For more information on the petiole nitrate test, see UWEX Publication A2809 Nutrient application guidelines for field, vegetable, and fruit crops in Wisconsin.
For irrigated corn or potato fields, N solutions can be injected into the irrigation water
(fertigation). Water application rates should not exceed the infiltration rate of the soil and should not exceed the soil’s ability to hold the water in the root zone of the crop. Thus, if the soil profile is full of water, you may need to wait a few days before fertigating. The key is to manage the water so that the N fertilizer that is being applied is not leached.
References
Bremner, J.M., and K. Shaw. 1958. Denitrification in soil. II: Factors affecting denitrification. J. Agric. Sci. 51:40-52.
Havlin, J.L., J.D. Beaton, S.L. Tisdale, and W.L. Nelson. 1999. Soil fertility and fertilizers. An introduction to nutrient management. 6th ed. Prentice Hall. Upper Saddle River, NJ.
Nielsen, R.L. 2015. Effects of flooding or ponding on corn prior to tasseling. Purdue Univ. Corny News Network. https://www.agry.purdue.edu/ext/corn/news/timeless/pondingyoungcorn.html
Proc. of the 2016 Wisconsin Crop Management Conference, Vol. 55 54

BASE SATURATION: WHAT IS IT? SHOULD I BE CONCERNED? DOES IT AFFECT MY FERTILITY PROGRAM?
Adam P. Gaspar* and Carrie A.M. Laboski 1/
Introduction: Since the 1950s there have been three philosophies driving soil fertility recommendations throughout the U.S. concerning certain base cations (Ca2+, Mg2+, K+). They include build and maintain, sufficiency level, and base cation saturation ratio (BCSR). The theory of an “ideal” BCSR in the soil has been extensively discussed and used to a limited extent throughout the Midwest by some soil testing labs to guide fertility recommendations. This “ideal” soil was first suggested by researchers from New Jersey in the 1940’s (Bear et al., 1945; Bear and Toth, 1948; Hunter, A.S., 1949; Prince et al., 1947) and further emphasized by William Albrecht, Professor from the University of Missouri. Their theory built upon work done by Loew and May (1901) which suggested that Ca and Mg should be in a 5:4 ratio for optimal plant growth. However, this theory has been a subject of great debate in terms of its utility for affecting crop yields and farmer profitability. Numerous studies have found flaws in the BCSR method and showed no proven yield increases, while a greater research base exists to support the sufficiency and build and maintain approaches (Eckert and McLean, 1981; McLean et al., 1983). Yet, some consultants and ag. retailers still use the BCSR method to guide fertility recommendations. All land-grant university fertility recommendations in the Midwest use a sufficiency or build and maintain approach. The University of Wisconsin recommendations employ a build and maintain approach, as do most surrounding states (IL, IA, IN, MI). This paper will discuss the theory behind the BCSR method, its applicability, if there is any value to it, and why state fertility recommendations do not endorse the BCSR method. Philosophy Behind the BCSR Approach: To understand the theory behind the BCSR method or specifically the Ca:Mg ratio, one must understand cation exchange capacity (CEC). Cations are positively charged ions in the soil solution (Ca2+, NH4
+, Mg2+, K+, Na+, etc.). CEC is defined as the total amount of cations, in milliequivalents (meq.), held to soil components through an electro-static attraction, which can be exchanged with cations in soil solution. A specific soil’s CEC is dependent upon three main factors:
1) The amount of clay (soil texture)
2) Type of the clay 3) Amount of organic
matter (OM) For this reason the CEC of a given soil can vary from 0 to 50 meq/100 g soil. Soils with a low CEC typically have a high sand fraction and low OM content, whereas soils with a high CEC have a relatively high clay fraction and/or OM content (Fig. 1). ___________________________ 1/ Research Assistant, Dept. of Agronomy and Professor, Dept. of Soil Science, respectively, Univ. of Wisconsin-Madison. *Corresponding author: [email protected]
Figure 1. Depiction of the Soil CEC. *From Spectrum Analytics Inc
Proc. of the 2016 Wisconsin Crop Management Conference, Vol. 55 55
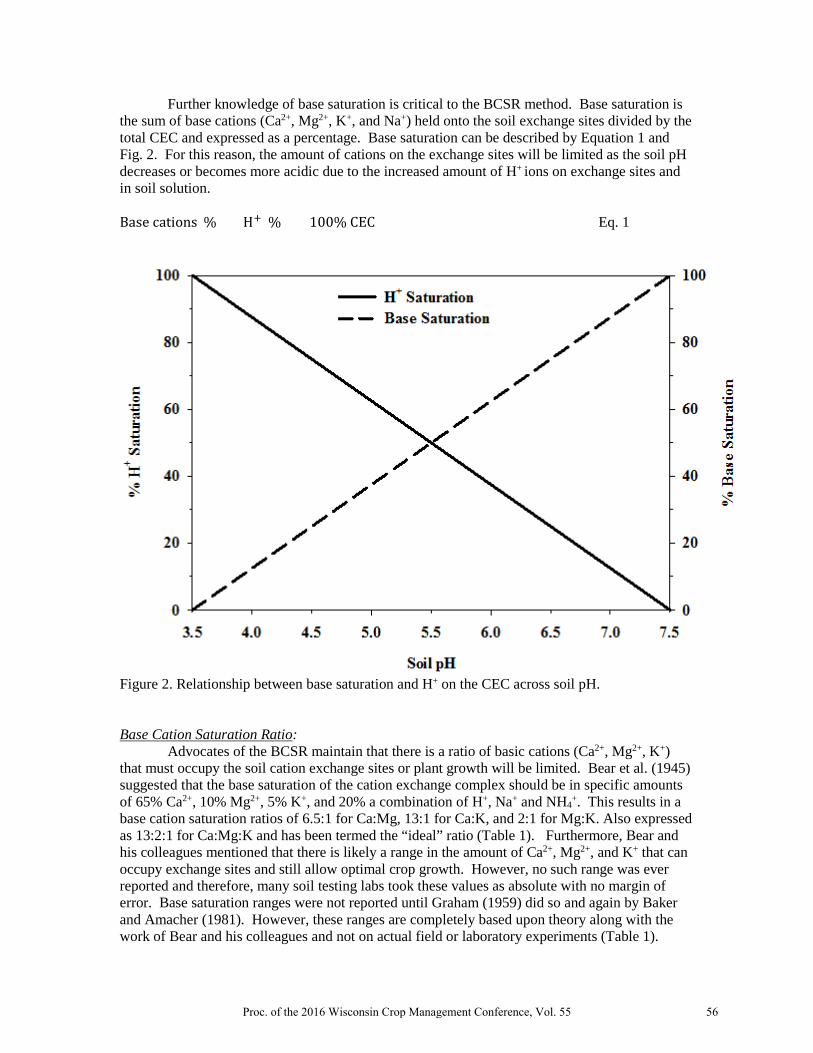
Further knowledge of base saturation is critical to the BCSR method. Base saturation is the sum of base cations (Ca2+, Mg2+, K+, and Na+) held onto the soil exchange sites divided by the total CEC and expressed as a percentage. Base saturation can be described by Equation 1 and Fig. 2. For this reason, the amount of cations on the exchange sites will be limited as the soil pH decreases or becomes more acidic due to the increased amount of H+ ions on exchange sites and in soil solution. Base cations(%) + H+(%) = 100% CEC Eq. 1
Figure 2. Relationship between base saturation and H+ on the CEC across soil pH. Base Cation Saturation Ratio:
Advocates of the BCSR maintain that there is a ratio of basic cations (Ca2+, Mg2+, K+) that must occupy the soil cation exchange sites or plant growth will be limited. Bear et al. (1945) suggested that the base saturation of the cation exchange complex should be in specific amounts of 65% Ca2+, 10% Mg2+, 5% K+, and 20% a combination of H+, Na+ and NH4
+. This results in a base cation saturation ratios of 6.5:1 for Ca:Mg, 13:1 for Ca:K, and 2:1 for Mg:K. Also expressed as 13:2:1 for Ca:Mg:K and has been termed the “ideal” ratio (Table 1). Furthermore, Bear and his colleagues mentioned that there is likely a range in the amount of Ca2+, Mg2+, and K+ that can occupy exchange sites and still allow optimal crop growth. However, no such range was ever reported and therefore, many soil testing labs took these values as absolute with no margin of error. Base saturation ranges were not reported until Graham (1959) did so and again by Baker and Amacher (1981). However, these ranges are completely based upon theory along with the work of Bear and his colleagues and not on actual field or laboratory experiments (Table 1).
Proc. of the 2016 Wisconsin Crop Management Conference, Vol. 55 56
The BCSR method focuses on keeping these three nutrients close to specific cationic ratios (Table 1) regardless of soil test values, soil type, crop, and yield potential. However, because the BCSR approach solely focuses on maintaining a specific ratio between Ca2+, Mg2+, and K+, (13:2:1) the amount of these nutrients in the soil can vary considerably depending upon the given soil’s CEC (Table 2) and actual base saturation (Table 4). Table 1. Previously reported base saturations and subsequent base cation saturation ratios for an “ideal” soil. Nutrient Bear et al. (1945) Graham (1959) Baker & Amacher (1981) Base Saturations (%) Ca 65 65 – 85 60 – 80 Mg 10 6 – 12 10 – 20 K 5 2 – 5 2 – 5 Base Cation Saturation Ratios Ca:Mg 6.5:1 5.4:1 – 14.1:1 3.0:1 – 8.0:1 Ca:K 13:1 13.0:1 – 42.5:1 12.0:1 – 40.0:1 Mg:K 2:1 1.2:1 – 6.0:1 2.0:1 – 10.0:1 *Bear et al. (1945) is considered the “ideal” ratio.
For example, a soil with a CEC of 5 meq/100 g soil will contain approximately 1,300 lb/acre Ca (650 ppm) compared to 10,400 lb/acre Ca (5,200 ppm) in a soil with a CEC of 40 meq/100 g, both at the same base saturation of 65% Ca (Table 2). While, these levels of Ca are not detrimental to plant growth, reaching this Ca base saturation for a high CEC soil can require large and expensive fertilizer applications. For instance, if the Ca:Mg ratio is initially 5.5:1 (55% Ca & 10% Mg) and the soil CEC is 40 meq/100 g, there is roughly 8,800 lb/acre Ca. Obviously, a soil with over 4 tons/acre Ca (4,000 ppm) is in excess supply, but the BCSR approach would recommend 3.6 tons/acre of gypsum to bring that soil to the “ideal” ratio of 6.5:1. At $40/ton of gypsum, this would cost approximately $144/acre on soil that is already excessively high for Ca (>1000 ppm) as conveyed by the build and maintain approach (Table 3). Table 2. Comparison of two soils with the same base saturations but different CEC and their approximate levels of calcium, magnesium, and potassium in the soil at the “ideal” ratio. CEC = 40 meq/100g CEC = 5 meq/100g
Nutrient Base saturation Estimated soil test level % ppm ppm Ca 65 5,200 650 Mg 10 480 60 K 5 780 98 Na+H+etc. 20 -- --
Another two soils with the same CEC, both at the “ideal” ratio can have vastly different
amounts of Ca, Mg, and K, due to different base saturations of the cation exchange complex (Table 4). Displayed in Table 4 are two sandy soils with low CEC that are both at the “ideal” ratio, however soil #2 with base saturations of 32.5% Ca, 5% Mg, and 2.5% K would contain less than optimal amounts of all three nutrients for crop production. The soil test levels would be approximately 325 ppm Ca, 30 ppm Mg, and 49 ppm K (Table 3). All three nutrients would fall into the low-end of the Low soil test category (Table 3) and therefore likely limit crop production
Proc. of the 2016 Wisconsin Crop Management Conference, Vol. 55 57

even though the soil is at the “ideal” ratio. Furthermore, such a low saturation of the CEC with Ca, Mg, and K would likely lead to a pH well below 6.0 due to high saturation of H+ ions on the exchange sites (Figure 2). Current recommendations would suggest an application of ag. or dolomitic lime to correct the pH. Besides raising the pH, the lime application would also move the BCSR away from the “ideal” ratio, but actually improve crop production due to a more favorable pH.
Table 4. Comparison of two soils with the same CEC and “ideal” ratio of 13:2:1 of Ca:Mg:K but different percent base saturations and their approximate levels of calcium, magnesium, and potassium.
Nutrient Base saturation Estimated soil
test level
Base saturation Estimated soil
test level Soil #1 Soil #2 % ppm % ppm Ca 65 650 32.5 325 Mg 10 60 5 30 K 5 98 2.5 49 Na+H+etc. 20 -- 60 -- *Both soils are at the “ideal” ratio.
Research on the Base Cation Saturation Ratio: Ratio’s in Wisconsin Soil: The growing environment and soil types vary considerably across Wisconsin. Schulte and Kelling (1985) quantified the Ca:Mg ratio of 17 common soil types throughout Wisconsin and found the ratio ranged from 8.1:1 to 1.0:1 (Table 5). Some of the silt loam soils, like Antigo, fell near 4:0.1 compared to soils with more clay, like Marathon with a ratio of 7.7:1. Table 5. Ca:Mg ratio for various soil types throughout Wisconsin.*
Soil Ca:Mg Ratio Soil Ca:Mg Ratio Soil Ca:Mg Ratio Antigo 4.0:1 Kewaunee 3.1:1 Pella 3.9:1 Almena 3.2:1 Marathon 7.7:1 Plainfield 6.1:1 Boone 1.0:1 Morley 4.0:1 Plano 3.3:1
Dubuque 4.0:1 Norden 8.1:1 Poygan 4.3:1 Gale 4.3:1 Onaway 6.7:1 Withu 3.5:1 Freer 3.7:1 Ontonagon 4.0:1
* From Schulte and Kelling (1985).
Table 3. Wisconsin soil test categories for calcium, magnesium, and potassium.*
Nutrient Soil type Very low Low Optimum High Very high
________________________Parts per million (ppm)_________________________________
Ca Sandy 0 – 200 201 – 400 401 – 600 >600 -- Loamy 0 – 300 301 – 600 601 – 1000 >1000 -- Mg Sandy 0 – 25 26 – 50 51 – 250 >250 -- Loamy 0 – 50 51 – 100 101 – 500 >500 -- K Sandy <45 45 – 65 66 – 90 91 - 130 >130 Loamy <70 70 – 100 101 – 130 131 - 160 161 - 190 *From Laboski and Peters (2012).
Proc. of the 2016 Wisconsin Crop Management Conference, Vol. 55 58

Obviously the Ca:Mg ratio will vary between soil types, but theory would suggest that the ratio should change after years of producing a crop and subsequently removing various amounts of exchangeable Ca and Mg. However, the effect of cropping was negligible and only decreased the ratio in the Boone loamy soil (Table 6). It was noted that this decrease was a result of reducing the exchangeable Ca (Schulte and Kelling, 1985). Table 6. Effect of crop production on the Ca:Mg ratio in four Wisconsin soils.*
Ca:Mg Ratio Soil Non-Cropped Cropped
Plainfield sand 7.9:1 (850/108)†
8.7:1 (590/68)
Boone loamy sand 1.5:1 (75/50)
1.0:1 (50:50)
Gale silt loam 2.6:1 (540/206)
4.3:1 (2,040/472)
Ontonagon silt loam 3.9:1 (1930/140)
4.2:1 (2,660/634)
*From Schulte and Kelling (1985). †Actual pounds of exchangeable Ca/exchangeable Mg.
Effects of BCSR on Crop Production:
Due to the popularity of BCSR fertility recommendations from some commercial soil testing labs, many studies were conducted in the 1970s and 1980s to test this methodology. The results from these studies have shown almost no evidence of a base cation saturation ratio effect on crop yields. In fact, the results from Bear et al. (1945) and Graham (1959) may be more attributed to the changes in soil pH when the base saturation of Ca and Mg was adjusted to 65% and 10%, respectively, rather than the actual ratio. Liebhardt (1981) showed a direct relationship between soil pH and exchangeable Ca+Mg (Fig. 3). Coincidently the “ideal” ratio corresponds with a pH slightly above 6.0, which is optimum for growth of non-leguminous crops and may explain the increased plant growth reported by Bear et al. (1945), Bear and Toth (1948), Hunter (1949), and Prince et al. (1947). Furthermore, Liebhardt (1981) reported that there is a wide range of Ca:Mg ratios that will support corn and soybean production given K saturation is not limiting. This agrees with Key et al., (1962) who reported no effect of the Ca:Mg ratio, across a CEC range of 3 to 27 meq/100 g, on corn and soybean yield given the ratio is not below 1.0:1, which is extremely rare in agricultural soils. Furthermore, a study in Ohio, evaluated 18 different BCSR combinations over four years and their effect on corn and soybean grain yields (McLean et al., 1983). The results of this study identified no relationship between BCSR and grain yield and no specific “ideal” ratio was found. Actually, there was a wide range of ratios that corresponded to the highest and lowest grain yields each year and are displayed in Table 7.
Figure 3. Soil pH - Ca+Mg relationship. *From Liebhardt (1981)
Proc. of the 2016 Wisconsin Crop Management Conference, Vol. 55 59

Table 7. Range of BCSR’s for the five highest and lowest yields for corn and soybeans. Ranges in BCSR Ratio Yield Level Corn (1975) Corn (1976) Soybean (1977) Soybean (1978) Ca:Mg Highest Five 5.7 – 26.8 5.7 – 14.3 5.7 – 14.0 5.7 – 26.8 Ca:Mg Lowest Five 5.8 – 21.5 5.0 – 16.1 2.3 – 16.1 6.8 – 21.5 Mg:K Highest Five 0.6 – 3.0 1.3 – 3.1 1.0 – 3.0 1.1 – 3.1 Mg:K Lowest Five 1.1 – 2.1 0.7 – 2.1 0.7 – 3.6 0.7 – 2.1 *Data from McLean et al. (1983) and table adapted from Rehm (1994).
Simson et al. (1979) also found no effect of the Ca:Mg ratio on corn grain yield and alfalfa dry matter production at four locations throughout Wisconsin where a ratio as low as 1.0:1 was tested. They went on to further suggest that a very wide range of Ca:Mg ratio would support alfalfa and corn production. The same conclusions were found to be true for the Mg:K ratio in an irrigated sandy soil in Nebraska where the BCSR of 10.3:2.5:1.0 was altered up and down by additions of Mg and K but maintained above critical soil test values for crop production (Rehm and Sorensen, 1985). Regardless of any Mg or K application, no effect on grain yield was observed. The only plant effect observed when altering the soils BCSR was the relative concentration of Ca, Mg, and K in plant tissue. Rehm and Sorensen (1985) found the Mg concentration of the plant increased as Mg saturation of the CEC increased, but Mg plant tissue concentration actually decreased when K saturation of the CEC increased, which agrees with McLean and Carbonell (1972). Calcium concentrations in alfalfa and corn were also found to increase when the Ca saturation of the CEC increased (Simon et al., 1979). However, even though plant uptake of these various cations (Ca2+, Mg2+, K+) could be altered by changing the base saturation of the soil’s CEC, no yield increases resulted. Build and Maintain Approach:
Unlike the BCSR, a build and maintain approach builds fertility levels to critical soil test levels by applying fertilizer over multiple years, avoiding a one-time excessively high application rate. Once the critical soil test level is reached based upon the crop rotation and soil type, fertilizer recommendations are then based upon maintenance (annual crop removal), not keeping a specific soil cationic ratio (Laboski and Peters, 2012; Macnack et al., 2013). This concept is best illustrated by Figure 4, where the relative fertilizer application decreases as the soil test level builds. In addition, the amount of fertilizer targeted at either crop removal or soil building proportionally changes across the soil test categories. For instance, when soil test levels are below optimum, a rate that meets crop removal is applied plus a certain amount of fertilizer targeted to build the soil test level into the optimum range. Within the optimum soil test category, enough fertilizer is recommended to meet only crop removal. If the soil test level moves above the optimum category, the fertilizer application includes a reduced rate for crop removal. For example, when the soil tests in the high category the recommendations is ½ of crop removal and when in the very high category, only ¼ of crop removal is recommended. This helps maintain profitability when the soil test level is above optimum because yield responses to fertilizer are not as large or frequent in these categories. In summary, the build and maintain approach directs producers to keep soil test levels or the amount of Ca, Mg, and K within an optimum range (Table 4) and then continue to fertilize the crop, not the soil, to maximize profitability throughout their crop rotation (Fig. 4).
Proc. of the 2016 Wisconsin Crop Management Conference, Vol. 55 60

Figure 4. Theory behind a build and maintain fertility recommendation. Conclusion: In summary, the BCSR approach to soil fertility was developed in the 1940s and is only based upon a handful of studies conducted in the eastern US (Bear et al., 1945; Bear and Toth, 1948; Hunter, A.S., 1949; Prince et al., 1947). Unfortunately, it was incorporated into soil fertility recommendation at some soil testing labs during the 1950s and still persists with a few ag. retailers throughout the country. Its methodology can lead to expensive, non-consistent recommendations that hold Ca, Mg, and K at very different levels due to a soil CEC and/or base saturation. In many cases this can result in excessive fertilizer applications or nutrient deficiencies even though the “ideal” ratio is being held. There was considerable work done through the 1970’s and 1980’s to test the BCSR concept. The conclusion of all these studies was that no “ideal” ratio or range of ratios existed to improve crop production and advised that these nutrients should be held in sufficient, but not excessive levels, instead of aiming for a specific ratio or base saturation (Key et al., 1962; McLean et al., 1983; Moser, 1933; Rehm and Sorensen, 1985; Simson et al., 1979). In contrast, this paper also summarizes the methodology behind the build and maintain soil fertility approach, which is backed by a larger research base with proven yield responses. In addition, this approach includes an economic aspect when creating fertility recommendations. The build and maintain or sufficiency approach is currently recommended by all Universities throughout the Midwest and should be used, instead of the BCSR approach, by growers to employ, environmentally and economically sustainable fertility programs. References: Baker, D.E., and M.C. Amacher. 1981. The development and interpretation of a diagnostic soil-testing program. Pennsylvania State University Agricultural Experiment Station Bulletin 826. State College, PA.
Soil Test Category
V. Low Low Optimum High V. High E. High
Relat
ive Fe
rt. A
pplic
ation
Rate
(%)
0
25
50
75
100
125
150
175
Crop Removal Soil Build
No
Fert
ilize
r
Proc. of the 2016 Wisconsin Crop Management Conference, Vol. 55 61
Bear, F.E., A.L. Prince, and J.L. Malcolm. 1945. Potassium needs of New Jersey soils. New Jersey Agric. Exp. Stn. Bull. No. 71. Bear, F.E. and S.J. Toth. 1948. Influence of calcium on availability of other cations. Soil Sci. 65:69-96. Graham, E.R. 1959. An explanation of theory and methods of soil testing. Bull. 734. Missouri Agric. Exp. Stn., Columbia. Hunter, A.S. 1949. Yield and composition of alfalfa as influenced by variations in the calcium-magnesium ratio. Soil Sci. 67:53-62. Key, J.L., L.T. Kurtz, and B.B. Tucker. 1962. Influence of ratio of exchangeable calcium-magnesium on yield and composition of soybeans and corn. Soil Sci. 93:265-270. Laboski, C.A.M., and J.B. Peters. 2012. Nutrient application guidelines for field, vegetable, and fruit crops in Wisconsin. Coop. Ext. Serv. A-2809. Univ. of Wisconsin, Madison, WI. Liebhardt, W.C. 1981. The basic cation saturation concept and lime and potassium recommendations on Delaware Coastal Plain soils. Soil Sci. Soc. Am. J. 45:544-549. Loew, O., and D.W. May. 1901. The relation of lime and magnesia to plant growth. USDA Bur. of Plant Industries Bull. 1. USDA, Washington, DC. Macnack, N., B.K. Chim, B. Amedy, and B. Arnall. 2013. Fertilization based on sufficiency, build-up, and maintenance concept. Coop. Ext. Serv. PSS-2266. Oklahoma State Univ., Stillwater, OK. McLean, E.O. and M.D. Carbonell. 1972. Calcium, magnesium, and potassium ratios in two soils and their effects upon yields and nutrient content of German millet and alfalfa. Soil Sci. Soc. Am. Proc. 36:927-930. McLean, E.O., R.C. Hartwig, D.J. Eckert, and G.B. Triplett. 1983. Basic cation saturation ratios as a basis for fertilizing and liming agronomic crops. II. Field studies. Agron J. 75:635-639. Prince, A.L., M. Zimmerman, and F.E. Bear. 1947. The magnesium supplying power of 20 New Jersey soils. Soil Sci 63:69-78. Rehm, G. W. 1994. Soil cation ratios for crop production. Coop. Ext. Serv. 533. Univ. of Minnesota, St. Paul, MN. Rehm, G.W. and R.C. Sorensen. 1985. Effects of potassium and magnesium applied for corn grown on an irrigated sandy soil. Soil Sci. Soc. Am. J. 49:1446-1450. Schulte, E.E., and K.A. Kelling. 1985. Soil calcium to magnesium ratios – should you be concerned? Coop. Ext. Serv. G-2986. Univ. of Wisconsin, Madison, WI. Simson, C.R., R.B. Corey, and M.E. Sumner. 1979. Effect of varying Ca:Mg ratios on yield and composition of corn and alfalfa. Commun. Soil Sci. Plant Anal. 10:153-162.
Proc. of the 2016 Wisconsin Crop Management Conference, Vol. 55 62
________________________________________
1/ This work is partially supported by the USDA National Institute of Food and Agriculture, Hatch project 1006557 2/ This project is partially supported by a Midwest Forage Association Research Grant. 3/ Research Assistant, Post-doc Research Associate, and Assistant Scientist, Dept. of Dairy Science, 1675 Observatory Dr., Univ. of Wisconsin, Madison, 53706 4/ Research Agronomist/Leader, USDA Dairy Forage Research Center IEIDM, 2615 Yellowstone Dr, Marshfield, WI 54449
SORGHUM AS A FORAGE IN WISCONSIN1, 2 /
Elizabeth Remick, Matt Akins, Huawei Su,3/ and Wayne Coblentz4/
Background
Growing of moderate quality forages that meet and not exceed requirements of dairy
replacement heifers is not commonly done; however, it would have a positive impact on the dairy industry. It is typical for heifers to gain excessive bodyweight, especially post-puberty which negatively impacts first lactation milk production when fed diets high in energy. Replacement dairy heifers are typically fed high forage diets with a combination of corn silage and alfalfa or grass silage. Corn silage is typically high energy (70 to 75% TDN, DM basis) and exceeds dairy heifer requirements (900 to 1200 lb heifers require 62% TDN, DM) causing excess gain and overconditioning. Use of lower quality forages would reduce heifer over-conditioning. Sorghum and sorghum-sudangrass have a lower nutritive quality (higher fiber, lower starch) than corn silage and would be an alternative to reduce excess heifer weight gains.
New types of sorghum called photoperiod sensitive are now being marketed as both a
forage and biofuel crop in various regions across the US including the Midwest. Photoperiod sensitive (PS) sorghum and sorghum-sudangrass plants stay vegetative until the daylight hours reach 12 hours and 20 minutes (mid-September). This allows the plant to accumulate large amounts of forage mass during the growing season. The delay in progression to reproductive stages and senescence can cause challenges with harvesting as the plant has not dried to an adequate moisture level for silage harvest (60 to 70% moisture) so harvest management strategies need to be evaluated for this new forage. Photoperiod sensitive sorghums have been evaluated in Iowa (Salas-Fernandez, 2010) with average yields of 21 tons DM/ha across several hybrids compared to 16 tons DM/ha for conventional forage sorghum hybrids. However, PS sorghum has not been evaluated as a dairy forage source in colder climates such as those in Central Wisconsin.
The objective of this study was to evaluate the yield of PS forage sorghum and sorghum-
sudangrass compared to non-PS sorghum, sorghum-sudangrass and corn silage. We chose to conduct the study at the Hancock and Marshfield Agricultural Research Stations due to differences in soil characteristics (silt loam soil at Marshfield and sandy soil at Hancock).
Methods
Forages evaluated included 1 PS forage sorghum, 1 PS sorghum-sudangrass, 1 forage
sorghum, 1 BMR forage sorghum, 1 sorghum-sudangrass, 1 BMR sorghum-sudangrass, and 1 PS sudangrass hybrid. Two management factors were evaluated in a factorial treatment design (planting date and harvest strategy). The two plantings were 1) early June mid-June. Harvest methods were either 1) single harvest in early fall once the forage was at an adequate moisture for forage harvesting or was killed by a frost or 2) multiple harvests with one in early August and
Proc. of the 2016 Wisconsin Crop Management Conference, Vol. 55 63

another in mid-October after a killing frost. The treatments were arranged in a split-plot design such that the harvest methods were in separate randomly assigned halves within each block to avoid shading of the multiple harvest plots by the single harvest plots after the first harvest. Four replications for each planting, harvest, and variety combination were evaluated.
Seeding rates were corn at 32,000 seeds/acre, forage sorghum at 100,000 seed/acre (7
lb/acre), sorghum-sudangrass at 20 lb/acre, and sudangrass at 15 lb/acre. Soil was tilled prior to planting. Starter fertilizer was applied at 20 lb N per acre at planting. Corn was planted using a four-row planter set at 30 inch rows. All others were established using a 5-foot no-till drill set at 15 inch rows. Plot length was 15 feet. Nitrogen fertilizer was applied at approximately the three to four leaf stage with the entire N amount given for the single harvest plots and ½ the allotment for the multiple harvest plots. The remaining N for the multiple harvest plots was applied following the August harvest.
Harvest measurements included height, growth stage and kernel maturity. Plots were
harvested using a 3-foot sickle bar mower or by hand using a corn knife at approximately 4 inch cutting height. Harvested forage was weighed using 30 gallon trash cans and then chopped using a gas-powered wood chipper. Chopped forage was analyzed for dry matter content by drying in a forced air oven at 55 °C until no change in weight (typically 4 to 5 days). Forage dry matter yield (tons DM per acre) was calculated based on the forage dry matter amount from the harvest yield data and sample dry matter content (wet forage yield x DM content) and the area harvested (length x width; ex. 2.5 ft x 15 ft). Data presented are means from four replicates of each treatment combination with each site presented separately. Multiple harvest yields were combined to give a total yield for both harvests. Corn harvested during the August harvest did not have any subsequent regrowth.
Results
Data are presented in Table 1. Planting date generally had a negative impact on yield
with lower yields for the later planting date except at the Marshfield site. The early June planting date was followed by heavy rain fall that caused crusting of the soil surface and delayed germination. In addition, planting depth of the sorghums was approximately 1.5 inches which also delayed and drastically reduce germination and likely potential yields. The deep planting depth especially negatively affected the forage sorghum varieties due to the combination of poor germination and low seeding rate resulting in very poor establishment and some plots being removed from the study. It is recommended to plant sorghum at 0.5 to 1 inch in poorly drained soils like those at Marshfield. The deep planting depth had less of an impact at Hancock but emergence was still poor for some of the sorghum plots. Growing conditions were in general normal temperatures during the summer with a stretch of dry, warm weather in mid-August which helped to accelerate sorghum growth.
Forage yields were greater at Hancock compared to Marshfield for all forages and
management factors. The soil conditions likely allowed for quicker emergence and growth at the Hancock site while the forages had slow emergence and growth due to wet soils at the Marshfield site. The non-BMR varieties had comparable or better forage yield than corn at the Hancock site with the BMR varieties having lower yields. The non-BMR sorghum-sudangrass had the highest yields at Hancock for both planting dates while the PS sorghum-sudangrass was highest for both dates at Marshfield.
Proc. of the 2016 Wisconsin Crop Management Conference, Vol. 55 64

Single harvest yields were two to three times the combined multiple harvest yields at both sites. Forage quality will be assessed later on the forages, but it is expected that the multiple harvest forages will have improved forage quality than single harvest strategies. The first harvest was delayed to early August which may have limited later forage growth during the ideal growing period in late August. As expected, sorghum-sudangrass varieties had the highest yield when using the multiple harvest strategy.
In conclusion, some sorghum varieties are able to produce similar forage yields to corn in
Central Wisconsin. These high yielding varieties may be useful to provide significant quantity of moderate quality forage for heifer feeding or other livestock with low nutritive needs such as pregnant beef cows. For high tonnage, it is recommended to use a single cut system. Moisture level at harvest can be challenging as sorghums often are frost-killed before drying down to an adequate moisture. Harvest should be delayed 1 to 2 weeks after a killing frost to dissipate prussic acid levels and allow for drying. Photoperiod sensitive varieties did not lodge in this study after a killing frost which may allow for additional drying time.
Table 1. Forage dry matter yields (tons DM/acre) for various sorghums and corn silage at Hancock and Marshfield Agricultural Research Stations. Hancock Marshfield Planting: Early June Mid-June Early June Mid-June
Forage Harvest: Single Multi Single Multi Single Multi Single Multi
Corn silage 8.48 3.87 6.17 2.17 5.21 2.72 5.87 2.16
PS forage sorghum1 9.40 3.42 8.19 1.65 4.23 1.25 4.89 1.19
PS sorghum-sudan 9.58 5.47 9.43 3.71 8.48 3.21 7.93 3.13
Forage sorghum 8.32 4.31 7.05 2.13 4.07 1.52 4.38 1.98
Sorghum-sudan 12.33 4.68 10.22 4.26 6.32 3.76 6.08 3.32
BMR forage sorghum2 6.39 3.56 4.25 1.94 3.85 1.54 3.93 1.80
BMR sorghum-sudan 6.69 4.00 6.73 2.68 4.17 1.78 4.32 2.52
BMR sudangrass 6.08 3.45 5.70 2.59 5.29 2.69 5.16 1.36 1 PS = Photoperiod sensitive variety 2 BMR = Brown mid-rib variety
Proc. of the 2016 Wisconsin Crop Management Conference, Vol. 55 65

Figure 1. Forage yields at Hancock of corn and sorghum varieties planted at two dates and harvested using a single or multiple cut system
Figure 2. Forage yields at Marshfield of corn and sorghum varieties planted at two dates and harvested using a single or multiple cut system
0
2
4
6
8
10
12
14
Early June Single Mid-June Single Early June Multi Mid-June Multi
0123456789
Early June Single Mid-June Single Early June Multi Mid-June Multi
Proc. of the 2016 Wisconsin Crop Management Conference, Vol. 55 66

FORAGE HARVEST PROCESS TIME MOTION ANALYSIS AND OPTIMIZATION
Brian D. Luck and Joshua Harmon1
Introduction
Silage is a popular feedstock for dairy cattle. Corn production for silage has grown steadily in the past years, with more than 128 million tons produced in the United States in 2014, up from 116 million tons in 2012. Growers in the state of Wisconsin produced nearly 16 million tons of corn silage and over 9 million tons of haylage during 2014. However, making it requires a large input of time and energy. Commercial dairies often employ multiple self-propelled forage harvesters (SPFH) and many transport vehicles to harvest their crops. Managing this fleet of vehicles is often a logistical challenge, leaving significant opportunities for improvements in efficiency.
A study was conducted on a commercial dairy in Wisconsin which used two self-propelled forage harvesters, 10 straight trucks and 2 tractor-trailers. Machine movement was tracked during harvest with Global Positioning System (GPS) receivers and Controller Area Network (CAN) data loggers placed in each vehicle. GPS loggers for non-CAN equipped vehicles were developed with Arduino Uno microcontrollers utilizing EM-506 GPS receivers. The Arduino loggers were installed in the cab of each truck and powered by the vehicle battery, and GPS data were collected at a frequency of 1 Hz via storage on a micro-SD card. Vector CANcaseXL two-channel data loggers collected CAN and GPS signals on SPFH’s. The Vector data loggers stored CAN signals, such as vehicle speed and cutterhead speed while simultaneously collecting GPS data at 1 Hz. These datasets were stored together as binary log files on the CANcaseXL SD card. Data from the Arduino and Vector data loggers were downloaded and copied once a week during harvest times. Hand-written notes were collected that recorded the time and order of trucks filled for verification of work status during data analysis. During the 2015 growing season, data were collected on these machines for 450 acres of rye (Secale cereale), 1600 acres of alfalfa (Medicago sativa), and over 2000 acres of corn (Zea mays).
GPS tracking allowed for vehicles paths to be recorded (Fig.1). CAN signals from the harvesters were used to define work status for each vehicle. Using these data, linear models were developed and fit to each harvest, and used to identify practices that reduced harvest efficiency. A top priority in this study was to identify the appropriate number of trucks to keep the harvester working, as it is the most expensive machine in the field to operate. More commonly, however, too many transport vehicles were used during harvest, and trucks often sat in the field waiting to be filled. It was important to determine the number of transport vehicles that did not reduce SPFH efficiency. By manipulating the models, the harvest process could be optimized to reduce machine down time, such as idle forage harvesters or trucks, and improve the efficiency of harvest.
________________________ 1 Assistant Professor and Research Assistant, Biological Systems Engineering, 460
Henry Mall, Univ. of Wisconsin-Madison, Madison, WI, 53706.
Proc. of the 2016 Wisconsin Crop Management Conference, Vol. 55 67

Figure 1. Global Positioning System (GPS) receiver locations of all vehicles
involved in rye haylage harvest in May 2015 for one 60-acre field.
Proc. of the 2016 Wisconsin Crop Management Conference, Vol. 55 68

REDUCED LIGNIN ALFALFA
Yoana C. Newman and Veronica Justen 1/
Introduction
Alfalfa is the most extensively grown perennial legume in Wisconsin. In 2015, 1.3 million acres were harvested, producing 4.55 million tons of pure and mixed dry hay, an average yield of 3.5 tons per acre (USDA National Agricultural Statistics Service, 2015). Worldwide, alfalfa has been known among forage plants as the ‘Queen’ of forages because of its productivity, and superior forage nutritive value. Alfalfa breeders and molecular biologists have been working for over a decade on improving the quality of alfalfa by targeting the reduction of lignin in leaf and stems. Sets of reduced-‐lignin varieties are scheduled to be on the market in limited supplies in 2016. The information presented is an update on the advances and management considerations for these new alfalfa varieties.
What is Lignin, and why should we care about it?
Lignin is a complex organic compound that binds fiber in plants, and is deposited in the cell walls of stems and leaves as part of the process of plant maturation (Jung and Allen, 1995). Alfalfa plants have 6 to 9% of lignin, which provides structural, and protective functions. The structural function is provided by the strength and rigidity that lignin adds to the cell wall and therefore to the plant. The added strength to the cell wall of leaves and stem tissues protects against disease-‐causing organisms, and also shields against water loss by reducing permeability of the cell wall (Den and Eriksson, 1992). While these characteristics associated with high lignin accumulation are desirable for plant persistence, lignin deposition in plants interferes with digestion of plant fiber by acting as a physical barrier to microbial degradation. A reduction of lignin concentration is necessary for improvement of the nutritive value and quality of forages for livestock feeding (Jung and Allen, 1995).
Approaches to Reduced Lignin Alfalfa Over the last few years the reduction of lignin to improve alfalfa quality has
been achieved through two different approaches: a) Conventional breeding (or non-‐transgenic), and b) Transgenic molecular manipulation.
Conventional breeding efforts have been based on the use of parent plants with reduced lignin content1, and strong agronomic traits such as high yield, and disease resistance against Anthracnose, Aphanomyces, bacterial wilt, Fusarium wilt, verticillium wilt, and phytophtora root rot. Alforex seeds (DowAgroSciences, Woodland, CA) has led this line of work and after eight years of testing and selection, the alfalfa products in the market include the varieties Hi-‐Gest 360 1 Assistant Professor of Forage Crops, and Assistant Professor of Crop Science. Dept. of Plant and Earth Science, Ag Science 410 S. 3rd Street, Univ. of Wisconsin-‐River Falls, River Falls, WI, 54022.
Proc. of the 2016 Wisconsin Crop Management Conference, Vol. 55 69

(dormancy 3) and Hi-‐Gest 660 (dormancy 6). These are medium-‐tall plants with a dense canopy of stems and leaves and a 7 to 10% reduction in lignin. The lodging tolerance is similar to conventional varieties. One important fact is that these conventional varieties do not contain the transgenic glyphosate tolerance trait (Roundup Ready®), allowing the mixture with grass species and use for organic production. These varieties are marketed as alfalfa with high digestibility, intake, and milk yield per ton of alfalfa fed, high yields, and harvest flexibility of up to seven days.
Transgenic technology is another approach used to reduced lignin that includes targeted manipulation of the plant’s DNA. Since 2007, the consortium for advancement of Alfalfa, which includes the Noble Foundation, Forage Genetic International, U.S. Dairy Forage Research Center, Monsanto and Pioneer, have cooperated on the development of the reduced lignin trait. The product of these efforts was the ‘reduced lignin’ trait, known with the trade name of HarvXtra™. The focus of the molecular manipulation was the down regulation of two steps in the lignin biosynthesis pathway. As a result, alfalfa plants produce lignin levels necessary for structural function but low enough to maintain high forage quality.
Prior to 2014 transgenic reduced-‐lignin alfalfa was subject to regulation requirements of the plant pest provisions of USDA-‐APHIS (Animal-Plant Health Inspection Service) that determines the likelihood of an organism to be a plant pest risk. In August 2013, USDA-‐APHIS lifted the regulations indicating that the transgenic reduced lignin alfalfa did not pose a threat, and in November 2014, transgenic reduced lignin alfalfa was allowed to be grown commercially and sold to farmers. This is the second transgenic trait to be deregulated by USDA-‐APHIS. The first being the glyphosate tolerance trait (Roundup Ready®) which was first deregulated in 2005. The HarvXtra™ trait will be sold as a trait stack with Genuity® Roundup Ready® technology (ForageGenetics International, Nampa, ID) with limited release anticipated for 2016.
What are the benefits and management of these new varieties? Whether through conventional breeding or transgenic approaches, the
reduced lignin trait allows a flexibility in harvest when conditions may not be conducive to harvest. Reduced lignin alfalfa harvest can be 7 to 10 days later than conventional alfalfa without a reduction in forage digestibility. If both were harvested at 28 days the reduced lignin alfalfa exhibits at least a 10% increase in quality (Figure 1). A first round of multi-‐location trials in Wisconsin and Minnesota (Undersander et al., 2009) shows that taking the second and third harvest at a later stage of maturity (three instead of four cutting by September 1), does not affect quality, and provides additional forage yield of 17% the second year and 25% the third year for the reduced lignin compared to the conventional alfalfa. Additional benefits for these harvest systems with one less cutting include lower fuel and labor costs due to fewer trips to the field. A three-‐cut management system also has the potential to increase stand life resulting from decreased wheel traffic and an
Proc. of the 2016 Wisconsin Crop Management Conference, Vol. 55 70
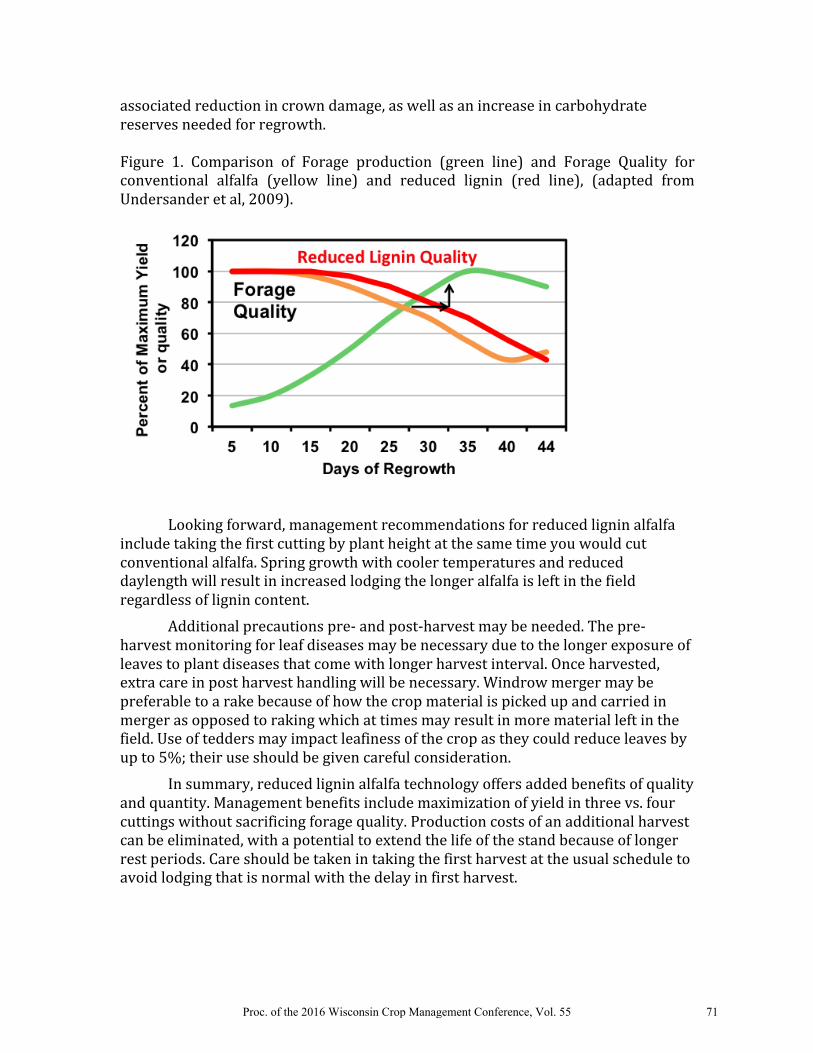
associated reduction in crown damage, as well as an increase in carbohydrate reserves needed for regrowth.
Figure 1. Comparison of Forage production (green line) and Forage Quality for conventional alfalfa (yellow line) and reduced lignin (red line), (adapted from Undersander et al, 2009).
Looking forward, management recommendations for reduced lignin alfalfa include taking the first cutting by plant height at the same time you would cut conventional alfalfa. Spring growth with cooler temperatures and reduced daylength will result in increased lodging the longer alfalfa is left in the field regardless of lignin content.
Additional precautions pre-‐ and post-‐harvest may be needed. The pre-‐harvest monitoring for leaf diseases may be necessary due to the longer exposure of leaves to plant diseases that come with longer harvest interval. Once harvested, extra care in post harvest handling will be necessary. Windrow merger may be preferable to a rake because of how the crop material is picked up and carried in merger as opposed to raking which at times may result in more material left in the field. Use of tedders may impact leafiness of the crop as they could reduce leaves by up to 5%; their use should be given careful consideration.
In summary, reduced lignin alfalfa technology offers added benefits of quality and quantity. Management benefits include maximization of yield in three vs. four cuttings without sacrificing forage quality. Production costs of an additional harvest can be eliminated, with a potential to extend the life of the stand because of longer rest periods. Care should be taken in taking the first harvest at the usual schedule to avoid lodging that is normal with the delay in first harvest.
Proc. of the 2016 Wisconsin Crop Management Conference, Vol. 55 71

References
Dean, J., and K. Eriksson. 1991. Biotechnological modification of lignin structure and composition in forest trees. Holzforschung 46(2):135-‐147.
Jung, H. G. and M. S. Allen. 1995. Characteristics of plant cell walls affecting intake
and digestibility of forages by ruminants. J. Anim. Sci. 73(9):2774-‐90. Moore, K. J. and H. G. Jung. 2001. Lignin and fiber digestion. J. Range Manage. 54:
420–430. Undersander, D. M. McCaslin, C. Sheaffer, D. Whalen, D. Miller, D. Putman, and S
Orloff. 2009. Low lignin alfalfa: redefining the yield/quality tradeoff. In Proc. 2009 Western Alfalfa and Forage Conf. Dec. 2-‐4. Reno, Nevada.
USDA NASS, 2015. United States Department of Agriculture, National Agricultural
Statistic Service. Wisconsin Field Office. http://www.nass.usda.gov/Statistics_by_State/Wisconsin/ (accessed online 12-‐21-‐15)
Proc. of the 2016 Wisconsin Crop Management Conference, Vol. 55 72

CONNECTING THE AGRONOMIST AND THE NUTRITIONIST TO MAKE MANAGEMENT DECISIONS
Randy Shaver1
Abstract
As the number of cows per farm, and thus the acres needed to provide feed, have increased for Wisconsin’s dairy farms, the reliance of farm operators on agronomists and nutritionists for advice when making management decisions has also increased. An adequate supply of high quality forage is crucial to reduce purchased feed costs and increase milk production per ton of forage. The agronomist – dairy nutritionist interface includes the following areas: feed inventory and crop rotations, manure storage and application, nutrient management plans, expansion planning, yield versus quality considerations, feed testing, harvest and storage considerations, feed valuing, team meetings, and staff training. Sub-categories within those various areas will be discussed with regard to potential for interaction between agronomists, dairy nutritionists, and farm managers on management decisions.
1 Professor and Extension Dairy Nutritionist, Dept. of Dairy Science, Room 280 Animal Science Building, 1675 Observatory Dr., Univ. of Wisconsin-Madison, Madison, WI 53706.
Proc. of the 2016 Wisconsin Crop Management Conference, Vol. 55 73

DO COVER CROPS INCREASE OR DECREASE CROP YIELDS?
Matt Ruark 1/ Cover crops are a conservation management practice that can reduce soil erosion, reduce nitrate leaching to groundwater, and increase soil organic matter. However, use management of cover crops can be challenging, especially in the upper Midwest, where little growing season is left following harvest of corn or soybean. Additionally, termination of cover crops in the spring can be a challenge depending on spring growing conditions. Different organizations and researchers have conducted studies to assess if cover crops "work" in the Midwest, and results have ranged from clear decreases in corn yield to clear increases in corn yield. This presentation will be a thorough review of recent studies across the Midwest that assess the impact of cover crops on the subsequent crops yield. The presentation will also seek to address what cover crop management strategies should be implemented to reduce any short-term risk in order to achieve the long-term benefits of cover crops on soil health. _______________________________ 1/ Associate Professor, Dept. of Soil Science, Univ. of Wisconsin-Madison, 1525 Observatory Drive, Madison, WI 53706.
Proc. of the 2016 Wisconsin Crop Management Conference, Vol. 55 74

INTERSEEDING COVER CROPS INTO CORN IN WISCONSIN
Daniel H. Smith, Matt Ruark, Francisco Arriaga, and Mark Renz1/
Introduction Wisconsin growers are increasingly interested in utilizing cover crops. While cover crop establishment is relatively easy following corn silage, small grains, and processing vegetables, establishing cover crops successfully following corn or soybean has been more difficult. Aerial seeding or over-the canopy seeding late in the growing season can be done with moderate success. An alternative approach is to interseed cover crops into a standing corn crop early in the growing season. This management practice requires special or at least modified equipment, but can improve cover crop establishment by drilling seed rather than broadcasting. Ideally, the cover crop will establish prior to canopy closure, but then survive to the end of the growing season without creating too much competition for resources (nutrients and water) for the corn crop. Little experimentation has occurred in Wisconsin to evaluate cover crop growth when interseeded into standing corn and the impact of interseeding cover crops on corn grain yield. Approach Field experiments were conducted at the Arlington Agricultural Research Station. The field was fall chisel plowed and then field cultivated in the spring prior to corn establishment. Corn was planted in early June in 2014 and in mid-May 2015. Five cover crops treatments were planted into corn: (1) radish, (2) red clover, (3) winter rye, (4) oat/pea mixture (70% oats, 30% pea), and (5) no cover crop. Table 1 shows seeding depth and rates. Cover crops were drill seeded when corn was at the V5 growth stage (14 July, 2014 and 6 June, 2015) using a modified no-till grain drill. The drill had four row units removed, leaving 6 row units to allow the drill to go through the crop rows and plant three rows of cover crops between each corn row. The no-till disks and supporting hardware were also removed to prevent damage to the corn. Corn was harvested for grain, and following harvest cover crops were evaluated by weighing the total dried biomass collected from a 0.25 by 0.25 m quadrat in each plot. Table 1. Cover crop seeding rate and seed depth placement. Cover Crop Seeding Rate (lb/acre) Depth (in) Winter rye 120 1 Red clover 12 0.25 Radish 12 0.25 Oat/Pea Mix 90 / 10 1
Results and Discussion
All cover crops were successfully established in 2014 and 2015. Within four weeks of seeding radish, red clover, and winter rye had germinated, had consistent growth during the growing season, and had good vigor up until two weeks of grain harvest. In 2015 the oat/pea did not have good vigor and had very poor biomass accumulation. Table 2 shows cover crop biomass accumulation. The corn never showed any visible symptoms of stress and the cover crops did not significantly reduce corn yields (<0.0001). Corn yields are shown in Figure 1 and 2. In 2014,
1/ Outreach Specialist, Dept. of Horticulture; Associate Professor and Assistant Professor, Dept. of Soil Science; Associate Professor, Dept. of Agronomy, respectively, Univ. of Wisconsin-Madison, Madison, WI 53706.
Proc. of the 2016 Wisconsin Crop Management Conference, Vol. 55 75

radish and oat/pea winterkilled and rye was the only cover crop that needed terminated in spring. In 2014, the red clover looked very poor at the time of corn harvest; the late corn harvest stressed the red clover too much for it to survive the winter. Both years all cover crops were completely buried by the corn residue after harvest and resulted in variable biomass data. Future research will focus on evaluating the soil conservation, soil carbon building, and potential N credits obtained with interseeding these cover crops.
Table 2. 2014 and 2015 Interseeded cover crop biomass following grain harvest at Arlington Agriculture Research Station.
Cover Crop 2014 Biomass (lb/acre)1 2015 Biomass (lb/acre) Red clover 229(72) 511(317) Winter rye 209(117) 485(421) Radish 900(779) 635(410) Oat/Pea 201(204) 21(10)
1Biomass weight (standard deviation in lb/acre).
Figure 1. 2014 Cover crop interseeding corn grain yield at Arlington Agriculture Research Station.
0
50
100
150
200
250
Check Red Clover Winter Rye Radish Oats/Peas
Grai
n Yi
eld
(bu/
ac)
Proc. of the 2016 Wisconsin Crop Management Conference, Vol. 55 76

Figure 2. 2015 Cover crop interseeding corn grain yield at Arlington Agriculture Research Station.
0
50
100
150
200
250
Check Red Clover Winter Rye Radish Oats/Peas
Grai
n Yi
eld
(bu/
ac)
Proc. of the 2016 Wisconsin Crop Management Conference, Vol. 55 77

INTEGRATED MANAGEMENT OF SOYBEAN SUDDEN DEATH SYNDROME
Daren Mueller1/
Sudden death syndrome (SDS) was severe in many fields across the Midwest the past few years, resulting in yield loss and frustration for farmers. There are a few positive things that we can learn in a years like this, though. For one, many soybean varieties were pushed to their limits, allowing farmers to get a really good evaluation of the genetic resistance for SDS in a variety. Additionally, other beneficial management strategies can be identified that complement variety resistance. This talk will highlight some of the SDS management research completed over the past several years by plant pathologists at Iowa State University and in neighboring states. Much of this research is funded through the soybean check off from Iowa Soybean Association, the North Central Soybean Research Program, and the United Soybean Board. We thank all of our sponsors for this research. One research focus has been the evaluation of seed treatments that include SDS on their label. While the foundational management strategy for SDS is using resistant varieties, in years when environmental conditions are favorable for disease development, it is evident that resistance alone does not provide adequate control or reduce farmer risk sufficiently. An effort to combat SDS in fields is ILeVO®, a new seed treatment by Bayer CropScience. We evaluated ILeVO® in many environments including fields with different disease levels and planting dates. The main conclusion was that ILeVO® seed treatment was effective at reducing SDS severity levels in many different environments compared to control plots. ___________________________ 1/Extension Soybean Plant Pathologist, Iowa State University, Ames, IA 50011.
Proc. of the 2016 Wisconsin Crop Management Conference, Vol. 55 78

INTEGRATED MANAGEMENT OF WHITE MOLD IN SOYBEAN
Jaime Willbur1/, Chris Bloomingdale2/, Scott Chapman3/, Medhi Kabbage4/, Damon L. Smith5/
Introduction
Sclerotinia sclerotiorum, the causal agent for white mold (Sclerotinia stem rot), is a devastating soybean fungal pathogen. In 2006, white mold ranked in the top 10 yield-reducing diseases of soybean and was estimated to account for over 2 million metric tonnes of yield loss world-wide (Wrather et al. 2010). In the United States, soybean losses in 2009 reached an estimated 1.6 million metric tonnes due to white mold, which cost producers ~$560 million (Koenning and Wrather 2010; Peltier et al. 2012). Disease control is limited due to the lack of complete resistance in commercial cultivars and an incomplete understanding of resistance mechanisms (Peltier et al. 2012). Further investigation of white mold resistance mechanisms in soybean and subsequent resistance evaluations of soybean germplasm would improve commercially available resistance. Currently, chemical control is one method of controlling white mold. However, chemical efficacy can be limited and application may even be unnecessary in some cases, as white mold development requires a complex combination of conditions. In the field, S. sclerotiorum survives in the soil as a dormant structure until conditions permit sexual reproduction. Under conducive conditions, apothecia form to produce and release sexual ascospores, which must land on a nutrient source, i.e. soybean flowers, for infection to occur (Peltier et al. 2012). Risk assessment tools are often used to more accurately predict the timing of effective fungicide applications based on weather conditions, pathogen presence, and host architecture. White mold forecasting models such as those for carrot and lettuce, however, do not exist for soybean systems (Clarkson et al. 2014; Foster et al. 2011). An improved understanding of chemical control, development of resistant germplasm, and an optimized forecasting system would improve management strategies of white mold disease in soybean.
Research Objectives
1. Evaluate fungicide product efficacy and application timing for white mold control. 2. Evaluate physiological resistance to white mold in soybean germplasm and release the best
lines for breeding purposes. 3. Investigate the roles of weather variables in the formation of apothecia in soybean crops. Use
this information to develop an improved advisory system for white mold in soybean.
1/ Graduate Research Assistant, Department of Plant Pathology, 1630 Linden Drive, University of Wisconsin-Madison, Madison, WI, 53706. 2/ Graduate Research Assistant, Departments of Plant Pathology and Entomology, 1630 Linden Drive, University of Wisconsin-Madison, Madison, WI, 53706. 3/ Researcher, Departments of Plant Pathology and Entomology, 1630 Linden Drive, University of Wisconsin-Madison, Madison, WI, 53706. 4/ Assistant Professor, Department of Plant Pathology, 1630 Linden Drive, University of Wisconsin-Madison, Madison, WI, 53706. 5/ Assistant Professor and Extension Field Crops Pathologist, Department of Plant Pathology, 1630 Linden Drive, University of Wisconsin-Madison, Madison, WI, 53706.
Proc. of the 2016 Wisconsin Crop Management Conference, Vol. 55 79
Methods and Results
Fungicide efficacy and timing In 2013, 22 fungicide treatments (including a non-treated) were evaluated for control of white mold (Table 1). These products were evaluated on small plots in a field with a history of white mold. Applications took place at the R1 or R3 growth stages, or in some cases, both. DSI was determined at the R6 growth stage and yield data were collected. The best treatments tended to be Endura® at 8 oz applied at the R1 growth stage and Aproach® at 9 fl oz applied at both R1 and R3 (Table 1). An additional trial was conducted in 2014 to evaluate ‘curative’ applications using single applications of Endura® at 8 oz and Aproach® at 9 fl oz. Plots were established in a field with symptoms of white mold at the R5 growth stage. DSI was determined at the time of application and evaluated again two weeks later (R6 growth stage). Yield was also evaluated. Fungicide application did not result in a reduction in DSI units compared to the non-treated check. In addition, no differences in yield were identified among the three treatments (Table 2). These data support previous research, which suggests there are only a few products efficacious against white mold and the timing of application for maximum efficacy is critical. White mold-resistant germplasm Previously, resistant soybean germplasm was generated by crossing a highly resistant experimental line (W04-1002) with lines exhibiting good resistance to other diseases such as brown stem rot, soybean sudden death syndrome, and soybean cyst nematode. In addition, another set of crosses was performed using the experimental breeding line (AxN-1-55). This work was supported by the Wisconsin Soybean Marketing Board. After multiple screenings, 31 lines were selected for advanced white mold field screening in 2014. Lines were planted in a nursery with four check varieties. Disease ranged from almost 60 disease severity index (DSI) units in the susceptible breeding line 91-44 to zero DSI units for SSR81-23. All lines identified as physiologically resistant in greenhouse evaluations had less than 20 DSI units in the field trials. Yield loss is generally not expected until rating reaches 25 or more DSI units (Smith, personal communication). Yield ranged from 55.9 bu/a for AxN-1-55 to 26.6 bu/a for SSR81-123. Lodging was an important yield component in this trial. Lodging was significantly (α=0.05) correlated with yield. Breeding lines that lodged severely, yielded less than lines that had lower lodging scores (correlation coefficient = -0.47). Lines with the best physiological resistance to white mold (mostly the 9 x 1 population) tended to yield low-to-moderately in the 2014 trial due to lodging and perhaps yield drag due to the high level of physiological resistance present in many of these lines. Further evaluation and selection took place in 2015. Sixteen lines with four check varieties were planted in a nursery. DSI ranged from 51 to 2.5 units (Table 3). Yield was consistent with results from 2014. Highly resistant plants tended to yield less than some susceptible lines. However, plants heavily damaged by white mold (DSI units >25) had significant yield reduction compared to those that had a DSI score less than 25. Germplasm lines 91-38 and 91-224B tended to have a good balance of white mold resistance and yield with minimal lodging in 2015 (Table 3). 91-38 yielded 43 bu/a while 91-224B yielded 47 bu/a. Highest yield achieved was 62 bu/a for 52-82B. However, the 5 x 2 population tends to be less consistent in resistance response under controlled inoculations, and in field evaluations, compared to the 9 x 1 population.
Proc. of the 2016 Wisconsin Crop Management Conference, Vol. 55 80

Table 1. White mold ratings and yield of soybeans treated with various fungicides or an herbicide.
Treatment and Rate/Acre (Crop Growth Stage at Application) DSIz Yield (bu/a) Non-treated Check 77.5 acy 56.0 gy
Aproach Prima 2.34SC 6.8 fl.oz. + Induce 90SL 0.25% v/v (R3) 85.6 a 58.0 fg
Domark 40ME 5.0 fl.oz. + Induce 90SL 0.25% v/v (R1) 67.0 acf 58.0 fg
Proline 480SC 5.0 fl.oz. (R1) 74.5 acd 58.7 eg
Incognito 4.5FL 20.0 fl.oz. + Induce 90SL 0.25% v/v (R1) 81.4 ab 62.3 dg
Priaxor 4.17SC 4.0 fl.oz. + Induce 90SL 0.25% v/v (R3) 74.2 acd 63.7 bg
Domark 40ME 5.0 fl.oz. + Induce 90SL 0.25% v/v (R3) 43.1 cgh 63.9 bg
Priaxor 4.17SC 4.0 fl.oz. + Induce 90SL 0.25% v/v (R1) 38.1 dfgh 66.1 bcg
Endura 70WG 6.0 oz. + Induce 90SL 0.25% v/v (R1) 29.7 fgh 66.6 bcg
Cobra 2EC 6.0 fl.oz. + Induce 90SL 0.25% v/v (R1) 6.4 h 67.4 bcdef
Aproach 2.08SC 9.0 fl.oz. + Induce 90SL 0.25% v/v (R1) 37.0 dfgh 67.6 abdef
Aproach 2.08SC 9.0 fl.oz. + Induce 90SL 0.25% v/v (R1) Aproach Prima 2.34SC 6.8 fl.oz. + Induce 90SL 0.25% v/v (R3) 65.8 acef 68.1 abdef
Proline 480SC 3.0 fl.oz. + Induce 90SL 0.25% v/v (R1) 33.2 fgh 69.0 abde
Aproach 2.08SC 9.0 fl.oz. + Induce 90SL 0.25% v/v (R3) 42.0 cgh 70.1 abd
Aproach 2.08SC 6.0 fl.oz. +Induce 90SL 0.25% v/v (R1, R3) 45.0 bcg 71.4 abd
Proline 480SC 3.0 fl.oz. (R1) Stratego YLD 500SC 4.65 fl.oz. (R3) 40.3 cgh 72.4 abd
Aproach Prima 2.34SC 6.8 fl.oz. + Induce 90SL 0.25% v/v (R1, R3) 42.5 cgh 73.1 abd
Aproach 2.08SC 9.0 fl.oz. +Induce 90SL 0.25% v/v (R1, R3) 28.1 egh 73.9 ab
Proline 480SC 3.0 fl.oz. (R1) Stratego YLD 500SC 4.0 fl.oz. + Induce 90SL 0.25% v/v (R3) ............................................................................................... 25.3 gh 74.0 ab
Proline 480SC 5.0 fl.oz. (R1) Stratego YLD 500SC 4.65 fl.oz. + Induce 90SL 0.25% v/v (R3) 47.2 bcg 74.3 ab
Endura 70WG 6.0 oz. + Induce 90SL 0.25% v/v (R1) Priaxor 4.17SC 4.0 fl.oz. + Induce 90SL 0.25% v/v (R3) 48.7 ag 76.2 ac
Endura 70WG 8.0 oz. + Induce 90SL 0.25% v/v (R1) 38.6 dfgh 78.3 a
LSD (α=0.05) 37.9 10.8 zSclerotinia stem rot DSI was generated by rating 30 arbitrarily selected plants in each plot and scoring plants with on a 0-3 scale: 0 = no infection; 1 = infection on branches; 2 = infection on mainstem with little effect on pod fill; 3 = infection on mainstem resulting in death or poor pod fill. The scores of the 30 plants were totaled and divided by 0.9. yMeans followed by the same letter are not significantly different based on Fisher’s Least Significant Difference (LSD; α=0.05)
Proc. of the 2016 Wisconsin Crop Management Conference, Vol. 55 81
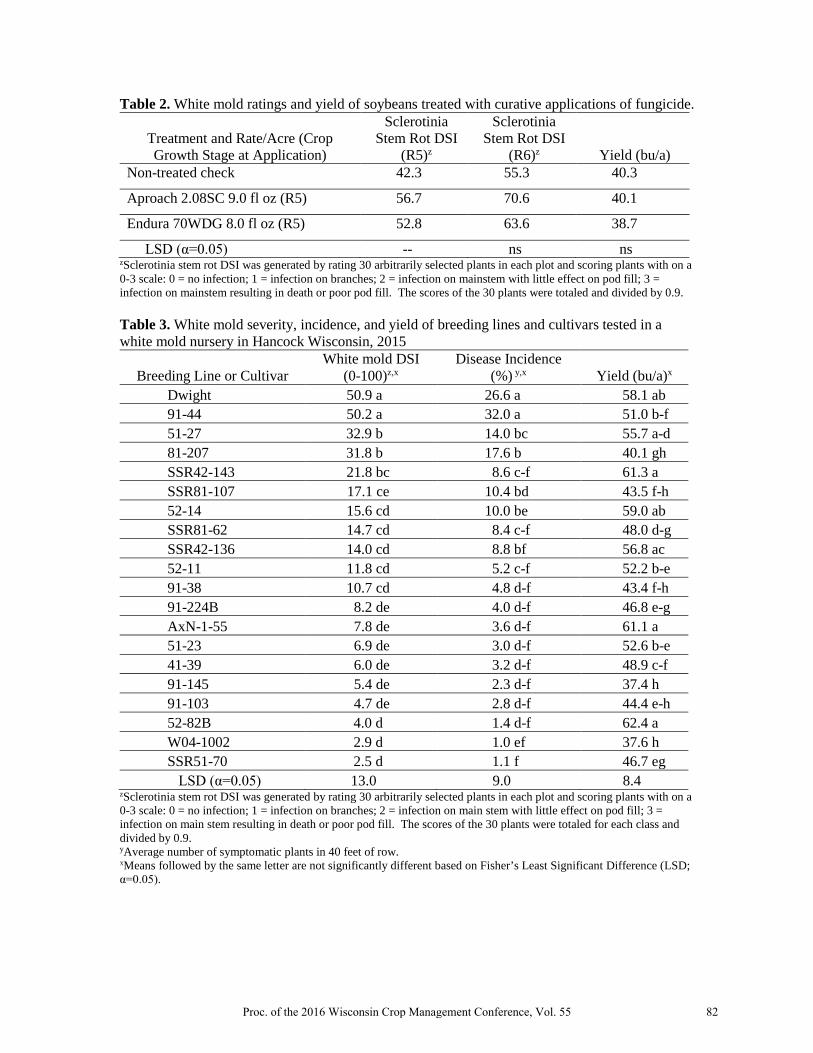
Table 2. White mold ratings and yield of soybeans treated with curative applications of fungicide.
Treatment and Rate/Acre (Crop Growth Stage at Application)
Sclerotinia Stem Rot DSI
(R5)z
Sclerotinia Stem Rot DSI
(R6)z Yield (bu/a) Non-treated check 42.3 55.3 40.3
Aproach 2.08SC 9.0 fl oz (R5) 56.7 70.6 40.1
Endura 70WDG 8.0 fl oz (R5) 52.8 63.6 38.7
LSD (α=0.05) -- ns ns zSclerotinia stem rot DSI was generated by rating 30 arbitrarily selected plants in each plot and scoring plants with on a 0-3 scale: 0 = no infection; 1 = infection on branches; 2 = infection on mainstem with little effect on pod fill; 3 = infection on mainstem resulting in death or poor pod fill. The scores of the 30 plants were totaled and divided by 0.9. Table 3. White mold severity, incidence, and yield of breeding lines and cultivars tested in a white mold nursery in Hancock Wisconsin, 2015
Breeding Line or Cultivar White mold DSI
(0-100)z,x Disease Incidence
(%) y,x Yield (bu/a)x
Dwight 50.9 a 26.6 a 58.1 ab 91-44 50.2 a 32.0 a 51.0 b-f 51-27 32.9 b 14.0 bc 55.7 a-d 81-207 31.8 b 17.6 b 40.1 gh SSR42-143 21.8 bc 8.6 c-f 61.3 a SSR81-107 17.1 ce 10.4 bd 43.5 f-h 52-14 15.6 cd 10.0 be 59.0 ab SSR81-62 14.7 cd 8.4 c-f 48.0 d-g SSR42-136 14.0 cd 8.8 bf 56.8 ac 52-11 11.8 cd 5.2 c-f 52.2 b-e 91-38 10.7 cd 4.8 d-f 43.4 f-h 91-224B 8.2 de 4.0 d-f 46.8 e-g AxN-1-55 7.8 de 3.6 d-f 61.1 a 51-23 6.9 de 3.0 d-f 52.6 b-e 41-39 6.0 de 3.2 d-f 48.9 c-f 91-145 5.4 de 2.3 d-f 37.4 h 91-103 4.7 de 2.8 d-f 44.4 e-h 52-82B 4.0 d 1.4 d-f 62.4 a W04-1002 2.9 d 1.0 ef 37.6 h SSR51-70 2.5 d 1.1 f 46.7 eg LSD (α=0.05) 13.0 9.0 8.4
zSclerotinia stem rot DSI was generated by rating 30 arbitrarily selected plants in each plot and scoring plants with on a 0-3 scale: 0 = no infection; 1 = infection on branches; 2 = infection on main stem with little effect on pod fill; 3 = infection on main stem resulting in death or poor pod fill. The scores of the 30 plants were totaled for each class and divided by 0.9. yAverage number of symptomatic plants in 40 feet of row. xMeans followed by the same letter are not significantly different based on Fisher’s Least Significant Difference (LSD; α=0.05).
Proc. of the 2016 Wisconsin Crop Management Conference, Vol. 55 82

White mold advisory development In 2014, we monitored the growth and development of S. sclerotiorum and collected detailed data of the progression and severity of white mold disease in Wisconsin soybean fields. Publically available weather data were used in a series of statistical models to predict disease development to generate a single model for spray advisory purposes. The experimental model uses air temperature and leaf wetness to predict the risk of infection by the white mold fungus. In 2015, the first iteration of the model was validated in the field for testing compared to a two-spray, calendar program (Endura® at 8 oz was applied). These treatments were compared to non-treated checks. Due to the extremely favorable weather for disease in 2015, the advisory called for two applications of fungicide. Therefore, no savings of fungicide was achieved over the calendar program. However, yields were significantly higher in plots that received fungicide vs. plots that were not treated. In addition to the development of a potential advisory, this modeling exercise is helping to improve our understanding of the complex interaction of temperature and moisture required to make accurate white mold predictions. This understanding may also help us look at long-term forecasting in order to make disease predictions well in advance of an epidemic. Continued development and testing will occur in the 2016 field season.
Conclusions
Successful chemical control of white mold can be difficult to achieve. There are very few products with good efficacy toward the disease and timing of application is critical. In studies in Wisconsin, Endura® at 8 oz applied at R1 and Aproach® at 9 fl oz applied at R1 and R3 tend to be the best programs for control. Application of either of these products later than the R4 growth stage typically results in poor control. Considering the issue of fungicide application timing, our findings pertaining to Sclerotinia sclerotiorum epidemiology will help generate a web-based system to conduct site-specific disease forecasting for fungicide application. Because chemical control of white mold can be incomplete, white mold-resistant soybean varieties will be a key component of an integrated white mold management program. White mold-resistant soybean germplasm has been registered with the Wisconsin Alumni Research Foundation (WARF). WARF promotes innovative research by facilitating the commercialization of scientific technologies; therefore, soybean germplasm can be accessed by public and private breeders to develop locally and globally available commercial varieties. This will help further increase the sustainability of soybean systems worldwide by reducing pesticide input.
References
Clarkson, J. P., et al. (2014). A Model for Sclerotinia sclerotiorum Infection and Disease Development in Lettuce, Based on the Effects of Temperature, Relative Humidity and Ascospore Density. PloS One, 9(4), e94049. Foster, A. J., et al. (2011). Development and validation of a disease forecast model for Sclerotinia rot of carrot. Canadian Journal of Plant Pathology, 33(2), 187–201. Koenning, S. R. & J. A Wrather. (2010). Suppression of Soybean Yield Potential in the Continental United States by Plant Diseases from 2006 to 2009. Online. Plant Health Progress. Peltier, A. J., et al. 2012. Biology, Yield loss and Control of Sclerotinia Stem Rot of Soybean. Journal of Integrated Pest Management, 3(2), 1–7. Wrather, A., et al. (2010). Effect of diseases on soybean yield in the top eight producing countries in 2006. Online. Plant Health Progress.
Proc. of the 2016 Wisconsin Crop Management Conference, Vol. 55 83

2015 WISCONSIN CROP DISEASE SURVEY Anette Phibbs1, Susan Lueloff1 and Adrian Barta2
http://pestsurvey.wi.gov/
The 2015 survey of early-vegetative soybeans found 38% (19 of 50) surveyed fields tested positive for Phytophthora root rot disease caused by Phytophthora sojae. That is a lower infection level than last year’s 49%, but still very high. The state-wide survey took place from June 2 to 30. The fungus-like pathogen was detected in 16 counties: Buffalo, Calumet, Chippewa, Columbia, Dodge, Dunn, Iowa, Kenosha, Lafayette, Manitowoc, Outagamie, Polk, Rock, and Winnebago. Based on previous year’s survey results, all other counties should not expect to be free from the disease.
Besides the well-known cause of seedling root rot Phytophthora sojae, DNA based testing also determined Phytophthora species that are new to Wisconsin soybean productions areas.
P. sansomeana was identified in soybean roots in Jefferson and Dodge Cos. Since 2012 this survey has documented P. sansomeana in 10 Wisconsin counties (Calumet, Dane, Dodge, Dunn, Eau Claire, Green, Jefferson, Outagamie, Marathon and Sheboygan). This pathogen has been detected on other hosts in Wisconsin besides soybeans such as corn, balsam and Fraser fir.
Two additional species, P. inundata and P. iranica, were found in 2015. P. inundata was detected in Buffalo Co., in a field that was also infected with P. sojae. P. iranica was found in Lafayette Co. It is not known at this time if these new species can cause disease on soybeans.
P. inundata was first described in 2003 in wet or flooded soils in Europe and South America. It is associated with root and collar rots of hardwood trees and shrubs (horse chestnut, olive, willow and grape). The known hosts of P. iranica, first
found in Iran in 1971, include eggplant, potato, tomato and sugar beet.
1 Plant Industry Laboratory, DATCP, 2601 Agriculture Dr., Madison WI 53718, [email protected]. 2 Pest Survey Program, DATCP, 2811 Agriculture Dr., Madison WI 53718.
Proc. of the 2016 Wisconsin Crop Management Conference, Vol. 55 84

This brings the total number of new Phytophthora species detected during this annual survey of Wisconsin soybean fields up to five, including P. pini and P. sp. personii found in 2014.
Soybean Virus Survey - From Aug 6 to 31, 2015 the pest survey team sampled 50 fields for three viruses, frogeye leaf spot and Asian soybean rust. Soybeans were in the R4-R6 stages at the time of the survey. Soybean dwarf virus (SbDV) was detected in 6 of 50 fields (12%), half of last year’s 24% level. Alfalfa mosaic virus (AMV) increased from 3.2% in 2014 to 12% (6 of 50) in 2015. Soybean vein necrosis virus (SVNV) remained at similar levels with 3 of 50 (6%) fields testing positive compared to 4.5% in 2014. SVNV finds have leveled off since the initial detection in 2012 when 35% of fields tested positive. This virus is transmitted by thrips that were reported to be at low populations in 2015. Frogeye leaf spot and Asian soybean rust were not detected during the 2015 survey.
Goss’s wilt of corn was detected in four Wisconsin counties (Adams, Dane, Eau Claire and Rock) during seed corn field inspections in August. This bacterial disease caused by Clavibacter michiganensis nebraskensis was confirmed in 15 of 39 (38.5%) samples at Plant Industry Lab compared to (8.6%) in 2014. Stewart’s wilt (Pantoae stewartii) was not detected. Northern corn leaf blight (Exserohilum turcicum) and common rust (Puccinia sorghi) were the most commonly found diseases. Southern rust (P. polysora) was not observed.
Virus screening of corn showed three fields testing positive for sugarcane mosaic virus or maize dwarf virus (SCMV/MDMV) in Dane county. Maize chlorotic mottle virus (MCMV) and high plains virus (HPV) tests were all negative. MCMV, present in Kansas and Nebraska, is not known to occur in Wisconsin. This virus causes maize lethal necrosis disease when plants are co-infected with other potyviruses. This disease, present in Hawaii, parts of Africa, Mexico, South America and China, is of phytosanitary concern to some exporters.
Tar spot (Phyllachora maydis), a new disease reported on corn in Indiana and Iowa, in early September of 2015, was not observed in Wisconsin during seed inspections and pest survey.
Proc. of the 2016 Wisconsin Crop Management Conference, Vol. 55 85

WINTER WHEAT DISEASE MANAGEMENT: LESSONS FROM 2015
Brian Mueller1/, Scott Chapman2/, Chris Bloomingdale3/, and Damon Smith4/
Introduction
Wheat stripe rust, caused by the fungal plant pathogen Puccinia striiformis f. sp. tritici, has been an increasing problem in the central Great Plains and areas of the upper Midwest due to milder winters (Chen, 2005). In 2015, stripe rust was more prominent in central and northeast Wisconsin. Stripe rust can be observed on leaves and leaf sheaths and may also infect glumes or kernels if infection is severe. Fungicide application is based on risk of disease on the emerging flag leaf. Scouting early is an important factor when making decisions on fungicide application. However, more research in Wisconsin is needed to verify the correct fungicide application timing. In 2015, Fusarium head blight (FHB or scab), caused by Fusarium graminearum, was an issue for most of Wisconsin. Inoculum (spores) sources come from the soil and crop debris. Spores are disseminated by wind or rain and infection occurs when spores land on wheat heads during flowering. Disease is favored by prolonged periods of rain (or dew), high relative humidity, and temperatures ranging from 65 to 85 ºF. Major concerns from head scab are yield losses and the toxins deoxynivalenol (DON) and zearalenone, which are produced in seed. Management for head scab includes crop rotation, resistant varieties, and fungicides. The best method for crop rotation is wheat after soybean (Marburger et al., 2015). Avoid planting wheat after corn because this same disease causes Gibberella stalk rot and ear rot on corn. When choosing resistant varieties, refer to WI varietal trial results. Timing of fungicide application is critical for chemical control of FHB. Anthesis applications (Feekes 10.5.1) are often recommended for control of FHB. However, it might be possible to delay fungicide application a few days after the beginning of anthesis to let fields with uneven head emergence even out and still achieve adequate control (Smith, 2015). These delayed applications of fungicide should be investigated in Wisconsin. 1
Methods
A fungicide application timing trial was established at the Arlington Agricultural Research Station located in Arlington, WI. The soft red winter wheat cultivars ‘Kaskaskia’ ‘Sunburst’ ‘Pro200’ and ‘Hopewell’ were chosen for this study. Wheat was planted on 24 Sep 2014 in a field with a Plano silt loam soil (0 to 2% slopes). The experimental design was a randomized complete block with four replicates. Plots were 21 ft long and 7.5 ft wide with 4-ft alleys between plots. Standard wheat production practices as described by the University of Wisconsin Cooperative Extension Service were followed. Treatments consisted of four non-treated controls and eight fungicide treatments. Fungicides were applied using a CO2 pressurized backpack sprayer equipped with TTJ60-11002 Turbo TwinJet flat fan nozzles calibrated to deliver 20 GPA at 1/Graduate Research Assistant, Dept. of Plant Pathology, 1630 Linden Dr., Univ. of Wisconsin-Madison, Madison, WI, 53706. 2/ Researcher, Depts. of Plant Pathology and Entomology, 1630 Linden Dr., Univ. of Wisconsin-Madison, Madison, WI, 53706. 3/ Graduate Research Assistant, Depts. of Plant Pathology and Entomology, 1630 Linden Dr., Univ. of Wisconsin-Madison, Madison, WI, 53706. 4/ Assistant Professor, Dept. of Plant Pathology, 1630 Linden Dr., Univ. of Wisconsin-Madison, Madison, WI, 53706.
Proc. of the 2016 Wisconsin Crop Management Conference, Vol. 55 86

21psi. Fungicides were used to target Fusarium head blight in the area. Fungicides were applied at anthesis (Feekes 10.5.1) (6 Jun) or applied 5 days later (8 Jun). Plots were also inoculated at a 100 lb/acre rate of Fusarium graminearum-colonized corn grain on 18 May. Fusarium head blight was evaluated by visually estimating average incidence (% plants with symptoms) per plot. Level of deoxynivalenol (DON) was also evaluated in grain harvested from each treatment. Yield was determined by harvesting the center 5 feet of each plot using an Almaco SPC40 small-plot combine equipped with a HarvestMaster HM800 Classic Grain gauge. All disease and yield data were analyzed using a mixed model analysis of variance and means were separated using Fisher’s least significant difference (P=0.05) for disease incidence and yield and (P=0.10) for levels of DON. An additional fungicide efficacy trial was conducted to determine fungicide efficacies on the susceptible cultivar ‘Kaskaskia’. Wheat was planted on 24 Sep 2014 in a field with a Plano silt loam soil (0 to 2% slopes). The experimental design was a randomized complete block with four replicates. Plots were 21 ft long and 7.5 ft wide with 4-ft alleys between plots. Standard wheat production practices as described by the Univ. of Wisconsin Cooperative Extension Service were followed. Treatments consisted of a non-treated control and nine fungicide treatments. All fungicide treatments contained the non-ionic surfactant Induce 90SL at 11002 Turbo TwinJet flat fan nozzles calibrated to deliver 20 GPA at 21psi. Fungicides were used to target general wheat disease in the area. Fungicides were applied either just before jointing (Feekes 5), at emerging flag leaf (Feekes 8), at anthesis (Feekes 10.5.1), or using two sprays with the first occurring just prior to jointing (8 May) or at emerging flag leaf (21 May) and the second spray being applied at anthesis (3 Jun). Plots were inoculated at a 100 lb/acre rate of Fusarium graminearum-colonized corn grain on 18 May. Fusarium head blight was evaluated by visually estimating average incidence (% plants with symptoms) per plot. Level of deoxynivalenol (DON) was also evaluated in grain harvested from each treatment. Yield was determined by harvesting the center 5 feet of each plot using an Almaco SPC40 small-plot combine equipped with a HarvestMaster HM800 Classic Grain gauge. All disease and yield data were analyzed using a mixed model analysis of variance and means were separated using Fisher’s least significant difference (P=0.05).
Results and Discussion
Application of Prosaro 421SC at both anthesis (Feekes 10.5.1) and 5 days after anthesis resulted in significantly lower disease incidence for the susceptible cultivars ‘Hopewell’ and ‘Kaskaskia’ compared to plots not treated with fungicide (Table 1). Application of fungicide at either timing on the moderately-resistant cultivars ‘Pro200’ and ‘Sunburst’ had no significant effect on disease incidence compared to not treating. Prosaro 421SC applied at both anthesis and 5 days after anthesis resulted in significantly higher yields for ‘Hopewell’ compared to not treating (Table 2). Applying fungicide to all other cultivars resulted in no significant increase in yield compared to non-treated controls. Applying Prosaro 421SC at anthesis or 5 days after anthesis resulted in a significant decrease in levels of DON for all cultivars compared to not treating with fungicide (Table 3). For the cultivar ‘Hopewell’, applying Prosaro 421SC 5 days after anthesis resulted in significantly lower DON levels than applying fungicide at anthesis.
Proc. of the 2016 Wisconsin Crop Management Conference, Vol. 55 87
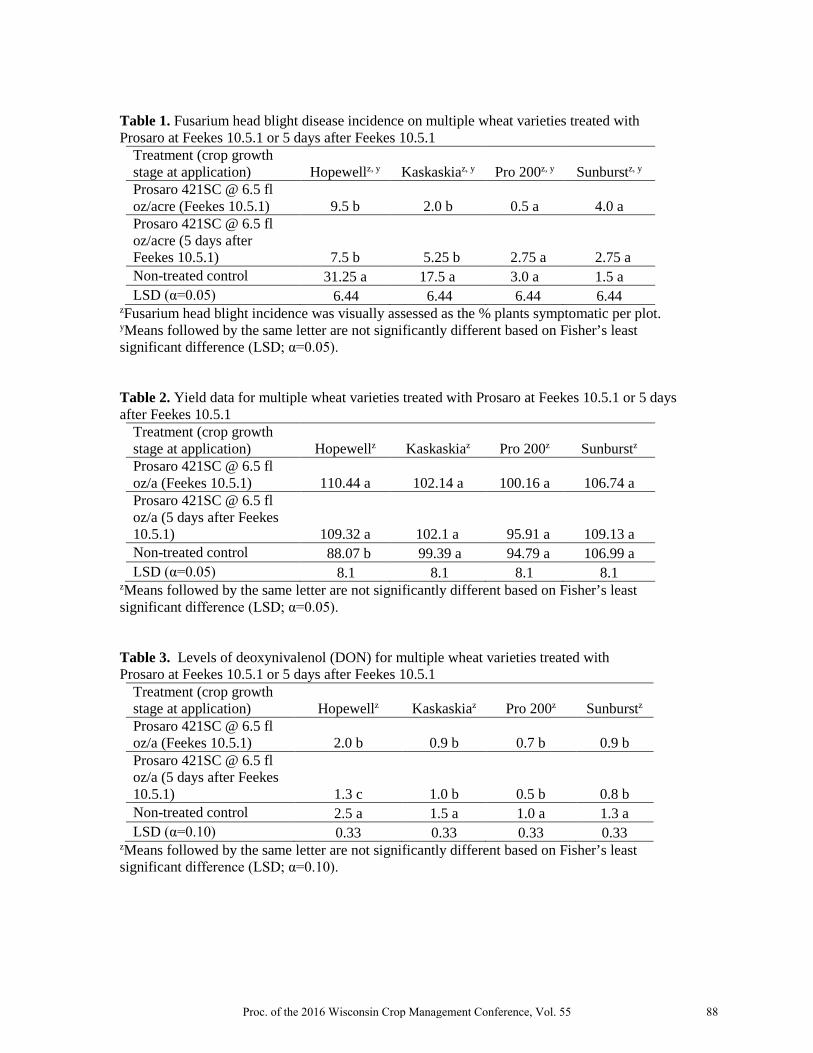
Table 1. Fusarium head blight disease incidence on multiple wheat varieties treated with Prosaro at Feekes 10.5.1 or 5 days after Feekes 10.5.1
Treatment (crop growth stage at application) Hopewellz, y Kaskaskiaz, y Pro 200z, y Sunburstz, y Prosaro 421SC @ 6.5 fl oz/acre (Feekes 10.5.1) 9.5 b 2.0 b 0.5 a 4.0 a Prosaro 421SC @ 6.5 fl oz/acre (5 days after Feekes 10.5.1) 7.5 b 5.25 b 2.75 a 2.75 a Non-treated control 31.25 a 17.5 a 3.0 a 1.5 a LSD (α=0.05) 6.44 6.44 6.44 6.44
zFusarium head blight incidence was visually assessed as the % plants symptomatic per plot. yMeans followed by the same letter are not significantly different based on Fisher’s least significant difference (LSD; α=0.05). Table 2. Yield data for multiple wheat varieties treated with Prosaro at Feekes 10.5.1 or 5 days after Feekes 10.5.1
Treatment (crop growth stage at application) Hopewellz Kaskaskiaz Pro 200z Sunburstz Prosaro 421SC @ 6.5 fl oz/a (Feekes 10.5.1) 110.44 a 102.14 a 100.16 a 106.74 a Prosaro 421SC @ 6.5 fl oz/a (5 days after Feekes 10.5.1) 109.32 a 102.1 a 95.91 a 109.13 a Non-treated control 88.07 b 99.39 a 94.79 a 106.99 a LSD (α=0.05) 8.1 8.1 8.1 8.1
zMeans followed by the same letter are not significantly different based on Fisher’s least significant difference (LSD; α=0.05). Table 3. Levels of deoxynivalenol (DON) for multiple wheat varieties treated with Prosaro at Feekes 10.5.1 or 5 days after Feekes 10.5.1
Treatment (crop growth stage at application) Hopewellz Kaskaskiaz Pro 200z Sunburstz Prosaro 421SC @ 6.5 fl oz/a (Feekes 10.5.1) 2.0 b 0.9 b 0.7 b 0.9 b Prosaro 421SC @ 6.5 fl oz/a (5 days after Feekes 10.5.1) 1.3 c 1.0 b 0.5 b 0.8 b Non-treated control 2.5 a 1.5 a 1.0 a 1.3 a LSD (α=0.10) 0.33 0.33 0.33 0.33
zMeans followed by the same letter are not significantly different based on Fisher’s least significant difference (LSD; α=0.10).
Proc. of the 2016 Wisconsin Crop Management Conference, Vol. 55 88

In the additional fungicide efficacy trial, all fungicide treatments resulted in a significant decrease in Fusarium head blight incidence compared to the non-treated control (Table 4). Fungicide treatments Stratego YLD 500SC 5.0 fl oz at Feekes 8, Prosaro 421SC 6.5 fl oz at Feekes 8, Stratego YLD 500SC 2.0 fl oz at Feekes 5 then Prosaro 421SC 6.5 fl oz at Feekes 10.5.1, Prosaro 421SC 6.5 fl oz at Feekes 10.5.1 and Stratego YLD 500SC 5.0 fl oz at Feekes 8 then Prosaro 421SC 6.5 fl oz at Feekes 10.5.1 had significantly higher yields compared to non-treated plots. Stratego YLD 500SC 2.0 fl oz applied at growth stage Feekes 5 then Prosaro 421SC 6.5 fl oz at growth stage Feekes 10.5.1 had the highest yield in this trial. There were no significant differences in test weight and DON among all treatments. No stripe rust was observed in this trial.
Table 4. Fusarium head blight incidence, DON content, test weight, and yield of wheat treated with various foliar fungicides Treatment and rate/A (crop growth stage at application)z
FHB Disease Incidence (%)y,x
Yield (bu/acre)x
Test Weight (lb/bu)
DON (ppm)
Non-treated control 20.0 a 90.6 d 57.6 1.1 Quilt Xcel 2.2SE 10.5 fl oz (Feekes 8) 13.8 b 95.8 ad 56.8 1.0 Stratego YLD 500SC 5.0 fl oz (Feekes 8) 12.5 b 99.2 ab 56.9 1.0 Prosaro 421SC 6.5 fl oz (Feekes 8) 11.3 bc 98.1 ac 57.6 1.0 Trivapro 14.6 fl oz (Feekes 8) 11.3 bc 93.0 bcd 58.1 1.1 Stratego YLD 500SC 2.0 fl oz (Feekes 5)
Prosaro 421SC 6.5 fl oz (Feekes 10.5.1) 6.3 cd 102.5 a 57.8 1.2
Prosaro 421SC 6.5 fl oz (Feekes 10.5.1) 6.3 cd 98.4 ab 58.6 1.1 Priaxor 4.17SC 2.0 fl oz (Feekes 5)
Caramba 90EC 13.5 fl oz (Feekes 10.5.1) 4.7 d 91.4 cd 57.7 0.8
Stratego YLD 500SC 5.0 fl oz (Feekes 8)
Prosaro 421SC 6.5 fl oz (Feekes 10.5.1) 3.3 d 98.0 ac 58.5 1.1
Quilt Xcel 2.2SE 10.5 fl oz (Feekes 8)
Prosaro 421SC 6.5 fl oz (Feekes 10.5.1) 3.0 d 92.7 bcd 57.1 1.1
LSD (α=0.05) 5.58 6.79 nsw nsw zInduce 90% SL (Non-ionic surfactant) at 0.125% v/v was added to all fungicide treatments. yFusarium head blight incidence was visually assessed as the % plants symptomatic per plot. xMeans followed by the same letter are not significantly different based on Fisher’s least significant difference (LSD; α=0.05). wns = no least significant difference (α=0.05)
Proc. of the 2016 Wisconsin Crop Management Conference, Vol. 55 89

Summary
For stripe rust management fungicides should be applied if disease is active in the lower leaf canopy at the Feekes 8 growth stage (emerging flag leaf). Strobilurin, demythylation inhibitor (DMI), or a combination of these products are suitable fungicides for control of stripe rust. Current stripe rust research in Wisconsin is focusing on yield losses in soft red winter wheat, fungicide timing for control, and whether the pathogen overwinters/oversummers in Wisconsin. For Fusarium head blight management fungicide application is recommended at anthesis (Feekes 10.5.1) or within 5 days after anthesis has begun depending on weather around flowering. It is not recommended to spray before anthesis to control Fusarium head blight as control will not be as good as at Feekes 10.5.1 or up to 5 days after Feekes 10.5.1. DMI products, such as Prosaro or Caramba, are recommended for control of Fusarium head blight at anthesis. Strobilurin Fungicides should not be used after at or after Feeeks 10.5.1 as an increase in DON can result from their use during this growth stage.
References Chen, X.M. 2005. Epidemiology and control of stripe rust (Puccinia striiformis f. sp. tritici) on wheat. Can. J. Plant Pathol. 27:314-337. Marburger, D., Conley, S., Esker, P., Lauer, J., & Ane, J. (2015). Yield Response to Crop/Genotype Rotations and Fungicide Use to Manage Fusarium-related Diseases. Crop Science, 55(2), 889-898. Smith, D. Wisconsin field crops pathology. Retrieved December 16, 2015, from http://fyi.uwex.edu/fieldcroppathology/
Proc. of the 2016 Wisconsin Crop Management Conference, Vol. 55 90

FUNGICIDE RESISTANCE IN FIELD CROPS
Daren Mueller1/
Herbicide resistant weeds have been in the news quite frequently lately, and rightfully so. Their existence is changing how farmers currently manage weeds in corn and soybean fields. But resistance to pesticides is not limited to weeds. Fungi that cause crop disease can also develop resistance to fungicides. This presentation will cover the basics of fungicide resistance and outline ways to avoid or delay fungicide resistance from occurring. Some of this research is funded through the soybean check off from Iowa Soybean Association and the United Soybean Board. We thank our sponsors for this support. Fungicide resistance is when populations of a particular fungus that are not sensitive to a specific class of fungicides are selected for and become the predominant population. There are a few factors that can contribute to the risk of fungicide resistance developing – 1) the genetic diversity of the fungus and how quickly it can reproduce; 2) the class of fungicides being used and how frequently they are used. This presentation will unpack these two factors. Fungicide resistant populations of some fungi have already been identified in field crops. This includes Cercospora sojina, the pathogen that causes frogeye leaf spot in soybean (Fig. 1). Managing frogeye leaf spot or other diseases with resistant pathogen populations will require farmers to consider fungicide resistance. This involves minimizing selection pressure, which can be accomplished by using resistant crop varieties and implementing appropriate cultural practices to manage the disease, as well as to rotate to fungicides with different active ingredients. Also, fungicides should only be applied when warranted, taking into consideration information gained from scouting and disease risk factors. Because each fungicide may differ in their ability to manage a particular pathogen and each pathogen has a unique risk for developing resistance, it will be important to do your homework on each fungicide and target pathogen when using fungicides. These ideas will be explained further in the presentation. Fungicide-resistant strains of field crop pathogens already exist in Iowa fields. The more we spray fungicides, the higher the risk of eventually selecting for these resistant populations. We can take steps to slow the selection for these pathogens but it will require knowledge of each disease or each field. This presentation will outline the basics of fungicide resistance and identify steps to manage fungicide resistance. _________________________ 1/Extension Soybean Plant Pathologist, Iowa State University, Ames, IA 50011.
Proc. of the 2016 Wisconsin Crop Management Conference, Vol. 55 91
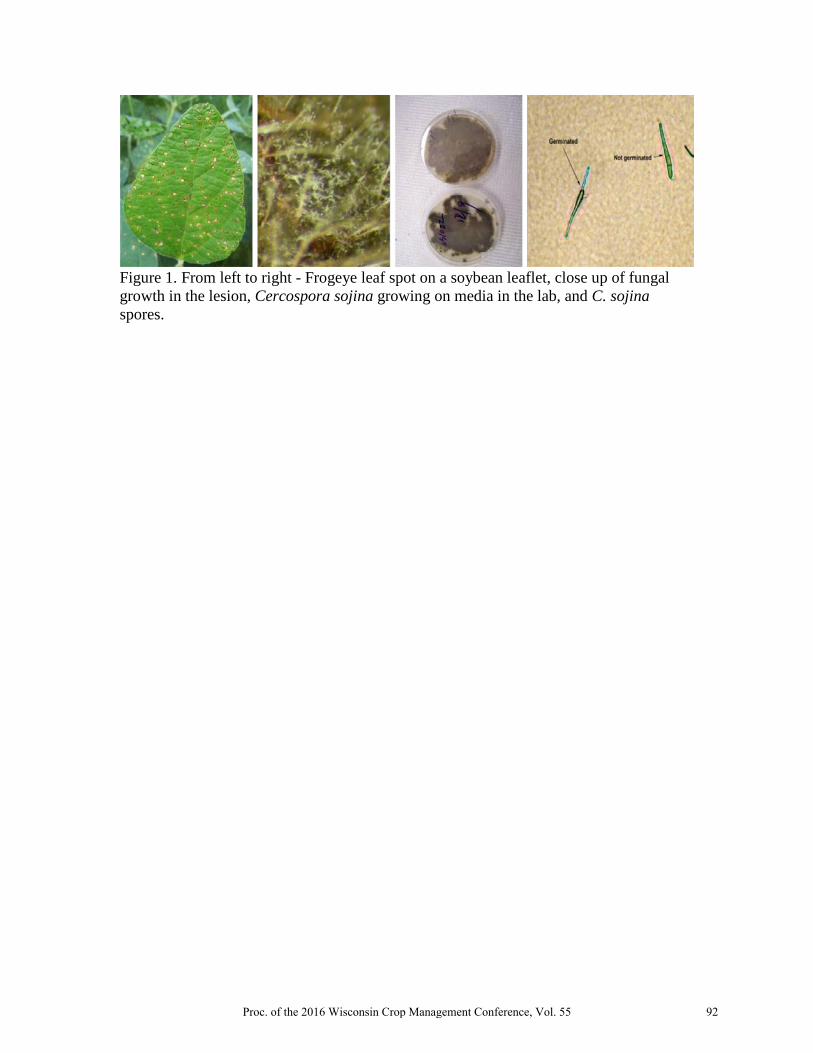
Figure 1. From left to right - Frogeye leaf spot on a soybean leaflet, close up of fungal growth in the lesion, Cercospora sojina growing on media in the lab, and C. sojina spores.
Proc. of the 2016 Wisconsin Crop Management Conference, Vol. 55 92
_______________________________________________________
1/ Assistant Professor, Dept. of Plant Pathology, 1630 Linden Dr., Univ. of Wisconsin-Madison, Madison, WI, 53706. 2/ Researcher, Depts. of Plant Pathology and Entomology, 1630 Linden Dr. Univ. of Wisconsin-Madison, Madison, WI, 53706. 3/ Graduate Research Assistant, Dept. of Plant Pathology, 1630 Linden Dr.,Univ. of Wisconsin-Madison, Madison, WI, 53706. 4/ Graduate Research Assistant, Dept. of Entomology, 1630 Linden Dr., Univ. of Wisconsin-Madison, Madison, WI, 53706.
MANAGING CORN DISEASES IN WISCONSIN
Damon L. Smith 1/, Scott Chapman 2/, Brian Mueller 3/, and Chris Bloomingdale 4/
Introduction The 2014 field season was a bit of a challenge for corn growers in Wisconsin, to say the least. Growing conditions were poor, which made for a lot of challenges including diseases. On the top of that list in Wisconsin was Northern Corn Leaf blight (NCLB). A close second was Goss’s Wilt. In 2015, NCLB again was a considerable issue along with reports of Goss’s wilt and eyespot. NCLB hit the state hard anywhere from prior to the VT growth stage through to late reproductive growth stages. This likely resulted in some direct loss in yield, but also led to increased levels of stalk rot which caused lodging in some fields. Goss’s wilt is caused by the bacterium Clavibacter michiganensis subsp. nebraskensis. First visual symptoms usually appear as gray or yellow stripes on leaves that tend to follow the leaf veins. Often “freckles”, or brown or green irregular spots, can be observed within the leaf lesions. Freckles are an excellent diagnostic symptom to confirm Goss’s wilt. Vascular tissue, husks, and kernels can sometimes take on an orange hue. Occasionally, bacterial ooze or dried ooze can be observed on symptomatic leaves. Fungicides do not work for Goss’s wilt, because this is caused by a bacterium, not a fungus. Management is preventative for Goss’s wilt. Choose hybrids with the best possible resistance, manage excessive amounts of corn surface residue, and rotate crops. The longer the rotation between corn crops, the better. There are some foliar products being marketed for the control of Goss’s wilt, but efficacy data indicate poor control of the disease.
Eyespot is caused by the fungus Kabatiella zeae and typically first develops as very small pen-tipped sized lesions that appear water-soaked. As the lesions mature they become larger (¼ inch in diameter) and more tan in the center and have a yellow halo. Lesions can be numerous and spread from the lower leaves to upper leaves. In severe cases, lesions may grow together and can cause defoliation and/or yield reduction. Eyespot is also favored by cool, wet, and frequently rainy conditions. No-till and continuous corn production systems can also increase the risk for eyespot, as the pathogen is borne on corn residue on the soil surface. Management should focus on the use of resistant hybrids and residue management. In-season management is available in the form of fungicides. However, severity has to reach high levels (>50%) before this disease begins to impact yield. When scouting, note the disease and keep track of the severity. Again, fungicides should be applied early in the epidemic and may not be cost effective for this disease alone. NCLB is caused by a fungus called Exserohilum turcicum. The most diagnostic symptom of NCLB is the long, slender, cigar-shaped, gray-green to tan lesions that develop on leaves. NCLB often begins on the lower leaves and works it way to the top leaves. This disease is favored by cool, wet, rainy weather, which seemed to dominate both the 2014 and 2015 growing seasons in Wisconsin. Higher levels of disease might be expected in fields with a previous history of NCLB and/or fields that have been in continuous and no-till corn production. The pathogen over-winters in corn residue, therefore, the more residue on the soil surface the higher the risk for
Proc. of the 2016 Wisconsin Crop Management Conference, Vol. 55 93
NCLB. Management should focus on using resistant hybrids and residue management. In-season management is available in the form of several fungicides that are labeled for NCLB. However, these fungicides should be applied at the early onset of the disease and only if the epidemic is expected to get worse. Often the best time to apply fungicides to field corn to maximize the benefits is near the VT/R1 growth stage. However, if NCLB is visible on leaves earlier than this time, a fungicide might be beneficial at those earlier stages. The only way to determine this is to scout frequently and keep an eye on the disease situation in your corn crop. Since 2013 there have been active foliar fungicide trials located at the Arlington Agricultural research station. These trials are focused on control of fungal leaf diseases that occur naturally in Wisconsin. Data from these trials will be illustrated in the presentation. A subset of the data from 2015 is presented below.
Materials and Methods A fungicide evaluation trial was established at the Arlington Agricultural Research Station located in Arlington, WI in 2015. The corn hybrid ‘DKC45-51RIB’ was chosen for this study. Corn was planted on 1 May in a field consisting of a Plano silt loam soil (2 to 6% slopes) with a Joy silt loam intrusion (0 to 4% slopes). The experimental design was a randomized complete block with four replicates. Plots consisted of four 30-in. spaced rows, 20 ft long and 10 ft wide with 7-ft alleys between plots. Standard corn production practices as described by the University of Wisconsin Cooperative Extension Service were followed. Treatments consisted of two non-treated controls and 30 fungicide treatments. Pesticides were applied using a CO2-pressurized backpack sprayer equipped with 8001 TurboJet flat fan nozzles calibrated to deliver 20 GPA. Pesticides were applied at growth stages V6, V8, VT, R1 or V6 and VT. Natural sources of pathogen inoculum were relied upon for disease. Eyespot was rated on 20 Aug. Northern corn leaf blight (NCLB) and greening on 1 Oct, stalk rot on 13 Oct. and lodging on 23 Oct. All foliar diseases were visually assessed by inspecting ear leaves on five plants in each plot with the aid of standardized area diagrams. Stalk rot was assessed on five plants in each plot at R6 by cutting stalks with a knife and rating using the Illinois 0 to 5 scale where 0=no stalk rot and 5=severe stalk rot with lodging. Greening was rated by assessing percent green foliage at R6 growth stage. Lodging was assessed at harvest by visually estimating the percent plants per plot leaning greater than 45 degrees from vertical. Yield was determined by harvesting the center two rows of each plot using an Almaco SPC40 small-plot combine equipped with a HarvestMaster HM800 Classic Grain gauge. All foliar, greening, lodging, and yield data were analyzed using a mixed model analysis of variance (ANOVA; P=0.05). Means were separated using Fisher’s test of least significant difference (LSD). Stalk rot data were analyzed using non-parametric analysis due to the ordinal nature of the ratings and reported as rank estimates.
Results
Temperature and precipitation for the 2015 season were comparable to the 30-year average at this location. Severity of northern corn leaf blight (NCLB) and stalk rot was moderate to high in this trial (Table 1). Eyespot severity was low and insignificant. Severity of NCLB in plots treated with fungicide was not significantly reduced compared to at least one of the non-treated check plots. Plots treated with Quilt Xcel 2.2SE at the VT growth stage had significantly lower stalk rot severity than not treating. All other treatments had stalk rot severity comparable to the non-treated checks. Plots treated with Toguard EQ 4.29SC (VT), Equation 2.08SC (VT), Quilt Xcel 2.2SE (VT), and Quadris 2.08F (V6) + Quilt Xcel 2.2SE (VT) had significantly more greening than the non-treated checks. All other plots were comparable to not treating. There were no significant differences in lodging or yield among all treatments. Phytotoxicity was not observed for any treatment. Data from previous trials (2013 and 2014) will be combined with these data and summarized in the presentation.
Proc. of the 2016 Wisconsin Crop Management Conference, Vol. 55 94
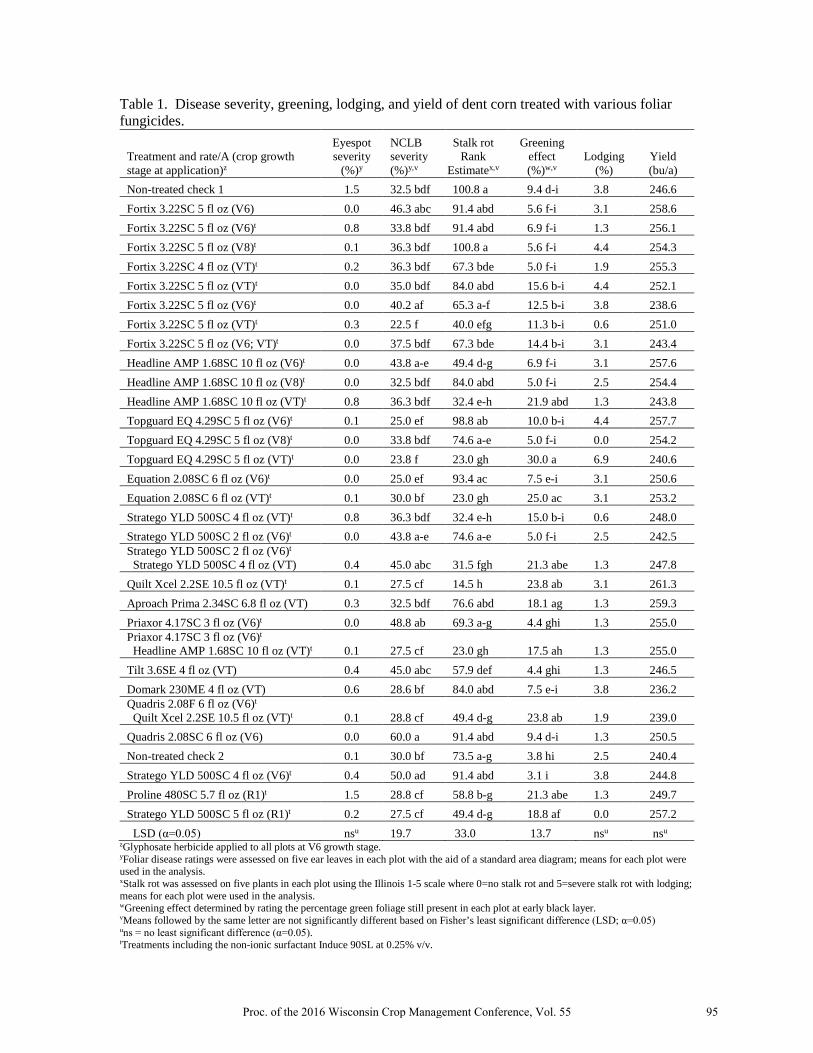
Table 1. Disease severity, greening, lodging, and yield of dent corn treated with various foliar fungicides.
Treatment and rate/A (crop growth stage at application)z
Eyespot severity
(%)y
NCLB severity (%)y,v
Stalk rot Rank
Estimatex,v
Greening effect (%)w,v
Lodging (%)
Yield (bu/a)
Non-treated check 1 1.5 32.5 bdf 100.8 a 9.4 d-i 3.8 246.6 Fortix 3.22SC 5 fl oz (V6) 0.0 46.3 abc 91.4 abd 5.6 f-i 3.1 258.6 Fortix 3.22SC 5 fl oz (V6)t 0.8 33.8 bdf 91.4 abd 6.9 f-i 1.3 256.1 Fortix 3.22SC 5 fl oz (V8)t 0.1 36.3 bdf 100.8 a 5.6 f-i 4.4 254.3 Fortix 3.22SC 4 fl oz (VT)t 0.2 36.3 bdf 67.3 bde 5.0 f-i 1.9 255.3 Fortix 3.22SC 5 fl oz (VT)t 0.0 35.0 bdf 84.0 abd 15.6 b-i 4.4 252.1 Fortix 3.22SC 5 fl oz (V6)t 0.0 40.2 af 65.3 a-f 12.5 b-i 3.8 238.6 Fortix 3.22SC 5 fl oz (VT)t 0.3 22.5 f 40.0 efg 11.3 b-i 0.6 251.0 Fortix 3.22SC 5 fl oz (V6; VT)t 0.0 37.5 bdf 67.3 bde 14.4 b-i 3.1 243.4 Headline AMP 1.68SC 10 fl oz (V6)t 0.0 43.8 a-e 49.4 d-g 6.9 f-i 3.1 257.6 Headline AMP 1.68SC 10 fl oz (V8)t 0.0 32.5 bdf 84.0 abd 5.0 f-i 2.5 254.4 Headline AMP 1.68SC 10 fl oz (VT)t 0.8 36.3 bdf 32.4 e-h 21.9 abd 1.3 243.8 Topguard EQ 4.29SC 5 fl oz (V6)t 0.1 25.0 ef 98.8 ab 10.0 b-i 4.4 257.7 Topguard EQ 4.29SC 5 fl oz (V8)t 0.0 33.8 bdf 74.6 a-e 5.0 f-i 0.0 254.2 Topguard EQ 4.29SC 5 fl oz (VT)t 0.0 23.8 f 23.0 gh 30.0 a 6.9 240.6 Equation 2.08SC 6 fl oz (V6)t 0.0 25.0 ef 93.4 ac 7.5 e-i 3.1 250.6 Equation 2.08SC 6 fl oz (VT)t 0.1 30.0 bf 23.0 gh 25.0 ac 3.1 253.2 Stratego YLD 500SC 4 fl oz (VT)t 0.8 36.3 bdf 32.4 e-h 15.0 b-i 0.6 248.0 Stratego YLD 500SC 2 fl oz (V6)t 0.0 43.8 a-e 74.6 a-e 5.0 f-i 2.5 242.5 Stratego YLD 500SC 2 fl oz (V6)t Stratego YLD 500SC 4 fl oz (VT) 0.4 45.0 abc 31.5 fgh 21.3 abe 1.3 247.8 Quilt Xcel 2.2SE 10.5 fl oz (VT)t 0.1 27.5 cf 14.5 h 23.8 ab 3.1 261.3 Aproach Prima 2.34SC 6.8 fl oz (VT) 0.3 32.5 bdf 76.6 abd 18.1 ag 1.3 259.3 Priaxor 4.17SC 3 fl oz (V6)t 0.0 48.8 ab 69.3 a-g 4.4 ghi 1.3 255.0 Priaxor 4.17SC 3 fl oz (V6)t Headline AMP 1.68SC 10 fl oz (VT)t 0.1 27.5 cf 23.0 gh 17.5 ah 1.3 255.0 Tilt 3.6SE 4 fl oz (VT) 0.4 45.0 abc 57.9 def 4.4 ghi 1.3 246.5 Domark 230ME 4 fl oz (VT) 0.6 28.6 bf 84.0 abd 7.5 e-i 3.8 236.2 Quadris 2.08F 6 fl oz (V6)t Quilt Xcel 2.2SE 10.5 fl oz (VT)t 0.1 28.8 cf 49.4 d-g 23.8 ab 1.9 239.0 Quadris 2.08SC 6 fl oz (V6) 0.0 60.0 a 91.4 abd 9.4 d-i 1.3 250.5 Non-treated check 2 0.1 30.0 bf 73.5 a-g 3.8 hi 2.5 240.4 Stratego YLD 500SC 4 fl oz (V6)t 0.4 50.0 ad 91.4 abd 3.1 i 3.8 244.8 Proline 480SC 5.7 fl oz (R1)t 1.5 28.8 cf 58.8 b-g 21.3 abe 1.3 249.7 Stratego YLD 500SC 5 fl oz (R1)t 0.2 27.5 cf 49.4 d-g 18.8 af 0.0 257.2 LSD (α=0.05) nsu 19.7 33.0 13.7 nsu nsu
zGlyphosate herbicide applied to all plots at V6 growth stage. yFoliar disease ratings were assessed on five ear leaves in each plot with the aid of a standard area diagram; means for each plot were used in the analysis. xStalk rot was assessed on five plants in each plot using the Illinois 1-5 scale where 0=no stalk rot and 5=severe stalk rot with lodging; means for each plot were used in the analysis. wGreening effect determined by rating the percentage green foliage still present in each plot at early black layer. vMeans followed by the same letter are not significantly different based on Fisher’s least significant difference (LSD; α=0.05) uns = no least significant difference (α=0.05). tTreatments including the non-ionic surfactant Induce 90SL at 0.25% v/v.
Proc. of the 2016 Wisconsin Crop Management Conference, Vol. 55 95

BUSINESS CODE OF ETHICS WORKSHOP
Jeffrey A. Brandenburg, CPA, CFE 1/
Introduction
Hardly a day goes by without seeing an article or hearing a news report about fraud and ethics….usually involving a loss of cash or assets. Many organizations believe “it just cannot happen to them.” The fact is that surveys show most businesses experience some sort of fraud or ethics challenges each and every year. How you address fraud and ethics from a management and business perspective can make an impact not only in discouraging fraud and ethics issues from occurring but also creating a better work environment at your company. The items this session will address include:
►What is fraud? ►Ethics discussion ►Defining the ethics at your organization ►Dealing with fraud and ethics ►Ethics and internal controls
______________________ 1/ Managing Principal-Agribusiness, Certified Public Accountant, and Certified Fraud Examiner, CliftonLarsonAllen LLP, 8215 Greenway Blvd., Suite 600, Middleton, WI, 53562.
Proc. of the 2016 Wisconsin Crop Management Conference, Vol. 55 96

SNAP BEAN INSECT PEST MANAGEMENT
Kathryn J. Prince and Russell L. Groves 1/
Abstract Production and processing of specialty crops in Wisconsin are very important to both state and national agricultural industries. Nearly all of the commercial, contract green bean acres receive an at-plant seed treatment of a Group 4A insecticide (neonicotinoid). Increasingly, producers rely heavily on this single class of insecticides for control of early season pests including seed maggots, potato leafhopper, and bean leaf beetles. Reported at-plant applications of these neonicotinoid seed treatments have occurred on nearly 90% of all acres reported and reflect statewide use rates in many other grain crops. Con-comitantly, both native and domestic pollinators are experiencing declines and even disappearance in localized regions of the US on an unprecedented level. Despite a remarkably intensive level of research effort towards understanding causes of pollinator declines and managed honeybee colony losses in the US, overall losses continue to be high and pose a serious threat to meeting the pollination service demands for several commercial crops. In addition, the US EPA has recently proposed revisions to existing insecticide label registrations for the control of key pests in green bean production. Current and future proposed options for control will be discussed in the context of revised seed treatment registrations. _______________________________ 1/ Research Assistant and Associate Professor, Dept. of Entomology, Univ. of Wisconsin-Madison, 1630 Linden Dr., Madison, WI 53706.
Proc. of the 2016 Wisconsin Crop Management Conference, Vol. 55 97

INTEGRATED WEED MANAGEMENT IN CARROT PRODUCTION
Jed Colquhoun, Richard Rittmeyer and Daniel Heider1
Carrot growers are challenged with a broad spectrum of weed species in a relatively uncompetitive crop and currently have few management options to remedy the situation. Furthermore, linuron, one of the more effective control options in carrots, is restricted in use on coarse-textured, low organic matter soils where the crop is often grown. With this in mind, studies were conducted to: 1) identify herbicide programs that provide season-long control; 2) evaluate preemergent herbicides on cereal nurse crops interseeded among carrots for wind erosion control; and, 3) identify carrot varieties that suppress weeds with rapid emergence and establishment. All studies were conducted at the Hancock Agricultural Research Station in Hancock, WI on a loamy sand soil. In the carrot herbicide program evaluation, common lambsquarters control was poor where ethofumesate (Ethotron; not labeled for carrots in Wisconsin) was applied preemergence and followed by prometryn postemergence (Vegetable Pro or Caparol). Thirty days after the 5-carrot leaf stage application, hairy nightshade and common purslane control were complete with all herbicide programs. Harvested carrot number was similar among all herbicide programs. Carrot yield was reduced compared to the handweeded check where s-metolachlor (Dual Magnum) or ethofumesate were applied preemergence. Given that minimal injury was observed in these programs, it’s assumed that the yield reduction was a result of poor common lambsquarters control. Carrot yield was similar to the handweeded carrots with all other herbicide programs. Pendimethalin (Prowl H2O) applied preemergence followed by prometryn at the 3- and 5-carrot leaf stage resulted in the most consistent weed control and crop yield among the commercially-available programs without linuron. S-metolachlor, pendimethalin and prometryn were evaluated at multiple rates relative to barley, oat and wheat growth as nurse crops interseeded with carrots. All of the nurse crops were stunted 20 to 25% 8 days after planting where s-metolachlor was applied preemergence, and barley stand density was reduced by the 1 pt/acre product rate. While the oat stand density was not affected by any of the herbicides, wheat stand density was reduced by roughly 2/3 by s-metolachlor applied at 0.67 or 1.0 pt/acre. By 14 days after treatment, 2.0, 3.0 and 4.0 pt/acre product of prometryn and 1.0 pt/acre s-metolachlor resulted in greater barley, oat and wheat injury than the non-treated nurse crops. Nurse crop injury was 27% where prometryn was applied preemergence at the 3.0 or 4.0 pt/acre rates. Common lambsquarters control was best where prometryn was applied, regardless of rate. Several carrot varieties were also evaluated for their ability to: 1) maintain yield in the presence of weeds; and, 2) suppress weeds through rapid establishment and canopy development. For example, ‘Bolero’ established a broad crop canopy sooner than most other varieties and maintained 95% of the weed-free carrot yield when weeds were present. In contrast, ‘SFF’ variety established slowly and never achieved full ground cover in canopy development. As a result, weed biomass was greater than in any other variety and the yield of the weedy carrots was only 72% of the weed-free yield. Carrot variety emergence and canopy development rates can be an important consideration in an integrated weed management program and require no additional crop inputs.
Labels change often. As always, read and follow the label prior to any pesticide use. 1 Professor, Senior Outreach Specialist, and Senior Research Specialist; Department of Horticulture, University of Wisconsin-Madison, 1575 Linden Drive, Madison, WI 53706.
Proc. of the 2016 Wisconsin Crop Management Conference, Vol. 55 98
Fine-tuning Nitrogen Recommendations for Sweet Corn
Matt Ruark and Jaimie West 1/ Introduction While the University of Wisconsin-Extension guidelines for nitrogen applications to sweet corn are listed at 150 lb/ac of N for soils with less than 2% SOM and 130 lb/ac of N for soils with 2 to 10% SOM, there are still many questions related to other N management practices (such as timing and source). A change in N timing relative to planting date is a key factor in improving N use efficiency for sweet corn on irrigated sandy soil. Two studies have been conducted over the past 3 years to evaluate if there are any benefits to altering the timing and rate of N applications on sweet corn. Materials and Methods The first study was conducted during the 2013 and 2014 growing seasons at the Hancock Agricultural Research Station. This study evaluated four sweet corn varieties planted on June 17, 2013 and May 27, 2014. Six nitrogen fertilizer treatments were applied: three with 150 lb/ac of N and three with 200 lb/ac of N. For the 150 lb-N/ac rate treatments, N was applied: (A) 50 lb/ac at V4, 70 lb/ac at V7, and 30 lb/ac at early tassel; (B) 50 lb/ac at V4, 40 lb/ac at V7, 30 lb/ac at early tassel, and 30 lb/ac at silking; or (C) 50 lb/ac at V4, 40 lb/ac at V7, 20 lb/ac one week after V7, 20 lb/ac at early tassel, and 20 lb/ac at silking. For the 200 lb-N/ac rate treatments, N was applied: (A) 50 lb/ac at V4, 90 lb/ac at V7, and 60 lb/ac at early tassel; (B) 50 lb/ac at V4, 90 lb/ac at V7, 30 lb/ac at early tassel, and 30 lb/ac at silking; or (C) 50 lb/ac at V4, 90 lb/ac at V7, 20 lb/ac one week after V7, 20 lb/ac at early tassel, and 20 lb/ac at silking. The second study was conducted during the 2015 growing season at the Hancock Agricultural Research Station. This study evaluated two sweet corn varieties across three planting dates: May 1, June 1, and July 1. Five nitrogen fertilizer treatments were evaluated: no N (0N), 80 lb-N/ac applied across two applications of ammonium sulfate (AS) and ammonium nitrate (AN) (80ASAN-2), 130 lb-N/ac applied across two applications (130ASAN-2) or three applications (130ASAN-3), and 180 lb-N/ac applied across three applications (180ASAN-3). The third application was always 30 lb-N/ac as AN at tassel. _____________________________ 1/ Associate Professor and Research Specialist, Dept. of Soil Science, 1525 Observatory Dr., Univ. of Wisconsin-Madison, Madison, WI 53706.
Proc. of the 2016 Wisconsin Crop Management Conference, Vol. 55 99

Results No significant differences were detected across the different "fine-tuning" N treatments. Two varieties in 2013 are shown as an example in Figure 1.
Figure 1. Sweet corn yields in 2013 receiving 150 or 200 lb-N/ac split differently across V7 to silking. In contrast, planting date appears to significantly influence the optimal N rate. In Figure 2, the first planting date required 180 lb-N/ac to maximize yield, while only 130 lb-N/ac was required at the later two planting dates. In addition, there were minor increases in yield obtained from applying some N at tassel.
0
2
4
6
8
10
12
14
150 A 150 B 150 C 200 A 200 B 200 C
Swee
t cor
n yi
eld
(ton
/ac)
Variety #1
0
2
4
6
8
10
12
14
16
150 A 150 B 150 C 200 A 200 B 200 C
Swee
t cor
n yi
eld
(ton
/ac)
Variety #2
Proc. of the 2016 Wisconsin Crop Management Conference, Vol. 55 100

These data sets show that there is some benefit to saving some N to apply later in the growing season (tassel), but little benefit when trying to split apply N across two or three applications during transition into reproductive growth stages.
Figure 2. Sweet corn yields in 2015 receiving different N rates applied at different timings. Treatments split across three applications (130ASAN-3 and 180ASAN-3) received 30 lb-N/ac at tassel.
0
2
4
6
8
10
12
0N 80ASAN-2 130ASAN-2 130ASAN-3 180ASAN-3
Swee
t cor
n yi
eld
(ton
/ac)
SV - May 1st
SV - June 1st
SV - July 1st
Proc. of the 2016 Wisconsin Crop Management Conference, Vol. 55 101
WHITE MOLD MANAGEMENT UPDATE IN PROCESSING SNAP BEANS
Amanda Gevens and Stephen Jordan 1/
Introduction White mold of snap beans has been a challenge to manage in processing production fields in Wisconsin. When unmanaged, white mold can cause significant yield reduction, particularly in moist, warm years. The soilborne fungus Sclerotinia sclerotiorum is responsible for white mold in snap beans, as well as disease in a broad range of dichotomous food plants including other legumes, cucurbits, crucifers, and solanaceous crops. We have routinely conducted foliar fungicide efficacy trials to determine optimum timing and selection of fungicides for white mold control on snap beans in Wisconsin. Results of 2015 fungicide research trials are detailed below.
Materials and Methods
2015 Field Trial: A trial to evaluate the efficacy of fungicides to control white mold on snap bean was established 15 May using cultivar DM88-04 (Del Monte) seeded at approximately 10 per foot. Plots were 24 ft long with 4 rows spaced 15 in apart. Seed was commercially treated with thiram for damping off and root rot protection. There were 4 replications and plots were arranged in a randomized complete block design. Sunflowers were planted in the trial area in 2014 and the flowers were inoculated with Sclerotinia sclerotiorum. Infected debris and sclerotia were tilled into the soil in the fall of 2014 and served as a natural source of ascospore inoculum for this experiment in spring/summer 2015. Fungicide applications for control of white mold were applied twice (depending on fungicide treatment) at 30% bloom (26 Jun) and 7 days later at 100% bloom (3 Jul). Fungicides were applied using a backpack CO2 sprayer with a 4 nozzle spray boom with 19 in. spacing between standard flat fan spray nozzles (Tee Jet 8002VS) at a rate of 35 gallons per acre at 40 psi. On the day of harvest, 19 Jul, the center 2 rows of each plot were evaluated for white mold with the total number of symptomatic plants for each plot being recorded. The 2 center rows from each plot (48 ft total) were mechanically harvested and bean pods were graded to determine yield and proportion of yield in different size classes based on pod diameter: 1-3 (<0.35 in. diam.), 4 (>0.35 in. but <0.43 in.) and 5 (> 0.43 in.). Precipitation in Hancock during the snap bean trial was 6.33 in. Supplemental irrigation was applied 15 times during the trial for an additional 6.8 in. Weather conditions during bloom were moderately conducive for infection and subsequent disease spread. Thus, the occurrence of infections was very low and were not located at the flower, rather at lower stems. Data were subjected to Fisher’s least significant difference tests.
Results and Discussion There were no significant differences between treatments among the three bean pod grade categories (data not shown) and no significant differences at P=0.05 in total yield across treatments (Table 1; Fig. 2). There were no significant differences (P=.0.05) in number of white mold symptomatic plants on day of harvest (Table 1; Fig. 1). The lowest numbers of symptomatic plants and greatest yields were observed in treatments of Endura and Topsin when applied both at 30 and 100% bloom. No phytotoxicity was noted for any of the treatments included in this trial. _______________________ 1/ Associate Professor, and Outreach Specialist, Dept. of Plant Pathology, Univ. of Wisconsin-Madison, 1630 Linden Dr., Madison, WI 53706.
Proc. of the 2016 Wisconsin Crop Management Conference, Vol. 55 102
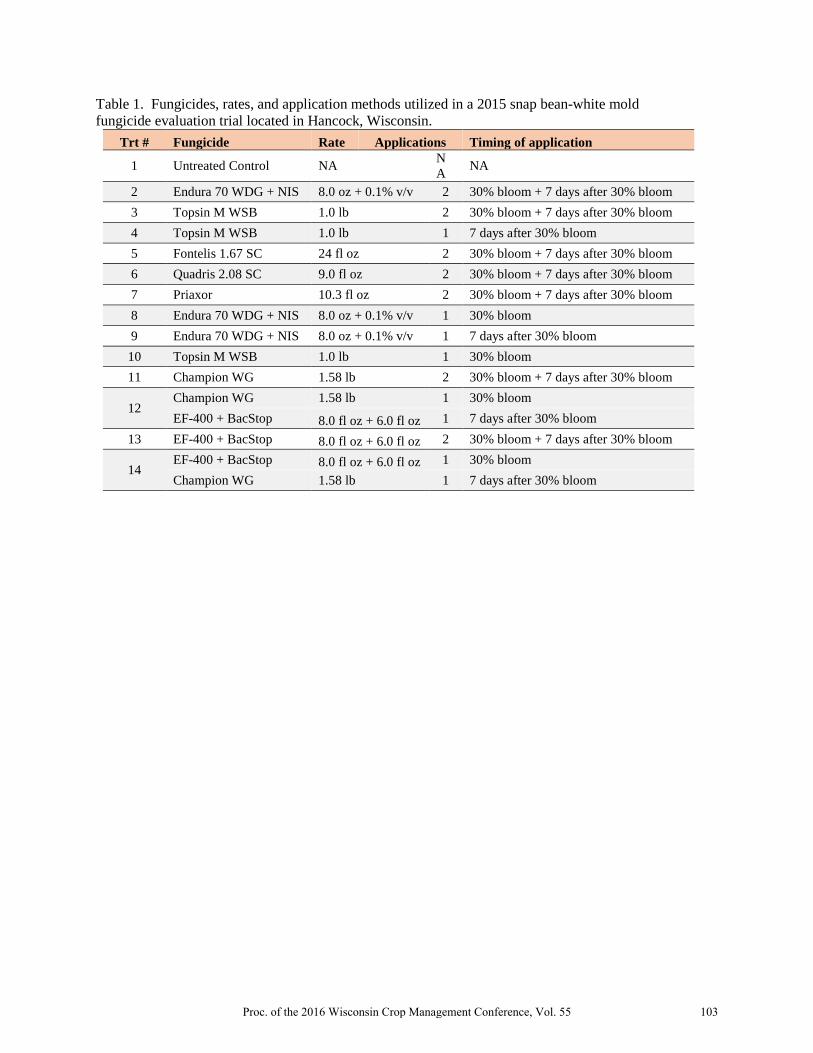
Table 1. Fungicides, rates, and application methods utilized in a 2015 snap bean-white mold fungicide evaluation trial located in Hancock, Wisconsin.
Trt # Fungicide Rate Applications Timing of application
1 Untreated Control NA NA NA
2 Endura 70 WDG + NIS 8.0 oz + 0.1% v/v 2 30% bloom + 7 days after 30% bloom 3 Topsin M WSB 1.0 lb 2 30% bloom + 7 days after 30% bloom 4 Topsin M WSB 1.0 lb 1 7 days after 30% bloom 5 Fontelis 1.67 SC 24 fl oz 2 30% bloom + 7 days after 30% bloom 6 Quadris 2.08 SC 9.0 fl oz 2 30% bloom + 7 days after 30% bloom 7 Priaxor 10.3 fl oz 2 30% bloom + 7 days after 30% bloom 8 Endura 70 WDG + NIS 8.0 oz + 0.1% v/v 1 30% bloom 9 Endura 70 WDG + NIS 8.0 oz + 0.1% v/v 1 7 days after 30% bloom 10 Topsin M WSB 1.0 lb 1 30% bloom 11 Champion WG 1.58 lb 2 30% bloom + 7 days after 30% bloom
12 Champion WG 1.58 lb 1 30% bloom EF-400 + BacStop 8.0 fl oz + 6.0 fl oz 1 7 days after 30% bloom
13 EF-400 + BacStop 8.0 fl oz + 6.0 fl oz 2 30% bloom + 7 days after 30% bloom
14 EF-400 + BacStop 8.0 fl oz + 6.0 fl oz 1 30% bloom Champion WG 1.58 lb 1 7 days after 30% bloom
Proc. of the 2016 Wisconsin Crop Management Conference, Vol. 55 103
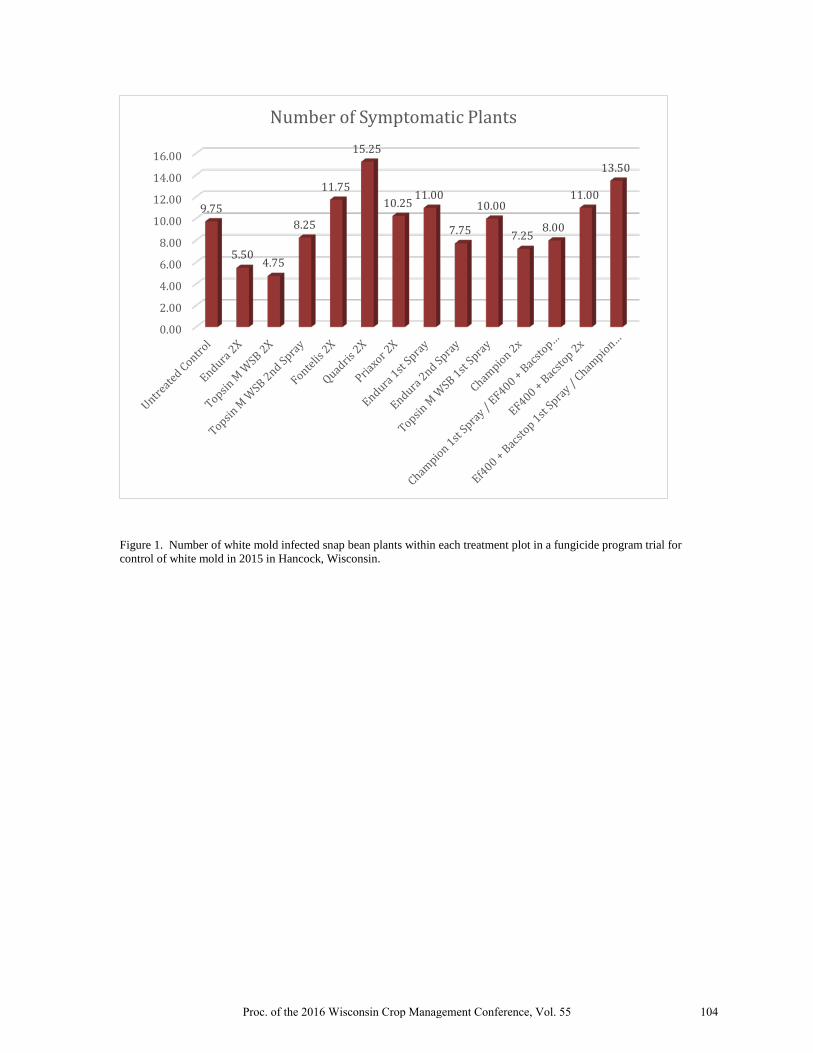
Figure 1. Number of white mold infected snap bean plants within each treatment plot in a fungicide program trial for control of white mold in 2015 in Hancock, Wisconsin.
0.00
2.00
4.00
6.00
8.00
10.00
12.00
14.00
16.00
9.75
5.504.75
8.25
11.75
15.25
10.2511.00
7.75
10.00
7.258.00
11.00
13.50
Number of Symptomatic Plants
Proc. of the 2016 Wisconsin Crop Management Conference, Vol. 55 104
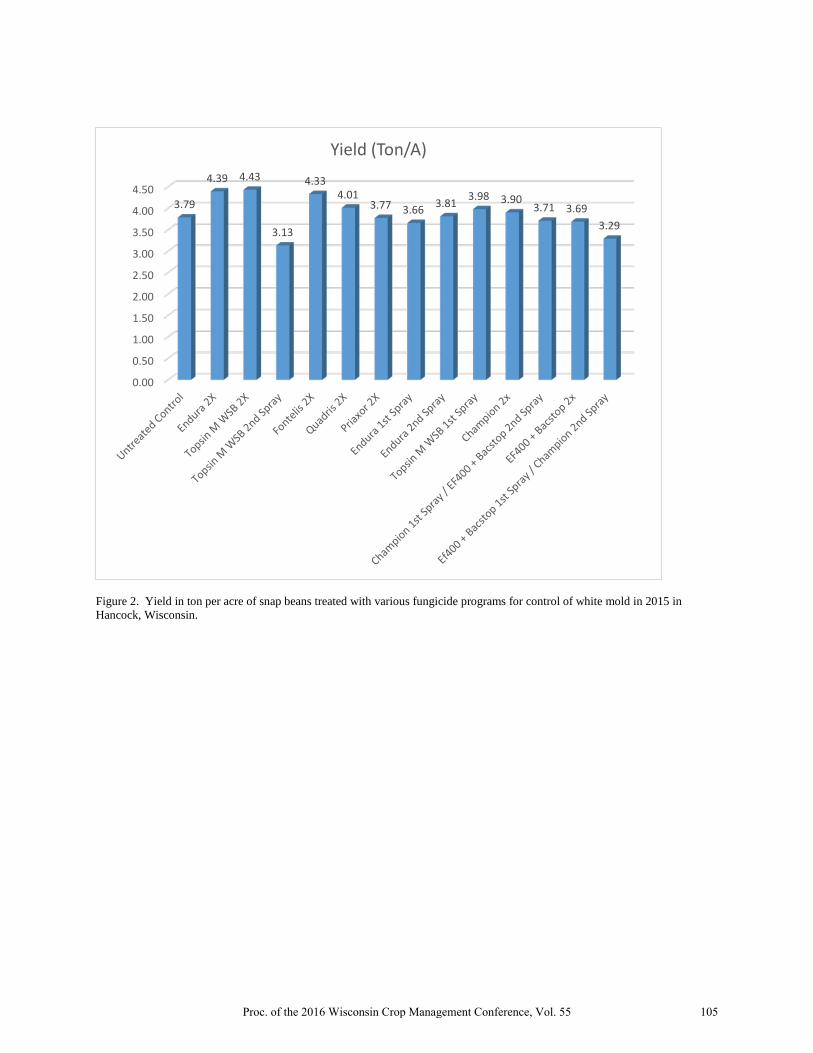
Figure 2. Yield in ton per acre of snap beans treated with various fungicide programs for control of white mold in 2015 in Hancock, Wisconsin.
0.00
0.50
1.00
1.50
2.00
2.50
3.00
3.50
4.00
4.503.79
4.39 4.43
3.13
4.334.01
3.77 3.66 3.81 3.98 3.903.71 3.69
3.29
Yield (Ton/A)
Proc. of the 2016 Wisconsin Crop Management Conference, Vol. 55 105

GOVERNMENT PANEL: NATURAL RESOURCES CONSERVATION SERVICE
Judy Derricks 1/
It has been an exciting and challenging year as we worked to get conservation on the ground throughout Wisconsin. Our new “Regional Conservation Partnership Program (RCPP) provided record levels of conservation installation as we teamed up with public and private investors in the field of conservation. The Environmental Quality Incentive Program (EQIP) and Conservation Stewardship Program continue to be our base programs along with easements programs for wetlands and working lands. To find out more we encourage you to visit www.wi.nrcs.usda.gov for information regarding all of NRCS-Wisconsin’s technical tools, service and financial assistance programs. NRCS in Wisconsin had a banner year because of our clients and partners throughout the state. The farmers have stepped up seeking technical assistance to remedy soil, water, and wildlife challenges and we thank you. Partners in Conservation—Land Conservation Departments and committees, private consultants, and other agency supporters help us to make the most of our dollars and provide the best technical assistance possible and we thank you! The NRCS staff shoulder an overwhelming workload each year. The satisfaction of seeing the work build healthier land and water makes working with over $51 million dollars’ worth of programs to farmers put on the ground gives our staff great satisfaction and we thank you. This year NRCS celebrated 80 years of being pioneers in conservation, working with landowners, local, state governments, and other federal agencies to maintain healthy and productive working lands in Wisconsin. As we grow to meet new challenges as an agency, we are proud to have our conservation heritage as our foundation. ____________________
1/ State Resource Conservationist, Natural Resources Conservation Service, 8030 Excelsior Dr., Suite 200, Madison, WI 53717; 608-662-4422, Ext 258.
Proc. of the 2016 Wisconsin Crop Management Conference, Vol. 55 106
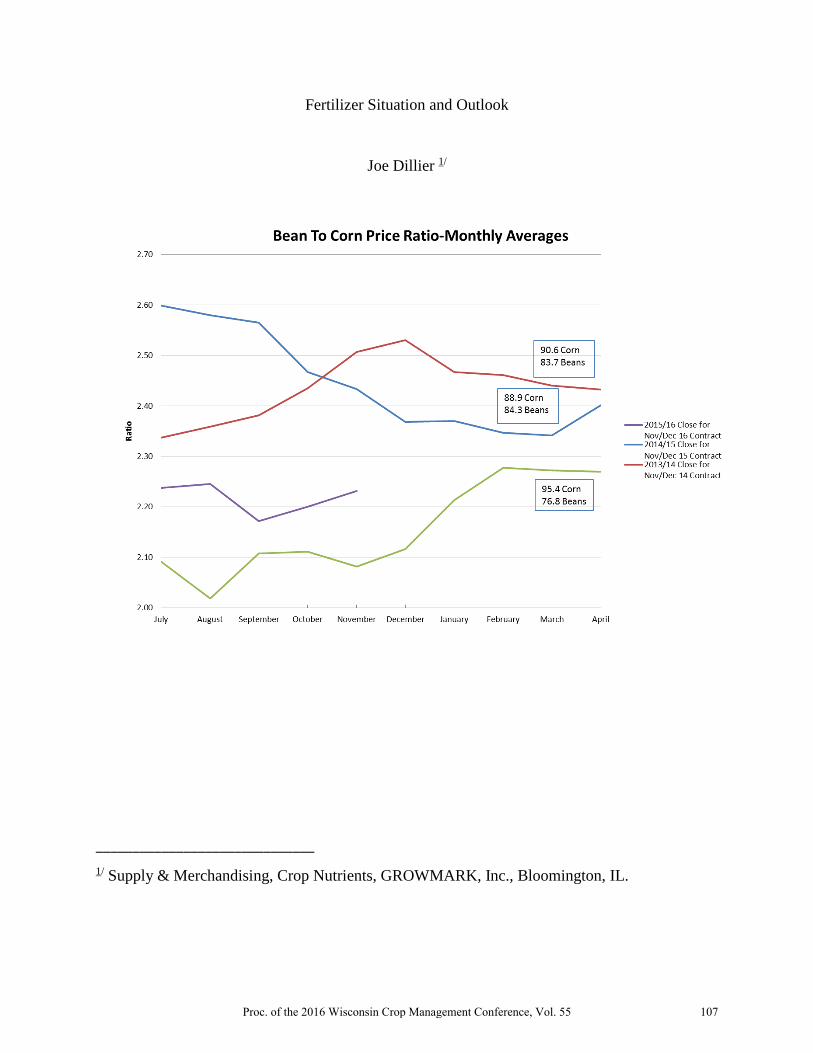
Fertilizer Situation and Outlook
Joe Dillier 1/
______________________________
1/ Supply & Merchandising, Crop Nutrients, GROWMARK, Inc., Bloomington, IL.
Proc. of the 2016 Wisconsin Crop Management Conference, Vol. 55 107

0
100
200
300
400
500
600
700
800
900
Nov-05 Nov-06 Nov-07 Nov-08 Nov-09 Nov-10 Nov-11 Nov-12 Nov-13 Nov-14 Nov-15
PRIC
E $
/TO
NUrea Granular FOB NOLA - Barge
0
100
200
300
400
500
600
700
Nov-09 Nov-10 Nov-11 Nov-12 Nov-13 Nov-14 Nov-15
PRIC
E $
/TO
N
DAP FOB NOLA - Barge
Proc. of the 2016 Wisconsin Crop Management Conference, Vol. 55 108

Outlook
• Economic Cycle—New Capacity, Lower Prices
• “Cake Baking”, Deferred Buying, Price Spikes/Volatility
• Global Cheap Energy vs Cycle Abort (Emissions)
• Food Story Here to Stay
• Global Macro: Added Volatility
0
100
200
300
400
500
600
700
800
Nov-09 Nov-10 Nov-11 Nov-12 Nov-13 Nov-14 Nov-15
PRIC
E $
/TO
NPotash Granular FOB NOLA - Barge
Proc. of the 2016 Wisconsin Crop Management Conference, Vol. 55 109
IMPLEMENTING ADAPTIVE NUTRIENT MANAGEMENT AS PART OF A 590 PLAN
Carrie A.M. Laboski1
Introduction
Adaptive nutrient management is a new feature in the revised NRCS code 590. This paper will explain what adaptive nutrient management is and how to implement it.
The goal of adaptive management is to enable growers to use on-farm data to refine nutrient management strategies to adapt to conditions on their farm. Adaptive management in the context of the 590 standard can be used to 1) document the need for and amount of rescue N applications after excessive rainfall; 2) adjust P and K application rates when documented crop yield levels are greater than ranges provided in UWEX Pub. A2809; or 3) refine any nutrient application rate (primarily N) or management strategy using on-farm research data.
Evaluating and Documenting Nitrogen Loss from Excessive Rainfall Section V.A.1.i. of the 590 standard allows for supplemental in-season N when N deficiency
from excessive rainfall has been documented on each field. Evaluation and documentation of this field situation is not necessarily simple because of the complexity of estimating N loss, determining crop N deficiency, and assessing physiological damage to the crop from water logged soil conditions. Information which should be considered when estimating N loss from excessive rainfall includes: date, rate, and form of N application; amount of time elapsed between prior N application and excessive rainfall; rainfall amount; duration of rainfall event(s); soil water holding capacity; soil aeration/saturation; amount of time the soil was saturated; soil temperature; and appearance of the crop. A few methods that may be considered when evaluating and documenting the need for supplemental N include:
• Laboski, C.A.M. 2016. Evaluating N loss after excessive rainfall. Proc. Wis. Crop Management Conf. 55:00-00 {In press}.
• Schmitt, M.A., G.W. Randall, J.A. Lamb, and G.W. Rehm. 2005. The University of Minnesota Supplemental Fertilizer Nitrogen Worksheet. 43(3). http://www.joe.org/joe/2005june/tt4.php
• Soil nitrate tests have not been calibrated for this purpose. However, experienced agronomists may be able to use soil nitrate tests, especially if soil is sampled at 0-1’ and 1-2’, along with professional judgment to determine if supplemental N may be needed.
• Plant analysis (tissue testing) may also be used. Keep in mind that hybrids vary in what might be considered a sufficient N concentration and plant analysis is best used when samples are collected from both good and bad areas of a field to compare results.
• Chlorophyll meters (eg. SPAD meters), crop canopy reflectance sensors (e.g., GreenSeeker, OptRx, etc.), or aerial images (regular photography and/or NDVI images) may be used to document N deficiency. Many of these technologies have not been calibrated for Wisconsin. Establishment of high N reference strips early in the growing season is helpful to compare greenness of the crop.
• Nitrogen management models (e.g., Adapt-N, Climate Fieldview Pro, Encirca, N Index, etc.) may also be used. Use with caution: none of these models has been adequately, independently validated for use in Wisconsin.
1 Professor, Dept. of Soil Science, 1525 Observatory Dr., Univ. of Wisconsin-Madison, Madison, WI, 53706.
Proc. of the 2016 Wisconsin Crop Management Conference, Vol. 55 110
The 590 standard states that at least one of the above methods must be used to document N loss from excessive rainfall and if more than 46 lb N/a is applied as a rescue N application, then two methods of evaluation and documentation are required.
Adjusting Phosphorus and Potassium Application Rates
For crops with documented yield levels greater than or less than yield levels provided in A2809, P and K application rates may be adjusted by following the text in Chapter 7 of UWEX Pub. A2809 paying close attention to the section titled “Phosphorus and potassium application rate guidelines”. If soil test levels are low or very low determine an appropriate build rate to be added to the rate at optimum by reviewing Table 7.4 for the crop of concern. For example, for corn, soybean, wheat, and alfalfa, 30 lbs P2O5/a is added to the rate at optimum soil test levels to arrive at the rate for low testing soils. For very low testing soils, 40 lbs P2O5/a is added to the rate at optimum for these crops.
Refining Nutrient Management Through On-farm Research
On-farm research can be used to validate the need for nutrient application rates greater than those outlined in UWEX Pub. A2809 or management practices which may vary from this standard. For a general background and details on conducting on-farm research see the following:
• Glewen, K., and J. Rees. 2013. Grower’s Guide to On-Farm Research. University of Nebraska. http://viewer.zmags.com/publication/4efd82ad#/4efd82ad/14
• Lauer, J.G. 2013. On-Farm Testing. University of Wisconsin-Madison, Department of Agronomy. http://corn.agronomy.wisc.edu/Management/L016.aspx
• Nielsen, R.L. A Practical Guide to On-Farm Research. 2010. Purdue University, Department of Agronomy Corny News Network. https://www.agry.purdue.edu/ext/corn/news/timeless/onfarmresearch.pdf
• NRCS Agronomy Technical Note No. 6 Adaptive Nutrient Management, September 2011.
Specific experimental design, data analysis, data collection and documentation criteria
required is provided below. Experimental design
1. Follow the guidance in Lauer, 2013; Nielsen, 2010; or University of Nebraska, 2013 for laying out plots and accounting for field variability.
a. Plots can be small plots or field strips. 2. When documenting that a different rate of nutrients is more appropriate for farm
conditions, a field trial must contain the following: a. At least five (5) nutrient application rates including a zero rate where the nutrient
of concern is not applied or is applied in starter fertilizer at rates not to exceed 20 lb N/acre, 10 lb P2O5/acre, or 10 lb K2O/acre.
i. The total amount of nutrient applied (starter + preplant + sidedress + late season + fertigation) is recorded as the nutrient application rate.
b. Each treatment must be replicated at least three (3) times in the same field. c. Treatments should be randomly placed within each replicate. d. The study should be collected on at least one (1) field each year.
Proc. of the 2016 Wisconsin Crop Management Conference, Vol. 55 111

i. Field conditions should be similar for comparison purposes. This includes at a minimum tillage, previous crop, and fertilizer/manure application history.
e. The study should be conducted a minimum of three (3) years. 3. When comparing two or more practices (e.g., source of N fertilizer) not including rate,
NRCS Agronomy Technical Note No. 6 Adaptive Nutrient Management, September 2011 suggests five (5) replications at a minimum when two practices are compared and four (4) replications at a minimum when three (3) or more practices are compared.
Data analysis
Data must be statistically analyzed before conclusion can be drawn. When evaluating nutrient application rates, use the Crop Nutrient Response Tool (http://nane.ipni.net/article/NANE-3068) developed by the International Plant Nutrition Institute (IPNI) to calculate the economic optimum nutrient rate. For a comparison of practices, analysis on variance (ANOVA) with Fisher’s least significant difference (LSD) is an appropriate statistical analysis. Excel can compute an ANOVA, but not a LSD. Alternatively AgStats (http://pnwsteep.wsu.edu/agstatsweb/) is an online tool that can be used. Data collection and documentation
Data collected for each on-farm trial will vary based on the objective of the trial. This data can include some or all of the following:
1. Yield, moisture, test weight. 2. Routine soil test levels. 3. Preplant profile nitrate test (PPNT), presidedress nitrate test (PSNT), soil nitrate testing at
other times 4. Plant analysis. 5. Manure analysis – required if manure is an objective of the trial.
For all trials document the following site criteria:
1. Year study was conducted. 2. Town and county. 3. Latitude and longitude of field. 4. Soil map unit(s) in the field. 5. Previous crop history for the past 5 years. 6. All nutrients applied for the past five years including source, rate, time, and placement. 7. Hybrid/variety, relative maturity, planting date, seeding rate, row spacing. 8. Tillage and time of tillage. 9. Percentage of surface residue coverage at planting. 10. Is the field tile drained? 11. Is the field irrigated? If so, N content of irrigation water and amount irrigated in season. 12. Weekly precipitation and general commentary about weather with regard to precipitation
and temperature during the growing season. 13. Observations on weed, insect, and disease pressure.
Example on-farm trial protocol
An example of an on-farm N rate trial protocol and data collection spreadsheet can be found at http://www.npketc.info/?page_id=289.
Proc. of the 2016 Wisconsin Crop Management Conference, Vol. 55 112

Summary
Adaptive nutrient management is designed to allow growers to use on-farm data to refine nutrient management strategies that adapt to conditions on their farm. Adaptive nutrient management can provide for additional flexibility on a farm, but it comes with a responsibility to thoroughly document site conditions, develop appropriate replicated on-farm research trials, statistically analyze data, and properly interpret data. Many producers may find that they need the assistance of extension personnel or crop consultants to adequately conduct adaptive nutrient management.
Proc. of the 2016 Wisconsin Crop Management Conference, Vol. 55 113

MANAGING DRY GRAIN IN STORAGE
Scott Sanford 1/ A great deal of resources and effort are invested in growing, harvesting, drying and transporting grain crops. Managing the dry grain in storage is important to protect that investment. The quality of grain cannot be improved during storage but if not properly managed, grain quality can deteriorate quickly. The majority of grain losses are caused by living things such as fungi, mold, insects and rodents. The grain temperature and moisture can provide a haven for living things or aid in preventing problems. There are six main causes of grain storage problems: grain is too warm, grain is too wet, too much foreign matter and fines, uneven grain temperatures in bin, storage bins not cleaned before harvest, and grain not checked often enough during storage. Grain that is too warm and too wet invite molds and insects, the primary reasons for grain deterioration in the U.S. Insects and molds thrive in temperatures above 60°F. Molds are more predominate if grain moisture is too high while insects can survive in dry or moist conditions. Insect damage and mold will often occur in areas of high foreign matter and fines because it is often higher in moisture and broken kernels are easy to access. Too much foreign matter and fines also causes higher resistance to airflow compounding the problem of aerating the grain. Screening all grain before it enters the storage bin and the use of a spreader to evenly distribute the grain and fines in the bin will reduce concentrated areas of fines. If not using a spreader, fines and foreign matter will concentrate under the fill spout. Differences in air temperature within a grain bin can lead to convection patterns within the grain. The grain near the wall of the bin will be cooler while the grain in the center of the bin will be warmer. The warm air will migrate up through the grain in the center of the bin, picking up moisture until it comes in contact with the cold grain on the top where the moisture condenses on the cold grain and the bin roof. The wetted corn will be prone to mold growth and insects as the sun heats the roof and head space as the weather warms in the spring. Crusting of grain is an indication of convection air movement and uneven grain temperatures. It is recommended that the grain temperature be kept within 10 to 15°F of the average outdoor temperatures down to 30-35°F for southern WI, Iowa, Michigan and Northern IL and 25 to 30°F for northern WI, Minnesota and the Dakotas. During the warmer months the grain temperatures should be kept slightly lower than the average temperature. The maximum recommended summer temperature of the grain is 50°F for the upper Midwest. Keep the grain temperatures within 10 to 15°F of the average outdoor temperatures will reduce convection air flow in the grain. Bins that were not cleaned out from the previous year are more likely to have insect infestations from adult insects, larvae and eggs that are harbored in the old grain. Cleaning bins is effective for insect control but has little effect on molds. The best strategy mold control is to prevent mold spores from germinating by keeping the grain cool, clean and dry. Trapping insects to determine infestation level should be done for grain that is stored during warm weather. Sticky traps, probe traps and pitfall traps are useful in determining infestation levels. Check with buyers of grain before applying any insecticides to ensure you are not jeopardizing your market. ____________________________ 1/ Distinguished Outreach Specialist, Biological Systems Engineering, Univ.of Wisconsin-Madison, 460 Henry Mall, Madison, WI 53706.
Proc. of the 2016 Wisconsin Crop Management Conference, Vol. 55 114

Neglect or irregular visits to grain bins or storage facilities can result in a small problem, which could have been controlled, turning into a large costly problem. It is recommended that grain be checked every one to two weeks in warm weather and every two to four weeks in cold weather. During inspections check that bin hatches are closed and not leaking water, roofs are not damaged, roof vents and fan inlets are not blocked by frost, ice or debris, fans are operable (tripped breakers, burned out motors, damaged bearings or impellers), and controllers are operational. What does the grain smell like - musty or spoiled odor? Hard crust on surface, condensation under the roof, exhaust air temperatures warmer in center than those towards the side walls, these are all indicators of storage problems. Make a log of your observations for future reference. The storage moisture of the grain will depend on how long it is planned to be in storage, the grain crop and the type of storage facility. Typically 15% for corn if it will be marketed by May, 14% if it will be kept into the following summer and 13% if it is stored for more than a year. It may be desirable to reduce the moisture content of crops stored in a temporary storage structure by a percentage point or two to reduce the spoilage risk because of less than ideal conditions. Aeration It is not critical for maintaining grain quality in storage whether the aeration system is a positive or negative pressure system, there are advantages and disadvantages of both. The airflow per bushel is more critical because it affects the time required to change the grain temperature. A bin with 0.10 cfm per bushel airflow rate will require approximately 140 hours (6 days) to change the grain temperature of corn 10 to 15°F while an airflow rate of 0.25 cfm per bushel will require only 56 hours (2-1/3 days), 2.5 times less time. Higher flow rates allow operator to take advantage of short periods of cool weather (nights, cold fronts) during the warmer parts of the harvest season to cool the grain and provides more accurate temperature control. But as airflow rate doubles, the horsepower requirement will increases by a factor of about five and will require larger electrical services. Aeration times will depend on how uniform air flows through the grain; areas of concentrated fines may require 2 to 5 times longer to cool than if grain were clean. Operators often try to avoid aeration during very high or low humidity conditions but this will only have a slight effect on corn at the point were the air enters the bin because temperature of grain changes about 50 times faster than its moisture content changes. It is important to turn off the aeration fans as soon as the grain reaches the target temperature so drying or wetting of the grain is minimized. Temperature sensors The only way to determine if grain cooling is complete is to take temperature measurements of the grain in several locations. This can be accomplished with a grain probe with a thermometer pushed into the grain or by pulling a grain sample and measuring the temperature quickly to determine grain temperature at various locations and depths. Permanently installed vertical temperature cables can also be used. These cables have temperature sensors every 4 to 6 feet along the length to measure grain temperatures. This data is useful if it is recorded regularly and compared to previous readings to detect temperature increase or decreases at sensor locations. Sensors can only accurately measure the grain temperature within a few feet of the sensor so they should be considered an aid but not a substitute for measuring temperatures in other locations. Small temperature increases in one area can be an indication of problems. Controls Fans can be controlled manually, with time clocks, thermostats, microprocessor based controller or computer-based software. Automatic controls can reduce time and energy required to manage stored grain and improve the accuracy. If using a simple thermostatic controller, an hour meter
Proc. of the 2016 Wisconsin Crop Management Conference, Vol. 55 115

should be installed so the number of hours the fans operate is known. Automated controllers do not eliminate the need to visually check the grain. Safety Every year people are injured or killed in association with grain handling and storage. DO NOT ENTER BINS WITH UNLOADING EQUIPMENT OPERATING! Even a low capacity auger can bury a person in seconds. Don’t walk on crusted grain if grain has been removed from bin. A cavity can form under the crust which may collapse when walked on, burying the person. Lock-out controls if entering a bin so unloading equipment can’t be started. Wear respirators when working with moldy grains. Be aware of overhead electrical lines when moving equipment or lifting dump bodies. Monthly Monitoring Checklist
1) Turn on aeration fans a. Is fan operating correctly? Inlet clear, bearing, fuses b. Check Static pressure in plenum
2) Climb up and look inside bin a. Condensation under roof, wet grain near hatches b. Snow cover – run fans until sublimated c. Check for off-odors d. Check grain surface – crusting, mold, wet spots (roof leaks?) e. Measure grain temperatures at several locations and depths
3) Check for signs of insect, mold and rodent activity 4) Record observations in logbook 5) Compare observations with previous records 6) Take any corrective action required
References Reed, Carl, “U.S. Corn – Storage in Tropical Climates”, U.S. Grains Council, Washington D.C., available at www.grains.org/sites/default/files/technical-publications/pdfs/TropClimateStorage-Corn-English.PDF. “On-Farm Stored Grain Management: Storing Grain in Bins”, Chapter 11, Agronomy Guide for Field Crops 2nd ed, Ontario Ministry of Agriculture, Food and Rural Affairs, 2009. Available at http://www.omafra.gov.on.ca/english/crops/pub811/11storing.htm Wilcke, B., K. Hellevang, J. Harner, D. Maier, B. Casady; “Managing Dry Grain in Storage”, AED-20, Midwest Plan Service, Ames, IA, 2004. Available for ordering from www.mwps.org
Proc. of the 2016 Wisconsin Crop Management Conference, Vol. 55 116
MANAGING INSECT PESTS IN STORED GRAIN
Patrick J. Liesch1
Due to its northern location and cooler climate, Wisconsin tends to have fewer problems with stored grain insects than other regions of the country. However, insects present in stored grains still pose a significant threat to grading and salability. Some good news for farmers in Wisconsin is that insect-free grain that is stored properly in clean bins, should remain insect free until the following summer, if not longer. The practices listed below can help prevent insect infestations: 1. Prior to storage, thoroughly clean storage bins and transport/handling equipment 2. Maintain functional storage bins (properly sealed, functioning aeration fans, etc.) 3. Apply preventative insecticide treatments to bin and/or grain if warranted 4. Keep grain as dry and cool as possible 5. Scout to catch infestations early Three distinct groups of pests affect stored grains. Primary feeders attack and feed within whole, intact kernels. They are most problematic in warmer regions and occur infrequently in Wisconsin. Secondary feeders attack grain that had been damaged, as well as fines and milled/processed grain. Fungal feeders do not feed on the grain itself, but rather fungi growing on damp, musty grain. The presence of fungal feeders can often serve as an indicator of high grain moisture. Overall, there are several dozen species of stored product pests that can occur in Wisconsin. Most of these are small reddish-brown beetles or moths from the secondary feeder or fungal feeder groups. Due to their small size, getting specimens properly identified can be difficult. Working with your local Extension agent (www.uwex.edu/ces/cty/) or the UW-Madison Insect Diagnostic Lab (labs.russell.wisc.edu/insectlab/) can help determine the identity of the insects. This is a critical step as the management can differ depending on the type of insects present. The resources listed below offer additional information and guidance on stored grain pest management: For information on registered insecticide treatments for use on stored grain in Wisconsin: Pest Management in Wisconsin Field Crops (UW-Extension Publication A3646) learningstore.uwex.edu/Pest-Management-in-Wisconsin-Field-Crops2016-P155.aspx For a general review of stored product pest management: Stored Grain Insect Pest Management Factsheet (Purdue University Factsheet E-66-W): extension.entm.purdue.edu/publications/E-66.pdf For an in-depth look at a variety of topics pertaining to grain storage: Stored Product Protection by Hagstrum, Phillips, and Cuperus (Book; downloadable as free pdf) www.bookstore.ksre.ksu.edu/pubs/S156.pdf Stored grain IPM in the North central United States (4-part Webinar, ~120 minutes) Part 1: www.youtube.com/watch?v=aNzuqqMylSg Part 2: www.youtube.com/watch?v=m4szhiHz_yQ Part 3: www.youtube.com/watch?v=P-KGmaNLZX0 Part 4: www.youtube.com/watch?v=WZ1szxO7OZc _____________________________
1Insect Diagnostic Lab, UW-Madison Dept. Entomology, 1630 Linden Drive, Madison, WI 53706
Proc. of the 2016 Wisconsin Crop Management Conference, Vol. 55 117
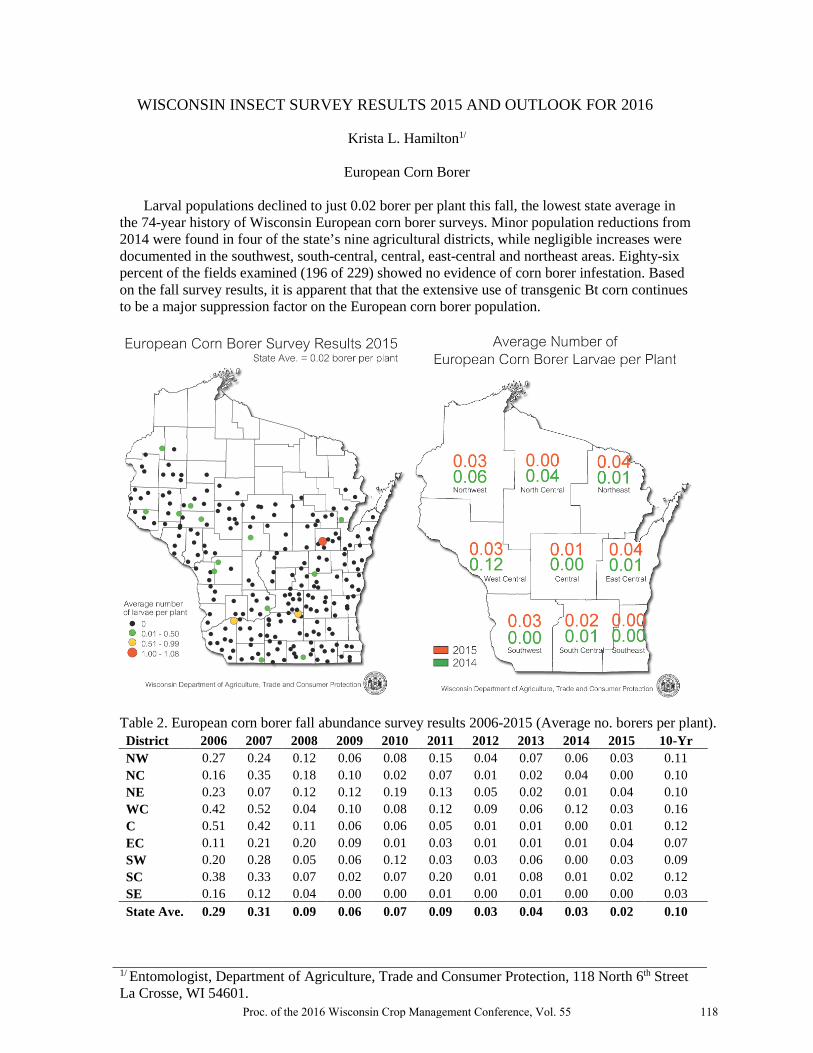
WISCONSIN INSECT SURVEY RESULTS 2015 AND OUTLOOK FOR 2016
Krista L. Hamilton1/
European Corn Borer
Larval populations declined to just 0.02 borer per plant this fall, the lowest state average in the 74-year history of Wisconsin European corn borer surveys. Minor population reductions from 2014 were found in four of the state’s nine agricultural districts, while negligible increases were documented in the southwest, south-central, central, east-central and northeast areas. Eighty-six percent of the fields examined (196 of 229) showed no evidence of corn borer infestation. Based on the fall survey results, it is apparent that that the extensive use of transgenic Bt corn continues to be a major suppression factor on the European corn borer population.
Table 2. European corn borer fall abundance survey results 2006-2015 (Average no. borers per plant). District 2006 2007 2008 2009 2010 2011 2012 2013 2014 2015 10-Yr NW 0.27 0.24 0.12 0.06 0.08 0.15 0.04 0.07 0.06 0.03 0.11 NC 0.16 0.35 0.18 0.10 0.02 0.07 0.01 0.02 0.04 0.00 0.10 NE 0.23 0.07 0.12 0.12 0.19 0.13 0.05 0.02 0.01 0.04 0.10 WC 0.42 0.52 0.04 0.10 0.08 0.12 0.09 0.06 0.12 0.03 0.16 C 0.51 0.42 0.11 0.06 0.06 0.05 0.01 0.01 0.00 0.01 0.12 EC 0.11 0.21 0.20 0.09 0.01 0.03 0.01 0.01 0.01 0.04 0.07 SW 0.20 0.28 0.05 0.06 0.12 0.03 0.03 0.06 0.00 0.03 0.09 SC 0.38 0.33 0.07 0.02 0.07 0.20 0.01 0.08 0.01 0.02 0.12 SE 0.16 0.12 0.04 0.00 0.00 0.01 0.00 0.01 0.00 0.00 0.03 State Ave. 0.29 0.31 0.09 0.06 0.07 0.09 0.03 0.04 0.03 0.02 0.10
1/ Entomologist, Department of Agriculture, Trade and Consumer Protection, 118 North 6th Street La Crosse, WI 54601.
Proc. of the 2016 Wisconsin Crop Management Conference, Vol. 55 118

Corn Rootworm
Beetle counts increased from 2014 across the eastern half of the state and decreased in west-ern Wisconsin in 2015, a striking reversal from last year’s survey trend. The August beetle survey found substantial population increases from 0.3 to 0.8 beetles per plant in the south-central and east-central crop districts and low to moderate increases in the southeast, central, north-central and northeast areas. District averages in the west-central and northwest were low at less than 0.3 beetles per plant, while counts in the southwest decreased but remained above the 0.75 beetle-per-plant threshold considered to indicate root damage potential for next summer. The 2015 state average count of 0.6 beetles per plant compares to 0.4 per plant in 2014.
Although the overall Wisconsin corn rootworm population increased this season, counts of
the western corn rootworm beetle were down considerably. The survey found a total of 1,372 beetles on 2,290 plants, only 324 (24%) of which were the western species. The overwhelming majority (1,048 specimens or 76%) of beetles observed were the northern corn rootworm species. One individual was the southern corn rootworm. The significant use of pyramided Bt-rootworm hybrids or the combination of soil insecticides with Bt-traited seed are both possible contributing factors to the low western corn rootworm counts noted in August.
Results of the survey suggest a greater threat of larval rootworm damage to non-Bt continu-
ous corn in 2016, with the highest risk in the southwest, south-central and east-central districts where economic averages of 0.8 beetles per plant were recorded.
Proc. of the 2016 Wisconsin Crop Management Conference, Vol. 55 119
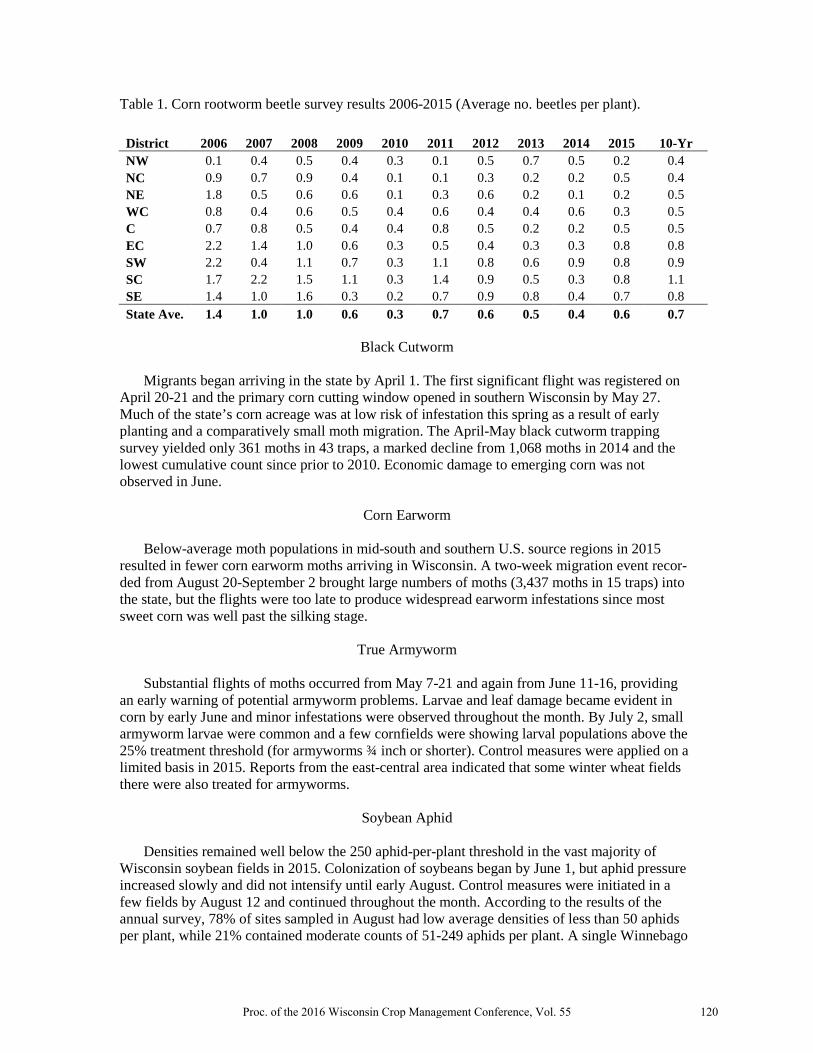
Table 1. Corn rootworm beetle survey results 2006-2015 (Average no. beetles per plant).
District 2006 2007 2008 2009 2010 2011 2012 2013 2014 2015 10-Yr NW 0.1 0.4 0.5 0.4 0.3 0.1 0.5 0.7 0.5 0.2 0.4 NC 0.9 0.7 0.9 0.4 0.1 0.1 0.3 0.2 0.2 0.5 0.4 NE 1.8 0.5 0.6 0.6 0.1 0.3 0.6 0.2 0.1 0.2 0.5 WC 0.8 0.4 0.6 0.5 0.4 0.6 0.4 0.4 0.6 0.3 0.5 C 0.7 0.8 0.5 0.4 0.4 0.8 0.5 0.2 0.2 0.5 0.5 EC 2.2 1.4 1.0 0.6 0.3 0.5 0.4 0.3 0.3 0.8 0.8 SW 2.2 0.4 1.1 0.7 0.3 1.1 0.8 0.6 0.9 0.8 0.9 SC 1.7 2.2 1.5 1.1 0.3 1.4 0.9 0.5 0.3 0.8 1.1 SE 1.4 1.0 1.6 0.3 0.2 0.7 0.9 0.8 0.4 0.7 0.8 State Ave. 1.4 1.0 1.0 0.6 0.3 0.7 0.6 0.5 0.4 0.6 0.7
Black Cutworm
Migrants began arriving in the state by April 1. The first significant flight was registered on
April 20-21 and the primary corn cutting window opened in southern Wisconsin by May 27. Much of the state’s corn acreage was at low risk of infestation this spring as a result of early planting and a comparatively small moth migration. The April-May black cutworm trapping survey yielded only 361 moths in 43 traps, a marked decline from 1,068 moths in 2014 and the lowest cumulative count since prior to 2010. Economic damage to emerging corn was not observed in June.
Corn Earworm
Below-average moth populations in mid-south and southern U.S. source regions in 2015 resulted in fewer corn earworm moths arriving in Wisconsin. A two-week migration event recor-ded from August 20-September 2 brought large numbers of moths (3,437 moths in 15 traps) into the state, but the flights were too late to produce widespread earworm infestations since most sweet corn was well past the silking stage.
True Armyworm
Substantial flights of moths occurred from May 7-21 and again from June 11-16, providing an early warning of potential armyworm problems. Larvae and leaf damage became evident in corn by early June and minor infestations were observed throughout the month. By July 2, small armyworm larvae were common and a few cornfields were showing larval populations above the 25% treatment threshold (for armyworms ¾ inch or shorter). Control measures were applied on a limited basis in 2015. Reports from the east-central area indicated that some winter wheat fields there were also treated for armyworms.
Soybean Aphid Densities remained well below the 250 aphid-per-plant threshold in the vast majority of Wisconsin soybean fields in 2015. Colonization of soybeans began by June 1, but aphid pressure increased slowly and did not intensify until early August. Control measures were initiated in a few fields by August 12 and continued throughout the month. According to the results of the annual survey, 78% of sites sampled in August had low average densities of less than 50 aphids per plant, while 21% contained moderate counts of 51-249 aphids per plant. A single Winnebago
Proc. of the 2016 Wisconsin Crop Management Conference, Vol. 55 120

County field sampled on August 24 had an economic population of 313 aphids per plant. The low state average aphid count of 35 per plant at 108 sites surveyed from August 6-26 indicates that most soybeans did not require treatment for aphids this year.
Western Bean Cutworm
On the basis of pheromone trap counts, the annual moth flight peaked one week later and was 24% larger than that of 2014. The 2015 cumulative capture of 644 moths in 96 traps (seven per trap) was an increase from the 521 moths in 108 traps collected last year (five per trap), but still extremely low in comparison to the survey record of 10,807 moths in 136 traps (79 per trap) set in 2010. Larval infestations resulting from the flight were light for the sixth consecutive year, and the western bean cutworm was not a major pest of concern for most Wisconsin corn producers this season. Trapping surveys from 2005-2015 show that moth counts have been decreasing since 2010.
Proc. of the 2016 Wisconsin Crop Management Conference, Vol. 55 121

CORN ROOTWORM RESISTANCE MANAGEMENT
Bryan Jensen 1
Introduction Corn rootworms (CRW) are a key insect pest and a potential economic risk to corn production in Wisconsin. Detection of field-evolved resistance of the western corn rootworm to certain plant incorporated Bt proteins (GMO hybrids) has recently focused attention on using an Integrated Pest Management (IPM) approach to reduce the potential for resistance and unexpected damage. Managing this risk will require use of field data (beetle scouting and root evaluations) so that a prescriptive management plans can be developed that reduces the reliance on a single management tactic.
Field Monitoring Beetle Scouting Corn rootworm populations vary from year to year and field to field. Obtaining a relative assessment of the damage potential in continuous corn is an important first step towards prescriptive management. To determine the potential for damage in next year’s corn, Scout continuous corn acreage at weekly intervals during the egg-laying period (early August to early-September). Count the number of beetles on 5 nonconsecutive plants in 10 random areas of a field. First, grasp the ear tip tightly enclosing the silks in the palm of your hand and count beetles on all other areas of the plant. The silks often have the most beetles on the plant, so a tight hold on the ear tip keeps beetles from dropping out. Pull leaves away from the stalk to examine leaf axils and expose hiding beetles. Once the entire plant is examined, open your hand slowly and count the beetles that come out of the silks as you separate the husk and silk from the ear tip. Record the total number of beetles and divide by the number of plants counted (50). Field averages greater than 0.75 beetles/plant can be expected to have significant egg-laying that would justify larval management the follow year. In areas of southeastern Wisconsin, western corn rootworm females have adapted to a corn/soybean rotation and may lay eggs in soybeans. This can cause significant economic damage to the first year corn that follows soybean. To avoid unnecessary insecticide applications in first year corn, it is important to monitor western corn rootworm beetle populations in soybean. Use Pherocon AM yellow sticky traps (unbaited) to predict damage potential in first year corn. These traps are a visual attractant; no lure is needed. Evenly distribute 12 traps/soybean field beginning at early oviposition. Traps should be placed a minimum of 100 feet from the field edge and approximately 100 paces between traps depending on field size. Place traps on a stake above the soybean canopy. Count beetles and replace traps (if needed) on a weekly schedule. Trapping can conclude the first full week in September when egg laying is complete. 1 Bryan Jensen, UW-Cooperative Extension Service and Integrated Pest Management Program. Department of Entomology, 1630 Linden Dr., Madison, WI 53706.
Proc. of the 2016 Wisconsin Crop Management Conference, Vol. 55 122
A preventive control practice (crop rotation, insecticide or transgenic corn rootworm hybrid) should be used if a field average of greater than 5 western corn rootworm beetles are caught/trap/day. For example, if you counted a total of 1680 western corn rootworm beetles in twelve traps over a 28 day period this would equal an average of 5 beetles/trap/day {1680 divided by 12(#traps/field) divided by 28 (# days you trapped) = 5}. Research conducted by entomologists at the University of Illinois, suggest an average of 5 beetles/trap/day would likely result in a corn root rating of 0.25 on the Iowa State node-injury scale. An average of 10 beetles/trap/day would result in a root rating of 1.00. However, root feeding damage by corn rootworms can be difficult to interpret into yield loss. Root Evaluations Verify accuracy of management decision, effectiveness of Bt hybrids and presence of first year rootworm by scouting for root injury in mid to late July after the majority of larval feeding is complete. Corn rootworm larval damage is cryptic, easily overlooked and/or misidentified. Corn does not have to be lodged to suffer economic injury. Conversely, just because corn is lodged does not mean the damage was caused by rootworm feeding. Dig several roots from each field. Wash each root with a power washer and observe the root for injury. Regardless of the management practice used, some injury is possible and light feeding is economically acceptable. To determine extent of the damage, rate each root using the 0-3 Nodal Injury Scale developed by research entomologists at Iowa State University. This rating system is based on a decimal system. The number to the left of the decimal indicates the number (or equivalent number) of root nodes pruned back to within 1 ½ inch of the corn stalk. The number to the right of the decimal indicates percentage of the next node of roots pruned to within 1 ½ inch of the stalk. For example, a root rating of 1.20 indicates the equivalent of one complete node of roots is pruned and 20% of the next node of roots. If the field average is lower than 0.50 it can be assumed there isn’t enough rootworm feeding to cause economic loss. If the field average is greater than 0.75 one should assume that there was enough root feeding to cause economic yield loss over and above the cost of a control practice. For averages between 0.50 and 0.75 economic loss may depend on other plant stresses that include, fertility, disease, compaction, environment, etc.
Management Options Crop Rotation Crop rotation continues to be a viable management alternative for corn rootworms in the majority of the state’s corn growing regions. However, in the southern and southeast portion of Wisconsin, western corn rootworm beetles have adapted to a corn/soybean rotation by laying eggs in soybean fields. For fields in this area of Wisconsin, use the yellow sticky trap method to determine damage potential in corn planted after soybean.
Proc. of the 2016 Wisconsin Crop Management Conference, Vol. 55 123

In states other than Wisconsin, Northern corn rootworms have adjusted to a corn/soybean rotation through adoption of a two year life cycle called “extended diapause”. This phenomenon requires two winter chilling periods before eggs hatch. Extended diapause is not known to be present in Wisconsin but occasional monitoring of first year corn is suggested for early detection.
Seed Treatments Seed treatments containing clothianidin and thiamethoxam are two active ingredients which can give limited rootworm control. These products are applied commercially and available in either a high or low rate. The higher rate is labeled for corn rootworm larval control. Efficacy of these products can be questionable when rootworm populations are high. Therefore, field scouting for rootworm beetles is very important to determine if seed treatments will be an effective management option. At-plant, Soil Applied Insecticides Several liquid and granular soil applied insecticides can be used to control rootworm larvae at planting time. Calibration of both formulations is important for effective control. Settings on the insecticide labels should only be used as a starting point for granular applicators. Rates for granular insecticides are typically expressed in amount of product/1000 row feet. However, there can be use restrictions (pounds of product/a) on row spacing narrow than 30 inches. Reading and following label restrictions is also important because some products have specific use constraints that include set back restrictions and/or buffer strips near aquatic habitat. Transgenic Bt Hybrids As previously mentioned, western corn rootworms have developed resistance to the Bt-hybrids in several Midwestern states. The development of resistance was quicker than expected and likely a result of several factors including; expression of the Bt toxin at a low to moderate dose within the corn plant, repeated use of similar Bt-toxins and resistance was not a recessive trait.
Resistance Management To delay the development of Bt-resistance in rootworm populations it is important to use several IPM techniques including beetle scouting, root evaluation and multiple control tactics. Data gained from beetle scouting can be used to develop a tiered and prescriptive approve to rootworm management. Crop rotation should always be considered a management option unless rotation resistant western corn rootworms are expected to cause damage. If crop rotation is not an option, consider using a traited hybrid on fields with the highest beetle numbers and soil applied insecticide and seed treatment on fields with lower beetle counts. Currently there are four Bt proteins labeled for use. They are Cry 3Bb1, mCry3a, eCry3.1Ab and Cry34/35Ab1. Effective use of these proteins will help manage resistance. Do not use the same Bt protein more than 2 years on the same field. Annual rotation is preferred. Pyramid CRW proteins is a preferred practice as long as you know both proteins are effective. A history of root evaluation will help to determine effectiveness. Remember, some root feeding is acceptable and not considered a sign of resistance. Resistance can be expected if the same Bt protein has been used an a field for 2 or more years and an average field root rating is greater 1.0. Similarly, resistance to a pyramid can be expected if the same pyramid traits have been used on that same field for 2 or more years and a field average root rating is greater than 0.50.
Proc. of the 2016 Wisconsin Crop Management Conference, Vol. 55 124

ECB 101: MANAGING ECB IN THE ABSENCE OF TRAITS
Bryan Jensen 1/
Introduction
European corn borer (ECB) is a pest of several crops including field, sweet and popcorn. Once considered a key pest of field corn, populations of ECB have declined since the widespread adoption of commercial corn hybrids that express above ground traits. However, in recent years populations of ECB have increased. Likely because of growers using more conventional corn hybrids and because of several other non-traited host crops being planted.
Identification
ECB eggs are small, white, laid in clusters of 15-20 or more eggs per mass. Eggs are overlapped like fish scales. As eggs mature they become cream-colored and prior to hatching the black head of the larvae are visible. There are 5 larval instars. Mature grown larvae will be ¾ to 1 inch long and greyish to cream colored with numerous dark spots covering the body. Adults moths have a wing span of up to 1 inch. Males are slightly smaller and darker in coloration than females.
Life Cycle
Depending on location within the state of Wisconsin, there is either one or two generation of ECB/year. ECB overwinter as 5th instar larvae with the stem/stalk of its host. Pupation occurs in May and the first moth will emerge at approximately 375 degree days (base 50° F). First eggs are laid at approximately 450 degree days and the peak adult flight is at 600 degree days. When larvae first hatch, they feed on leaves and or the leaf mid rib while migrating to the whorl. Larvae will usually bore into the plant by the 3 instar (3/8 inch). Peak second-generation adult flight period is between 1550-2100 degree days. During growing seasons with unusually high temperatures a partial third generation maybe initiated. However, this generation is unable to complete its life cycle by the time cold weather arrives. Only mature 5th instar larvae are capable of overwintering.
Damage
First generation larvae migrate to the whorl and feed on leaves and mid-ribs prior to boring into the stalk. Symptoms of whorl feeding include small, irregular hole, often call shot-holing. As larvae mature, they may feed across the rolled up leaf creating a transverse pattern of holes prior to boring into the stalk. Newly hatched second generation larvae migrate to leaf sheaths or ear husks to feed. By the third instar, larvae will have bored into the ear, ear shank or stalk and continue their feeding until mature.
Scouting
First generation: After corn reaches 18 inches of extended leaf height, examine 10 consecutive plants in 10 areas of each field and keep tract of the number of plants showing leaf feeding (shot-holing). Pull the whorl leaves from two damaged plants/set and unroll the leaves to count the number of larvae/plant. From this data, calculate % plants infested and ave. number of larvae/infested plant.
1/ Bryan Jensen, UW-Cooperative Extension Service and Integrated Pest Management Program. Department of Entomology, 1630 Linden Dr., Madison, WI 53706.
Proc. of the 2016 Wisconsin Crop Management Conference, Vol. 55 125

Second generation: Scout at weekly intervals during the entire egg laying period. Count the number of egg masses on at least 50 plants/field. The majority of eggs will laid on the undersides of leaves near the ear zone.
Economic Threshold
Use field data as described in the scouting section to determine the 1st generation and 2nd generation threshold using the worksheets below
Proc. of the 2016 Wisconsin Crop Management Conference, Vol. 55 126

U2U-BASED DECISION TOOLS
Chad Hart 1/ Useful to Usable (U2U): Transforming Climate Variability and Change Information for Cereal Crop Producers, is a USDA-funded research and extension project designed to improve the resilience and profitability of U.S. farms in the Corn Belt amid a changing climate. The team of over 50 faculty, staff, and students from nine Midwestern universities are experts in applied climatology, crop modeling, agronomy, cyber-technology, agricultural economics, and other social sciences. We have worked together, and with members of the agricultural community, to develop decision support tools, resource materials, and training methods that lead to more effective decision making and the adoption of climate-resilient practices. The five tools listed below have been developed and are available for public use at http://www.agclimate4u.org. AgClimate View A convenient way to access customized historical climate and crop yield data for the U.S. Corn Belt. View graphs of monthly temperature and precipitation, plot corn and soybean yield trends, and compare climate and yields over the past 30 years. CornGDD Track real-time and historical GDD accumulations, assess spring and fall frost risk, and guide decisions related to planting, harvest, and seed selection. This innovative tool integrates corn development stages with weather and climate data for location-specific decision support tailored specifically to agricultural production. Climate Patterns Viewer Discover how global climate patterns like the El Niño Southern Oscillation (ENSO) and Arctic Oscillation (AO) have historically affected local climate conditions and crop yields across the U.S. Corn Belt. Corn Split N Determine the feasibility and profitability of using post-planting nitrogen application for corn production. This product combines historical data on crop growth and fieldwork conditions with economic considerations to determine best/worst/average scenarios of successfully completing nitrogen applications within a user-specified time period. Probable Fieldwork Days This spreadsheet-based tool uses USDA data on Days Suitable for Fieldwork to determine the probability of completing in-field activities during a user-specified time period. This product is currently available for Illinois, Iowa, Kansas, and Missouri. (Hosted by the University of Missouri). ___________________________
1/ Associate Professor, Department of Economics, Iowa State University, Ames, IA 50011.
Proc. of the 2016 Wisconsin Crop Management Conference, Vol. 55 127

DISCUSSION POINTS FOR POLLINATOR PRESENTATION
Mike Dummer 1/
Industry Perspective
Applicators Perspective
Drift watch
Timing of application
Producer’s Perspective
My own land
On rented land
Beekeepers Perspective
_________________ 1/ Buck Country Grain.
Proc. of the 2016 Wisconsin Crop Management Conference, Vol. 55 128