proceedings of smirt-13-post conference seminar-16 …
TRANSCRIPT

PROCEEDINGS OF SMiRT-13-POST CONFERENCE SEMINAR-16SEISMIC EVALUATION OF EXISTING NUCLEAR FACILITIES
LATUR EARTHQUAKE AND ITS IMPACT ON THE ASEISMIC DESIGNOF STRUCTURES IN INDIA
P.C. BASUAtomic Energy Regulatory Board, INDIA
XA9952647
ABSTRACT : The Latur earthquake occurred on September30, 1995. The epicentre was located near the Killarivillage of Latur District which is situated in thestable continental region of Southern Peninsular India.The earthquake caused a wide range of damage though itsmagnitude (MS) was 6.4. Intensive damage survey wascarried out and a number of geophysical andseismological studies had been undertaken. It was beenconcluded from the results, available so far from thesestudies, that the hypocentre of the earthquake was onthe lineament dipping NW-SE. The rock matrix in thehypocentral region was weakened due to the presence offluid and rupture of this weak region caused the event.The ground motion produced by the earthquake was ofcomplex nature comprising of horizontal and verticalcomponent. The ground acceleration in the epicentralregion was estimated as 0.2 g. Latur earthquake raisedseveral issues with respect to aseismic design ofstructures in India which need further deliberation.These issues are related to seismic zoning of India,determination of design basis ground motion, design/detailing of structures, etc.
INTRODUCTION
Latur Earthquake occurred in the early morning of30th September, 1993. The epicenter of the earthquakeis located in the Latur District of Maharashtra State,India. The epicentral area falls in the SouthernPeninsular India known to be seismically stable. Theevent was preceded by several foreshocks and followed bya number of aftershocks.
Field studies and damage surveys were carried outby a number of organizations following the earthquake.The Latur earthquake would go down in the history as thedeadliest earthquake to strike a stable continentalregion (SCR).
No significant past earthquake incidents are knownin the region surrounding Latur and as such noearthquake instruments were installed in this areabefore this earthquake. However, a number ofgeological, geophysical as well as seismological studieshave been undertaken in the earthquake affected regionsfollowing the event. All these studies are yet to be
55

completed but results from some of these studies, havebeen published.
The purpose of present paper is two fold.Firstly, to present an account of the event of Laturearthquake on the basis of data/information collectedfrom the published literature and theinterview/discussion with people. Secondly, todeliberate on the impact of this event with respect tothe practice followed in India for aseisxnic design ofthe structures.
THE EVENT OF LATUR EARTHQUAKE
Main Shock [l TO 6] *
Origin time : 22:25:53 GMT, September 29, 1993.00:03:53 1ST, September 30, 1993
Epicentral : 18.07°N, 76.62°Elocation Near Killari Village of Latur
District of Maharashtra State inIndia.
Hypocentral : < 10 Km (5-10 km)Depth
Magnitude : Body wave (Mb) = 6.3Surface wave (Ms) = 6.4Richter (Mw) = 6.1
Duration : 30 to 40 seconds
Seismic Moment : In order of 10 dyne.cm.(This is about 20% of annualseismic energy released by stablecontinental region earthquake)
(Different values for the above parameters have beenpublished in different literatures)
Epicentral Track [5, 14]
The topology of the affected area is mildlyundulated. The bed rock is covered by black cotton soilmantle having average thickness of 300 mm. There arenumber of flat topped mounds. The rivers Terana, Manjraand Bhema flow through the affected area. The villageKillari which is nearest to the epicentre is near totributary of river Terana . Fig.2 depicts theepicentral track of the earthquake.
* Note: Numerical value inside the square bracketindicates reference number.
56

Foreshocks [1, 6, 7]
A number of foreshocks during October-November,1992 were reported. An earthquake of magnitude 4.0occurred on 18th October, 1992 in the vicinity ofKillari causing minor damages. There were about 25 feltearthquakes in the following week. On November 1 and 2,1992, four (4) earthquakes of magnitude 2.2 to 3.8occurred. Felt tremors were also reported in 1962,1967, 1983 and 1984.
aftershocks [6, 7]
The main shock was followed by 187 (one hundredand eighty seven) aftershocks, largest being magnitude4.4 occurred on 30the September, 1993. The aftershockactivities decreased rapidly but a shock exceedingmagnitude 4.0 occurred on November 12, 1993. Theaftershock zone is clustered near the point ofconfluence of the two tributaries of the Terana riversouth of Killari village (see Fig. 1). A detail accountof the foreshocks and aftershocks are given inreference - 7.
Probable cause of earthquake [3,6,7,8,9,10]
Indian plate is moving north word direction [9].Cluster of earthquakes have been observed due to thismovement along the main thrust zone below the Himalayanmountain range on the boundary of this plate. PeninsularIndia is a stable continental region on the Indian platewithin which the epicentral area of Latur earthquakefalls. The region comprising of the Deccan volcanicprovince (DVP) and a craton. Eight (8) majorearthquakes occurred in the stable continental region ofIndia. Fig.l shows the tectonic map of this stablecontinental region and the locations of these eightearthquakes. However, no major earthquake event wasrecorded in the epicentral region of Latur during thehistorical past.
A number of geological, geophysical,seismological studies were started following theearthquake [11]. In some literatures [1&2], questionwas raised whether the Latur earthquake was induced byreservoir, because of the presence of Terana river inthe epicentral track. Rastogi examined this aspectsfrom various considerations and concluded that the Laturearthquake is not a reservoir triggered one [12].Chetty and Rao studied the lineament pattern of Latur -Osmanabad area [13] and summarised that the area isconfluenced by the lineament system as shown in Fig. 3.The results so far obtained from the geophysical studiesindicate the presence of fluid in the hypocentral region[10]. It has also been revealed from these
57
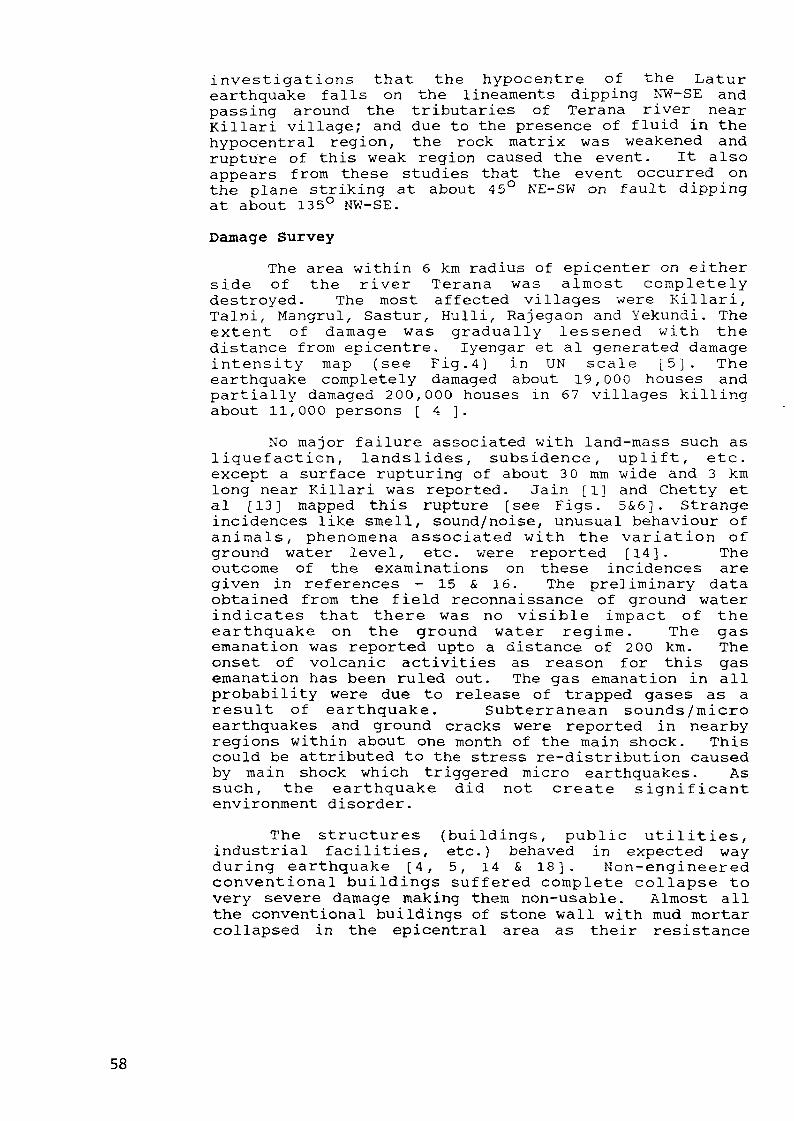
investigations that the hypocentre of the Laturearthquake falls on the lineaments dipping NW-SE andpassing around the tributaries of Terana river nearKillari village; and due to the presence of fluid in thehypocentral region, the rock matrix was weakened andrupture of this weak region caused the event. It alsoappears from these studies that the event occurred onthe plane striking at about 45° NE-SW on fault dippingat about 13 5° NW-SE.
Damage Survey
The area within 6 km radius of epicenter on eitherside of the river Terana was almost completelydestroyed. The most affected villages were Killari,Talni, Mangrul, Sastur, Hulli, Rajegaon and Yekundi. Theextent of damage was gradually lessened with thedistance from epicentre. Iyengar et al generated damageintensity map (see Fig.4) in UN scale [5]. Theearthquake completely damaged about 19,000 houses andpartially damaged 200,000 houses in 67 villages killingabout 11,000 persons [ 4 ].
No major failure associated with land-mass such asliquefaction, landslides, subsidence, uplift, etc.except a surface rupturing of about 3 0 mm wide and 3 kmlong near Killari was reported. Jain [1] and Chetty etal [13] mapped this rupture [see Figs. 5&6]. Strangeincidences like smell, sound/noise, unusual behaviour ofanimals, phenomena associated with the variation ofground water level, etc. were reported [14]. Theoutcome of the examinations on these incidences aregiven in references - 15 & 16. The preliminary dataobtained from the field reconnaissance of ground waterindicates that there was no visible impact of theearthquake on the ground water regime. The gasemanation was reported upto a distance of 2 00 km. Theonset of volcanic activities as reason for this gasemanation has been ruled out. The gas emanation in allprobability were due to release of trapped gases as aresult of earthquake. Subterranean sounds/microearthquakes and ground cracks were reported in nearbyregions within about one month of the main shock. Thiscould be attributed to the stress re-distribution causedby main shock which triggered micro earthquakes. Assuch, the earthquake did not create significantenvironment disorder.
The structures (buildings, public utilities,industrial facilities, etc.) behaved in expected wayduring earthquake [4, 5, 14 & 18]. Non-engineeredconventional buildings suffered complete collapse tovery severe damage making them non-usable. Almost allthe conventional buildings of stone wall with mud mortarcollapsed in the epicentral area as their resistance
58

against lateral force was very little (see Fig.7).Though the stone wall buildings with sand cement mortar(see Fig. 8) or those with wooden frame to support roof(see Fig. 9) responded in a better way than the stonewall with mud mortar but they also became unusable. Theengineered structures responded in expected way andsuffered generally acceptable pattern of damage.Performance of reinforced structures, in general, wasgood except one water tank (see Fig. 10). It wasreported that the reinforcement detailing of this tankmight not be in accordance with the accepted practice.
Iyengar et al observed that the earthquake wasfelt more widely and severely to the South of epicentrethan to the North [5]. They developed the damageintensity map (UN Scale) based on damage survey. Anintensity of VIII has been assigned to the mizoseismicarea. Another interesting feature is that intensity VIIhad also been observed in Unrani and Bhosgak which areat a large distance from the epicentral area (seeFig. 4). This may be due to the local geological and subsurface condition.
Ground Motion
The Latur earthquake was reported to be felt inlarge area, even at a distance of about 800 km from theepicentral region. This is an interesting feature ofan earthquake of magnitude in the range 6.4 and isattributed to two reasons; firstly, the focal depth isshallow and second one is the efficient wave propagationcharacteristics of the rock strata of the shield region.
No strong motion records are available of thisearthquake. Based on field survey, interviews of localresidents, Sinval et al reported that the ground motiongenerated by the earthquake was of complex type [14].The possibility of vertical and torsional componentalongwith the horizontal component, generated by theearthquake, was inferred from the information obtainedfrom the field survey, the pattern of damage anddeformation suffered by the structures, etc. Sliding ofheavy objects were also reported [5,14], Iyengar et alestimated ground acceleration near the epicentral areaas about 0.2g based on the information regardingsliding, tilting and toppling of objects (see Table-1).
IMPACT ON ASEISMIC DESIGN OF STRUCTURES
The Latur earthquake reveals a good deal ofinformation regarding the earthquake potential of thestable continental regions of Peninsular India. Theevent has raised a number of issues related to theaseismic design of structures in India. These arerelated to the seismic zoning of India, method to
59

determine the design basis ground motion (DBGM) anddesign of structures. Some of the present practicerelated to these activities are examined in thefollowing sections vis-a-vis the variousdata/information obtained from the field study and otherinvestigation carried out following the Laturearthquake.
Present Practice of Aseismic Design in India
1. General Buildings/Structures
In India, earthquake resistant design of generalbuildings/structures are carried out as per "IndianStandard, Criteria for Earthquake Resistant Design ofStructures", IS:1893-1984 [17]. In the standard, ithas been endeavored to ensure that, as far as possible,structures are able to respond, without structuraldamage to shocks of moderate intensities and withouttotal collapse to shocks of high intensities. Thestructures, which are designed as per this standard, areexpected to experience more severe ground motion thanthe one envisaged in design during its life time. Inview of this, the standard advocates to adopt theductile design considerations.
The standard divides entire India in five (5)seismic zones based on the probable earthquake intensity(see Fig.11). Table-2 contains the assigned intensityand earthquake potential of these zones. The standardprincipally deals with the horizontal motion in thedetail. However, vertical motion needs to be consideredwhen the stability is main criteria in the design. Thestandard specifies that the seismic coefficient forvertical motion should be 50% of that for horizontalmotion.
As per IS-1893, the horizontal seismic co-efficient (a^) , the design parameter of earthquakeexcitation for which structure is to be designed, isdetermined from the following expression :
ah = 61.a (1)
where, the values of £ depend on soi l foundation systemsand var ies from 1.5 to 1.0, while the range of I(importance factor) is given in IS1893 as 1.0 to 3. Thevalue of ground motion factor, x a ' , varies with seismiczones.
(i) Seismic Coefficient Method
In th i s method, xa ' i s the basic horizontalseismic coefficient (aQ), the values of which fordifferent seismic zones are given in Table-2.
60

(ii) Response Spectrum Method
In this method, the structural response isdetermined by dynamic analysis using response spectrummethod based on modal super position technique- Thestandard provides an average spectra (see Fig. 12) andthe horizontal seismic coefficient is calculated fromequation (1) for which 'a' is given by
a = Fo Sa/g (2)
Where, Fo and 'Sa/g' are the seismic zone factor foraverage spectra (see Table-2) and average spectralordinate (ref. Fig. 15) respectively.
2. Nuclear Power Plants (NPP)
In India, the nuclear safety related structuresare designed presently for site specific DBGM. The DBGMare evaluated for two levels of severity. The severeearthquake level is termed as SI (OBE) and the extremelevel is designated as S2 (SSE) . The DBGM of a givensite is determined following the guidelines laid done in"Safety Guide on Seismic Studies and Design Basis GroundMotion for Nuclear Power Plant Sites", AERB/SG/S11[18].
In general, peak ground acceleration (PGA) of asite is calculated following deterministic approach andconsidering the geological, geophysical andseismological information of the region within 3 00 kmradius from the site. This region is divided into anumber of seismotectonic provinces. The maximumearthquake potential of each fault in a province isevaluated. The maximum earthquake potential of a faultcan be determined either from historical earthquake data(adding one intensity to the estimated/recordedintensity of reported earthquake) or by evaluating themaximum earthquake capability of the fault consideringits tectonic characteristics. However, the peak groundaccelerations of SI and S2 level earthquake inhorizontal direction should not be less than 0.05g and0-lg respectively. Ground acceleration in verticaldirection is desirable to be determined following thesame procedure as used for determination of theacceleration in horizontal direction. In lieu of this,AERB/SG/S-ll also allows to consider the verticalexcitation as 67% of the horizontal excitation.
The design response spectrum is derived from anensemble of acclearograms recorded on similar sites andcovering broad range of source and transmission pathcharacteristics. Design time history is generated fromthis design response spectra ensuring that the timehistory is compatible to it.
61

Seismic zoning
1. General Buildings/Structures
The seismic zone map of IS: 1893 has been developedprimarily on the basis of available strong motionseismic data/information. The seismic zone number of aregion is the representation of tht size of earthquakes(magnitude or intensity) which could occur in thatregion. Potential of earthquake primarily depends onthe strain of rock. The work of Gaur and others [9]indicates that strain is accumulated in the crust ofpeninsular India at a slow rate. For rupture of rock,threshold value of strain is in the order of 10 . Ifthe rate of strain accumulation is in the order of 10to 10~7 (as in the case of Southern part of peninsularIndia; see ref .9) , the return period of a typicalmoderate to higher size earthquake in this region may betaken in the order of 10 to 10 years. Therefore,current potential of earthquake in any area of thisregion depends on the value of accumulated strain tilldate. Again, if there is any weak spot due to thepresence of fluid or due to any other reason in alineament, the rock mass could rupture at lowerthreshold value.
Bureau of Indian Standard (BIS) has taken up aprogramme to revise the seismic zoning map of India. Theseismic zoning map would be revised considering theearthquake potential of different regions in India andtaking into account the geological, geophysical andseismological features of these regions alongwith strongmotion as well as micro earthquake data.
2. Nuclear Power Plants
Incidentally, no Indian NPP or sites of ongoingnuclear power projects are situated within 300 km radiusfrom the epicentral area of Latur earthquake. Since,the site specific DBGM of NPP-Site is determinedconservatively from the maximum earthquake potential ofall causative faults (falling on the area within 300 kmradius from the site) , change in seismic zonation ofIndia will not have any impact in the engineering ofIndian NPP.
Ground Motion
1.0 General Buildings and Structures
It has been inferred from the field survey thatthe ground motion generated by Latur earthquakecontained horizontal, vertical and possibly torsionalcomponent [7, 14]. It may not be possible to infer theexistence of torsional motion just on the basis of
62

deformation/damages of structure, but poss ib i l i ty ofver t ica l motion could be inferred with reasonablecer ta in t ies from these information. IS:1893,principally, deals with horizontal motion in detail andapparently attaches less importance to the ver t i ca lmotion. The information revealed from Latur earthquakeclearly indicates that both of vertical and horizontalmotion should be treated with equal importance inaseismic design.
The range of ground acceleration (horizontal)calculated is 0.023g to 0.006g considering differentvalues of 5 and I for regions falling in seismic zone-l.The ground acceleration in epicentral area of Laturearthquake has been estimated as 0.2g using theinformation collected after the event. Therefore, if astructure is designed for earthquake excitation as perIS1893 in the epicentral area of Latur earthquake, theni t needs to have ducti l i ty factor 8.69 to 33.33(corresponding to PGA 0.023g to 0.006g) to withstand0.2g ground acceleration.
I t is presumed that when a structure is designedand detailed following the codal cri teria of ductiledesign [21] and good engineering practice, the ductili tyfactor of about 5 could be achieved. Demand ofductility factor 8.69 may be acceptable with a viewthat structure could be allowed to suffer certain levelof damage. But demand of ductibility factor 3 3.33 istoo high. I t indicates that there exists possibility ofunderestimation of the design value of seismic effectsby IS1893 in some cases and there is a need to re-examine this respect.
2.0 Nuclear Power Plants
The PGA values are calculated for the areas aroundKil lar i vi l lage from maximum reported magnitude ofearthquake as per AERB/SG/S-11. The maximum magnitudeearthquake occurred before the September 30, 1994 eventwas felt 4.0. For various combinations of epicentraldistance and hypocentral depth, PGA values arecalculated with this information and are found to beless than 0,2g. The maximum value is 0.104g whenepicentral distance of 5 km and hypocentral depth of 5km are considered. For other combination of epicentraldistance and the hypocentral depth, the values are lessthan O.lg. For the epicentral distance and thehypocentral depth both taken upto 10 km, the calculatedPGA values are even less than 0.05 g in some cases. ThePGA values were also calculated for differentcombinations of epicentral distance (upto 2 0 km) andhypocentral depth (20 km) for magnitude upto 7.5. I t isfound in number of cases the PGA value works out to beless than 0. 2g and in a few cases i t is even less than
63

0. lg when magnitude is taken less than or equal to 6.5.In this context, it may be noted, out of eight majorearthquakes occurred in the region of peninsular India,magnitude of seven earthquakes were less than 6.5. Themagnitude of the largest one was 7.79 which occurred in1819 at Kutch region.
The above results indicate that it may not alwaysbe conservative to determine the PGA only on the basisof past earthquake data only, specially, for the sitefalling in a stable continental region.
Design and Detailing of Structure
The principal failure modes of concrete structureswhich are generally addressed in the design of areinforced concrete structure are flexure, shear andbond, while for steel structure they are flexure, shear,buckling. The joints are also very important aspect forsteel structures or pre-fabricated structures forefficient aseismic design. Except flexure, all otherfailure modes are non-ductile for concrete structures.Structural design should eliminate the possibility ofnon-ductile failure modes. For this purpose, ductilityshould be implemented in all design implicitly and whenthis is warranted, explicit implementation should bemade [22].
The behaviour of different engineered brickmasonry buildings and RCC structure with aseismic designfeature during Latur earthquake again confirms thatpresent state of aseismic design of structure canattribute them the capability to withstand the effect ofearthquakes in intended way even if the seismicexcitation is more than the one accounted in the design.
SUMMARY
1. The Latur earthquake occurred in the stablecontinental region of peninsular India comprisingof the Deccan Volcanic Province (DVP) and acraton. According to seismologist, thisearthquake of magnitude above 6.0 in a stablecontinental region associated with craton is arare event.
2. The earthquake had shallow focus and while thedamage area was comparatively small but the feltarea was very large. This is attributed toefficient propagation of seismic wave in theshield region. High number of death toll was dueto the fact that the earthquake occurred in theearly morning hours when people were fast asleep.Moreover, large damage of buildings is alsoresponsible for this. The buildings/structures
64

responded in expected manner. Most of thebuildings in the affected areas were ofconventional type construction and were poor inresisting lateral forces and thus suffered severedamage or collapsed. Appropriately engineeredstructures with earthquake resistant capabilitywithstood the earthquake in intended way.
3. The ground motion produced by the earthquake wasof complex nature comprising of horizontal andvertical component. Presence of torsionalcomponent in the ground motion was also reported.The ground acceleration in the epicentral regionhas been estimated as 0.2g.
4. Following conclusions are drawn from theexamination of some of the aspects of presentmethodology of aseismic design followed in India.
i) The revision of seismic zoning map needs tobe based on the geological, geophysical andseismological information along with thestrong motion as well as micro earthquakedata.
ii) The present" methodology of IS1893 todetermine the design parameters ofearthquake ground motion for aseismic designof structure may underestimate the value ofdesign ground motion parameter which may notbe the intent of IS1893. The method needs tobe re-examined.
iii) Ductility should be implemented in all designimplicitly. When required explicitimplementation of ductility is to be madethrough design methodology.
iv) A minimum level of ductile detailing shouldbe specified for the all buildings/structuresirrespective of their location ofconstruction with respect to seismic zone.
v) Appropriate detailing needs to be adopted, asa first step, to cater for possible torsionalmotion generated by earthquake.
vi) Both the vertical and horizontal excitationneeds to be taken care in the designassigning equal importance to each.
vii) Evaluation of maximum earthquake potential offaults only on the basis of past earthquakedata may not give conservative design basisground motion of a NPP site in a stable
65

continental crust region. The maximumpotential shall also be evaluated consideringthe capability of the fault from geological,geophysical and seismological information/data.
ACKNOWLEDGMENT
Author wishes to express his sincere thanks to Dr.S.K. Guha, Joint Director (Retd.) of CWPRS, Pune, Dr.S.K. Arora, Head, Seismology Section, BARC, Dr. R.D.Sharma, Head, Seismotectonic, NPC and Dr. S.K. Jain ofIIT Kanpur, for providing data and information. Authorhad discussion with a number of persons on Laturearthquake and i t is not possible to quote a l l of theirnames. Their help and co-operation are also thankfullyacknowledged. He is also grateful to Chairman, AERB forallowing him to publish this paper.
REFERENCE
1 . J a i n S . K . , M u r t h y C . V . R . , C h a n d a k N . , J a i n N . K . ," T h e S e p t e m b e r 2 9 , 1 9 9 3 , M 6 . 4 K i l l a r i , M a h a r a s h t r aEarthquake in Central I nd i a " , EERI Specia lEarthquake Report, pp. 1-8 January, 1994.
2. Seeber Leonardo, "Kil lari , The Quake that Shookthe World", New Scientist , 2nd Apri l , 1994, pp.25-29.
3. Arora S.K., "The Killer Earthquake of K i l l a r i " ,Deep Continental Studies in India, Vol.4, No. 2,September, 1994, Sponsored by Department ofScience & Technology, Government of India, pp.2-4.
4. Indra Mohan, Rao M.N., "A Field Study of Latur(India) Earthquake of 30th September, 1993,"Memoir Geological Society of India, No. 35, pp.7-32, Bangalore, India 1994.
5. Iyengar R.N., Manohar C.S. and Jaiswal, "FieldInvestigation of the 30 September Earthquake inMaharashtra", Current Science, Vol. Nos. 10thSeptember, 1994, pp 368 - 379.
6. Gupta H.K., "The Deadly Latur Earthquake", Memoir,Geological Society of India, No. 35, pp. 1-5,Bangalore, India, 1994.
7. Baumbach M. , Grosser H. , SCHMIDT H.G., PAULATA,Rietbrock A., Raraakrishna Rao, C.V., Solomon RajuP . , Sarkar D. , Indra Mohan, "Study of theForeshocks and Aftershocks of the In te rp la te LaturEarthquake of September 30, 1993, India", Memori,Geological Society of India, No. 35, pp. 33-63,Bangalore, India, 1995.
8- Bolt Bruce A, "Earthquakes," WH Freeman andCompany, New York, 1988.
9. Gaur V.K. , "Evaluation of seismic hazard in Indiatowards minimizing earthquake r i s k " , Current
66

Science, Vol.67, No.5, 10th September, 1994, pp.324-329.
10. Gupta H.K., "Latur Earthquake : Some Results ofGeophysical Invest igat ions" , Deep ContinentalStudies in India - Newsletter, Vol .4, No.2,September 1994, sponsored by Department of Science& Technology, Government of India, pp. 4-8.
11. Midha R.K., "Latur Earthquake Some Majorini t ia t ive by DST", Deep Continental Studies inIndia - Newsletter, Vol.4, No. 2, September 1994,sponsored by Department of Science & Technology,Government of India, pp. 8-10.
12. Rastogi BK, "Latur Earthquake: Not Tiggerred",Memoire of Geological Society of India, No. 3J, pp1-5, Bangalore, India.
13. Chetty TRK, Rao MN, "Latur Earthquake of September2 993; Surface Deformation and Lineament Pattern",Geological Society of India, Mcmor 35, Bangalore,India.
14. Sinbhal A, Bose PR, Dubey RN, "Damage Report ofthe Latur-osmanabad Earthquake of September 30,1993.
15. Singh V.S, Subrammanyam, Hodlur GK, Angareyulu,"Report on Hydrological Reconnaissance in someEArthquake affected v i l l a g e s in Latur andosmanabad Districts of Maharashtra", Memoir No.35 of Geological Society of India, pp 131-138,Bangalore, India, 1995.
16. Rastogi BK, Rao MN, "After Effects of LaturEArthquake Smoke/Gas Emanations and sub terraneamSounds/Microearthquakes", Memoir No. 35,Geological Society of India , pp 139-149,Bangalore, India, 1994.
17. BIS, "Indian Standard, C r i t e r i a for EarthquakeResistant Design of S t ruc tures" , IS:1893-1984(Fourth revision) , Bureau of Indian Standard.
18. Sinha R, Goyal A, "Damage to buildings in LaturEarthquake", Current Science, Vol. 67, No.5,10th September, 1994.
19. AERB, "Seismic Studies and Design Basis GroundMotion for Nuclear Power Plant S i t e s , " SafetyGuide No. AERB/SG/S-11, Atomic Energy RegulatoryBoard, India.
20. Guha S.K., Basu P,C, "Catalog of Earthquakes (=>m 3.0) in peninsular India" , AERB TechnicalDocument No. AERB/TD/CES-1, 1995, Atomic EnergyRegulatory Board, India.
21. BIS, "Indian Standard Code of P rac t i ce forEarthquake Resistant Design and Construction ofBuildings", IS 4326, 1976, Bureau of IndianStandard.
22. Basu P.C., "Ductil i ty C r i t e r i a , A Part ofIntegrated Design Approach in Proposed REvision ofIS456: A Deliberation", paper presented in theseminar on Revision of IS 456, September 4-6,1992.
67

TABLE - 1 Field Observations of Overturned/Tilted Object [5]
P l a c e D i s t a n c e
K i l l a r i
( k m )
D i s t r i c ta n d
T a l u k
D e s c r i p t i on H o r i z o n t a la c c e l e r a t ionto i n i t i a t et i l t i n g ( g )
K i l l a r i L a t u rA u s a
R o a d s i d e b o u n d a r y s t o n e n e a r p o s t o f f i c e 0.18R o a d s i d e m a r k i n g s t o n e n e a r m a i n s q u a r e 0.24
K a v a t h a <5 O s m a n a b a d Idol in H a n u m a n t e m p l e on 2m high p l a t f o r m 0.16
U m e r g a S u r y a idol kept on p e d e s t a l in V i s h n u t e m p l e 0.17V i s h n u idol k e p t on g r o u n d 0.14
S a r w a d i 7 L a t u r
N i t a n g a
I d o l i n V i s h n u t e m p l e o n 1 . 5 m h i g h p l a t f o r m 0 . 1 3
S i r u r - G 3 0 G u l b a r g a I d o l i n H a n u m a n t e m p l e o n 1 m h i g h p l a t f o r m 0 . 1 6A l a n d I d o l i n H a n u m a n t e m p l e o n 1 m h i g h p l a t f o r m 0 . 2 4
T h a i r 5 0 O s m a n a b a d I d o l i n L a x m i t e m p l e o n 1 . 5 m h i g h p l a t f o r m 0 . 1
O s m a n a b a d
U m e r g a 25 O s m a n a b a d S t e e l c u p b o a r d in 3 r d flo o r of M S E B q u a r t e r s 0.25Ume rg a
K o h i n o o r 50 B a s a v a k a l y a n S t o n e b l o c k in g r a v e y a r d on 1m hi g h p l a t f o r m 0.12P a h a d B i da r
TABLE-2 Assigned Intensity and Estimated EarthquakePotential of Different Seismic Zone (IS:1893)of India.
Seismiczone
IIIIIIIVV
AssignedIntensity(MM)
VVIVIIVIIIIX
MaximumEarthquakePotential(Magnitude)
5.76.37.07.79.0
Basichorizontalseismiccoeff.
0.010.020.040.050.08
SeismiczoneFo
0.050.100.200.250.40
68

68'
36*N
32'
28'
24'
20*
16'
12'
8'
-
1
<s
72' 76' 80*
1 / - " ~v i
( s> ^
J // 8 •*"' DELHI''* 0 , (
/ • - . ~ / A 3 — , " y' '5 N.
**-*-^ I « « k u 7T——• • • * • /
\ x ; : : ilVwo* AABAD
84* BB'
1 1
0 100'1 . 1 . .
7J^4 ) T ^ ) C A l
/ " / • 76*1
92' 96° E
1
300 500 Kmi 1 . i . 1
r
\
30. - - - - N
TALNI ^KILLARI
1 MC-ZZ? SASTUR^/*^^-'"
\ x {MADRAS:.. t " ^ -BANGALORE* JL
W T 1 / 7
\HG y1 1 \ iT I
72* 76* 80*
Q
- RAJECSAON
. HLTLLI\ TOnAMBA
Km
MUNSAL
-
-
i.
\
\1
i///
36'N
32'
28*
24'
20*
[::::::g MssoioicCainoroic volcanism
Rill Zonos
A-1
A-2
A-3
Plulonic
1
II
III
IV
V
Dharwar tills
Rilled jone ol alkaliplulonilos and carboniles
Aravalli Delhi rill(Ptecambrian)
grabens
Godavan
Mahanadi
Damodar
Narmada
Cambay
Precambrian shear rones
T1
T2
T3
Archean cralonmpbile bellInlerlaca; HG; High Giade Tetrain
Easletn Margin ol Ciddapah Basin
Sukinda Thutsl
Singhbhum shear zones
ID
FIR. 1 Generalized tectonic map oj the Stable continental region ojIndia.The big Mar is the epicenter <>J the Latur earthquake oj September 30, 1993. Open star enclosed in solid circles are previousei^ht largest earthquakes /after Johnston {1993)}: I: 1819, M = 7.79; 2: 1803, M = 6.65; 3: 1956, M = 6.-S3; 4: 1927M = 6.411; 5: 1967, M = 6.3; 6: I93S, M = 6.26; 7: 1918, M = 6.24; 8: 1956, M = 6.05. {
Inset is the mcfiiiseisinal area of Lainr earthquake.
(Ref-10)

TALIII
¥ LAMJAH
r^ i— KILLARIHATTAHGA
TERNA RIVEHAKHIOAM
TAU5ISARII
5ALESA0H
RAJE8AOM
YEXUNOI
- JAWAL6APETH SflUGYI
HULLI
_ UHAROA
fig 2 Loa t ion of j c m r of the worst »((ect<:d v i ) ] a j e 5devastilcd bf the iitur - Osmimbtd < j r t h q t u k c atSeptember JO. 1993. (Hodi(ied l i t r e S u r v - y o ^ J n r f nToposhect 56 B). Inlet jhovj epicenter o f t h eearthquake on map of Indi2.
l'Hj-3 nraiiiii(;e Pjl lcm Around Killari Village and Inferred Subsiirlacc
Harna^c Jntcustty f/»;»|» in UN Scale
70

BENCH UAEIK
tMANY
fSj (10-20CWI
50m LEFT OFFSET 11 . 13cmSCAflP -ISon HIGH
Figure 5 • Portion of the surface rupture associated with the 1993 Killariearthquake. This rupture was mapped discontmously in an east-west zone over adistance of about 7 km. Barbs indicate the uplifted side of the scarps: theapproximate height of the scarps is also indicated. Plus signs indicate upliftedarea, circled when localized. Note that a 'transform" fault connects a south-facing scarp in the center of the map with a north-facing, scarp on the right. This'transform' offsets a field boundary by 53 cm left laterally, which is a minimummeasure of the Shortening. The strike of this and other "transforms' in this mapis north-northeast, the inferred direction of shortening.
(Ref-1)
Fig-6 Views Showing Fault Scrap
(Courtesy Dr. 5.K. Jain, JIT, Kanpur, India)
71

7TTV77VV7vv77-rr7
3 0 - 5 0 Cm TMICX.TUFF ON ROOF(Grey Soil)
POINTINGWITH SOIL (Grey)Lime/Cement
OUTER WALL
WALLO-5-2m Thick
UNDRESSEDSTONES(Bosalfs)
Fig-7 Typical Detail of Conventional Buildings with Stone Wall
Fig- g Damage of Conventional Stone Wall Building(Courtesy : Dr. S-K. Jain, IIT, Kanpur, India)
72

Fig-9 Damage of Building with Wooden Frame(Courtesy : Dr. 5-K. Jiiin, NT, KU/I[«JI, India)
Fig-10 Views Showing Failure of RCC Circular Water Tank(Courtesy : Dr. S-K. Jain, IIT, Kan pur, India)
73

,1
i^- II Ilartliquake Zoning Map of India(ReJ. IS 1893)
- 07
uiao
zo OS
<U)
c| 0 1 - 1 -
F1 /
• -
i
—>
• —
-
-
-
-
—
-
\
-
—
1;
-
-
\
z
\ 1 i /i
i V
-
-
f
--
77
>
2
x
-
/-
<̂
/"
- - - -
. . .
T
—i
G V. DAMPING
-? v.• S y .
- -i
- -
i
" • — ,
-r
I
i
--
11
—
-
-
11
1
Ji ;
[ rlr i
-
-
i i
'
--
-
i 1 i
-
-
-
-
rri'fr
-
-
-
-
-
-
-
-
-
-
—
--
--
-
-
-
-
Ill;
——
,LJ_
L.
—( H 0 8 12 I S 10 1 L 2 8
HAtURAL PERIOD OF v i U R A t i O N (t( 5 E C 0 K 0 S
74 l T i j ; -12 Average Rcsfwnsc Spec t ra (IS 1893)