proc. of the 14th python in science conf. (scipy 2015) 31...
TRANSCRIPT
PROC. OF THE 14th PYTHON IN SCIENCE CONF. (SCIPY 2015) 31
Scientific Data Analysis and Visualization with Python,VTK, and ParaView
Cory Quammen‡∗
https://www.youtube.com/watch?v=8ugmkKaYKxM
F
Abstract—VTK and ParaView are leading software packages for data analysisand visualization. Since their early years, Python has played an important rolein each package. In many use cases, VTK and ParaView serve as modulesused by Python applications. In other use cases, Python modules are used togenerate visualization components within VTK. In this paper, we provide anoverview of Python integration in VTK and ParaView and give some concreteexamples of usage. We also provide a roadmap for additional Python integrationin VTK and ParaView in the future.
Index Terms—data analysis, scientific visualization, VTK, ParaView
Introduction
The Visualization Toolkit (VTK) is an open-source, freely avail-able software system for 3D visualization. It consists of a set ofC++ class libraries and bindings for Python and several otherlanguages. VTK supports a wide variety of visualization algo-rithms for 2D and 3D scalar, vector, tensor, and volumetric data,as well as advanced algorithms such as implicit modeling, polygonreduction, mesh smoothing, cutting, contouring, and Delaunaytriangulation. VTK has an extensive information visualizationframework and a suite of 3D interaction widgets. The toolkit sup-ports parallel processing and integrates with various GUI toolkitssuch as Qt. Python bindings expose nearly all VTK classes andfunctions, making it possible to write full VTK-based applicationsexclusively in Python. VTK also includes interfaces to popularPython packages such as NumPy and matplotlib. Support forwriting custom VTK algorithms in Python is also available.
ParaView is a scalable visualization tool based on VTK thatruns on a variety of platforms ranging from PCs to some ofthe largest supercomputers in the world. The ParaView packageconsists of a suite of executables for generating data visualizationsusing the techniques available in VTK. ParaView executablesinterface with Python in a number of ways: data sources, filters,and plots can be defined via Python code, data can be queriedwith Python expressions, and several executables can be controlledinteractively with Python commands. Batch processing via Pythonscripts that are written either by hand or generated as a trace ofevents during an interactive visualization session is available foroffline visualization generation.
* Corresponding author: [email protected]‡ Kitware, Inc.
Copyright © 2015 Cory Quammen. This is an open-access article distributedunder the terms of the Creative Commons Attribution License, which permitsunrestricted use, distribution, and reproduction in any medium, provided theoriginal author and source are credited.
This paper is organized into two main sections. In the firstsection, I introduce basic VTK usage, describe the relationshipbetween VTK and Python, and describe interfaces between thetwo. In the second section, I detail the relationship betweenParaView and Python. Examples of Python usage in VTK 6.2 andParaView 4.3 are provided throughout. I also provide a roadmapfor additional Python support in VTK and ParaView.
Python and VTK
VTK Data Model
To understand Python usage in VTK, it is important to understandthe VTK data and processing models. At the most basic level, datain VTK is stored in a data object. Different types of data objectsare available including graphs, trees, and data sets representingspatially embedded data from sensors or simulations such as uni-form rectilinear grids, structured/unstructured grids, and AdaptiveMesh Refinement (AMR) data sets. This paper focuses on spatiallyembedded data sets.
Each spatially embedded data set consists of cells, each ofwhich defines a geometric entity that defines a volume of space,and points that are used to define the vertices of the cells.Data values that represent a quantity, e.g. pressure, temperature,velocity, may be associated with both cells and points. Eachquantity might be a scalar, vector, tensor, or string value. Vectorsand tensors typically have more than one numerical component,and the quantity as a whole is known as a tuple.
The full collection of a quantity associated with points or cellsis known by a number of names including "attribute", "field","variable", and "array". VTK stores each attribute in a separatedata array. For a point-associated array (point array), the numberof tuples is expected to match the number of points. Likewise, forcell-associated arrays (cell array) the number of tuples is expectedto match the number of cells.
VTK Pipeline
Data processing in VTK follows the data-flow paradigm. In thisparadigm, data flows through a sequence of processing algorithms.These algorithms are chained together in a pipeline. At thebeginning of a pipeline, a source generates a VTK data set. Forexample, an STL file reader source reads an STL file and producesa polygonal VTK data set as an output. A filter can be connected tothe file reader to process the raw data from the file. For example, asmoothing filter may be used to smooth the polygonal data read bythe STL reader. The output of the smoothing filter can be further

32 PROC. OF THE 14th PYTHON IN SCIENCE CONF. (SCIPY 2015)
processed with a clipping filter to cut away part of the smootheddata set. Results from this operation can then be saved to a filewith a file writer.
An algorithm in a pipeline produces one or more VTK datasets that are passed to the next algorithm in the pipeline. Algo-rithms need only update when one of their properties changes(e.g., smoothing amount) or when the algorithm upstream of it hasproduced a new data set. These updates are handled automaticallyby an internal VTK pipeline executive whenever an algorithm isupdated.
Because VTK is intended to produce 3D interactive visualiza-tions, output from the final algorithm in a pipeline is typicallyconnected to a mapper object. A mapper is responsible forconverting a data set into a set of rendering instructions. An actorrepresents the mapper in a scene, and has some properties thatcan modify the appearance of a rendered data set. One or moreactors can be added to a renderer which executes the renderinginstructions to generate an image.
Python Language Bindings for VTK
Since 1997, VTK has provided language bindings for Python.Over the years, Python has become increasingly important toVTK, both as a route to using VTK, as well as to the developmentof VTK itself.
The Python binding support in VTK has evolved so that todaynearly every semantic feature of C++ used by VTK has a directsemantic analog in Python. C++ classes from VTK are wrappedinto Python equivalents. The few classes that are not wrapped aretypically limited to classes that are meant for internal use in VTK.
Python Wrapping Infrastructure
Python classes for VTK classes and special types are generatedusing a shared lex/yacc-based parser tailored for VTK program-ming conventions and custom code generation utilities for Pythonwrapping. VTK is organized into a number of C++ modules.When built with shared libraries enabled, a library containing C++classes is generated at build time for each C++ module. EachPython-wrapped source file is likewise compiled into a sharedlibrary corresponding to the C++ module. All wrapped VTK C++modules are provided in a single vtk Python package.
VTK Usage in Python
For convenience, an executable named vtkpython is providedin VTK binaries. This is the standard Python executable withenvironment variables set to make it simple to import the vtkpackage. It is also possible to use VTK in the same pythonexecutable from the Python installation against which VTK wasbuilt by prepending the location of VTK’s shared libraries and thelocation of the parent directory of the file vtk/__init__.py tothe PYTHONPATH environment variable, but using vtkpythonavoids the need to do this.
To access VTK classes, you simply import vtk:import vtk
VTK is somewhat unusual for a Python package in that allmodules are loaded by this import statement.
Creation of VTK objects is straightforward:contourFilter = vtk.vtkContourFilter()
Each Python object references an underlying VTK object. Objectsin VTK are reference counted and automatically deleted when
no longer used. The wrapping interface updates the underlyingVTK object’s reference count and alleviates the need for explicitmemory management within Python.
One particularly nice semantic equivalence between VTK’sC++ and Python interfaces involves member functions that accepta pointer to a C++ array representing a small tuple of elements.Such functions are common in VTK to do things like set a 3DCartesian coordinate as a property of a class. In Python, thecorresponding function accepts a tuple or list object. This workswell as long as the list or tuple has the expected number ofelements.sphere = vtk.vtkSphereSource()
# Express point as listsphere.SetCenter([0, 1, 0])
# Express point as tuplesphere.SetCenter((0, 1, 0))
Member functions that return pointers to arrays with a fixednumber of elements are also supported. Such functions require ahint to the wrapping infrastructure indicating how many elementsare in the tuple that is returned.>>> center = sphere.GetCenter()>>> print center(0, 1, 0)
For VTK classes that have operators <, <=, ==, >=, > defined,equivalent Python operators are provided.
Some functions in VTK return information via parameterspassed by reference. For example, in the following code block,the parameter t is a return parameter from the member functionIntersectWithLine.double t, x[3]plane->IntersectWithLine(point1, point2, t, x);
In Python, the equivalent ist = vtk.mutable(0.0)plane.IntersectWithLine(point1, point2, t, x)
Class and function documentation is processed by the wrappinginfrastructure to make it available via Python’s built-in helpsystem.>>> help(vtk.vtkSphereSource)
The above shows the full documentation of thevtkSphereSource class (too extensive to list here), while thecode below produces help for only the SetCenter memberfunction.>>> help(vtk.vtkSphereSource.SetCenter)
Help on built-in function SetCenter:
SetCenter(...)V.SetCenter(float, float, float)C++: void SetCenter(double, double, double)V.SetCenter((float, float, float))C++: void SetCenter(double a[3])
Some less often used mappings between C++ and Pythonsemantics, as well as limitations, are described in the fileVTK/Wrapping/Python/README_WRAP.txt in the VTKsource code repository in versions 4.2 and above.
A full example below shows how to create a VTK pipelinein Python that loads an STL file, smooths it, and displays thesmoothed result in a 3D render window.import vtk

SCIENTIFIC DATA ANALYSIS AND VISUALIZATION WITH PYTHON, VTK, AND PARAVIEW 33
reader = vtk.vtkSTLReader()reader.SetFileName('somefile.stl')
smoother = vtk.vtkLoopSubdivisionFilter()smoother.SetInputConnection(reader.GetOutputPort())
mapper = vtk.vtkPolyDataMapper()mapper.SetInputConnection(smoother.GetOutputPort())
actor = vtk.vtkActor()actor.SetMapper(mapper)
renderer = vtk.vtkRenderer()renderer.AddActor(actor)
renWin = vtk.vtkRenderWindowrenWin.AddRenderer(renderer)
interactor = vtk.vtkRenderWindowInteractor()interactor.SetRenderWindow(renWin)interactor.Initialize()renWin.Render()iren.Start()
Many additional examples of VTK usage in Python are availablein the VTK/Examples/Python wiki page [Wik15].
Integration with NumPy
There are limited functions within VTK itself to process or analyzepoint and cell arrays. Since 2008, a low-level interface layerbetween VTK arrays and NumPy arrays has been available inVTK. This interface layer can be used to map VTK arrays toNumPy arrays and vice versa, enabling the full power of NumPyoperations to be used on VTK data. For example, suppose that wehave a data set from a computational fluid dynamics simulationthat we can load with a VTK reader class, and suppose furtherthat the data set has a point array representing pressure. We canfind several properties of this array using NumPy, e.g.,import numpy as npimport vtk.util.numpy_support as nps
# Load data with a VTK reader instantiated earlierreader.Update()
ds = reader.GetOutput()pd = ds.GetPointData()pressure = pd.GetArray('pressure')np_pressure = nps.vtk_to_numpy(pressure)
min_p = np.min(np_pressure)max_p = np.max(np_pressure)
This interface can also be used to add data arrays to loaded datasets that can be handed off to VTK for visualization:norm_pressure = (np_pressure - min_pressure) / \
(max_pressure - min_pressure)vtk_norm_pressure = np.numpy_to_vtk(norm_pressure, 1)vtk_norm_pressure.SetName('normalized pressure')pd.AddArray(vtk_norm_pressure)
The second argument to np.numpy_to_vtk indicates that theNumPy array should be deep copied to the VTK array. This isnecessary if no reference to the NumPy array will otherwise bekept. If a reference to the numpy array will be kept, then thesecond argument can be omitted and the NumPy array will beshallow copied instead, saving memory and time because the arraydata does not need to be copied. Note that the Python interprettermight crash if a NumPy array reference is not held and the data isshallow copied.
More recently, a higher-level NumPy-like interface layer hasbeen added to VTK. This numpy_interface was designed to
combine the ease of use of NumPy with the distributed memoryparallel computing capabilities and broad data set type supportof VTK. The straightforward interface between VTK data arraysand NumPy described above works only when the entire dataset is available on one node. However, data sets in VTK maybe distributed across different computational nodes in a parallelcomputer using the Message Passing Interface [Sni99]. In this sce-nario, global reduction operations using NumPy are not possible.For this reason, a NumPy-like interface has been added to VTKthat properly handles distributed data sets [Aya14].
A key building block in VTK’s numpy_interface is a setof classes that wrap VTK data set objects to have a more Pythonicinterface.
import vtkfrom vtk.numpy_interface import dataset_adapter as dsa
reader = vtk.vtkXMLPolyDataReader()reader.SetFileName(filename)reader.Update()ds = dsa.WrapDataObject(reader.GetOutput())
In this code, ds is an instance of adataset_adapter.PolyData that wraps thevtkPolyData output of the vtkXMLPolyDataReader.Point and cell arrays are available in member variablesPointData and CellData, respectively, that provide thedictionary interface.
>>> ds.PointData.keys()['pressure']
>>> pressure = ds.PointData['pressure']
Note that the pressure array here is an instance of VTKArrayrather than a wrapped VTK data array. VTKArray is awrapper around the VTK array object that inherits fromnumpy.ndarray. Hence, all the standard ndarray operationsare available on this wrapped array, e.g.,
>>> pressure[0]0.112
>>> pressure[1:4]VTKArray([34.2432, 47.2342, 38.1211], dtype=float32)
>>> pressure[1:4] + 1VTKArray([35.2432, 48.2342, 39.1211], dtype=float32)
>>> pressure[pressure > 40]VTKArray([47.2342], dtype=float32)
The numpy_interface.algorithms module also providesNumPy-like functionality:
import vtk.numpy_interface.algorithms as algs
>>> algs.min(pressure)VTKArray(0.1213)
>>> algs.where(pressure > 38)(array([2, 3], dtype=int64),)
In addition to providing most of the ufuncs provided by NumPy,the algorithms interface provides some functions to accessquantities that VTK can compute in the wide variety of data settypes available in VTK. This can be used to compute, for instance,the total volume of cells in an unstructured grid:
>>> cell_volumes = algs.volume(ds)>>> algs.sum(cell_volumes)VTKArray(847.02)

34 PROC. OF THE 14th PYTHON IN SCIENCE CONF. (SCIPY 2015)
This example illustrates nicely the power of combining a NumPy-like interface with VTK’s uniform API for computing variousquantities on different types of data sets.
Another distinct advantage of thenumpy_interface.algorithms module is that alloperations are supported in parallel when data sets are distributedacross computational nodes. [Aya14] describes this functionalityin more detail.
Integration with matplotlib
While VTK excels at interactive 3D rendering of scientific data,matplotlib excels at producing publication-quality 2D plots. VTKleverages each toolkit’s strengths in two ways.
First, as described earlier, convenience functionsfor exposing VTK data arrays as NumPy arrays areprovided in the vtk.util.numpy_support andnumpy_interface.algorithms modules. These arrayscan be passed to matplotlib plotting functions to producepublication-quality plots.
Second, VTK itself incorporates some of matplotlib’s ren-dering capabilities directly when possible. When VTK Pythonwrapping is enabled and matplotlib is available, VTK uses thematplotlib.mathtext module to render LaTeX math ex-pressions to either vtkImageData objects that can be dis-played as images or to paths that may be rendered to avtkContextView object, VTK’s version of a canvas. ThevtkTextActor, a class for adding text to visualizations, usesthis module to support rendering complex LaTeX math expres-sions.
Qt applications with Python
Python support in VTK is robust enough to create full-featuredapplications without writing a single line of C++ code. PyQt[PyQt15] (or PySide [PyS15]) provide Python bindings for Qt. Asimple PyQt example adapted from an example by Michka Popoffis provided below:import sysimport vtkfrom PyQt4 import QtCore, QtGuifrom vtk.qt4.QVTKRenderWindowInteractor \
import QVTKRenderWindowInteractor
class MainWindow(QtGui.QMainWindow):
def __init__(self, parent = None):QtGui.QMainWindow.__init__(self, parent)
self.frame = QtGui.QFrame()
layout = QtGui.QVBoxLayout()self.vtkWidget = \
QVTKRenderWindowInteractor(self.frame)layout.addWidget(self.vtkWidget)
self.renderer = vtk.vtkRenderer()rw = self.vtkWidget.GetRenderWindow()rw.AddRenderer(self.renderer)self.interactor = rw.GetInteractor()
cylinder = vtk.vtkCylinderSource()mapper = vtk.vtkPolyDataMapper()mapper.SetInputConnection( \
cylinder.GetOutputPort())actor = vtk.vtkActor()actor.SetMapper(mapper)
self.renderer.AddActor(actor)
self.renderer.ResetCamera()
self.frame.setLayout(layout)self.setCentralWidget(self.frame)
self.show()self.interactor.Initialize()
if __name__ == "__main__":app = QtGui.QApplication(sys.argv)window = MainWindow()sys.exit(app.exec_())
This simple application does little besides what is possible withpure VTK code alone. However, this example can easily beexpanded to provide interaction through UI elements such as amenu bar, buttons, text entries, sliders, etc.
VTK filters defined in Python
While VTK sources and filters are available in Python, theycannot be subclassed to create new sources or filters be-cause the virtual function table defined in C++ cannot dis-patch to member functions defined in Python. Instead, onecan subclass from a special VTKAlgorithm class defined invtk.util.vtkAlgorithm. This class specifies the inter-face for classes that interact with vtkPythonAlgorithm,a C++ class that delegates the primary VTK pipeline updatefunctions to equivalent pipeline update functions in the PythonVTKAlgorithm class. Subclasses of VTKAlgorithm can (andusually should) override these functions. By doing this, it ispossible to implement complex new sources and filters usingPython alone. For more details on the VTKAlgorithm class,see [Gev2014].
Python integration in VTK tests
As a project that follows a quality software process, VTK hasmany regression tests. At present, 26% of tests (544 out of2046) are written in Python. This integration of Python in VTK’stesting infrastructure shows how important Python is in VTK’sdevelopment.
Obtaining VTK
VTK and its Python bindings are available on many Linux distri-butions including Ubuntu, Debian, OpenSUSE. It is also availablein Anaconda and Enthought Canopy. Binary installers and sourcecode for the most recent versions are available on the VTK website [VTK15] for Windows, Mac, and Linux.
Python and ParaView
ParaView is a suite of scalable parallel visualization executablesthat use VTK to read data, process it, and create visualizations.One of the executables includes a graphical user interface (GUI)to make it possible to create visualizations without programming(when ParaView is mentioned in this section, it is the executablewith a GUI unless otherwise specified). Data processing in Par-aView follows the same data-flow paradigm that VTK follows. InParaView, sources and filters are chained together in a PipelineBrowser as shown in Figure 1. Visualization controls are modifiedwith user interaction widgets provided by Qt.
While ParaView can be used to make visualizations withoutprogramming, it is also possible to use Python scripting to au-tomate certain operations or even create entire visualizations. Inthis section, I describe how Python scripting is integrated into

SCIENTIFIC DATA ANALYSIS AND VISUALIZATION WITH PYTHON, VTK, AND PARAVIEW 35
Fig. 1: The ParaView GUI with an example visualization of a dataset from a simulation of airflow past a blunt fin. The PipelineBrowser (upper left) shows the sources and filters used to create thevisualization. Filter and visualization parameters are shown in theProperty window (lower left).
ParaView at several different levels. At a high level, Pythoncommands are issued via a console to change properties of avisualization. At a lower level, Python commands are used to setup entire visualizaion pipelines. At an even lower level, Python isused to create custom sources and filters to provide additional dataanalysis and visualization functionality.
Python Console
ParaView includes a Python console available under the Tools-> Python Console menu item. This console is a fully-featured Python console with the environment set up so that thevtk package and a paraview package are available. When firststarted, the commandfrom paraview.simple import *
is automatically executed to import the paraview.simplemodule. This layer is described in more detail later.
Running commands in ParaView’s Python console is identicalto running commands in other Python consoles. The key differenceis that commands can be used to change the state of the ParaViewapplication. This provides a similar experience to using a Pythonconsole to change matplotlib plots.
The Python console also provides a button to load and executea Python script with ParaView commands from a file. This featureis ideal for iterative Python script development.
pvpython and pvbatch
The ParaView suite of tools includes two Python-based utili-ties for both interactive and batch generation of visualizations.pvpython is an interactive Python shell that provides the sameaccess to the vtk and paraview packages as provided bythe Python console in ParaView. The key difference betweenParaView and pvpython is that no GUI controls are availableto modify pipeline or visualization state. pvbatch is a non-interactive executable that runs a Python script and is intendedto perform offline data processing and visualization generation.
Python Tracing and State Files
While documentation is available to learn how to write Pythonscripts for ParaView, it can take some time to find the functioncalls needed to replicate a sequence of actions performed through
the GUI. To reduce script development time, ParaView supportstracing of user interactions where the generated trace is in the formof a Python script. Running the resulting trace script through theParaView Python console, pvpython or pvbatch reproducesthe effects of the user interactions with the GUI.
Python tracing is implemented by instrumenting the ParaViewapplication with Python generation code at various user eventhandlers. The tracing mechanism can record either the entire stateof ParaView objects or just modifications of state to non-defaultvalues to reduce the trace size. Traces can be started and stoppedat any time - they do not need to record the full user interactionhistory.
An application where tracing is useful is the batch conversionof data files. If ParaView can read the source file format and writethe destination file format, it is easy to perform the conversionmanually one time with the ParaView GUI. For a large list of files,though, a more automated approach is useful. Creating a traceof the actions needed to perform the conversion of a single fileproduces most of the script that would be needed to convert a listof files. The trace script can then be changed to apply to a list offiles.
In addition to saving a trace of user interaction sequences,a Python state file may also be produced. Like a Python trace,the state file contains Python commands that set up the pipelineand visualization settings, but unlike a trace, it does not recordinteraction events as they happen but rather the final state ofParaView.
Simple Python Interface
Much of ParaView is implemented in C++ as VTK classes. Theseclasses are wrapped in Python with the same mechanism thatwraps VTK classes. As such, they are accessible within the Pythonconsole, pvpython, and pvbatch. However using these classesdirectly is often unwieldy. The example below illustrates how touse the direct ParaView API to create a sphere source with radius2.from paraview import servermanager as sm
pm = sm.vtkSMProxyManager.GetProxyManager()controller = \
sm.vtkSMParaViewPipelineControllerWithRendering()
ss = pm.NewProxy('sources', 'SphereSource')ss.GetProperty('Radius').SetElement(0, 2.0)controller.RegisterPipelineProxy(ss)
view = pm.GetProxy('views', 'RenderView1')rep = view.CreateDefaultRepresentation(ss, 0)controller.RegisterRepresentationProxy(rep)rep.GetProperty('Input').SetInputConnection(0, ss, 0)rep.GetProperty('Visibility').SetElement(0, 1)
controller.Show(ss, 0, view)view.ResetCamera()view.StillRender()
Note in this example the various references to proxies. A proxyhere refers to the proxy programming design pattern where oneobject provides an interface to another object. Proxies are centralto ParaView’s design. In a number of the various client/serverconfiguration in which ParaView can be run, the client softwarerunning on a local workstation connects to a remote server runningone or more processes on different nodes of a high-performancecomputing resource. Proxies for each pipeline object exist on theParaView client, and they provide the interface for communicatingstate to all the VTK objects in each client and server process.
36 PROC. OF THE 14th PYTHON IN SCIENCE CONF. (SCIPY 2015)
In the example above, a new proxy for a vtkSphereSourceobject is created. This proxy has a property named ’Radius’that is modified to the value 2.0. Changes to the ’Radius’ prop-erty are forwarded to the ’Radius’ property of the underlyingvtkSphereSource.
As this example demonstrates, creating a new data source, arepresentation for it (how it is rendered), and adding the represen-tation to the view (where it is rendered), is an involved processwhen using the paraview.servermanager module directly.Fortunately, ParaView provides a simplified Python interface thathides most of these details, making Python scripting much moreaccessible.
The paraview.simple layer provides simpler Pythonfunctions to create pipelines and modify filter and visual-ization properties. The same example above expressed withparaview.simple functions is reduced tofrom paraview import simple
Sphere(Radius=2.0)Show()Render()
ParaView traces and Python state files are expressed in terms ofparaview.simple module functions. For more information onhow to use this module, see [Kit15].
Python Programmable Filter
ParaView provides many data filters for transforming data andperforming analysis tasks. There are, however, an infinite numberof operations one may want to perform on a data set. To addressthe need for custom filters, ParaView supports a rich pluginarchitecture that makes it possible to create additional filters inC++. Unfortunately, creating a plugin this way is a relativelyinvolved process.
Aside from the C++ plugin architecture, ParaView provides aProgrammable Filter that enables a potentially faster developmentpath. The Programmable Filter has a text property that stores aPython script to execute when the filter is updated. Inputs to theProgrammable Filter are available within this script. Completespecification of the output data set is possible within the script,including setting the output data type, the data set toplogy (i.e.,type and number of cells), as well as point and cell arrays.
At its core, the Programmable Filter is de-fined by the VTK-derived C++ class namedvtkPythonProgrammableFilter. Using the PythonC API, the vtkPythonProgrammableFilter passes areference to itself to the Python environment in which the scriptexecutes so that it is available within the script itself. This makesit possible to access the inputs and outputs to the filter via:input = self.GetInput()output = self.GetOutput()
Arbitrarily complex Python scripts can be executed to generatethe filter’s output. The following example moves points in aninput vtkPointSet along normals associated with the pointsif available.ipd = self.GetInput()opd = self.GetOutput()
# Output is shallow-copied by default# Deep copy the points so that we are not modifying# the input points.opd.DeepCopy(ipd)
na = ipd.GetPointData().GetArray('Normals')if na != None:
for i in xrange(ipd.GetNumberOfPoints()):pt = ipd.GetPoint(i)n = na.GetTuple(i)newPt = (pt[0]+n[0], pt[1]+n[1], pt[2]+n[2])opd.GetPoints().SetPoint(i, newPt)
The Programmable Filter also uses thevtk.numpy_interface.dataset_adapter moduleto wrap the inputs to the filter. All of the wrapped inputs areadded to a list named inputs, and the single output is wrappedin an object named output. By using the wrapped inputs andoutputs, the filter above becomes simplyipts = inputs[0].Pointsnormals = inputs[0].PointData['Normals']
output.Points = ipts + normals
It is important to note that Python scripts in the ProgrammableFilter may use only VTK classes and other Python modules,but not any of the modules in the paraview package. If thosemodules are imported, the behavior is undefined.
Python Programmable Source
Within ParaView it is also possible to define Python script thatdefines data sources using the Python Programmable Source. Thissource functions much like the Python Programmable Filter, butdoes not require any input data sets.
Python Calculator
ParaView’s Python Calculator filter is a light-weight alternative tothe Programmable Filter used to compute additional point or cellarrays using NumPy or the numpy_interface.algorithmsmodule. The following expression computes the areas of polygonsin a surface mesh:algs.area(inputs[0])
Note that the numpy_interface.algorithms is importedwith the name algs in the Python environment in which theexpression is evaluated. In the Python Calculator, the prop-erty ’Array Association’, which indicates whether the outputarray should be a point or cell array, must be set to ’CellData’ because one area value is produced per cell. Note thatlike the Programmable Filter, the inputs are wrapped withthe vtk.numpy_interface.dataset_adapter modulefunctions and stored in an inputs list.
Python Annotation
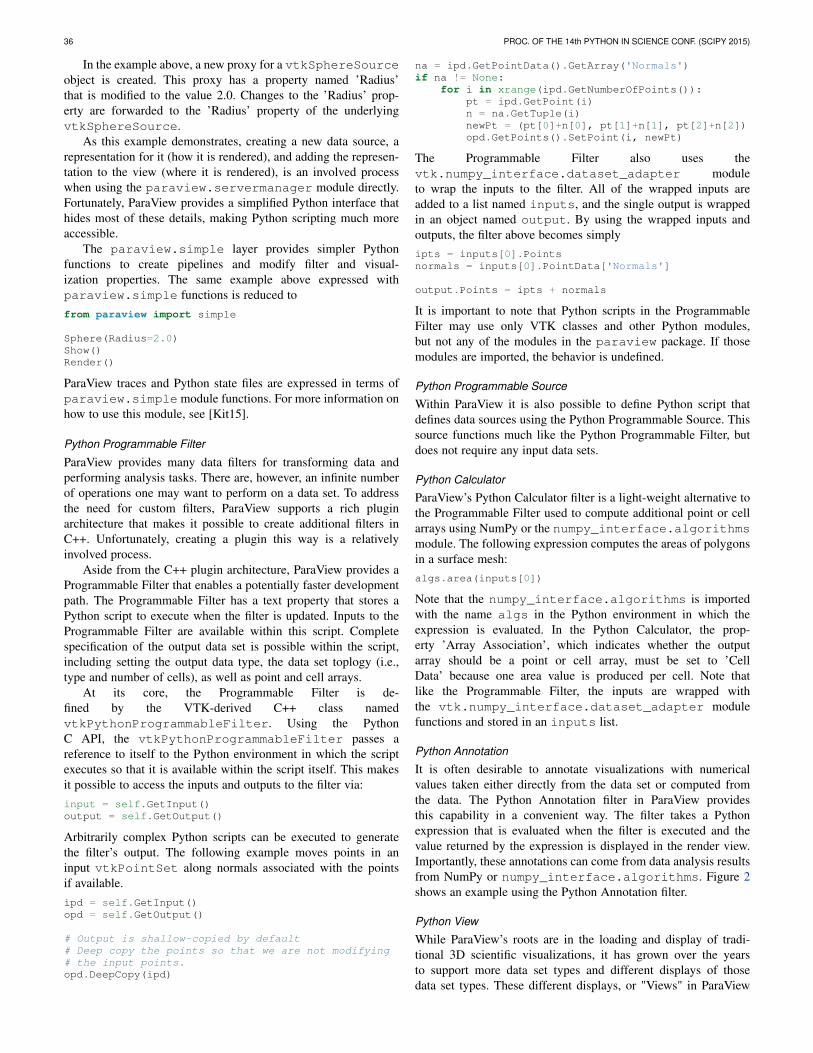
It is often desirable to annotate visualizations with numericalvalues taken either directly from the data set or computed fromthe data. The Python Annotation filter in ParaView providesthis capability in a convenient way. The filter takes a Pythonexpression that is evaluated when the filter is executed and thevalue returned by the expression is displayed in the render view.Importantly, these annotations can come from data analysis resultsfrom NumPy or numpy_interface.algorithms. Figure 2shows an example using the Python Annotation filter.
Python View
While ParaView’s roots are in the loading and display of tradi-tional 3D scientific visualizations, it has grown over the yearsto support more data set types and different displays of thosedata set types. These different displays, or "Views" in ParaView
SCIENTIFIC DATA ANALYSIS AND VISUALIZATION WITH PYTHON, VTK, AND PARAVIEW 37
Fig. 2: Three annotations filters in the scene show the minimum,maximum, and total areas of polygons in the sphere source.
parlance, include a 3D interactive rendering view, a histogramview, a parallel coordinates view, and a large number of others.
One of these other view types is the Python View. This viewis similar to the programmable filter in that the user supplies aPython script that generates some data. In the case of the PythonView, the data that is generated is an image to display in theParaView window. This makes it possible to use Python plottingpackages, such as matplotlib, to generate plots to be displayeddirectly in ParaView.
Scripts used in the Python view are required to define twofunctions, a setup_data function and a render function.Rendering in the Python view is done on the local client, so datathat resides on remote server processes must first be brought overto the client. Because data sets may be larger than the client’sRAM, only a subset of the data arrays in a data set are copied to theclient. By default, no arrays are copied. Arrays can be requestedusing functions available in the vtkPythonView class instancethat is passed in as an argument to the setup_data function,e.g.,def setup_data(view):
view.SetAttributeArrayStatus(0, \vtkDataObject.POINT, "Density", 1)
The actual generation of the plot image is expected to be done inthe render function. This function is expected to take the sameview object as is passed to the setup_data function. It alsotakes a width and height parameter that tells how large the plottedimage should be in terms of pixels. This function is expected toreturn an instance of vtkImageData containing the plot image.A few utilities are included in the paraview.python_viewmodule to convert Python arrays and images to vtkImageData.An example that creates a histogram of an array named "Density"is provided here:def render(view, width, height):
from paraview \import python_view.matplotlib_figure
figure = matplotlib_figure(width, height)
ax = figure.add_subplot(1,1,1)ax.minorticks_on()ax.set_title('Plot title')ax.set_xlabel('X label')ax.set_ylabel('Y label')
# Process only the first visible object in the# pipeline browserdo = view.GetVisibleDataObjectForRendering(0)
dens = do.GetPointData().GetArray('Density')
# Convert VTK data array to numpy arrayfrom paraview.numpy_support import vtk_to_numpy
ax.hist(vtk_to_numpy(dens), bins=10)
return python_view.figure_to_image(figure)
For more information on the Python View, see Section 4.11 in[Aya15] or [Qua13].
ParaViewWeb
ParaViewWeb is a framework for remote VTK and ParaViewprocessing and visualization via a web browser. The frameworkon the server side is based on the Autobahn, Twisted, Six, andZopeInterface Python libraries. On the client side, ParaViewWebprovides a set of JavaScript libraries that use WebGL, JQuery, andAutobahn.js. Images are typically generated on the server and sentto the client for display, but if the visualized geometry is smallenough, geometry can be sent to the client and rendered withWebGL.
A nice feature of ParaViewWeb is that the server componentcan be launched with pvpython. No separate web server isneeded. For example, on Linux, the following command launchesthe ParaViewWeb server from the ParaView installation directory./bin/pvpython \
lib/paraview-4.1/site-packages/paraview/\web/pv_web_visualizer.py --port 8080 \
--content ./share/paraview-4.1/www \--data-dir /path-to-share/ & \
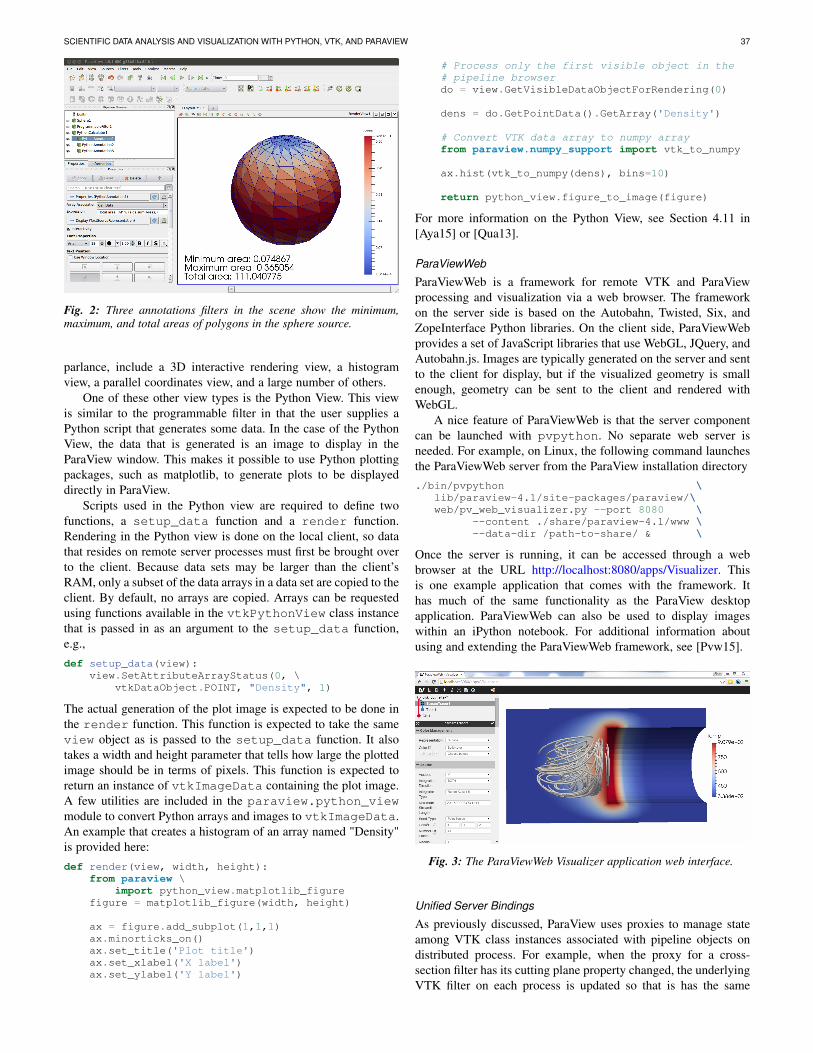
Once the server is running, it can be accessed through a webbrowser at the URL http://localhost:8080/apps/Visualizer. Thisis one example application that comes with the framework. Ithas much of the same functionality as the ParaView desktopapplication. ParaViewWeb can also be used to display imageswithin an iPython notebook. For additional information aboutusing and extending the ParaViewWeb framework, see [Pvw15].
Fig. 3: The ParaViewWeb Visualizer application web interface.
Unified Server Bindings
As previously discussed, ParaView uses proxies to manage stateamong VTK class instances associated with pipeline objects ondistributed process. For example, when the proxy for a cross-section filter has its cutting plane property changed, the underlyingVTK filter on each process is updated so that is has the same

38 PROC. OF THE 14th PYTHON IN SCIENCE CONF. (SCIPY 2015)
cutting plane. These instances are updated via a client/server com-munication layer that is generated automatically using a wrappingmechanism. The client/server layer consists of one communicationclass per VTK class that serializes and deserializes state in theVTK class.
As discussed, a similar wrapping process is also performed togenerate Python bindings for VTK classes and ParaView classes.Each of these wrappings adds to the size of the executable files andshared libraries. On very large scale parallel computing resources,the amount of RAM available per node can be relatively limited.As a result, when running ParaView on such a resource, it isimportant to reduce the size of the executables as much as possibleto leave room for the data. One way to do this is to use the Pythonwrapping to communicate among processes instead of using theclient/server communication class. Indeed, when this option isenabled, the process of creating the special communication classesis skipped. Instead, communication is performed by sendingstrings with Python expressions to destination processes. Theseexpressions are then evaluated on each process to change thestate of local VTK classes. In this approach, we get the samefunctionality as the custom client/server communication layerwrapping, but with smaller executables.
Conclusions
Python has been integrated into VTK and ParaView for manyyears. The integration continues to mature and expand as Pythonis used in an increasing number of ways in both software pack-ages. As Python continues to grow in popularity among thescientific community, so too does the need for providing easy-to-use Pythonic interfaces to scientific visualization tools. Asdemonstrated in this paper, VTK and ParaView are well-positionedto continue adapting to the future needs of scientific Pythonprogrammers.
Future Work
VTK and ParaView currently support Python 2.6 and 2.7. Supportfor Python 3 is targeted for sometime in 2016.
Acknowledgements
Contributions to Python support in VTK and ParaView have comefrom many VTK community members. Deserving special recog-nition are key contributors David Gobbi, Prabhu Ramachandran,Ken Martin, Berk Geveci, Utkarsh Ayachit, Ben Boeckel, AndyCedilnik, Brad King, David Partyka, George Zagaris, MarcusHanwell, and Mathieu Malaterre.
REFERENCES
[Aya14] U. Ayachit, B. Geveci, Scientific data analysis and visualizationat scale in VTK/ParaView with NumPy, 4th Workshop on Pythonfor High Performance and Scientific Computing PyHPC 2014,November, 2014.
[Aya15] U. Ayachit, The ParaView Guide: A Parallel Visualization Applica-tion, Kitware, Inc. 2015, ISBN 978-1930934306.
[Gev14] B. Geveci, vtkPythonAlgorithm is great, Kitware Blog, September10, 2014. http://www.kitware.com/blog/home/post/737
[Kit15] simple Module, http://www.paraview.org/ParaView/Doc/Nightly/www/py-doc/paraview.simple.html
[Pvw15] ParaViewWeb, http://paraviewweb.kitware.com/#!/guide[PyQt15] PyQt4 Reference Guide, http://pyqt.sourceforge.net/Docs/PyQt4/[PyS15] PySide 1.2.2, https://pypi.python.org/pypi/PySide[Qua13] C. Quammen. ParaView: Python View is now more versatile, http:
//www.kitware.com/blog/home/post/704
[Sch04] W. Schroeder, K. Martin, and B. Lorensen, The VisualizationToolkit: An Object-Oriented Approach to 3D Graphics, 4th ed.Kitware, Inc., 2004, ISBN 1-930934-19-X.
[Sni99] M. Snir, S. Otto, S. Huss-Lederman, D. Walker, and J. Dongarra,MPI - The Complete Reference: Volume 1, The MPI Core, 2nd ed.,MIT Press, 1999, ISBN 0-262-69215-5.
[VTK15] VTK - The Visualization Toolkit, http://www.vtk.org/[Wik15] VTK/Examples/Python, http://www.vtk.org/Wiki/VTK/Examples/
Python