problem-oriented policing in public housing: final … · the public housing problem-oriented...
TRANSCRIPT

The author(s) shown below used Federal funds provided by the U.S.Department of Justice and prepared the following final report:
Document Title: Problem-Oriented Policing in Public Housing:Final Report of the Jersey City Project
Author(s): Lorraine G. Mazerolle; Justin Ready; Bill Terrill;Frank Gajewski
Document No.: 179985
Date Received: December 29, 1999
Award Number: 94-IJ-CX-0063
This report has not been published by the U.S. Department of Justice.To provide better customer service, NCJRS has made this Federally-funded grant final report available electronically in addition totraditional paper copies.
Opinions or points of view expressed are thoseof the author(s) and do not necessarily reflect
the official position or policies of the U.S.Department of Justice.

Problem-Oriented Policing in Public Housing: Final Report of the Jersey City Project'
Lorraine Green Mazerolle University of Cincinnati
Justin Ready Rutgers University
Bill Terrill Rutgers University
and
Deputy Chief Frank Gajewski Jersey City Police Department
Submitted to the !Vational Institute of Justice
December. 1998
The :-search for :his final report was supported by Grant No. 94-IJ-CX-0063 from the National Institute of Justic- Opinions or points of view expressed in the paper do not necessarily represent the official positions or policies of the National Institute of Justice or the U.S. Department of Justice. We would like to thank Elin Waring, David U'eisburd. Elyse Revere. Cyndy blarnalian, John Schwartz and Theresa Conover far their contributions at bar ious stages of the project. We would also like to thank Lieutenant Brian McDonough, Lieutenant Charles Beliucci and members of the public housing site teams for their cooperation and insight at various points in the project Please address all correspondence to Lorraine Green Mazerolle at the University of Cincinnati, Division of Criminal Justice, PO Box 210389, Cincinnati OH, 45221-0389.
This document is a research report submitted to the U.S. Department of Justice. This reporthas not been published by the Department. Opinions or points of view expressed are thoseof the author(s) and do not necessarily reflect the official position or policies of theU.S. Department of Justice.

Executive Summary
e
The public housing problem-oriented pLicing project was a cooperative effort by Jersey City's Public Housing Authority and the Police Department to solve serious crime problems across three low-rise and three high-rise public housing sites.
The Housing Authority and the Police Department formed six problem-solving "site teams" comprising public housing representatives, on and off-duty police officers, tenant representatives, and a social service liaison officer. These teams collectively identified and analyzed drug and violent crime problems in the six target public housing sites in our study.
Our project in Jersey City began with the premise that public housing sites differ from one site to the next. We suggested that even within public housing sites, some places (like some playgrounds and some building lobbies) would have problems, while others would not.
The corollary was that problems withm public housing locations would have varied causes and thus varied responses should be applied to solve (or reduce) the problems.
We distinguished all common areas by their function and identified six broad types of common areas: walkways, buildings, playgrounds, parking lots, rest areas, and comm1inity centers. We identified 172 unique common areas across the six public housing sites.
R l e n the distributions of problems were examined across public housing sites we found that the six public housing sites in Jersey City experienced very different distributions of problems.
Crime is not evenly distributed across all common areas in a public housing site. About half of the common areas were deemed "safe places" in public housing sites and different public housing sites had different distributions of crime problems.
Buildings were the most frequently cited common area generating drug problems in all six public housing sites in our study.
Approximately 7 percent of all the site apartments @=I 84) generated 50 percent of the calls across the six housing sites.
The site teams initiated situational crime prevention tactics such as changing public pa?' phones to enable out-going calls only and CPTED interventions such as improving lighting in some dimly lit comers of one public housing site. Site teams also sought to control crime problems in common areas using traditional policing tactics such as arrests, surveillances, investigations, order maintenance, and enforcing open um-rants.
This document is a research report submitted to the U.S. Department of Justice. This reporthas not been published by the Department. Opinions or points of view expressed are thoseof the author(s) and do not necessarily reflect the official position or policies of theU.S. Department of Justice.

Our evaluation team recorded a total of 603 assigned activities during the one year intervention period and we documented a sready increase in UT, ;flue problem-solving activities completed each month.
Our research found that the problem-oriented policing activities. collectively implemented by site teams comprising police, public housing officers, and social service liaison officers, significantly reduced interpersonal, propem, vehicle, and assistance calls for service.
Our research found that the reductions in calls for service for these categories of crime were significant and attributable to the number of problem-oriented policing activities implemented in each site.
We did not find, however, significant reductions in the number of calls for service over time for disorder-type problems and drug market problems. We expect that the low base rate of calls from public housing residents regarding incivilities and drug problems confounds this result.
Our social observational data throws weight behind our supposition that the calls for service are an inadequate measure of the impact of the problem-oriented policing program on disorderly type activity. Indeed, our systematic social observations show that marginal and illicit activity decreased across the six public housing sites during the one year intervention period.
Our research also found differences among the six public housing site teams in their abilit). to impact crime problems. Two site teams in particular - Gladstone and Brighton - significantly reduced the number of calls for service over time.
Importantly, we found that the physical structure differences that were significant predictors of changes in calls for service over time (total number of units) did not explain why Brighton and Gladstone site teams were most successful in reducing crime problems. Moreover, social structural factors such as percent unemployed, percent AFDC, and percent single headed households did not exhibit strong relationships to the changes overtime in calls for service.
We concluded that stable membership in the site-based problem-solving teams combined with a high volume of completed problem-solving activities contributed to the successful reduction in calls for service regarding serious crime problems in Brighton and Gladstone.
Our evaluation of a problem-oriented policing program implemented in six of the most crime ridden public housing sites in Jersey City challenges the notion that public housing sites represent the last bastion of program resistance.
This document is a research report submitted to the U.S. Department of Justice. This reporthas not been published by the Department. Opinions or points of view expressed are thoseof the author(s) and do not necessarily reflect the official position or policies of theU.S. Department of Justice.

Table of Contents Page
.
Chapter 1: Introduction .......................................................................................................... 1
Chapter 2: The Jersey City Project Site ................................................................................. Chapter 3: The Jersey City Public Housing Problem-Oriented Policing Pro. ............... 9
3.1 Public Housing Site Teams .................................................................................. 9
3.2 Identifying and Analyzing Places with Problems ........................................... 10
3.3 Identifying and Analyzing Apartments with Problems .................................. 29
3.4 Developing and Implementing Problem-Oriented Policing Responses ............................................................................................ 30
3.5 Site Team Membership ...................................................................................... 37
Chapter 4: Calls for Service .................................................................................................. 39
4.1 Analytic Strategy ................................................................................................ 41
4.2 Results ................................................................................................................. 4 1
Chapter 5: Social Observations ............................................................................................ 53
5.1 Theoretical Perspective ...................................................................................... 53
5.2 Systematic Social Observation Data ................................................................. 56
. 5.3 Results ................................................................................................................. 39
Chapter 6: Conclusions ......................................................................................................... 67
References ............................................................................................................................... 71
This document is a research report submitted to the U.S. Department of Justice. This reporthas not been published by the Department. Opinions or points of view expressed are thoseof the author(s) and do not necessarily reflect the official position or policies of theU.S. Department of Justice.

List of Tables
Page
. Table 2.1 Profile of Six Targeted Public Housing Sites in Jersey City ............................... 3
Table 3.1 Arrests by Selected Crime Type by Public Housing Site .................................. 12
Table 3.2 Number and Percent Distribution of Common Areas by Site .......................... 14
Table 3.3 Number and Percent Distribution of Common Areas by Type ........................ 14
Table 3.4 Number of Problems by Type .............................................................................. 16
Table 3.5 Number and Percent of Common Areas With Problems by Site ..................... 17
Table 3.6 Number and Percent of Common Areas With Problems by Type ................... 18
Table 3.7 Type of Problems in Common Areas by Public Housing Site ........................... 21
Table 3.8 Type of Problems by Common Areas in Low and High Rise Sites .................. 22
Table 3.9 Public Housing Site by Percent Common Areas that Residents Avoid ............ 23
Table 3.10 Type of Common Area by Type of Problem ..................................................... 24
Table 3.1 1 Public Housing Site by Type of Problem by Rank Order of Common Area with Problems ............................................................................................ 25
Table 3.12 Distribution of Problems by Level of Seriousness and Type of Place ............ 28
Table 3.13 Number and Percent of Calls for Service in Public Housing Apartments ..... 29
Table 3.14 Profile of S i.. Public Housing Sites in Jersey City ............................................ 38
Table 4.1 Autoregressive Model for Overall Effects of Problem-Oriented Policing Activities on Calls for Service .............................................................................. 45
Table 4.2 Autoregressive Model for Nested Effects of Problem-Oriented Policing Activities on Calls for Service .............................................................................. 48
Table 4.3 Parameter Estimates for Problem-Oriented Policing Activities . Predicting Specific Cali Types ............................................................................. 30
This document is a research report submitted to the U.S. Department of Justice. This reporthas not been published by the Department. Opinions or points of view expressed are thoseof the author(s) and do not necessarily reflect the official position or policies of theU.S. Department of Justice.

List of Fie oures
Page
Figure 2.1. Map of Public Housing Sites ................................................................................ 6
Figure 3.1. Problem-Oriented Policing Activities by Public Housing Site ....................... 31
Figure 3.2. Problem-Oriented Policing Activities Over Time ............................................ 33
Figure 3.3. Types of Problem-Oriented Policing Activities by Public Housing Site ........ 34
Figure 5.1. Social Observations at Oakdale Public Housing Site ...................................... 60
Figure 5.2. Social Observations at Gladstone Public Housing Site ................................... 61
Figure 5.3. Social Observations at Woodlawn Public Housing Site .................................. 62
Figure 5.4. Social Observations at Ivanhoe Public Housing Site ....................................... 63
Figure 5.5. Social Observations at Brighton Public Housing Site ..................................... 64
Figure 5.6. Social Observations at Bellevue Public Housing Site ...................................... 65
This document is a research report submitted to the U.S. Department of Justice. This reporthas not been published by the Department. Opinions or points of view expressed are thoseof the author(s) and do not necessarily reflect the official position or policies of theU.S. Department of Justice.

List of "hotographs
Page
Photograph 1: Playground at Brighton ................................................................................ 7
Photograph 2: Parking Lot at Bellevue ................................................................................. 7
Photograph 3: Courtyard at Oakdale .................................................................................... 7
Photograph 4: Building # 2 at Gladstone ............................................................................... 7
Photograph 5: Elevator at Gladstone .................................................................................... 8
Photograph 6: Stairwell at Gladstone .................................................................................... 8
Photograph 7: Lobby at Gladstone ........................................................................................ 8
Photograph 8: Backdoor to Building ##4 at Oakdale ............................................................ 8
This document is a research report submitted to the U.S. Department of Justice. This reporthas not been published by the Department. Opinions or points of view expressed are thoseof the author(s) and do not necessarily reflect the official position or policies of theU.S. Department of Justice.

Chapter One:
Introduction
Controlling serious crime problems in public housing settings has been a principal
concern for policy makers, researchers, and criminal justice practitioners for many years.
Research shows that rates of violent crime are generally higher in urban public housing sites than
other inner-city locations. Indeed, research using census tract- and block group-level data shows,
after controlling for economic and housing characteristics, that urban public housing sites
generate more index crimes of all types than other nearby neighborhoods (Brill and Associates,
1977; Roncek, Bell, and Francik, 198 1 ; see also DeFrances and Smith, 1994) Similarly,
Dunworth and Saiger (1 993) found that housing sites in Phoenix, Los Angeles, and Washington,
D.C. produced significantly higher levels of violent and drug-related activity compared to nearby
neighborhoods as well as city wide.
Crime problems in many public housing sites across the United States have led federal,
state. and local governments to implement a vast array of intervention programs to make public
housing areas safer places to live. Many of these programs date back to the 1960s when public
housing administrators realized that high-rise developments built in the late 1950s posed
numerous security problems (Annan and Skogan, 1993). Since this time public housing sites
across the United States have served as testing grounds for a broad range of crime prevention
strategies. For example, early research by Oscar Newman found that accessibility and physical
h),out wer:: key determinants of crime, fear, and transience in public housing populations
(NeMman, 1973; Newman and Franck, 1980). Newman and his colleagues subsequently
advocated changes to the design of public housing to create “defensible space” and enable
1
This document is a research report submitted to the U.S. Department of Justice. This reporthas not been published by the Department. Opinions or points of view expressed are thoseof the author(s) and do not necessarily reflect the official position or policies of theU.S. Department of Justice.

residents to better monitor and maintain ueas that were clearly designated as their o\\n (see also
Jeffery, 1977; Rainwater, 1970). The ensuing popularity of ”defensible space,” and the close1.i
related concept known as Crime Prevention Through Environmental Design (CPTED), spawned
extensive efforts to clean up the physical appearances of public housing communities.
Beyond cleaning up and changing the physical conditions of public housing sites. a uide
variety of strategies have been implemented to target the persistent crime and social problems
that characterize public housing sites. These strategies include increasing patrol presence in high
crime public housing sites (Skogan and Annan, 1994; Weisel, 1990a), pouring money into
special drug law enforcement programs in sites that are designated a “High Intensity Drug
Trafficking Area’’ pursuant to Section 1005 of the Anti-Drug Abuse Act of 1988 (Anti-Drug
Abuse Act of 1988, Pub. L. No. 100-690), and establishing partnerships between local police
departments and local housing authorities. Many of these partnership building efforts seek to
implement problem-oriented policing programs to reduce drug and crime problems (see
Dun\\.orth and Saiger, 1993; Gajewski, Green. and Weisburd, 1993; Giacomazzi, McGarrell and
Thurman. 1996; Popkin et al, 1997; Weisel, 1990b).
The problem-oriented policing approach seeks to identify crime problems, analyze the
factors contributing to problems, develop appropriate responses to directly eliminate or reduce
the magnitude of identified problems, and then assess the effectiveness of these strategies (Eck
and Spelman. 1987; Goldstein, 1990). Problem-oriented policing programs typically extend the
responsibility for crime control beyond the police and rely on third parties (such as property
o\\ners. citizens, and local agency inspectors) to solve crime and disorder problems (Buerger and
Xlazerolle. 1998). Our final report presents the results of a problem-oriented policing project that
sought to control crime problems across six public housing sites in Jersey City. New Jersey.
2
This document is a research report submitted to the U.S. Department of Justice. This reporthas not been published by the Department. Opinions or points of view expressed are thoseof the author(s) and do not necessarily reflect the official position or policies of theU.S. Department of Justice.

The public housing problem-oriented policing project was a cooperative effort by Jersey
Ciq ' s Public Housing Authority and the Police Department to solve serious crime problems
across three low-rise and three high-rise public housing sites. The Housing Authority and the
Police Department formed six problem-solving "site teams" comprising public housing
representatives, on and off-duty police officers, tenant representatives, and a social service
liaison officer. These teams collectively identified and analyzed drug and violent crime problems
in the six target public housingtsites in our study. Each site team member was asked to identify
individual problems in their respective public housing sites and then, as a team, they analyzed
and prioritized target problems prior to implementing tactical responses. This final report draws
from thc efforts of these six problem-solving teams to implement a problem-oriented policing
approach to solve serious crime problems in the city's public housing sites.
Chapter Two intrGduces our Jersey City public housing research sites and then in Chapter
Three u e present the problem-oriented policing program implemented in Jersey City to target
scnous crime problems in the six study sites. Chapter Four presents our impact results using calls
f o r s c n ice data and Chapter Five assesses the impact of our problem-oriented policing program
using fike \takes of social observations. In Chapter Six we conclude with a discussion about the
theoretical. methodological and practical implications of our research for dealing with serious
crime problems within public housing communities.
3
This document is a research report submitted to the U.S. Department of Justice. This reporthas not been published by the Department. Opinions or points of view expressed are thoseof the author(s) and do not necessarily reflect the official position or policies of theU.S. Department of Justice.

Chapter Two:
The Jersey City Project Site
Jersey City resembles other densely-populated, industrial cities in the Kortheast of the
United States. Located in the New York City metropolitan area, Jersey City sustains concentrated
areas of poverty. low-income housing, and crime. Three out of ten Jersey City residents are
foreign born: a higher proportion than is found in any other metropolis except Xliami, Florida.
Jersey City is best characterized as a working class, blue-collar urban center. The 1990 census
shows an overall unemploymznt rate of 1 1 percent, and indicates that 18 percent of the total
population (n = 228,537) and 35 percent of all female-headed households (n = 16,785) live in
poverty. A substantial number of these impoverished families reside in the eleven public housing
sites managed by the Jersey City Housing Authority.
Drawing from a 1994 citywide analysis of narcotics and violent crime data. six public
housing sites emerged as experiencing severe and persistent crime problems: Oakdale,
C;l3dstone. Woodlann, Ivanhoe, Brighton. and Bellevue (U'eisburd and Green, 1995)'. Five of
these six public housing sites were ranked in the top ten drug markets (Weisbud and Green,
1995) and violent crime places (Braga et. al, forthcoming) in the city. Most notably. Oakdale was
consistcntl! ranked as the number one drug market and violent crime place in Jersey City. Table
2 1 profiles the six public housing sites included in our study.
~
' The names of the S I X public housing sites reported in this report are all pseudonyms.
4
This document is a research report submitted to the U.S. Department of Justice. This reporthas not been published by the Department. Opinions or points of view expressed are thoseof the author(s) and do not necessarily reflect the official position or policies of theU.S. Department of Justice.

Table 2.1. Profile of Six Targptpd Public Housing Sites in Jersey City
Site Style Units % One Adult YO AFDC ?6 Employed Yo Elderly I Oakdale High-rise 645 60 51 37 5 Gladstone High-rise 524 52 38 30 I S Woodlawn High-rise 440 51 34 40 10 Ivanhoe Low-rise 487 47 30 32 18 Brighton Low-rise 314 42 32 35 22 Belleb-ue Low-rise 230 45 35 24 18
~~~ ~~~
As Table 2.1 shows, there were between 230 and 645 housing units in the sites in our
study. Overall, our study sites comprised a total of 2,640 discrete units. The percentage of elderly
households ranged from 5 percent in one site (Oakdale) to 22 percent in another study site
(Brighton). \\<th most sites in the study falling well below the city (25 percent) and national (35
percent) averages (Holzman, 1996). On average, about one third of all public housing adults in
our study sites were employed and about one third received Aid to Families with Dependent
Children (AFDC).
The six public housing sites included in our study were located in the east, west and south
districts of the Jersey City Police Department. They were also places experiencing a tremendous
number of social problems. Figure 2.1 (over page) depicts, geographically, the proximity of the
SIX sites in o x study and then the follouing pages depict the deteriorated state of our target sites
prior to the problem-oriented policing intervention.
5
This document is a research report submitted to the U.S. Department of Justice. This reporthas not been published by the Department. Opinions or points of view expressed are thoseof the author(s) and do not necessarily reflect the official position or policies of theU.S. Department of Justice.

Figure 2.1 Jersey City Problem-Oriented Policing Program:
I Public Housing Sites I
This document is a research report submitted to the U.S. Department of Justice. This reporthas not been published by the Department. Opinions or points of view expressed are thoseof the author(s) and do not necessarily reflect the official position or policies of theU.S. Department of Justice.
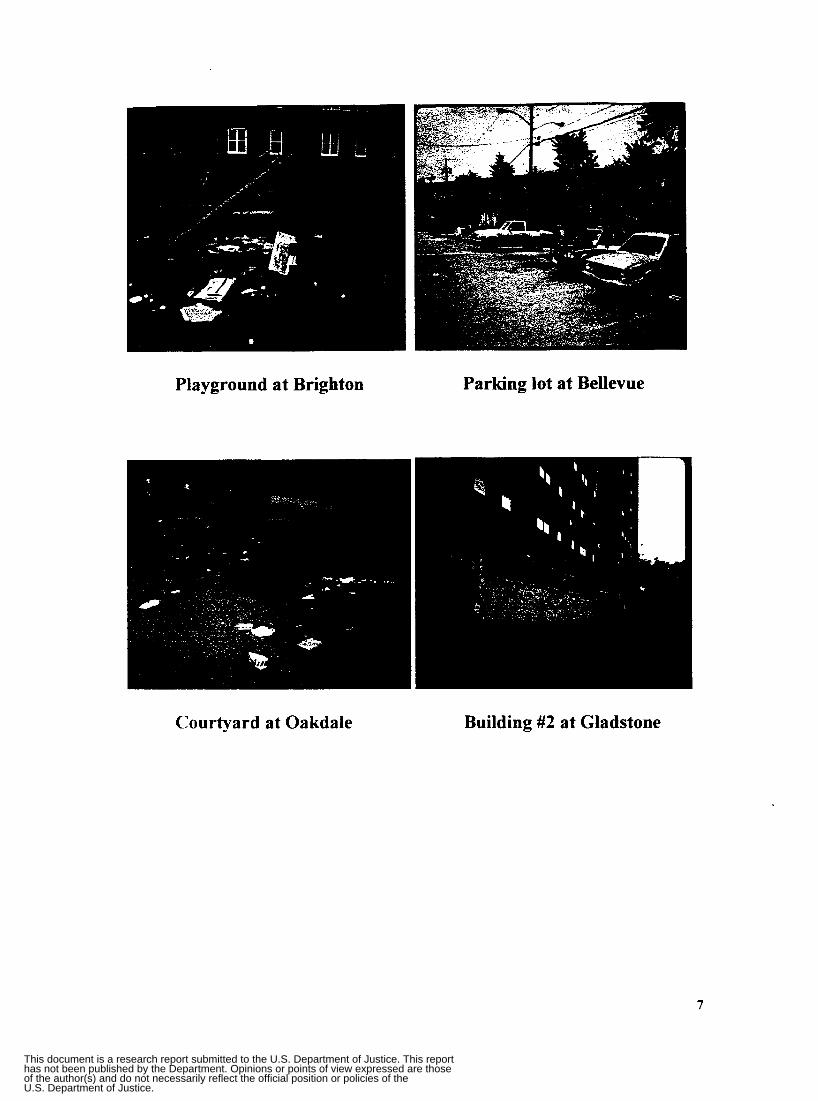
Playground at Brighton Parking lot at Bellevue
Courtyard at Oakdale Building #2 at Gladstone
7
This document is a research report submitted to the U.S. Department of Justice. This reporthas not been published by the Department. Opinions or points of view expressed are thoseof the author(s) and do not necessarily reflect the official position or policies of theU.S. Department of Justice.

Elevator at Gladstone Stairwell at Gladstone
Lobby at Gladstone Backdoor Building #4 at Oakdale
8
This document is a research report submitted to the U.S. Department of Justice. This reporthas not been published by the Department. Opinions or points of view expressed are thoseof the author(s) and do not necessarily reflect the official position or policies of theU.S. Department of Justice.

Chapter Three:
The Jersey City Public Housing
Problem-Oriented Policing Program
In October 1994, the National Institute of Justice sponsored the University of Cincinnati
to partner with the Jersey City Police Department and the Jersey City Public Housing Authority
(JCPHA) to implement and evaluate a problem-oriented policing program to address serious
crime problems in six high crime public housing sites in the city. This chapter describes the
program intervention.
3.1 Public Housing Site Teams
t
We began our project by creating problem-oriented policing “site teams” in each of the
participating public housing sites. Each site team consisted of seven members who represented
the interests of each of the larger communities: a police lieutenant who served as the project
I c x k r . t\\o communip service officers (CSOs), one site-based police officer. one civilian site
manager, one social service liaison officer, and one or more tenant representatives. Over the
course of a 12-month intervention period (from May 1995 through April 1996) each site team
met for monthly meetings to identify the places within the public housing sites that were causing
most of the serious crime problems, to discuss these place-specific crime problems, to coordinate
problem-solving strategies. and to report on the status of problem-solving activities implemented
each month. An evaluation coordinator documented the amount, location, and nature of problem-
solving tasks completed from month to month, as well as contextual information about the
teams‘ progress through the stages of the problem-solving SARA model (Scanning. Analysis,
9
This document is a research report submitted to the U.S. Department of Justice. This reporthas not been published by the Department. Opinions or points of view expressed are thoseof the author(s) and do not necessarily reflect the official position or policies of theU.S. Department of Justice.

Response, Assessment) and any obstacles that were encountered. Our field researchers also met
face-to-face and contacted site team memb-9 by phone on a weekly basis to track their progress
on assigned problem-oriented policing activities.
3.2 Identifying and Analyzing Places with Problems
Applying the problem-oriented policing process to controlling crime problems in public
housing necessarily requires an understanding of the distribution and causes of crime problems
within public housing sites. However most public housing crime problems are approached from a
"one-size-fits-all" perspective, when public housing sites have drug problems, housing
authorities often introduce drug treatment programs or increase levels of traditional drug
enforcement efforts site-wide; when public housing sites have problems with unemployed
people, job skills training programs are established. Innovative tactics are used to address public
housing problems, but the problems are seen as universal not only among many public housing
sites. but also within public housing sites.
Our project in Jersey City took a somewhat different approach to controlling problems in
public housing: we began with the premise that public housing sites differ from one site to the
n s s t and me suggest that even within public housing sites, some places (like some playgrounds
and some building lobbies) will have problems, while others will not. Consistent with
en\.ironmental criminology in general (see Brantingham and Brantingham, 198 1) and hot spots
of crime studies in particular (see Pierce. Spaar and Briggs. 1988: Sherman. Gartin and Buerger,
1989. Sherman and Weisburd, 1995; Weisburd and Green, 1994; 1995) we suggest that some
p l ~ e s 3re more crime-prone than others and that even within crime-ridden public housing sites
there u i l l be places that escape crime problems. We propose that the physical, spatial, cultural,
Isgal. 3nd ps) chological cues of common area places within public housing environments will
10
This document is a research report submitted to the U.S. Department of Justice. This reporthas not been published by the Department. Opinions or points of view expressed are thoseof the author(s) and do not necessarily reflect the official position or policies of theU.S. Department of Justice.

impact the way that offenders create '-cognitive maps" of suitable targets (e.g. see Brantingham
and Brantingham. 198 1). These cognitive maps will thus shape th- qature and distribution of
crime and disorder hot spots within these public housing areas. The corollary is that problems
within public housing locations will have varied causes and thus varied responses should be
applied to solve (or reduce) the problems.
The following sections present our problem identification process in public housing that
shifts the unit of analysis from high crime addresses (e.g. public housing sites) to very specific
locations (e.g. playgrounds, buildings, and walkways) within high crime public housing sites.
From the outset, we expected that certain areas in gublic housing sites such as building lobbies.
parking lots, and playgrounds would be more crime-prone than others. The problem-solving
teams in each of the public housing sites in Jersey City used the SARA approach to problem-
oriented policing to tailor problem-solving responses and specifically target high priority
problems.
Crime Problems in Public Housinz
For the calendar year of 1993, Jersey City's six housing projects were the target of 881
arrests (five percent of all arrests in the city). Of the 88 1 total arrests in the six sites, nearly 40
percent were for narcotics violations, 9 percent were for assault, 2 percent were for robbery, and
the remaining 48 percent were for other offenses. Of all persons arrested, 22 percent were under
18 >.ears of age, 89 percent were male and 78 percent were African American. Table 3.1 displays
the distribution of these arrests across the six public housing sites.
1 1
This document is a research report submitted to the U.S. Department of Justice. This reporthas not been published by the Department. Opinions or points of view expressed are thoseof the author(s) and do not necessarily reflect the official position or policies of theU.S. Department of Justice.

Table 3.1: Arrests By Selected Crime Type By Public Housing Site
Fumber and Percent of Arrests parcotics Assault Robberv N Yo N Yo N YO
Oakdale 30 8.5 19 21.8 4 18.2 Gladstone 51 14.5 11 12.7 1 4.5 Woodlamm 164 46.6 26 29.9 9 40.9 I vanho e 60 17.0 15 17.3 3 13.7
Bellevue 20 5.7 9 10.3 4 18.2 Total 352 100 87 100 22 100
’ Brighton 27 7.7 7 8.0 1 4.5
Other N YO 86 20.5 53 12.6 128 30.5 89 21.2 32 7.6 32 7.6
420 100
Total N YO 139 15.8 116 13.2 327 37.1 167 18.9
~ 67 7.6 65 7.4
881 100
As this table shows, nearly half of all public housing narcotics arrests occurred in the
Woodlawn site (46.6 percent). Similarly, the Woodlawn public housing site generated the
greatest number of both assault and robbery arrests compared to the other five sites in our study.
Two of the low rise sites (Brighton and Bellevue) had the least numbers of arrests compared to
the other sites in our study
Common Areas in Public Housing Sites
’A’hile the six public housing sites in our study were universally identified as hot spots of
drug and violent crime activity since 1990 (see Weisburd and Green. 1994; 1995) our methods
for identifying “hot spots” did not provide insight about the variability of the problems or the
exact locations of the crime prone places inside the public housing sites. One of the biggest
hurdles to identifying hot spots in places with high population densities. such as public housing
sites and large apartment blocks, is getting data at a small units of analysis. The Jersey City
Police Department. as do many police departments, record public housing calls, arrests, and
investigations to the collective address of the public housing site, not to the specific locations
12
This document is a research report submitted to the U.S. Department of Justice. This reporthas not been published by the Department. Opinions or points of view expressed are thoseof the author(s) and do not necessarily reflect the official position or policies of theU.S. Department of Justice.
within the public housing sites where the problems occu?. Occasionally text fields will identifi
”the playground” as the crime location but provide limited information regarding which
playground. Recognizing this deficiency, we developed a strategy for identifving hot spots at
what we refer to as “common areas.”’ By treating the public housing sites as a series of different
problems occurring in different common areas allowed us to analyze the unique problem causes
and possible crime control responses for different problems within each public housing site.
The first step in our problem identification process was to delineate all common areas
across and within the six public housing locations. We defined “common areas” as:
“discrete public places within a public housing community that are used for the purpose of recreation, mobility, and routine interactions.”
We distinguished all common areas by their function and identified six broad types of common
areas: walkways, buildings, playgrounds, parking lots, rest areas, and community centers4. As
Table 3.2 shows, we identified 172 unique common areas across the six public housing sites.
\\’e recognize. however, the importance of being able to get official data at the common area level and we worked dn t h i , problem in two ways: First, we tagged (or marked) each of the common areas with a name tag. The Housing :\urhorit! erected signs identifying which common areas are which (Le. North End Parking Lot. Dales Street Parking Lot, Central Playground). Second, we made changes to the department’s computerized CAD system to enable call takers to ask specific questions as to where a particular event occurred. For example, call takers are prompted to ask a caller whether a fight is occurring in a playground, walkway, parking lot, etc, and then the call takers ask which particular playground, walkway, parking lot was the location where the crime occurred. A geofile of a11 the different ways that tenants, police, and housing authorities refer to common areas was created to increase the “match“ rate of calls to the common area level of analysis.
’ Li.hile our scanning process formed the basis for identification of hot spots at the common area level, official call for ser\,ict data formed the basis for identification of problem apartments within the public housing sites (see later). We identified those apartments generating the greatest frequency of calls at each of the housing sites. As was done t i ith the scanning analysis at the common area level, this information was presented to the site teams at their rnonthl>, meetings.
N:e defined “walkways” as any paved, outdoor passage for walking within a public housing complex; buildings as any roofed and walled structure built for permanent use (as for a dwelling) within a public housing complex; playgrounds as a piece of land within a public housing site used for and equipped with facilities for recreation, especiall!. by children; parking lots as any area within a public housing site used for the parking of motor vehicles; rest areas as a gathering area within a public housing area that typically contains benches and tables; and community centers as a building located in a public housing area designed for the purpose of bringing together residents with common interests
13
This document is a research report submitted to the U.S. Department of Justice. This reporthas not been published by the Department. Opinions or points of view expressed are thoseof the author(s) and do not necessarily reflect the official position or policies of theU.S. Department of Justice.

Table 2 2: Number and Percent Distribution of Common Areas by Site
Oakdale Gladstone Woodlawn Ivanhoe Brighton Beiievue Total
22 12.8 20 11.6 25 14.5 43 25.0 30 17.4 32 18.7 172* 100.0
The mean number of common areas in public housing sites in Jersey City was 28.7
As Table 3.2 shows, the three low-rise sites (Ivanhoe, Brighton and Bellevue) had the
c ereatest absolute numbers of common areas. Conversely, the three high rise sites had fewer
common areas. That is, they had fewer playgrounds, parking lots, rest areas, walkways, and
buildings.
Table 3.3 shows the distribution, in rank order, of the types of common areas across the
six public housing sites.
Table 3.3: Number and Percent Distribution of Common -4reas by Type
TvDe of Common A rea N %
Walkways Buildings Playgrounds Parking Lots Rest Areas Community Centers Total
54 31.4 52 30.2 29 16.9 21 12.2 13 7.6 3 1.7 172 100
This document is a research report submitted to the U.S. Department of Justice. This reporthas not been published by the Department. Opinions or points of view expressed are thoseof the author(s) and do not necessarily reflect the official position or policies of theU.S. Department of Justice.

As this table shows, the most frequent type of common area in public housing sites was
walkways (n=54 ) and the second most f k y e n t was buildings (n=52 ). In total. only three
community centers were found across the six public housing sites in Jersey City.
Identihino, Problems and Problem Places in Public Housing
Delineating common areas in public housing sites was an important first step in our
ability to identi@ the places within the public housing sites that had problems. However. \ve
wanted to know the types of p'oblems occumng in the common areas. Therefore, we asked each
member of our problem-solving teams' in each of the six public housing sites to complete a
"Problem Description Form." This approach allowed each site team member an opportunity to
draw "cognitive maps" of perceived hot spot locations inside the public housing. We also asked
site team members to identify the nature, type, and seriousness of each problem within the
housing sites' common areas.
Across the six public housing sites in our study, twenty-seven site team members
identified a total of 528 problems6 across 88 unique places. Table 3.4 presents the distribution of
problem identified by site team members in rank order.
' For each site. our problem solving teams comprised the Housing Authority site manager, a tenant representative, the social liaison officer, on-duty Community Service Officers, off-duty site based police officers. off-duty patrol officers. and our program coordinator (a sergeant from the police department who worked off-duty hours as the Jerse! Cit) Housing Authority security coordinator).
' The 528 problems are not mutually exclusive because different site team members could identify the same problem To help site teams prioritize the problems they would tackle as a team we used a weighting system that took into account those problems that were identified by more than one site team member (see later).
This document is a research report submitted to the U.S. Department of Justice. This reporthas not been published by the Department. Opinions or points of view expressed are thoseof the author(s) and do not necessarily reflect the official position or policies of theU.S. Department of Justice.

Table 3.4: Number of Problems by Type
Type of Problem N
D N ~ S Loitering Lewdness Graffiti Loud Music Drinking Litter AssaultsRights Parking l~omestics ‘Xobbery r3UrglaI-y Other Total
92 78 70 63 50 43 32 26 24 12 5 3
29 528
As this table shows, drugs were the most commonly identified problem in the public
housing sites (n=92), followed by loitering (n=78), lewdness (n=70), and graffiti (n=63). When
Lve examined the rank ordering of problems for each individual public housing site, drugs were
tiit. most commonly identified problem in four of the public housing locations (Oakdale,
Gladstone. Ivanhoe. Brighton). Nonetheless, our analysis also shows that some problems are
more pre\.alent in some public housing sites than others: at Bellevue, the most commonly
identified problem was litter, while lewdness (mainly urinating in public) was identified as the
most frequently occumng problem at Woodlawn.
In completing the “Problem Description Forms” site team members were asked to mark
the exact locations of problenis on a detailed map of each public housing site. In essence, we
asked site team members to draw their own “cognitive maps” of places within the public housing
~ ~~
Of the 525 problems identified, 13 problems were not clearly specified to a common area location. Rather, they uere problems that occurred throughout the site. These were classified as site wide problems.
16
This document is a research report submitted to the U.S. Department of Justice. This reporthas not been published by the Department. Opinions or points of view expressed are thoseof the author(s) and do not necessarily reflect the official position or policies of theU.S. Department of Justice.

sites that they felt had drug or violent crime problems. This process allowed us to identifj- the
places both across and within public housing sites that site team members perceived we. 7
generating the majority of problems.
By examining the distribution of problems across the public housing sites we found that
some public housing sites have a greater proportion of common areas with problems than others.
Table 3.5 below presents the percent of common areas by public housing site with identified
problems.
Table 3.3: Number and Percent of Common Areas with Problems by Site
& N of Commo n Areas l?J with Problem % with Problems
Oakdale Gladstone Woodlawn Ivanhoe Brighton Bellevue Total
22 20 25 43 30 32
172
14 6
16 9
24 19 88
64 30 64 21 80 59 51
As this table shows, site team members perceive that only about half of all common areas
(n=S8: 5 1 percenr) have some type of drug, disorder or violent crime problem. When the
distributions of problems are examined across public housing sites, our data show that the six
nublic housing sites in Jersey City experience very different distributions of problems. For
tssample. 2 1 percent (n = 9 of 43) of the common areas at Ivanhoe were identified as having a
problem. By contrast, 80 percent (n = 24 of 30) of Brighton’s common areas were seen as having
;it least one perceived problem.
ii’hile our analysis so far suggests that crime problems are unequally distributed both
across public housing sites and within public housing common areas, our next table shows that
distribution patterns can be partly explained by type of common area. Table 3.6 below presents
17
This document is a research report submitted to the U.S. Department of Justice. This reporthas not been published by the Department. Opinions or points of view expressed are thoseof the author(s) and do not necessarily reflect the official position or policies of theU.S. Department of Justice.

the number and percent of common areas with identified problems by type of common area.
Table 3.6: Number and Percent of Common'Areas with Problems by Type
TyDe of Common A rea u N with Problems - YO
Building Playground Walkway Parking Lot Rest Area Community Center Total
52 29 54 21 1; 3
172
38 11 16 15 6 2
88
73.1 3 7.9 29.6 71.4 46.2 66.7 --
As Table 3.6 shows, nearly three quarters of the buildings across the six public housing
sites are perceived as having problems. Site team members perceived that most of the problems
in buildings were (in rank order) in lobbies, stairwells, hallways, and elevators. The second most
problem-plagued area in the public housing sites were the parking lots. While there are only 2 1
parkin9 lots among the six public housing sites in our study, 7 1.4 percent of them were perceived
as ha\.ing a drug. disorder or violent crime problem. By contrast, only 16 of the 54 (29.6 percent)
of the \vall<tva>.s in our public housing sites were perceived as having a problem.
In our first stage of analysis we sought to assess the prevalence of problems across the six
public housing sites in our study. Our analysis revealed that crime is not evenly distributed
across all common areas in a public housing site. Rather, we know that in the aggregate about
half of the common areas were deemed "safe places" in public housing sites. However different
public housing sires had different distributions of crime problems. Some sites had crime
problems in many common areas while other sites had crime and disorder problems in a smaller
proportion of common areas. Moreover, when we examined the distributions of problems across
common area ppes we found that different common areas had different distributions of
This document is a research report submitted to the U.S. Department of Justice. This reporthas not been published by the Department. Opinions or points of view expressed are thoseof the author(s) and do not necessarily reflect the official position or policies of theU.S. Department of Justice.

problems. In the second stage of our analysis we explore whether different cornmon areas across
the six public hc-.;ing sites in our study generate different types of crime problems.
The problem-solving teams in our study suggested to our research team that different
types of places tended to attract different types of problems. Moreover. they intuitively felt that
different places in the public housing sites would require different types of efforts to solve the
problems. We used these general assessments by the site team members to explore the variabilic
in problems both within and across our six public housing sites. Our analysis of public housing
problems draws from the problem identification data described above (n = 5 15 problems in 88
common areas) as well as interviews with a random sample of 21 6 residents* across the six
public housing sites in our study. Specifically, we asked these residents to identify the common
area places that they ”avoided” because they perceived the place had a crime or disorder
problem. Drawing from these data sources, our analysis in this section includes the following
variables:
’ Prior to the implementation of problem solving responses across our six public housing sites, we conducted a survey of a stratified random sample of 300 residents. We successfully interviewed 216 residents (72 percent response rare). in the survey, among many questions, we asked public housing residents to identify places that they avoid within their public housing site.
19
This document is a research report submitted to the U.S. Department of Justice. This reporthas not been published by the Department. Opinions or points of view expressed are thoseof the author(s) and do not necessarily reflect the official position or policies of theU.S. Department of Justice.

Variables Percent
Avoid 0 = Residents do not avoid the common area 1 = Residents avoid the common area
0 = Low rise site 1 = High rise site
Building Walkway Playground Rest area Parking Lot Community Center
Disorder Problems9 0 = No disorder problem 1 = Disorder problem
0 = No drug problem 1 = Drug problem
Violent Crime Prob!emto 0 = No violent crime problem 1 = Violent crime problem
Hilow
Type of Place
Drug Problems
79.9 20.3
61.0 39.0
30.2 31.4 16.9 7.6 12.2 1.7
52.9 47.1
72.7 27.3
89.5 10.5
Drug. Disorder. and Violent Crime Problems in Diffe rent Common Areas
In this section we use a series of cross-classification tables to examine the distribution
patterns of drug. disorder, and violent crime problems across and within the six public housing
sites in our study. We also examine the different types of common areas that are associated with
drug. disorder, and violent crime problems. In Table 3.7, we present the numbers and percents of
common areas nith drug, disorder, and violent crime problems by public housing site.
Disorder problems included loitering. lewdness, graffiti. loud music, drinking, litter, and parking
"' Violent crime problems included assaults and fights, domestic violence, and robberies.
20
This document is a research report submitted to the U.S. Department of Justice. This reporthas not been published by the Department. Opinions or points of view expressed are thoseof the author(s) and do not necessarily reflect the official position or policies of theU.S. Department of Justice.

Table 3.7: Type of Problem in Common Areas by Public Housing Site
Oakdale Gladstone Wood lawn Ivanhoe Brighton Bellevue Total P-=
DrUg Disb.der Violent Crime N YO N YO N YO
6 12.8 5 10.6 12 25.5 6 12.8 12 35.5 6 12.8
47 100.0 ,024
14 17.3 6 7.4 15 18.5 5 6.2
24 29.6 17 21.0 81 100.0
.001
5 27.8
-- -- 18 100.0
.001
As this table shows, of the 47 common areas identified as having a drug problem, about a
quarter were located in Woodlawn and another quarter were located in Brighton. These two
public housing sites are geographically close (about 2 blocks from each other) in the East District
of Jersey City. Similarly, nearly 30 percent of the common areas identified as having a disorder
problem were located in Brighton. Beilevue’s common areas also contributed significantly to the
disorder problems across public housing sites (Ti = 17 common areas). For violent crime
problems. nearly three quarters of the common areas with violent crime problems came from
Brighton. Overall. this table suggests that Brighton contributes significantly to drug, disorder,
and violent crime problems when common areas with problems are compared across the sites.
Table 3.8 below, provides further support that the common areas in the low-rise public
housing sites (predominately driven by Brightonj contribute more places with drug, disorder, and
\,iolent crime problems than high rise sites in absolute terms.
21
This document is a research report submitted to the U.S. Department of Justice. This reporthas not been published by the Department. Opinions or points of view expressed are thoseof the author(s) and do not necessarily reflect the official position or policies of theU.S. Department of Justice.
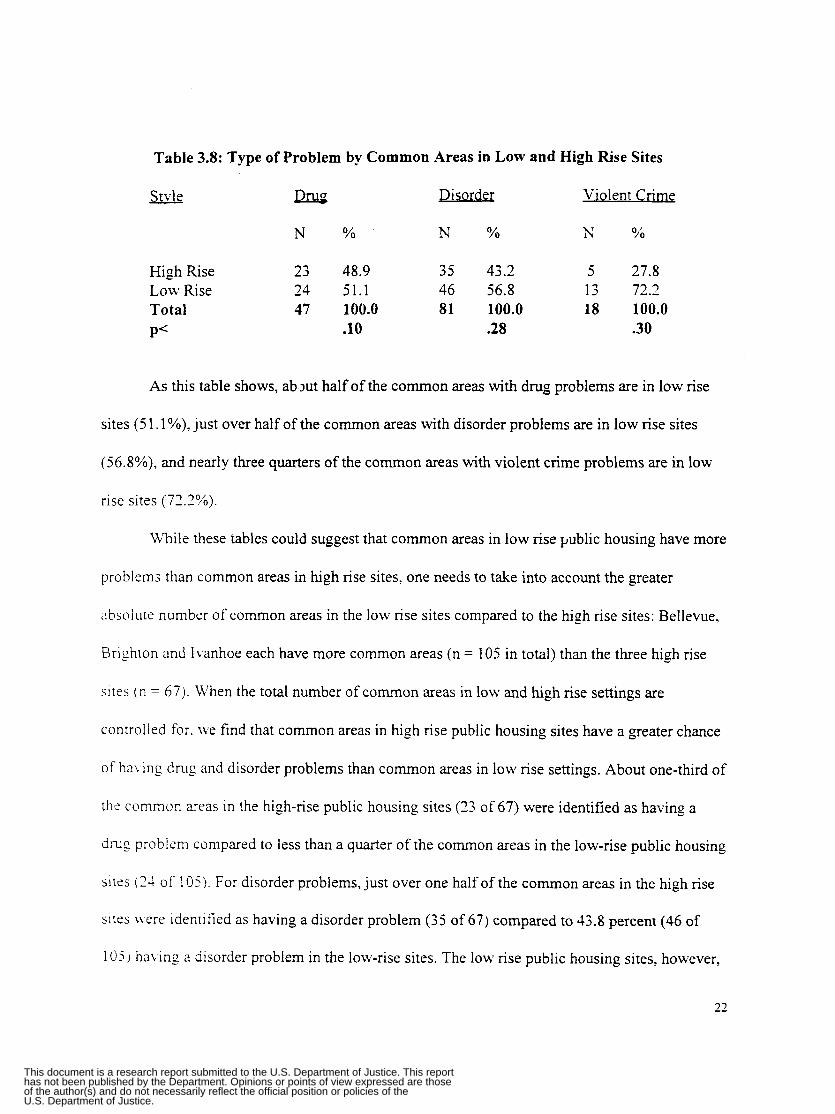
Table 3.8: Type of Problem by Common Areas in Low and High Rise Sites
Style Disorder Violent Crim e
N YO YO N YO N
High Rise 23 48.9 35 43.2 5 27.8 Low Rise 24 51.1 46 56.8 13 72.2 Total 47 100.0 81 100.0 18 100.0 P< .10 .28 .SO
As this table shows, ab.mt half of the common areas with drug problems are in low rise
sites ( 5 1.1 YO), just over half of the common areas with disorder problems are in low rise sites
(56.8%), and nearly three quarters of the common areas with violent crime problems are in low
rise sites (72.20h).
While these tables could suggest that common areas in low rise public housing have more
problems than common areas in high rise sites, one needs to take into account the greater
ahsolure number of common areas in the low rise sites compared to the high rise sites: Bellevue,
Brighton and Ivanhoe each have more common areas (n = 105 in total) than the three high r ise
sites ( n = 67). b’hen the total number of common areas in low and h g h rise settings are
controlled for. Lve find that common areas in high rise public housing sites have a greater chance
of ha\,ing drug and disorder problems than common areas in low rise settings, About one-third of
the common areas in the high-rise public housing sites (23 of 67) were identified as having a
drug problsni compared to less than a quarter of the common areas in the low-rise public housing
sites (21 of 105). For disorder problems, just over one half of the common areas in the high rise
sites nere idenrified as having a disorder problem (35 of 67) compared to 43.8 percent (46 of
1 U5) ha\%: a disorder problem in the loLv-rise sites. The low rise public housing sites, however,
22
This document is a research report submitted to the U.S. Department of Justice. This reporthas not been published by the Department. Opinions or points of view expressed are thoseof the author(s) and do not necessarily reflect the official position or policies of theU.S. Department of Justice.

had more (relatively speaking) common areas with violent crime problems (12.4%) than high rise
sites (7.5%).
Our finding that high rise public housing sites have a greater proportion of common areas
with drug and disorder problems than low-rise sites is consistent with a vast body of literature
that points to the criminogenic nature of high rise public housing sites (e.g. see Newman, 1973).
This finding is further supported when we examine the common area places that residents
identified as being “avoided places.” Table 3.9 presents the number and percent of common areas
by public housing site that residents believe are places they should avoid.
Table 3.9: Public Housing Site by Percent Common Areas that Residents Avoid
Oakdale Gladstone Woodlawn Ivanhoe Brighton Eellevue Total
- N Avoided YO Avoided -- 13 10 45.5 20 5 25.0 25 7 28.0 43 5 11.6 30 4 13.3 32 4 12.5 172 35 20.3
.As this table shows. the three high rise sites (Oakdale, Gladstone, and Woodlawn) have
the greatest proportions of common areas that residents avoid compared to the three low rise
sites. Residents identified ten of Oakdale’s common areas (45.5%) as being places they would
a\.oid compared to just five of Ivanhoe’s 43 common areas that residents would avoid.
While these preceding tables suggest that there are differences in the distribution of
common areas with drug. disorder, and violent crime problems across the six public housing sites
in general and between low and high rise sites in particular, we also wanted to explore the @pes
of common areas that generated most of the problems. Table 3.10 depicts the types of common
areas in the six public housing sites in our study with different types of problems.
23
This document is a research report submitted to the U.S. Department of Justice. This reporthas not been published by the Department. Opinions or points of view expressed are thoseof the author(s) and do not necessarily reflect the official position or policies of theU.S. Department of Justice.

Table 3.10: Type of Common Area by Type of Problem
Building Walkway Playground Rest Area Parking Lot Community Center Total P-=
Drugs N YO 28 59.6 7 14.9 7 14.9 5 6.4 2 4.3
47 100.0 .001
Disorder N YO 34 42.0 14 17.3 10 13.3 6 7.4 15 18.5 - 3 2 3 81 100.0
.002
Violent Crime N YO 10 55.6 4 - - I -
J 16.7
1 5.6
18 100.0
33 3 1
-- --
-- --
.19
As this table shows, over half of the 47 common areas with drug problems were
generated by buildings (59.6%). Similarly, buildings were places with disorder (42%) and violent
crime (55.6) problems. Walkways and playgrounds were two other common areas with drug
problems and parking lots and walkways contributed to disorder problems. Walkways were a
common area that tended to attract violent crime problems.
We also sought to determine whether there were any differences in the types of problems
among the different common areas across the six pubIic housing sites in our study. Table 3.1 1
summarizes the primary common areas that experienced different problems by public housing
site.
24
This document is a research report submitted to the U.S. Department of Justice. This reporthas not been published by the Department. Opinions or points of view expressed are thoseof the author(s) and do not necessarily reflect the official position or policies of theU.S. Department of Justice.

Oakdale
Gladstone
Woodlawn
Ivanhoe
Brighton
Bellevue
Table 3.11: Public Housi,g Site b? Type of Problem by Rank Order of Common Area with Problems
Drugs Dlsorder Violent Crime Buildings Buildings Buildings Playgrounds Parking Lots Playgrounds
Buildings Buildings ---- Parking Lots Parking Lots
Buildings Buildings Rest Areas Rest Areas Walkways Parking Lots
Playgrounds
Buildings Buildings Playgrounds
Buildings Buildings Play grounds Walkways Walkways P 1 ay gr ounds
Buildings Walkways Walkways Buildings
Parking Lots
Buildings Walkways Playgrounds
A s Table 3.1 1 shows, buildings were the most frequently cited common area generating
drug problems in all six public housing sites in our study. For Oakdale, Ivanhoe, and Brighton
the playgrounds were the second most often identified common area that had drug problems. The
ndk \va> . s kvere cited as drug problem areas, but not in the two most notorious high-rise sites:
Oakdale and Gladstone.
The buildings were identified as the primary places with disorder problems across all
sites in our stud>- except Bellevue. Belleme’s walkways were the most often cited common area
bvith disorder problems. The parking lots also figured prominently as places with disorder
problems principally in Oakdale and Gladstone. Finally, although buildings once again were
25
This document is a research report submitted to the U.S. Department of Justice. This reporthas not been published by the Department. Opinions or points of view expressed are thoseof the author(s) and do not necessarily reflect the official position or policies of theU.S. Department of Justice.

listed as the most crime-prone violent crime areas, Oakdale and Brighton identified the
playgrounds as places with violent crime problems.
Table 3.1 1 clearly illustrates the importance of examining varying problems in different
public housing sites at the common area level of analysis. Such an analysis is crucial for
problem-solving teams since it provides specific information on exact problems and exact
locations and allows teams to tailor their responses accordingly.
ing Problems for Problem-Solving Efforts in P ublic Housing
While the scanning and analysis stages of the problem-oriented policing project begin to
build a profile of crime-prone places across different types of common areas in public housing
sites, we thought from the outset that the problems and problem places identified by our site team
members varied by the incidence and seriousness of the problem. Therefore, we sought to
develop a seriousness score for identified problems within each of the public housing sites that
Lbould enable site team members to focus their problem-solving efforts on the highest priority
problems.
To rank order the 5 15 problems (in discrete common areas) by seriousness we developed
a problem scoring method comprising three components: first, we wanted to give greater weight
to identical problems identified by multiple site team members. For example, if three members
identified loitering as a problem in a particular parking lot of one public housing site, then we
\\anted the problem to receive more weight than a loitering problem in another parking lot in the
sanle housing site that was only identified by one site team member. Second, we wanted to make
sure that \\re gave more weight to those places that were identified more often as problem places
than those places that were identified less often as problem places. For example, if one particular
plrt\.ground was identified by site team members as being a hot spot of drug, loitering, and
26
This document is a research report submitted to the U.S. Department of Justice. This reporthas not been published by the Department. Opinions or points of view expressed are thoseof the author(s) and do not necessarily reflect the official position or policies of theU.S. Department of Justice.
gambling problems,,then we wanted the playground to receive greater weight than say a walkway
that was only identified by site team members as being a place where people drank in public.
Third, we wanted to take into account site team members' perceived seriousness of each problem.
As such, a perceived seriousness score was developed across four dimensions: fear associated
with the problem, the degree to which the problem was considered violent, the impact of the
problem on the public housing community, and the harm the problem causes the housing
community.
Taking these three components into account, we developed a seriousness score using the
following weighting system:
A = problem variable = n times problem identified B = place variable = n times place identified C = n.eighted problem variable = l/n times problem identified* 10 D = v.eighted place variable = l/n times place identified* 10 E = total effect variable = fear+violent+harm+impact/4 F = total \veight problem =l/n times problem identified*lO +
G = total \veight place = l /n times place identified* 10 + fear+violent+harm+ impact/ 4 (C + E)
fear+violent+harm+impact/4 (D + E)
Final Score = total weight problem (F) + total weight place (G)
Overall, those problems identified most frequently by site team members (e.g. drugs,
loitering. lewdness. graffiti) also ranked high on our final seriousness score. This result formed
the first basis for site teams to select and prioritize problems to tackle.
Th;e also examined the distribution of problems by type of place and level of seriousness
( see Table 3.12). Table 3.12 shows that problem-solving team members perceive that buildings
and, to a much lesser extent, playgrounds and walkways are places with the most serious
problems.
27
This document is a research report submitted to the U.S. Department of Justice. This reporthas not been published by the Department. Opinions or points of view expressed are thoseof the author(s) and do not necessarily reflect the official position or policies of theU.S. Department of Justice.

Table 3.12: Distribution of Problems by Level of Seriousness and Type of Place
PLACE N YO
Building 172 77.8 Walkway 26 11.7 Playground 22 10.0 Rest Area 1 0.5 Parlung Lot 0 - C’ty Center 0 --
LEVEL OF SERIOUSNESS
Moderate
YO hT
120 54.8 18 8.2 44 20.1 14 6.4 21 9.6 2 0.9
Low
YO N
38 50.6 14 18.7 6 8.0 2 2.7 13 17.3 2 2.7
Total
YO N
330 64.0 5 8 11.3 72 14.0 17 3.3 34 6.6 4 0.8
TOTAL 221 100 219 100 75 100 515 100
As this table shows, for those problems classified as being in the “most serious” category,
o\rer three-quarters of the problems (77.8 percent) were seen as being in and around the buildings
( e . g lobbies, entrance ways). Similarly, site team membcrs perceive that the buildings are places
with moderate and low levels of problems. From discussions with site team members, we believe
that these results have several explanations: first, buildings are where most of the drug, violent
crime. and disorder problems occur in public housing sites. Indeed, our results suggest that site
ream members perceive that serious and less serious problems tend to cluster around the
buildings. Second, public housing residents cannot avoid buildings and their “comings and
goings“ in and out of the buildings afford a heightened chance for observing problems. Therefore
any problems in buildings are most likely to be seen as the most serious. Third, there may be
more general activity in playgrounds, walkways, and parking lots, perhaps masking drug and
disorder problems in these places. For example, places with functional uses, such as parking lots
and playgrounds, may give “cover” for illicit drug activity. However, ths same illicit activity in
buildings does not go unnoticed because buildings cannot be avoided. These results were used as
28
This document is a research report submitted to the U.S. Department of Justice. This reporthas not been published by the Department. Opinions or points of view expressed are thoseof the author(s) and do not necessarily reflect the official position or policies of theU.S. Department of Justice.

second basis for site teams to prioritize the problems that they would tackle as part of the
problem-ori,_-ted policing program.
3.3 Identifying and Analyzing Apartments with Problems
Apart from problems in common area places, we also identified probiems in individual
apartments. Domestic violence, burglary, vandalism, drug selling and other problems occurring
in apartments were identified by the number of calls for service that individual apartments
generated during the year prior to the intervention period. Table 3.13 shows the distribution of
calls to apartments across the six sites in our study.
Table 3.13: Number and Percent of Calls for Service in Public Housing Apartments
N Calls 0 1 2 3 4 5 6 7 8 9 1 o+ Total
N Apartments 1329 495 3 07 144 96 44 38 24 18 16 44 2555
Percent 52.0 19.4 12.1 5.6 3.8 1.7 1.5 0.9 0.7 0.6 1.7
100.0
As Table 2.13 shows, 44 apartments each generated more than ten calls for service in
1994 and several units produced more than twenty calls in that same year. Consistent with the
hot spot literature in general (see Sherman, Gartin, and Buerger, 1989; Sherman and Weisburd,
1995). approximately 7 percent of all the site apartments (N=184) generated 50 percent of the
calls across the six housing sites (see Table 3.13). The ten households generating the most calls
for non-trivial offenses (violent crime, property crime and drugs) in each public housing site
29
This document is a research report submitted to the U.S. Department of Justice. This reporthas not been published by the Department. Opinions or points of view expressed are thoseof the author(s) and do not necessarily reflect the official position or policies of theU.S. Department of Justice.

were identified as "problem apartments" and subsequently targeted for intervention.
3.4 Developing and Implementinp P~oblem-Oriented:Policing Responses
Problem-oriented policing activities targeting nuisance apartments were geared toward
providing social and educational services to specific leaseholders, including referral to treatment
and counseling programs. The site teams used more intrusive measures -- such as evicting or
arresting residents -- when they assessed other problem-solving tactics as being inadequate to
solve the problem. Problem-solving efforts that targeted outdoor common areas focused on
changing the physical and social context in which crimes were occurring. For example, the site
teams initiated situational crime prevention tactics such as changing public pay phones to receive
out-going calls only and CPTED interventions such as improving lighting in some dimly lit
comers of one public housing site. Site teams also sought to control crime problems in common
areas using traditional policing tactics such as arrests, surveillances, investigations, order
maintenance. and enforcing open warrants.
In order to assess the problem-oriented policing responses delivered by the six site teams.
created a unit of assessment that lye defined as a "problem-solving activity.'' We define a
"problem-solving activity" as:
"the basic unit of action carried out by a site team member as part of a larger crime control strategy."
Progress by site team members on each strategy and on each discrete activity was tracked during
the one year intervention period every TWO weeks by our evaluation team. We documented the
person responsible for each activity, what activities were completed, what activities were
forgotten, bvhat activities were carried over from week to week and month to month (e.g. sweeps
scheduled every month), as well as those activities that were ongoing (e.g. court proceedings to
30
This document is a research report submitted to the U.S. Department of Justice. This reporthas not been published by the Department. Opinions or points of view expressed are thoseof the author(s) and do not necessarily reflect the official position or policies of theU.S. Department of Justice.

evict a tenant).
Most strategies initiated by the problem-solving site .r ms consisted of nvo or more
tightly-linked activities that were carried out sequentially. For example. a strategy to evict a
Bellevue tenant who had been selling crack cocaine out of her apartment involved five activities:
(1) the CSOs obtained a warrant to search the premise; (2) the narcotics unit subsequently raided
her apartment; (3) an arrest was made; (4) the site manager followed up the arrest by issuing a
notice to cease for the pending criminal charges; and (5) finally, the manager scheduled a
tenancy hearing. which caused the tenant to abandon her lease shortly thereafter.
Each activity chain was dissected to quantify what activities were completed over time
and space as well as those activities that were either carried over or forgotten. Figure 3.1
illustrates the overall problem-solving dosage administered by each site team, measured by the
number of problem-oriented policing activities completed during the 12-month intervention
period.
31
This document is a research report submitted to the U.S. Department of Justice. This reporthas not been published by the Department. Opinions or points of view expressed are thoseof the author(s) and do not necessarily reflect the official position or policies of theU.S. Department of Justice.

Figure 3.1. Problem-Oriented Policing Activities by Public Housing Site
J
Our evaluation team recorded a total of 602 assigned activities during the one year
inten.ention period: 364 activities were completed, 144 activities were defined as ongoing
activities. and 94 activities were abandoned or forgotten. Three sites -- Oakdale, Gladstone, and
Brighton -- received high levels of problem-solving treatment, each exceeding 60 problem-
solving activities during the one year intervention period. Figure 3.2 illustrates the trend in
problem-sol\,ing activities over time.
This document is a research report submitted to the U.S. Department of Justice. This reporthas not been published by the Department. Opinions or points of view expressed are thoseof the author(s) and do not necessarily reflect the official position or policies of theU.S. Department of Justice.

Figure 3.2. Problem-Oriented Policing Activities Over Time
60 - 50
40
Completed - - - - Abandoned or Reassigned
As Figure 3.2 shows, we documented a steady increase in unique problem-solving
activities completed each month (the count of problem-solving activities each month is not
cumulative from the previous month) from July 1995 through May 1996. Figure 3.2 also shows
an initial increase then a steady decline in the number of problem-solving activities either carried
over month-to-month or abandoned. This suggests that the site teams were initiating and
following through on more problem-solving activities as the program matured.
Figure 3.3 depicts the three major types of problem-oriented policing activities (police,
housing authority, social service) implemented by the site teams.
33
This document is a research report submitted to the U.S. Department of Justice. This reporthas not been published by the Department. Opinions or points of view expressed are thoseof the author(s) and do not necessarily reflect the official position or policies of theU.S. Department of Justice.

Figure 3.3. Types of Problem-Oriented Policing Activities by Public Housing Site
b)
m W Y
- 8
Service i
Police Stratepies Activities Arrest specific person 170 Investigate problem 49 Enforce open warrants 13 Order maintenance Housing Authoritv Strat- Evict public housing resident Create housing policy Coordinate program or event Improve physical design
69
21 8
31 62
Improve communication 62 Social Service Strategies Provide treatment or counseling Increase employment opportunities Educate residents
51 31 19
Prevent truancy 16
34
This document is a research report submitted to the U.S. Department of Justice. This reporthas not been published by the Department. Opinions or points of view expressed are thoseof the author(s) and do not necessarily reflect the official position or policies of theU.S. Department of Justice.

As Figure 3.3 shows, polict ,fficers were responsible for carrying out the majoric of the
problem-solving activities assigned during the course of the program. These enforcenirnt-
oriented strategies included arresting specific key suspects, investigating the circumstances
contributing to a problem, enforcing open warrants, and strategically targeting incivilities (order
maintenance). The Public Housing Authority implemented somewhat fewer problem-oriented
policing activities than the police. Public housing authority strategies included evicting residents.
creating and enforcing new housing policies, coordinating crime prevention events, improving
the physical design of housing areas (CPTED), and implementing new measures to improve
communication between the housing authority and residents. Only a handful of social service
strategies were implemented within the six study sites. These social service strategies included
referring residents to treatment or counseling, advertising employment opportunities for residents
(i.e., creating job banks), educating residents (i.e., teen pregnancy awareness and anti-violence
campaigns). and working with truancy officers.
Figure 3.3 indicates the majority of problem-oriented policing activities were police-
executed tactics at both Gladstone and Brighton. At Oakdale, by contrast, many of the responses
were orchestrated by public housing authority employees. At tirst glance, this suggests that the
coercive authority of the police is more effective in controlling crime in public housing than the
different tactical responses that are available to public housing employees". However, it is
important to recognize that all problems and strategies were identified, organized, and carried out
within the site-team context. Simply because the strategy to evict a nuisance apartment was the
" We point out that. in Jersey City, public housing sites are policed by the Jersey City Police Department and not a separate public housing police department.
35
This document is a research report submitted to the U.S. Department of Justice. This reporthas not been published by the Department. Opinions or points of view expressed are thoseof the author(s) and do not necessarily reflect the official position or policies of theU.S. Department of Justice.

responsibility of the housing authority (and therefore classified as a "housing authority StrateoV") 1-
does not mean that housing employees are exclusively invcj: sd in carrying out each link in a
chain of activities that comprises that strategy. As demonstrated in the earlier eviction exampie,
many or sometimes all of the individual activities leading to the final act of evicting a
leaseholder (Le., obtain search warrant, raid apartment, arrest specific actor) may involve police
or social service assistance. Similarly, coercive police strategies structured for the arrest of a key
suspect (i.e., drug supplier) will usually involve the participation of the housing authority or the
social service liaison to provide lease information, remove boarders involved in the drug trade, or
to locate potential informants. In this context, a police strategy should not be seen as a series of
law enforcement activities, rather a complex sequence of planned group responses. The sworn
site-based officers were effective precisely because so many of their responses were contingent
upon the group dynamics of the site team.
Our process analysis sheds light on the nature of decision making and the flow of
information within the team structure which contributes to our understanding why Gladstone and
Brighton emerged as the sites with the most successful problem-oriented policing teams.
IHousing employees, tenants, and the social service liaison in the Gladstone and Brighton site
teams saw their role as one of providing reliable infomation to the site-based officers so they
could make informed decisions and respond more effectively. This flow of information was, for
the most part. non-reciprocal. The police internalized their role as the "receivers" and reinforced
t h s non-reciprocal flow of information by sometimes balking on their duty to exchange
information and by often proposing problem-oriented policing strategies to other members of the
group that placed them on the receiving end. For the most part, however, all parties adjusted to
this arrangement and the two groups were quite organized during the analysis and responses
36
This document is a research report submitted to the U.S. Department of Justice. This reporthas not been published by the Department. Opinions or points of view expressed are thoseof the author(s) and do not necessarily reflect the official position or policies of theU.S. Department of Justice.

stages.
3.5 Site Team Membership
These results suggest that coercive police activities may have a stronger impact on crime
problems than less coercive activities. We suggest, however, that membership and attendance at
site team meetings comprise two other important factors why Gladstone and Brighton
demonstrated reductions in calls for service. We explore these issues in Table 3.14.
Table 3.14 shows that membership of the Gladstone and Brighton site teams, particularly
the site-based police officers assigned to these teams, was stable throughout the intervention
period. By contrast, we documented a tremendous amount of turnover in the membership of the
other site teams (Oakdale in particular). We suggest that the stability of personnel on problem-
solving teams, particularly police membership, is perhaps one of the most important contributing
factors in successful problem-solving. This result also suggests that problem-oriented policing
programs in otherwise resistant public housing sites (e.g., Gladstone which is a high-rise housing
complex mith a high rate of unemployment. single adult households. and high rates of AFDC
recipients) that make an effort to maintain stable membership of personnel assigned to problem-
solving teams are more likely to impact crime problems than teams that have a high rate of
personnel turnover (see also Green, 1996).
37
This document is a research report submitted to the U.S. Department of Justice. This reporthas not been published by the Department. Opinions or points of view expressed are thoseof the author(s) and do not necessarily reflect the official position or policies of theU.S. Department of Justice.

Tablc 3.14. I’roiilc o l ’S i x I’ublic I lousing Site ’reams in Jersey City
r
Site Number of Number ol’ Average YO Police ‘XJ I’IIA Y Social Service Meetings D i f fe re n t Attendance per Attendance Attendance Attendance
A tteridees Meeting c
Oakdale I 1 15 6.64 50.68 26.03 9.59 Gladstone 9 22 7.56 54.4 1 27.94 5.88 Woodlawn I 1 I O 6.64 49.32 28.77 6.85 I va 11 hoe 8 12 7.13 45.61 33.33 8.77 Brighton I 1 I I 5.64 58.06 24.19 I .61 €3 e I I e w e 6 8 6.67 52.50 22.50 15.00
Source: Weekly site teain progress reports and inontlily narratives. Note: The last three columns do not add up to 100% because the % researcher attendance was omitted.
This document is a research report submitted to the U.S. Department of Justice. This reporthas not been published by the Department. Opinions or points of view expressed are thoseof the author(s) and do not necessarily reflect the official position or policies of theU.S. Department of Justice.

Chapter Four:
Calls for Service
We assess the impact of the problem-oriented policing p r o p r n implemented in Jersey
City from two and a half years of citizen calls for police service (January 1994 through July
1996). Calls for police service comprise a common source of outcome information for many
police interventions (see Mazerolle and Roehl, 1998; Sherman, Shaw and Rogan, 1995; Sherman
and Weisburd, 1995; Warner and Pierce, 1993; Weisburd and Green, 1995). Indeed, Sherman
and his colleagues argue that calls for police service “provide the widest ongoing data collection
net for criminal events in the city” (Sherman, Gartin and Buerger, 1989:35). Similarly, Warner
and Pierce argue that calls for service data are biased only by citizens’ willingness to report
crimes’‘ (Warner and Pierce, 1993 :5 12).
Researchers who use calls for service data, however, are not without their critics. Klinger
an3 Bridges (1997). for example, argue that calls for service are biased because they do not
include crimes that come to police attention through means other than police dispatch centers;
because callers can provide misleading information (see also Reiss. 1971); and because they
consist of uhat police call takers record about what citizens tell them (see also Gilsinan, 1989).
0~ erall. Klin_eer and Bridges (1 997) identify three types of error in calls for service crime counts:
calls identified as non-criminal events that are in fact criminal activity (false negatives), callers
that ciassifi non-criminal behavior as criminal (false positives). and calls that misclassifj the
nature of criminal incidents (crime misclassificationi. They conclude that calls for service data
under count the amount of crime officers encounter on patrol (by about 23 percent), that the
counting bias \.aries by crime type -- over counting burglary by about 3 percent, under counting
39
This document is a research report submitted to the U.S. Department of Justice. This reporthas not been published by the Department. Opinions or points of view expressed are thoseof the author(s) and do not necessarily reflect the official position or policies of theU.S. Department of Justice.

violent crimes (assault, sexual assault and robbery) by about one third. and under counting
trespassing by about 5 1 percent -- .. ..d that errors in calls for service crime counts v a y
systematically across space (1 997:7 19-720).
We propose that calls for service provide a reasonable measure of serious crime
problems, particularly violent and property crimes in public housing sites. Indeed. our data show
consistently higher levels of reporting these serious types of crime problems (about fifieen calls
per month) than disorder problems (about seven calls per month). Our systematic social
observations of behavior and vhysical conditions in common areas in these six public housing
sites, however, documented many more instances of disorderly behavior". As such, we propose
that calls for service regarding more serious crimes in public housing sites comprise an adequate
measure of serious crime activity. Calls for service data however, seem less useful as a measure
of public disorder problems in public housing sites. Our work in the public housing sites suggest
that residents tend not to call the police about things they might consider to be trivial eveats, Iike
loitering. drinking in public, urination, trespassing. and suspicious persons. As one tenant
representatiL e suggested, "the police have bigger fish to fry" and many public housing tenants
be1ieL.e calling the police would be a waste of time because the incident is usually over by the
time they arri\fe
'I b e conducted a series of independent observations in each ofthe common areas over five time periods spanning the period of our project. We conducted five waves of observations (spring 95, summer 95, fall 95, winter 96, spring 96). we conducted four observations per wave (weekday day, weekday night. weekend day. weekend night) across 172 common areas. In total we collected 3200 observations across the six public housing sites over the period of our problem-oriented policing project. The results of these observations are reported in Chapter 5.
40
This document is a research report submitted to the U.S. Department of Justice. This reporthas not been published by the Department. Opinions or points of view expressed are thoseof the author(s) and do not necessarily reflect the official position or policies of theU.S. Department of Justice.

4.1 Analytic Strategy
The empirical models presented in this chapter ex-nine repeated measures of calls for
police service at 60 equally spaced points in time (from January 1, 1994 to June 30. 1996). Our
specific research questions demanded that we examine changes in calls for senice both across
and within public housing sites, as well as any changes in the different categories of calls for
service (especially violent crimes, propem, and drugs). We wanted to measure the specific
impact of problem-oriented policing activities on calls for service over time and also compare
these trends across sites. With these research questions in mind, we employed a mixed model to
measure the impact of the intervention on different call categories across the six housing sites
over 30 months (60 two-week intervals). The mixed model, also considered a multi-level model,
is one method for analyzing time-series data while, at the same time, allowing one to examine the
nested effects of a co-variate. In our case, the mixed model allowed us to exarnine both changes
in calls (by type) over time as well as the individual impacts of problem-oriented policing
acti\ities in each site.
The mixed model draws upon an autoregressive covariance structure (ARI) that is
specific to time-series data. For our study, the autoregressive model was designed to measure the
impact of problem-oriented policing on serious crime across housing sites over repeated
measures. Repeated measures of call data were matched to each public housing site and then
aggregated to evenly spaced ?-week intervals (N = 60): 32 observation points prior to the
intenention, 23 points during the intervention, and 4 points of follow-up data. The mixed model
is thus fitted to time-series data containing two levels of analysis: time is considered the level 1,
within-subjects factor where different measurements on the same subject (housing project) are
obsened at different points in time; and site-level variables comprise the level-2, between-
41
This document is a research report submitted to the U.S. Department of Justice. This reporthas not been published by the Department. Opinions or points of view expressed are thoseof the author(s) and do not necessarily reflect the official position or policies of theU.S. Department of Justice.

subjects factor, where differences in treatment (problem-oriented policing activities) and
population characteristics (e.g percentage of AFDC recipients, building style, number of units)
can be measured between "subjects," which in this case is between public housing sites (see
Littell et al., 1996). As such, the purpose of the mixed model was to compare n-ithin- and
between-subject calls for service trends over time.
The mixed model fits these data and our specific research questions for several reasons.
Simple linear models assume that between-subjects predictors and their error terms are mutually
independent and that the variance of the error terms is constant. By contrast, the mixed model
comprising an autoregressive covariance structure does not assume that error terms are mutually
independent. The mixed model specification implies that the volume and type of calls for service
observed at a given point in time may depend upon enduring events or conditions in a particular
site. and that random variations in calls will operate on large intervals of time rather than on
singular observation periods. In other words, circumstances such as the management style, the
stability of a drug market. or strategic problem-oriented policing activities in a public housing
sitc may have a collective impact on a block of observation points. A reverse-sting operation, for
esaniple, that disrupts a street-level drug market at Oakdale at period 4 may have a lagged effect
on calls obsened at period 5, and perhaps later periods.
LVith time series data we could not assume that observations within a site would be
equall), correlated. As such, the basic assumptions of simple linear models would have been
L iolated. Moreover, in most time-series data sets, observations at adjacent points in time are
more highly correlated than observations at distant times. Analysis of these data, therefore,
requires the within case covariance to be removed. The mixed model approach does this by
applying a parametric structure to the covariance matrices, where the covariance of the estimates
42
This document is a research report submitted to the U.S. Department of Justice. This reporthas not been published by the Department. Opinions or points of view expressed are thoseof the author(s) and do not necessarily reflect the official position or policies of theU.S. Department of Justice.

is assumed to be a function of the distance between two ob~ervations'~. The first order
autoregressive structure specifies that the covariance between two observations that are w
intervals-apart is oZpw, where w is the number of time intervals between obsen-ations. the
parameter 0' is the variance of an observation. Var(y,,,> = 0:. and p is the Correlation benveen
sequential observations on the same site. It follows that p is the correlation between observations
at times one and two, p2 is the correlation behieen observations at times one and three, PI' is the
correlation between observations at times one and four, and so forth (Littell et al., 1996). The
covariance structure assumed under an auto-correlation model is thus:
P2
P P2
P
-
pk-' .
1 .
. I
- P
P
1
PZ
P
The block diagonal matrix indicates that the covariance between measurements on the
same block is no longer assumed to be 0, and the variance of the error terms is not expected to be
constant. The models examined in this paper used the SAS PROC GLIMMIX option for a
i ' Another approach that incorporates non-independence would be to add an autocorrelation parameter to a traditional time series analysis. However, a major advantage of the SAS GLIMMIX procedure (mixed model proceaurej over time series analysis is that the mixed model will estimate uggregute treatment effects for all the sites together. as well as the nested(or individual) effects of problem-solving within each housing site. T ~ I - mixed model approach is thus more efficient than conducting seven time series analyses, six for the individual sites and another for the overall intervention.
43
This document is a research report submitted to the U.S. Department of Justice. This reporthas not been published by the Department. Opinions or points of view expressed are thoseof the author(s) and do not necessarily reflect the official position or policies of theU.S. Department of Justice.

Poisson probability distribution which is generally deemed appropriate for count data such as
these, in c5.hich there are a high frequency of e m p h cell counts in the data set making .. an
assumption of normality inappropriate. The mixed model approach then relies upon maximum
likelihood estimation or restricted mavimum likelihood estimation to assess the model goodness
of fit (see Waring, 1998; Searle et al., 1992).
3.2 Results
We present our resultsin four parts: first, we examine the impact of the problem-oriented
policing program across the six public housing sites in our study. Second, we compare the impact
of the problem-oriented policing program between the six study sites. Third, we discuss the
impacts of different types of problem-oriented policing activities and fourth, we present our
results that depicts the impact of the problem-oriented policing program on different crime
categories.
Overa!l Impact of the Problem-Oriented Policing Program
Table 4.1 presents the results of the first autoregressive mixed model" which examines
the cumulative impact of the problem-oriented policing program on serious calls for s e r ~ i c e ' ~ .
Building style, the number of units, and the percentage of households receiving AFDC (Aid to
Families with Dependent Children) are included as controls. Additionally, we control for the
inten.ention period of the time series data @re-intervention, during intervention, post-
1nten.ention). We also include the number of problem-oriented policing activities completed
dunng each nvo-bveek interval to measure the impact of the aggregate number of problem-
~
" All mixed models presented in this report include an extra-dispersion scale which adjusts the standard errors to accounr for over-dispersion This is appropriate because diagnostics (i.e. the Pearson Chi-Square/degrees of freedom and the devianceidegrees of freedom) indicate that there is over-dispersion in the models. Inclusion of the extra- dispersion scale correctly adjusts the estimation of the standard errors of the individual parameter estimates.
44
This document is a research report submitted to the U.S. Department of Justice. This reporthas not been published by the Department. Opinions or points of view expressed are thoseof the author(s) and do not necessarily reflect the official position or policies of theU.S. Department of Justice.

solving activities on calls for service across the six public housing sites. We included problem-
oriented policing activities as a L e d treatment effect rather than a random effect because the
decision to implement a problem-solving strategy was strategically determined by the site teams
and not randomly selected from a “population” of problem-solving activities. Indeed. one kvould
hope that within the SARA approach to problem-oriented policing that problem-solvers carefully
choose treatment activities that match their analysis of the problem rather than randomly select
responses that may or may not have a chance of success.
Table 4.1. Autoregressive Model for Overall Effects of Problem-Oriented Policing Activities on
Calls for Service Parameter Estimate T Pr > IT1
Intercept 1.9752 Time Period:
Pre-intervention -0.9762 Intervention -0.0077 Post-intervention -
Building Style -0.171 8 Total Units 0.00 17 Percent AFDC 0.0 159 POP Acti\.ity -0.02 16
14.28 0.0049
-1.03 0.3054 0.09 0.9270
- - -2.73 0.1118 7.04 0.0196 3.95 0.0584
-2.92 0.0037
Cov Parrn Estimate Z Pr > (ZJ
DIAG .4R ( 1 ) Residual
0.303 1 2.0149
5.63 0.0001 11.86 0.0001
Llodel Fitting Information
Akaike’s Information Criterion Schwarz’s Bayesian Criterion Likelihood Ratio Test (DF = 9) -2 REblL Log Likelihood Extra-dispersion scale
-76.3614 -80.2279 34.3828
148.7228 2.0166
~ ~~ ~~
1 ncludej persons. interpersonal, vehicle, assistance, propercy and drugs.
45
This document is a research report submitted to the U.S. Department of Justice. This reporthas not been published by the Department. Opinions or points of view expressed are thoseof the author(s) and do not necessarily reflect the official position or policies of theU.S. Department of Justice.

Our results show that sites with lon-rise (or walh-dp style) architectural designs, fewer
housing units, and a smaller percentage of M D C recipients had fewer calls for service over time
than high-rise sites. sites with larger numbers of housing units. and sites uith high rates of AFDC
recipients. These findings are consistent with the seminal research on public housing sites in
New York City conducted by Oscar Newman in the 1970s (Newman, 1973).
Our results also indicate that the aggegate number of problem-solving activities
implemented during each two-week observation period is a significant predictor of the trend in
calls for service over time. We find that an increase in the number of completed site team
activities is positively associated with reductions in calls for service over time. This finding is
consistent with the program goals and suggests that site teams that implemented a large quantity
of problem-solving tasks during the evaluation period directly impacted the number of serious
crime calls for police service in the six public housing sites.
To disentangle whether this impact was merely an ”announcement effect” - the result of
\irnplJ informing residents that a problem-solving program had been implemented - we
controlled for the time period (before, during or after program implementation) in the mixed
model analysis. As Table 3 shows, the categorical time period variable was not statistically
significant This suggests that it was not the intervention period itself that caused a reduction in
calls. but the number of problem-oriented policing activities completed during each observation
period That is. residents did not stop calling the police about crime problems simply because
the? \\ere a\\are of the program or some related period effect. Rather, this first model indicates
that there \vas something about the actual ffequency of problem-oriented policing activities that
contnbu:ed to changes in the number of calls for service.
46
This document is a research report submitted to the U.S. Department of Justice. This reporthas not been published by the Department. Opinions or points of view expressed are thoseof the author(s) and do not necessarily reflect the official position or policies of theU.S. Department of Justice.

We propose that this overall reduction in calls for service is not an artifact of senera1
reductions in calls for service across Jersey City over the'last several years. In facL. bur data
reveal a 4 percent decrease in calls for service citp-ide compared to a 25 percent decrease in
calls for service in the six public housing sites in our study.
The Differential ImDact of the Problem-Oriented Policin o Prooram - Betwe en Public HousinP
- Sites
. .
Table 4.2 seeks to answer whether there a difference in the impact of the problem-solving
intervention between the six public housing sites? Table 4.2 presents the results of an
autoregressive model that examines the nested (or separate) effects of the problem-solving
activities implemented by each of the six site teams.
47
This document is a research report submitted to the U.S. Department of Justice. This reporthas not been published by the Department. Opinions or points of view expressed are thoseof the author(s) and do not necessarily reflect the official position or policies of theU.S. Department of Justice.

Table 4.2. Autoregressive Model for Nested Effects of Problem-Oriented Policing Activities on
Calls for Service
Parameter Estimate T Pr > IT1
Intercept Time Period:
Pre-intervention Intervention Post-intervention
Building Style Total Units Percent AFDC POP (Oakdale) POP (Gladstone) POP (Woodlawn) POP (Brighton) POP (Bellevue) POP (Ivanhoe)
1.9954
-0.0692 0.0208
- -0.1288 0.00 15 0.0166
-0.0 192 -0.0469 -0.0 140 -0.0371 -0.0195 0.0046
13.68
-0.97 0.26
- -1.99 6.18 3.91
-1.67 -3.42 -0.92 -2.80 -1.06 0.37
0.0053
0.3320 0.7976
0.1854 0.0252 0.0597 0.0965 0.0007 0.3590 0.0054 0.2898 0.7098
-
Cov P a m Estimate Z Pr > IZI
DIAG AR ( 1 ) Residual
0.2714 4.89 0.0001 1.9150 11.91 0.000 1
Model Fitting Information
-85.242 1 Schuwz's Bayesian Criterion -89.0943 Akaike's Information Criterion
Likelihood Ratio Test @F = 14) 16.62 13 166.4843 -2 REML Log Likelihood
Extra-dispersion scale 1.9410
Like the model presented in Table 4.1, this model reveals that low-rise public housing
sites Lvith fewer housing units and sites with a lower percentage of AFDC recipients were likely
48
This document is a research report submitted to the U.S. Department of Justice. This reporthas not been published by the Department. Opinions or points of view expressed are thoseof the author(s) and do not necessarily reflect the official position or policies of theU.S. Department of Justice.

to have fewer calls for service over time than hgh-rise sites, sites with large numbers of units,
and site, xith high rates of AFDC recipients. We also find that, as with the results from the
earlier model, the intervention period was not a significant predictor of change in calls for
service. thus ruling out an ‘‘announcement effect” of the problem-oriented policing program.
Table 4.2 also differentiates the impact of the problem-oriented policing program by public
housing site. The results show that the number of problem-oriented pok ing activities was a
significant predictor of change in calls for service in two of the six sites: Gladstone and Brighton.
More problem-oriented policing activities in Gladstone and Brighton led to greater reductions in
calls for service over time. Problem-oriented policing activities in the other four sites did not
significantiy impact calls for service.
Problem-Oriented Policing Impact bv Crime TvDe
Our research also sought to exmine the differential impact of problem-oriented policing
on different types of crime problems in public housing settings. Table 4.3 displays the parameter
estimates for problem-oriented policing activities across a series of nine autoregressive models
predicting specific calls types that, as with the earlier models, control for intervention period
(before, during. and after intervention), building style, total units and percent AFDC.
49
This document is a research report submitted to the U.S. Department of Justice. This reporthas not been published by the Department. Opinions or points of view expressed are thoseof the author(s) and do not necessarily reflect the official position or policies of theU.S. Department of Justice.

‘1’aI)lc 4 . 3 . I’nrainctcr Estimates !i)r I’roblcm-Oriented Policing Activities Predicting Specific Call Types (Controlling for ‘l’iine Per iod. fluilding Style, ‘l’otd Units, and Percent AIXIC)
Vel1 icle Nuisance Suspicious Morals Assistance . Narcotics I’arameter I’erson Interpersonal Property
Intercept Time Period:
Pre-i n terven t ion Intervention Post-intervention
Building Style Total IJnits Percent A I: 1)C POI’ Activity
0.283 0.432 0.148 -1 354 1.137 0.378 -* .,
-0.067 -0.066 0. I46 -0.176 -0.460** 0.022 -0. I23 0.1 18 0.370* -0.008 0.01 I -0.158
- - - - - -
-0.209 -0.313* 0.200 -0.065 -0.502 0.052 0.002‘ * 0.002*+ -0.000 -0.000 0.003** 0.002* 0.026** 0.025** 0.012 0.056* -0.045* -0.02 I -0.004 -0.026* * -0.036** -0.1 IS** -0.02 1 0.0 12
-1.575 0.483 0.726
0.275 -0.209* 0.270 0.1 17 -0.0 I O 0.264
- - - -0.639 -0.020 -0.206
0.005** 0.00 1 * 0.004* -0.039 0.0 19* -0.0 12 0.01 1 -0.027* * -0.0 I 2
Cov Parin
DlAG A R ( I ) 0.3824 0.00 I O 0.4048 0.04 17 0.0002 0.0346 0.00s 1 0.0067 0.000 1 Residual 0.OOOI 0.000 1 0.000 1 0.000 1 0.000 1 0.000 1 0.000 1 0.000 1 0.000 1
This document is a research report submitted to the U.S. Department of Justice. This reporthas not been published by the Department. Opinions or points of view expressed are thoseof the author(s) and do not necessarily reflect the official position or policies of theU.S. Department of Justice.

Table 4.3 reveals five important results. First, problem-oriented policing activities
impacted differently upon the different categories of c a L for service. Specifically. our results
show that problem-oriented policing activities led to reductions in calls for service concerning
interpersonal violent crimes (robberies, assaults. domestic assaults), propem crimes ( b u r s i q ) .
vehicle crimes (auto theft), as well as citizen requests for police assistance (which includes
broken sexver line, traffic control problems, and other service needs such as mentally disoriented
person walking around or a dead animal found).
We did not, however, find that the problem-oriented policing activities reduced disorder
types af crimes (e.g. drugs, morals, nuisance, and suspicious persons). We propose several
reasons why we find these results in our data: first, it might be the case that problem-oriented
policing cannot reduce drug market or social disorder problems; second, the Jersey City problem-
oriented policing program did not set out to explicitly reduce disorder problems (although site
teams did aim from the outset to reduce drug problems and some of their problem solving efforts
appeared geared towards addressing disorder problems with a view to solving more serious crime
problems - see Chapter 5); third, we suggest that public housing residents typically do not call
the police for drug and disorder incidents. We find, for instance. few calls for service regarding
public disturbances and drug problems in our data over the two and one-half year study period.
Indeed. the mean number of calls per month for disorder types of problems averaged about seven
calls per month. By contrast. the mean number of calls per month was higher for interpersonal ( z
= 15) and assistmce ( % = 11) problems. We propose two reasons why we find very few residents
calling the police about disorder and drug problems: first, we suggest that public housing
residents are most likely fearful of drug dealers and worry about retaliation; second, we suggest
that public housing residents are exposed to higher rates of violent types of crimes. As such, they
51
This document is a research report submitted to the U.S. Department of Justice. This reporthas not been published by the Department. Opinions or points of view expressed are thoseof the author(s) and do not necessarily reflect the official position or policies of theU.S. Department of Justice.

may be more inclined to call only about these serious problems than call the police about
comparatively minor problems.
Second. Table 4.3 shows that the intervention period is not significmr across eve? caii
category. This result suggests that the relationship between problem-oriented policing activities
and calls for service during each two week period is not spurious and cannot be explained b>- the
presence or absence of the intervention period. This means that the problem-oriented policing
activities had a direct effect on impacting crime problems.
Third, physical and social structural factors had different influences on different
categories of calls for service. Most notably, we found that those public housing sites with more
housing units had relatively more calls for service overtime than those public housing sites with
fewer housing units. l lus result held for all crime categories except propeny and vehicle crimes.
Fourth. Table 3.3 shows that there is a relationship between percent of AFDC recipients
and violent crime (person and interpersonal) calls. This result suggests that public housing sites
\\ irh more AFDC recipients (and a common proxy for percent youths) have more violent crime
problems than those public housing sites with fewer AFDC recipients.
Finally, the autoregressive statistic (DIAG AR (1)) shows that for most call categories
there is autocorrelation between time periods as one would expect with time series data.
Interestingly. however, our results show that person and property crimes seem to be more
random than other categories of crime, a result that reflects what we tend to know about patterns
of crime problems.
52
This document is a research report submitted to the U.S. Department of Justice. This reporthas not been published by the Department. Opinions or points of view expressed are thoseof the author(s) and do not necessarily reflect the official position or policies of theU.S. Department of Justice.

Chapter Five:
Social Observations
Systematic social observations of human behavior in public places comprise an important
method to measure changes in behavior over time. especially as the result a crime control
intervention like problem-oriented policing. This chapter reports the results of a series of
systematic observations over a one year time period on the 172 common areas across the six
public housing sites in our study.
5.1 Theoretical Perspective
Our study of behavior in public places began with the assumption that common areas in
public housing sites, like street blocks, qualify as behavior settings (see also Felson, 1995;
Perhns and Taylor, 1996; Taylor, 1988; Taylor, 1997; Taylor and Harrell, 1996; Taylor et. al.,
1984; Taylor, Shumaker and Gottfiedson, 1985). These behavior settings are “...regularly
occurring. temporally and spatially bounded person-environment units” (Taylor, 1988: 128).
The!. are made up of three major components: the setting participants, a standing pattern of
behavior, and the surrounding physical environment which contains the behavior (Taylor, 1988).
Residents of a behavior setting (e.g. a street block or common area) are hypothesized to
engage in a variety of territorial behaviors which maintain the standing patterns of behavior or
the setting program and enhance informal social control of the behavior setting (Taylor 1988).
Several factors are thought to affect territorial behaviors. One perspective focuses on the effects
of disorder on territorial fimctioning (Skogan 1990; Skogan 1986; Taylor 1986) arguing that an
increase in disorder or incivilities leads to fear of crime which in turn leads to a withdrawal of
residents and then a decrease in the amount of informal social control (see also Wilson and
53
This document is a research report submitted to the U.S. Department of Justice. This reporthas not been published by the Department. Opinions or points of view expressed are thoseof the author(s) and do not necessarily reflect the official position or policies of theU.S. Department of Justice.

Kelling, 198 1).
Disentangling social activities (both deviant and non-deviant) and control mechanisms
(both formal and informal) at different units of analysis, and understanding the dominant
characteristics of these elements at different units of analysis, provides a theoretical and
empirical means to examine the patterns of illicit activity and the impact of control efforts at a
variety of units of analysis.
At each specific unit of examination, the physical boundaries, use of space and means of
control can be separately identified. For example, in an apartment, the unit of analysis may be
defined by the physical walls; the predominant uses of space may be defined as cooking dinner,
sleeping and watching television; and the principal means of control may be defined as the
discipline exerted by parents or other persons living in the same apartment. For business units,
social activities are usually dictated by the type of business operation. For example. activities at
fast food stores are characterized by food preparation by the employees and customers coming
and going from the store. For these businesses, the principal means of control may be defined as
the control exerted over the behavior of employees coupled with employee surveillance over the
c us t 0 me rs .
The individual apartment or business unit, however, is also part of an address. By
examining the use of space at an address (or say a public housing site) one can observe a greater
range of activities and control mechanisms than those activities and controls identified at a single
apartment. At the same time, however, the activities and controls at the public housing site
r ~ c i u d e the activities and controls that operate in the single apartment. For example, a teenager
li\Fing in a public housing site is controlled by the discipiine exerted by his or her guardian. Ths
same teenager. however, is also part of a social control network that operates on the public
54
This document is a research report submitted to the U.S. Department of Justice. This reporthas not been published by the Department. Opinions or points of view expressed are thoseof the author(s) and do not necessarily reflect the official position or policies of theU.S. Department of Justice.

housing site either through a peer network living in the same public housing site or by the site
manager of the complex. Othc- zontrols can also be identified which temper the behavior of the
teenager when the individual person is examined as the unit of analysis. These social controls
derive, for example, from a variety of sources such as from schools and sporting clubs. However,
the specific place-controls exerted against all people who go about their day-to-day business
when the place becomes the unit of analysis provides a different matrix of controls than those
identified when the controls and activities of the individual person is examined.
Similarly, when business addresses are examined, a specific matrix of social controls can
be identified. For example, groups of stores create a focal point for activity providing local
citizens with access to a range of goods and services. While surveillance in the individual store is
usually conducted by the employee, surveillance across these groups of stores is sometimes
maintained by private security guards or the police. At some places police may be dispatched to
an address or drive-by a problem location providing formal control both over the individual store
and the address (or collection of stores). Additionally, these addresses are controlled through
informal control mechanisms dictated by the relationships that operate at individual housing or
v..orli units (e.g see La Gory, 1983).
Patterns of social activity and control mechanisms can also be identified at larger, more
macro. units of analysis. For example, at the area unit of analysis social networks exist between
community members (e.g. see Yancey, 1983) and physical barriers divide one set of routine
acti\,ities from another (e.g. see Shaw and McKay, 1942. See also Cohen and Felson, 1979). For
example. as one moves from a residential to a business section of a city the boundaries between
neighborhoods can be constructed based on the place where shops cease to exist and homes
dominate the landscape. Moreover, the degree to which one type of behavior (such as licit
5 5
This document is a research report submitted to the U.S. Department of Justice. This reporthas not been published by the Department. Opinions or points of view expressed are thoseof the author(s) and do not necessarily reflect the official position or policies of theU.S. Department of Justice.
behavior) prevails over another (such as illicit behavior) in the neighborhood is dependent both
on the level and type of control mechanisms at work.
By changing the unit of examination from the public housing site to the neighborhood the
types of social activities that predominate are also different. For example, those activities that
operate in the wider community. while embracing people's behavior at the address or
apartmendbusiness level of analysis, also include a range of other ventures such as journeys of
people fiom their house to the: store to work and to social events in the local area (see Cohen and
Felson, 1979).
Unlike the place-specific social controls at the apartment, or business. or public housing
site levels of analysis the social controls that are exerted in the wider community derive primarily
from larger social structural factors such as schools. churches and the businesses that interact
with all users of the public and private space of the neighborhood. Consistent with this broad
focus, research using this macro (community) level of analysis generally examines social
netnorks and these broad social structural factors which control human behavior (see Gans,
1962; Shaw and McKay, 1942; Yancey, 1983).
5.2 Systematic Social Observational Data
Researchers use a variety of methods to measure social activity. Surveying residents
about their perceptions of street activity, for example, is a commonly utilized method of inquiry
(see for example Broum and Altman 1981; Bursik and Grasmick 1993; Greenberg and Rohe
1986: Hirschfield, Broun and Bowers 1996; Mazerolle, Kadleck and Roehl, 1998; Perkins and
Ta?,lor 1996: Rosenbaum and Lavrakas 1995; Skogan 1986). Another way of measuring social
actiLritJP is through on-site field observations of street activity (see for example hfazerolle,
Kadleck and Roehl, 1998; Perkins and Taylor 1996: Taylor 1995a; Taylor 1996). Ralph Taylor,
56
This document is a research report submitted to the U.S. Department of Justice. This reporthas not been published by the Department. Opinions or points of view expressed are thoseof the author(s) and do not necessarily reflect the official position or policies of theU.S. Department of Justice.

however, suggests that residents’ perceptions of disorder and on-site assessments of disorder ma?
not be measuring the same underlying construct (Perkins and Taylor, 1996: Taylor, I995a;
Taylor, 1995b; Taylor. 1996). On-site assessments appear to be measuring the actual conditions
of a location while resident surveys appear to be capturing the actual conditions of a location
filtered through the various psychological attributes and psychological processes of residents. In
fact, one study by Taylor (199%) finds that up to 90 percent of the variation in residents’
perceptions of ecological conditions may be psychological rather than ecological.
The data reported in this chapter draw from on-site observations of social activity in the
172 common areas across the six public housing sites in our study. Our research supports and
extends prior research that uses on-site ratings by trained researchers in order to capture the
“ecological” changes in the neighborhood or street. We do not argue against the use of surveys
that focus on residents’ perceptioiis of their neighborhood (indeed see Mazerolle, Kadleck, and
Roehl, 1998). Rather, ours is an argument suggesting that residents may not be the most
objectiLe lens from kvhich to view the physical changes on a street.
We conducted five waves of observations over the one and a half years of our evaluation
project (Spring 1995, Summer 1995, Fall 1995, Winter 1996, Spring 1996). During each wave
~ v e conducted one observation in four distinct time periods (weekend day, weekend night.
L\ eekday day, Lveekday night) for each of the 172 common areas. In total we conducted 3340
obsenations across the five Lvaves. across the four time periods over the 172 common areas.
Structured field observations of routine licit activities (e.g. pedestrians, children playing. people
ualking along) and illicit activities (e.g. drug selling, fighting) were made of each common area.
Our decision to conduct four observations per common area during each wave derived
from our understanding that common areas in public housing sites have stable patterns of
57
This document is a research report submitted to the U.S. Department of Justice. This reporthas not been published by the Department. Opinions or points of view expressed are thoseof the author(s) and do not necessarily reflect the official position or policies of theU.S. Department of Justice.

behavior, or rhythms of recurring behavior and activity, that are somewhat predictable and
routine (see also Mazerolle, Roehl and Kadleck, 1998; Taylor, 1988). Felson (1 995) also
suggests that activities occur in fairly predictable rhythms where patterns of behavior are dictated
by a host of factors including residents' working hours, sleeping times, and recreational times
(see also Mazerolle, Roehl and Kadleck, 1998).
We suggest that the reliabilip and validity of on-site observations increases as the unit of
analysis decreases in size. We propose that public housing common areas and other small units
of analysis (e.g. street blocks, lot spots) have fewer and less complex patterns of street activity
(or standing patterns of behavior) than neighborhoods. communities, or other larger units of
analysis that hxJe more complex and varied patterns of social behavior. For example, a public
housing common area may have four distinct time periods with four distinct patterns of behavior:
( 1 ) the morning hours when residents are tdcing children to school or going to work, (2) the
da>.time hours when elderly people or non-daytime working adults use the common spaces, (3)
the afternoon hours iyhen children are coming home from school and adults are returning home
from \vork. and (4) the evening hours when people are at socializing in the common areas. This
kind of predictability in the standing patterns of behavior on a street block are rarely present for
neighborhoods for a number of reasons: the overall number of people frequenting a
neighborhood makes it more difficult to anticipate standing patterns of behavior; the range of
land use patterns across a neighborhood (businesses. single family homes, multi-dwellings)
creates more complex rhythms of social activity; and the diversity of people living and working
in neighborhoods leads to more complex and diverse patterns of social behavior.
58
This document is a research report submitted to the U.S. Department of Justice. This reporthas not been published by the Department. Opinions or points of view expressed are thoseof the author(s) and do not necessarily reflect the official position or policies of theU.S. Department of Justice.

5.3 Results
The analyses presented in this section show the percent change in licit, marginal, and
illicit activities over five waves of observational data. We measure changes in the nature of social
behavior in common areas by examining the proportion of licit activities to illicit activities over
time. It is difficult to make such comparisons using the raw numbers because the volume of
social activity varies widely from season to season. The licit activities observed during our field
observations include children playing, police patrolling, and people walking, conversing, and
engaging in recreation. Marginal behaviors consist of loitering, gambling, and suspicious or
borderline activities for which there are city ordinances. Illicit activities include more serious
crimes and disorders such as selling drugs, fighting, drinking in public, and blaring loud music.
Figures 5.1 through 5.6 present the changes in social activity by site. Overall, the graphs
show that the percent of observed illicit behavior is very small (about ten percent at the start of
the project and decreasing to less than five percent by the end of the project). This result is
consistent lvith most criminological research reporting that crime is, in fact, a rare event and is
similarly a rare event in public housing sites. The vast majority of observed social activity across
the six target public housing sites was regular, licit activities such as children playing, people
\balking, conversing, and engaging in recreational activities. Of particular note is the fact that the
percent of licit activities increased over the course of ow problem-oriented policing project
across all six of the public housing sites in our study.
59
This document is a research report submitted to the U.S. Department of Justice. This reporthas not been published by the Department. Opinions or points of view expressed are thoseof the author(s) and do not necessarily reflect the official position or policies of theU.S. Department of Justice.

Figure 5.1. Social Observations at Oakdale Public Housing Site
0 6, > i
% 8
0 Illicit
60
This document is a research report submitted to the U.S. Department of Justice. This reporthas not been published by the Department. Opinions or points of view expressed are thoseof the author(s) and do not necessarily reflect the official position or policies of theU.S. Department of Justice.

Figure 5.2. Social Observations at Gladstone Public Housi- Site
Ilicit 0 Marginal r U Licit
61
This document is a research report submitted to the U.S. Department of Justice. This reporthas not been published by the Department. Opinions or points of view expressed are thoseof the author(s) and do not necessarily reflect the official position or policies of theU.S. Department of Justice.

Figure 5.3. Social Observations at Woodlawn Public Housing Site
B > L aJ 2 0
0 Marginal H Licit
62
This document is a research report submitted to the U.S. Department of Justice. This reporthas not been published by the Department. Opinions or points of view expressed are thoseof the author(s) and do not necessarily reflect the official position or policies of theU.S. Department of Justice.

Figure 5.4. Social Observations at Ivanhoe Public Housing Site
0 Marginal m Licit
3 !u > i
% R
e, e, e, > > > > e, aJ s s s s s >
63
This document is a research report submitted to the U.S. Department of Justice. This reporthas not been published by the Department. Opinions or points of view expressed are thoseof the author(s) and do not necessarily reflect the official position or policies of theU.S. Department of Justice.

Figure 5.5. Social Observations at Brighton Public Housing Site
0 Marginal m Licit
64
This document is a research report submitted to the U.S. Department of Justice. This reporthas not been published by the Department. Opinions or points of view expressed are thoseof the author(s) and do not necessarily reflect the official position or policies of theU.S. Department of Justice.

Figure 5.6. Social Observations at Bellevue Public Housing Site
Illicit 0 Marginal r l U Licit
65
This document is a research report submitted to the U.S. Department of Justice. This reporthas not been published by the Department. Opinions or points of view expressed are thoseof the author(s) and do not necessarily reflect the official position or policies of theU.S. Department of Justice.

Our social observational data suggest two main outcomes: first, the ratio of licit to illicit
social activity in the six public housing sites in or- study increased over the one year intervention
period. Second. it appears that the problem-oriented policing program most likely led to
decreases in marginal activity and, to a lesser extent, the program probably led to decreases in
illicit activity. We remind readers, however, that the problem-oriented policing program goals
cvere to reduce serious crime activity. The results presented in Chapter Four showed significant
impacts on serious crime, especially in Brighton and Gladstone, but no real impact on disorderly
types of activity. By contrast, the results from our social observations suggest that the problem-
oriented policing seems effective at reducing marginal type activities such as loitering, gambling,
and suspicious behavior.
LVe do not believe that the results from the social observations (Chapter Five) and the
calls for service (Chapter Four) are inconsistent with one another. Rather, we propose two
arguments that bring the two findings together. First, calls for service do not adequately measure
thc amount of disorder activity in public housing sites because residents simply do not seem to
call about this type of low-level activity. Second, we believe that the focus of the problem-
orientzd policing program implemented in the public housing sites in Jersey City was consistent’
Lvith what Wilson and Keliing (1982) refer to as the “broken windows” hypothesis. It appears
that problem-solving teams attempted to impact serious crime problems by targeting some of the
inciyility behaL,iors in public housing sites. Our charts presented in t h s chapter tend to support
these nvo arguments and suggest that the police were in fact successful at reducing illicit
act i \ i t ies.
66
This document is a research report submitted to the U.S. Department of Justice. This reporthas not been published by the Department. Opinions or points of view expressed are thoseof the author(s) and do not necessarily reflect the official position or policies of theU.S. Department of Justice.

Chapter Six:
Conclusions
Crime problems in public housing sites have a reputation as being more intractable than
problems in other high crime places. High-rise public housing sites are typically located in poor
neighborhoods with high crime rates (Skogan and Annan, 1994 129-130). Residents are
generally older and poor and the non-elderly residents are disproportionately single with children
and unemployed. Skogan and Annan (1994) suggest that “residents often lack the capaciv to
defend themselves, be it against predators, gangs looking for revenge, or drug dealers engaged in
turf wars or intimidation” (1994: 130; see also Popkin et al, 1997). Many policy makers believe
that only hard core policing tactics (e.g. arrests, sweeps) that characterize the “War on Drugs“
can reduce the significant crime problems in public housing sites and program evaluators report
few interventions that seem to make lasting change.
Our evaluation of a problem-oriented policing program implemented in six of the most
crime ridden public housing sites in Jersey City challenges the notion that public housing sites
represent the last bastion of program resistance. Our research shows that the problem-oriented
policing activities, collectively implemented by site teams comprising police, public housing
officers. and social service liaison officers, can significantly reduce interpersonal, property,
vehicle, and assistance calls for service. Our research found that the reductions in calls for
sen ice for these categories of crime were significant and attributable to the number of problem-
oriented policins activities implemented in each site. We did not find: however, significant
reductions in the number of calls for service over time for disorder-tjpe problems and drug
market problems. We expect that the low base rate of calls from public housing residents
’ 67
This document is a research report submitted to the U.S. Department of Justice. This reporthas not been published by the Department. Opinions or points of view expressed are thoseof the author(s) and do not necessarily reflect the official position or policies of theU.S. Department of Justice.

regarding incivilities and drug problems confounds this result. Our social obsemational data
throws Lveight behind Gur supposition that the calls for semice are an inadequate measure of the
impact of the problem-oriented policing program on disorderly F p e activity. Indeed. our results
show that marginal and illicit activiv decreased across the six public housing sites during the one
year intervention period.
Our research also found differences among the six public housing site teams in their
ability to impact crime problems. Two site teams in particular - Gladstone and Brighton -
significantly reduced the number of calls for service over time. Importantly, we found that the
physical structure differences :hat were significant predictors of changes in calls for service over
time (total number of units) did not explain why Brighton and Gladstone site teams were most
successful in reducing crime problems. Moreover, social structural factors such as percent
unemployed, percent AFDC, and percent single headed households did not exhibit strong
relationships to the changes overtime in calls for service. These social structural factors also
Lxied qualitatively between the two successful sites: Brighton and Gladstone. For instance,
building style (Brighton was a low rise and Gladstone a high rise) and the sheer number of
problem-oriented policing activities alone could not explain the reason why these two site teams
v, ere most successful in reducing serious crime problems. We concluded that stable membership
in the site-based problem-solving teams combined mlth a high volume of completed problem-
solving activities contributed to the successful reduction in calls for service regarding serious
crime problems in Brighton and Gladstone.
Our research has several important methodological and policy implications and our
research offers some general and important insights into the growing problem-oriented and
community-oriented policing literature. The problem-oriented policing program implemented in
68
This document is a research report submitted to the U.S. Department of Justice. This reporthas not been published by the Department. Opinions or points of view expressed are thoseof the author(s) and do not necessarily reflect the official position or policies of theU.S. Department of Justice.

the Jersey City public housing sites comprised a wide range of responses: CPTED (e.g lighting),
sitliational crime prevention (e.g. pay phone capabilities to enable outgoing calls only). civil
remedies (e.g. evictions and special leaseholder provisions), traditional policing (e.g sn-eeps.
arrests, surveillances). treatment (e.g. drug treatment and alcohol counseling), and informal
social control (e.g. stability of CSO’s assigned to individual housing sites). IVe found that the
two most successful sites (Gladstone and Brighton) implemented more police-initiated strategies
than those sites that relied more upon public housing or social service responses. This is not to
say that traditional policing tactics are more effective, but that the coercive authority of the police
within a problem-oriented policing program is important to bringing about change. This finding
is consistent with Green’s (1996) evaluation of Oakland Police Department’s Beat Health
program that found that city inspectors were effective in cleaning up blighted places with drug
dealing problems when they gained access to properties through police problem-solving efforts.
M-e conclude, therefore, that sworn officers need to take an active and high profile role in
problem-solving within a team context in order to bring about change.
Our research also challenges the widely-held notion that crime-ridden, high-rise public
housing sites Lvhere the residents are typically poor, single, unemployed and with children are
places that are highly resistant to change. We found that the problem-oriented policing program
implemented across six study sites had a differential impact and that one of the key defining
factors that led to decreases in violent crime, property, vehicle and assistance calls was the
stability of the problem-oriented policing teams. This result suggests that long term assignments
of police officers to Lvork within particular public housing settings might reduce the distrust that
man!- public housing residents feel about the police in general, it might give the police time to
gct to kno~v the residents better, it would most likely give the police a knowledge base regarding
69
This document is a research report submitted to the U.S. Department of Justice. This reporthas not been published by the Department. Opinions or points of view expressed are thoseof the author(s) and do not necessarily reflect the official position or policies of theU.S. Department of Justice.

the types of social services available to help residents in trouble. and it would give the housing
authority personnel an opnrtunity to work with the p o k e to target some of the problem people
and places within public housing communities.
Our research offers some important measurement and methcdological insights. First. our
study systematically measured the process of problem-oriented policing and carefully intesated
the problem-oriented policing activities with our impact assessment. We documented the merit
of scanning efforts, we examined the types of analysis conducted on a defined problem, we
measured the quantity and quality of problem-solving responses. and we recorded efforts to
assess the impact of problem-oriented policing tactics. This process formed an integral
component to our assessment of how problem-oriented policing p r o p m s succeed (or flounder)
in public housing sites. Finally, by using a mixed model we were able to disentangle the relative
influences of problem-oriented policing activities across the six public housing sites in OUT study
.As such. this method provides an innovative approach to comparing and contrasting the factors
that constrain or enhance the control of crime problems in public housing sites.
70
This document is a research report submitted to the U.S. Department of Justice. This reporthas not been published by the Department. Opinions or points of view expressed are thoseof the author(s) and do not necessarily reflect the official position or policies of theU.S. Department of Justice.

. -
Problem-Oriented Policing in Public Housing: Final Report of the Jersey City Project*
Lorraine Green Mazerolle University of Cincinnati
Justin Ready Rutgers University
Bill Terrill Rutgers University
and
Deputy Chief Frank Gajewski Jersey City Police Department
Submitted to the iVational Institute of Jiistice
December, I998
* The research for this final report was supported by Grant No. 94-IJ-CX-0063 from the National Institute of Justice Opinions or points of view expressed in the paper do not necessarily represent the official positions or policies of the National Institute of Justice or the U.S. Department of Justice. We would like to thank Elin Waring, David iveisburd. Elyse Revere, Cyndy Mamalian, John Schwartz and Theresa Conover far their contributions at various stages of the project. We would also like to thank Lieutenant Brian McDonough, Lieutenant Charles Beliucci and members of the public housing site teams for their cooperation and insight at various points in the project. Please address all correspondence to Lorraine Green Mazerolle at the University of Cincinnati, Division of Crimincll Justice, PO Box 210389, Cincinnati OH, 45221-0389.
This document is a research report submitted to the U.S. Department of Justice. This reporthas not been published by the Department. Opinions or points of view expressed are thoseof the author(s) and do not necessarily reflect the official position or policies of theU.S. Department of Justice.

Executive Summary
e
e
The public housing problem-oriented pAcing project was a cooperative effort by Jersey City's Public Housing Authority and the Police Department to solve serious crime problems across three low--rise and three high-rise public housing sites.
The Housing Authority and the Police Department formed six problem-solving "site teams" comprising public housing representatives, on and off-duty police officers, tenant representatives, and a social service liaison officer. These teams collectively identified and analyzed drug and violent crime problems in the six target public housing sites in our study.
Our project in Jersey City began with the premise that public housing sites differ from one site to the next. We suggested that even within public housing sites, some places (like some playgrounds and some building lobbies) would have problems, while others would not.
The corollary was that problems withn public housing locations would have varied causes and thus varied responses should be applied to solve (or reduce) the problems.
We distinguished all common areas by their function and identified six broad types of common areas: walkways, buildings, playgrounds, parking lots, rest areas, and comml~nity centers. We identified 172 unique common areas across the six public housing sites.
LV"nen the distributions of problems were examined across public housing sites we found that the six public housing sites in Jersey City experienced very different distributions of problems.
Crime is not evenly distributed across all common areas in a public housing site. About half of the common areas were deemed "safe places" in public housing sites and different public housing sites had different distributions of crime problems.
Buildings were the most frequently cited common area generating drug problems in a11 sis public housing sites in our study.
Approximately 7 percent of all the site apartments (N=l84) generated 50 percent of the calls across the six housing sites.
The site teams initiated situational crime prevention tactics such as changing public pay phones to enable out-going calls only and CPTED interventions such as improving lighting in some dimly lit comers of one public housing site. Site teams also sought to control crime problems in common areas using traditional policing tactics such as arrests, surveillances, investigations, order maintenance, and enforcing open warrants.
I
This document is a research report submitted to the U.S. Department of Justice. This reporthas not been published by the Department. Opinions or points of view expressed are thoseof the author(s) and do not necessarily reflect the official position or policies of theU.S. Department of Justice.

Our evaluation team recorded a total of 602 assigned activities during the one year intervention period and we documented a steady increase in ur hue problem-solving activities completed each month.
Our research found that the problem-oriented policing activities. collectively implemented by site teams comprising police, public housing officers, and social service liaison officers, si,onificantiy reduced interpersonal, property, vehicle, and assistance calls for service.
Our research found that the reductions in calls for service for these categories of crime were significant and attributable to the number of problem-oriented policing activities implemented in each site.
We did not find, however, significant reductions in the number of calls for service over time for disorder-type problems and drug market problems. We expect that the low base rate of calls from public housing residents regarding incivilities and drug problems confounds this result.
Our social observational data throws weight behind our supposition that the calls for service are an inadequate measure of the impact of the problem-oriented policing program on disorderly type activity. Indeed, our systematic social observations show that marginal and illicit activity decreased across the six public housing sites during the one year intervention period.
Our research also found differences among the six public housing site teams in their abilit)’ to impact crime problems. Two site teams in particular - Gladstone and Brighton - significantly reduced the number of calls for service over time.
Importantly, we found that the physical structure differences that were significant predictors of changes in calls for service over time (total number of units) did not explain why Brighton and Gladstone site teams were most successful in reducing crime problems. Moreover, social structural factors such as percent unemployed, percent AFDC, and percent single headed households did not exhibit strong relationships to the changes overtime in calls for service.
We concluded that stable membership in the site-based problem-solving teams combined with a high volume of completed problem-solving activities contributed to the successful reduction in calls for service regarding serious crime problems in Brighton and Gladstone.
Our evaluation of a problem-oriented policing program implemented in six of the most crime ridden public housing sites in Jersey City challenges the notion that public housing sites represent the last bastion of program resistance.
This document is a research report submitted to the U.S. Department of Justice. This reporthas not been published by the Department. Opinions or points of view expressed are thoseof the author(s) and do not necessarily reflect the official position or policies of theU.S. Department of Justice.

responsibility of the housing authority (and therefore classified as a "housing authorin, smteov'') c-
does not mean that housing employees are exclusively invo: ed in carrying out each link in a
chain of activities that comprises that strategy. As demonstrated in the earlier eviction exampie.
many or sometimes all of the individual activities leading to the final act of evicting a
leaseholder (i.e., obtain search warrant, raid apartment, arrest specific actor) may involve police
or social service assistance. Similarly, coercive police strategies structured for the arrest of a key
suspect (i.e., drug supplier) will usually involve the participation of the housing authority OT the
social service liaison to provide lease information, remove boarders involved in the drug trade, or
to locate potential informants. In this context, a police strategy should not be seen as a series of
law enforcement activities, rather a complex sequence of planned group responses. The sworn
site-based officers were effective precisely because so many of their responses were contingent
upon the group dynamics of the site team.
Our process analysis sheds light on the nature of decision making and the flow of
information within the team structure which contributes to our understanding why Gladstone and
Brighton emerged as the sites with the most successful problem-oriented policing teams.
tiousing employees, tenants, and the social service liaison in the Gladstone and Brighton site
teams saw their role as one of providing reliable information to the site-based officers so they
could make informed decisions and respond more effectively. This flow of information was, for
the most part, non-reciprocal. The police internalized their role as the "receivers" and reinforced
this non-reciprocal flow of infomation by sometimes balking on their duty to exchange
information and by often proposing problem-oriented policing strategies to other members of the
group that placed them on the receiving end. For the most part, however, all parties adjusted to
this arrangement and the two groups were quite organized during the analysis and responses
36
This document is a research report submitted to the U.S. Department of Justice. This reporthas not been published by the Department. Opinions or points of view expressed are thoseof the author(s) and do not necessarily reflect the official position or policies of theU.S. Department of Justice.

stages.
3.5 Site Team Membership
These results suggest that coercive police activities may have a stronger impact on crime
problems than less coercive activities. We suggest, however, that membership and attendance at
site team meetings comprise two other important factors why Gladstone and Brighton
demonstrated reductions in calls for service. We explore these issues in Table 2.14.
Table 3.14 shows that membership of the Gladstone and Brighton site teams, particularly
the site-based police officers assigned to these teams, was stable throughout the intervention
period. By contrast, we documented a tremendous amount of turnover in the membership of the
other site teams (Oakdale in particular). We suggest that the stability of personnel on problem-
solving teams, particularly police membership, is perhaps one of the most important contributing
factors in successful problem-solving. This result also suggests that problem-oriented policing
programs in otherwise resistant public housing sites ( e g , Gladstone which is a high-rise housing
complex with a high rate of unemployment. single adult households. and high rates of AFDC
recipients) that make an effort to maintain stable membership of personnel assigned to problem-
solving teams are more likely to impact crime problems than teams that have a high rate of
personnel turnover (see also Green, 1996).
37
This document is a research report submitted to the U.S. Department of Justice. This reporthas not been published by the Department. Opinions or points of view expressed are thoseof the author(s) and do not necessarily reflect the official position or policies of theU.S. Department of Justice.

Tablc 3.14. I’rolilc o f Six I’iiblic I lousing Site ‘featiis in Jersey City
Site
Oakdale Gladstone Woodlawn 1 van hoe
Number of Number 01’ Average Meet in gs Different Attendance per
Attendees Meeting 1 1 15 6.64 9 22 7.56
I 1 10 6.64 8 12 7.13
Y Police Attendance
50.68 54.41 49.32 45.6 1 58.06 52.50
o/o 1’1 IA YO Social Service Attendance Attendance
26.03 9.59 27.94 5.88 28.77 6.85 33.33 8.77 24.19 I .61 22.50 15.00
Source: Weekly site team progress reports and tnontlily narratives. Note: The last three columns do not add up IO 100% because the % researcher attendance was omitted.
Brighton Dellevue
11 1 1 5.64 6 8 6.67
This document is a research report submitted to the U.S. Department of Justice. This reporthas not been published by the Department. Opinions or points of view expressed are thoseof the author(s) and do not necessarily reflect the official position or policies of theU.S. Department of Justice.

Chapter Four:
Calls for Service
We assess the impact of the problem-oriented policing program implemented in Jersey
City from two and a half years of citizen calls for police service (January 1994 through July
1996). Calls for police service comprise a common source of outcome information for many
police interventions (see Mazerolle and Roehl, 1998; Sherman, Shaw and Rogan, 1995; Sherman
and Weisburd, 1995; Warner and Pierce, 1993; Weisburd and Green, 1995). Indeed, Sherman
and his colleagues argue that calls for police service “provide the widest ongoing data collection
net for criminal events in the city” (Sherman, Gartin and Buerger, 1989:35). Similarly, Warner
and Pierce argue that calls for service data are biased only by citizens’ willingness to report
crimes” (Warner and Pierce, 1993512).
Researchers who use calls for service data, however, are not without their critics. Klinger
and Bridges ( 1 997). for example, argue that calls for senice are biased because they do not
include crimes that come to police attention through means other than police dispatch centers;
because callers can provide misleading information (see also Reiss. 1971); and because they
consist of what police call takers record about what citizens tell them (see also Gilsinan, 1989).
O\.erall. Klinger and Bridges (1 997) identify three types of error in calls for service crime counts:
calls identified as non-criminal events that are in fact criminal activity (false negatives), callers
that classifi, non-criminal behavior as criminal (false positives), and calls that misclassify the
nature of criminal incidents (crime misclassification). They conclude that calls for service data
under count the amount of crime officers encounter on patrol (by about 23 percent), that the
counting bias \.aries by crime type -- over counting burglary by about 3 percent, under counting
39
This document is a research report submitted to the U.S. Department of Justice. This reporthas not been published by the Department. Opinions or points of view expressed are thoseof the author(s) and do not necessarily reflect the official position or policies of theU.S. Department of Justice.

violent crimes (assault, sexual assault and robbery) by about one third. and under counting
trespassing by about 5 1 percent -- .. -.d that errors in calls for service crime counts vary
systematically across space (1 997:719-720).
We propose that calls for service provide a reasonable measure of serious crime
problems. particularly violent and property crimes in public housing sites. Indeed. our data show
consistently higher levels of reporting these serious types of crime problems (about fifteen calls
per month) than disorder problems (about seven calls per month). Our systematic social
observations of behavior and Iihysical conditions in common areas in these six public housing
sites, however, documented many more instances of disorderly behavior". As such, we propose
that calls for service regarding more serious crimes in public housing sites comprise an adequate
measure of serious crime activity. Calls for service data, however, seem less useful as a measure
of public disorder problems in public housing sites. Our work in the public housing sites suggest
that residents tend not to call the police about things they might consider to be trivial eveats, like
lo irering. drinking in public, urination, trespassing, and suspicious persons. As one tenant
representative suggested, "the police have bigger fish to fiy" and many public housing tenants
he1ieL.e calling the police would be a waste of time because the incident is usually over by the
time they arrive
- L4 e conducted a series of independent observations in each of the common areas over five time periods spanning thc period of our project. We conducted five waves of observations (spring 95, summer 95, fall 95, winter 96, spMg 96). w e conducted four observations per wave (weekday day, weekday night. weekend day. weekend night) across 177 common areas. In total we collected 3200 observations across the six public housing sites over the penod of our problem-oriented policing project. The results of these observations are reported in Chapter 5.
40
This document is a research report submitted to the U.S. Department of Justice. This reporthas not been published by the Department. Opinions or points of view expressed are thoseof the author(s) and do not necessarily reflect the official position or policies of theU.S. Department of Justice.

4.1 Analytic Strategy
The empirical models presented in this chapter ex-nine repeated measures of calls for
police service at 60 equally spaced points in time (fiom January 1, 1994 to June 30. 1996). Our
specific research questions demanded that we examine changes in calls for sen-ice both across
and within public housing sites, as well as any changes in the different categories of calls for
service (especially violent crimes, property, and drugs). We wanted to measure the specific
impact of problem-oriented policing activities on calls for service over time and also compare
these trends across sites. With these research questions in mind, we employed a mixed model to
measure the impact of the intervention on different call categories across the six housing sites
over 30 months (60 two-week intervals). The mixed model, also considered a multi-level model,
is one method for analyzing time-series data while, at the same time, allowing one to examine the
nested effects of a co-variate. In our case, the mixed model allowed us to examine both changes
in calls (by type) over time as well as the individual impacts of problem-oriented policing
acti\.ities in each site.
The mixed model draws upon an autoregressive covariance structure (AR1) that is
specific to time-series data. For our study, the autoregressive model was designed to measure the
impact of problem-oriented policing on serious crime across housing sites over repeated
measures. Repeated measures of call data were matched to each public housing site and then
azgregated to evenly spaced 2-week intervals (N = 60): 32 observation points prior to the
inten.ention, 23 points during the intervention, and 4 points of follow-up data. The mixed model
is thus fitted to time-series data containing two levels of analysis: rime is considered the level 1,
within-subjects factor where different measurements on the same subject (housing project) are
observed at different points in time; and site-level variables comprise the level-?, between-
41
This document is a research report submitted to the U.S. Department of Justice. This reporthas not been published by the Department. Opinions or points of view expressed are thoseof the author(s) and do not necessarily reflect the official position or policies of theU.S. Department of Justice.

subjects factor, where differences in treatment (problem-oriented policing activities) and
population characteristics (e+ percentage of AFDC recipients, building style. number of units)
can be measured between "subjects." which in t l s case is between public housing sites (see
Littell et al., 1996). As such, the purpose of the mixed model was to compare n-ithin- and
between-subject calls for service trends over time.
The mixed model fits these data and our specific research questions for several reasons.
Simple linear models assume that between-subjects predictors and their error terms are mutually
independent and that the variance of the error terms is constant. By contrast, the mixed model
comprising an autoregressive covariance structure does not assume that error terms are mutually
independent. The mixed model specification implies that the volume and type of calls for service
observed at a given point in time may depend upon enduring events or conditions in a particular
site. and that random variations in calls will operate on large intervals of time rather than on
singular observation periods. In other words, circumstances such as the management style, the
stabilit! of a drug market. or strategic problem-oriented policing activities in a public housing
site may have a collective impact on a block of observation points. A reverse-sting operation, for
example, that disrupts a street-level drug market at Oakdale at period 4 may have a lagged effect
on calls observed at period 5, and perhaps later periods.
iVith time series data we could not aSsume that observations within a site would be
equally correlated. As such, the basic assumptions of simple linear models would have been
L iolated. Moreover. in most time-series data sets, observations at adjacent points in time are
more highly correlated than observations at distant times. Analysis of these data, therefore,
requires the Lvithin case covariance to be removed. The mixed model approach does this by
appiying a parametric structure to the covariance matrices, where the covariance of the estimates
42
This document is a research report submitted to the U.S. Department of Justice. This reporthas not been published by the Department. Opinions or points of view expressed are thoseof the author(s) and do not necessarily reflect the official position or policies of theU.S. Department of Justice.

is assumed to be a function of the distance between two observation^'^. The first order
autoregressive structure specifies that the covariance between two observations that are w
intervals apart is 02pw, where w is the number of time intervals between obsen-ations. the
parameter o2 is the variance of an observation. Var(y,,J = u'. and p is the correlation benveen
sequential observations on the same site. It follows that p is the correlation between observations
at times one and two, pz is the correlation between observations at times one and three, p3 is the
correlation between observations at times one and four, and so forth (Littell et al., 1996). The
covariance structure assumed under an auto-correlation model is thus:
P2
P P2
P 1 .
. 1
. P
P
1 P PZ
The block diagonal matrix indicates that the covariance between measurements on the
same block is no longer assumed to be 0, and the variance of the error terms is not expected to be
constant. The models examined in this paper used the SAS PROC GLIMMIX option for a
' ' Another approach that incorporates non-independence would be to add an autocorrelation parameter to a traditional time series analysis. However, a major advantage of the SAS GLIbWIX procedure (mixed model proceaurej over time series analysis is that the mixed model will estimate uggregoie treatment effects for all the sites together. as well as the nesred(or individual) effects of problem-solving within each housing site. The mixed model approach is thus more efficient than conducting seven time series analyses, six for the individual sites and another for the overall intervention.
43
This document is a research report submitted to the U.S. Department of Justice. This reporthas not been published by the Department. Opinions or points of view expressed are thoseof the author(s) and do not necessarily reflect the official position or policies of theU.S. Department of Justice.

Poisson probability distribution which is generally deemed appropriate for count data. such as
these, in tthich there are a high frequency of empty cell counts in the data set making an
assumption of normality inappropriate. The mixed model approach then relies upon maximum
likelihood estimation or restricted maximum likelihood estimation to assess the model goodness
of fit (see Waring, 1998; Searle et al., 1992).
4.2 Results
We present our results.in four parts: fust, we examine the impact of the problem-oriented
policing program across the six public housing sites in our study. Second, we compare the impact
of the problem-oriented policing program between the six study sites. Third, we discuss the
impacts of different types of problem-oriented policing activities and fourth, we present our
results that depicts the impact of the problem-oriented policing program on different crime
categories.
Overa!l Impact of the Problem-Oriented Policinp Program
Table 3.1 presents the results of the first autoregressive mixed model'' which examines
the cumulative impact of the problem-oriented policing program on serious calls for service''.
Building style, the number of units, and the percentage of households receiving AFDC (Aid to
Famiiies with Dependent Children) are included as controls. Additionally, we control for the
intenention period of the time series data @re-intervention, during intervention, post-
intenention). CVe also include the number of problem-oriented policing activities completed
during each nvo-week interval to measure the impact of the aggregate number of problem-
" All mixed models presented in this report include an extra-dispersion scale which adjusts the standard errors to account for over-dispersion. This is appropriate because diagnostics (Le. the Pearson Chi-Square/deg,rees of freedom and the deviance!degrees of freedom) indicate that there is over-dispersion in the models. Inclusion of the extra- dispersion scale correctly adjusts the estimation of the standard errors of the individual parameter estimates.
44
This document is a research report submitted to the U.S. Department of Justice. This reporthas not been published by the Department. Opinions or points of view expressed are thoseof the author(s) and do not necessarily reflect the official position or policies of theU.S. Department of Justice.

solving activities on calls for service across the six public housing sites. We included problem-
oriented policing activities as a L e d treatment effect rather than a random effect because the
decision to implement a problem-solving strategy was strategically determined by the site teams
and not randomly selected from a “population” of problem-solving activities. Indeed. one would
hope that within the SARA approach to problem-oriented policing that problem-solvers carefully
choose treatment activities that match their analysis of the problem rather than randomly select
responses that may or may not have a chance of success,
Table 4.1. Autoregressive Model for Overall Effects of Problem-Oriented Policing Activities on
Calls for Service ] Parameter Estimate T Pr > IT1 I
Intercept 1.9752 Time Period:
Pre-intervention -0.9762 Intervention -0.0077 Post-intervention -
Building Style -0.1718 Total Units 0.0017 Percent AFDC 0.0 159 POP Actii-ity -0.02 16
14.28 0.0049
-1.03 0.3054 0.09 0.9270
- - -2.73 0.1 118 7.04 0.0196 3.95 0.0584
-2.92 0.0037
C O Y Pam Estimate Z Pr > IZI
DIAG AR ( 1 ) Residual
0.303 1 2.0149
5.63 0.0001 11.86 0.0001
Model Fitting Information
Akaike’s Information Criterion Schwarz‘s Bayesian Criterion Likelihood Ratio Test (DF = 9) -2 REML Log Likelihood Extra-dispersion scale
-76.3614 -80.2279 34.3828
148.7228 2.0166
includes persons. inrerpersonal, vehicle, assistance, property and drugs.
45
This document is a research report submitted to the U.S. Department of Justice. This reporthas not been published by the Department. Opinions or points of view expressed are thoseof the author(s) and do not necessarily reflect the official position or policies of theU.S. Department of Justice.

Our results show that sites with loLv-rise (or walL-Jp style) architectural designs, fewer
housing units, and a smaller percentage of AFDC recipients had fewer calls for service over time
than high-rise sites, sites with larger numbers of housing units. and sites with high rates of AFDC
recipients. These findings are consistent with the seminal research on public housing sites in
New York City conducted by Oscar Newman in the 1970s (Newman, 1973).
Our results also indicate that the agzegate number of problem-solving activities
implemented during each two-week observation period is a significant predictor of the trend in
calls for service over time. We find that an increase in the number of completed site team
activities is positively associated with reductions in calls for service over time. This finding is
consistent with the program goals and suggests that site teams that implemented a large quantity
of problem-solving tasks during the evaluation period directly impacted the number of serious
crime calls for police service in the six public housing sites.
To disentangle whether this impact was merely an ”announcement effect” - the result of
si rnpl!, informing residents that a problem-solving program had been implemented - we
controlled for the time period (before, during or after program implementation) in the mixed
model analysis. As Table 3 shows, the categorical time period variable was not statistically
significant. This suggests that it was not the intervention period itself that caused a reduction in
calls. but the number of problem-oriented policing activities completed during each observation
period. That is. residents did not stop calling the police about crime problems simply because.
they \vue a v a r e of the program or some related period effect. Rather, this first model indicates
that there \vas something about the actual frequency of problem-oriented policing activities that
contributed to changes in the number of calls for service.
46
This document is a research report submitted to the U.S. Department of Justice. This reporthas not been published by the Department. Opinions or points of view expressed are thoseof the author(s) and do not necessarily reflect the official position or policies of theU.S. Department of Justice.

We propose that this overall reduction in calls for service is not an artifact of _general
reductions in calls for service across Jersey City over the last several years. In fact. Tiur data -
reveal a 4 percent decrease in calls for service citytide compared to a 25 percent decrease in
calls for service in the six public housing sites in our study.
The Differential Impact of the Problem-Onen ted Policin u - P rooram - - Between Public Hous ing
Sites
. .
Table 4.2 seeks to answer whether there a difference in the impact of the problem-solving
intervention between the six public housing sites? Table 4.2 presents the results of an
autoregressive model that examines the nested (or separate) effects of the problem-solving
activities implemented by each of the six site teams.
47
This document is a research report submitted to the U.S. Department of Justice. This reporthas not been published by the Department. Opinions or points of view expressed are thoseof the author(s) and do not necessarily reflect the official position or policies of theU.S. Department of Justice.

Table 4.2. Autoregressive Model for Nested Effects of Problem-Oriented Policing Activities on
Calls for Sen-ice
Parameter Estimate T Pr > IT/
Intercept Time Period:
Pre-intervention Intervention Post-intervention
Building Style Total Units Percent AFDC POP (Oakdale) POP (Gladstone) POP (Woodlawn) POP (Brighton) POP (Bellevue) POP (Ivanhoe)
1.9954
-0.0692 0.0208
- -0.1288 0.00 15 0.0 166
-0.0192 -0.0469 -0.01 40 -0.0371 -0.0195 0.0046
13.68
-0.97 0.26
- -1 -99 6.18 3.91
-1.67 -3.32 -0.92 -2.80 -1.06 0.37
0.0053
0.3320 0.7976
0.1854 0.0252 0.0597 0.0965 0.0007 0.3590 0.0054 0.2898 0.7098
-
Cov P a m Estimate Z Pr > IZI
D1.4G AR ( 1 ) Residual
0.2714 4.89 0.0001 1.9150 11.91 0.000 1
Model Fitting Information
Akaike's Information Criterion -85.2421 Schn.arz's Bayesian Criterion - 89.0943 Likelihood Ratio Test (DF = 14) 16.62 1 3
166.4843 -2 REML Log Likelihood Extra-dispersion scale 1.9410
Like the model presented in Table 4.1, this model reveals that low-rise public housing
sites Lvith fewer housing units and sites with a lower percentage of AFDC recipients were likely
48
This document is a research report submitted to the U.S. Department of Justice. This reporthas not been published by the Department. Opinions or points of view expressed are thoseof the author(s) and do not necessarily reflect the official position or policies of theU.S. Department of Justice.

to have fewer calls for service over time than high-rise sites, sites with large numbers of units,
and site, aith high rates of AFDC recipients. We also find that, as with the results from the
earlier model, the intervention period was not a significant predictor of change in calls for
service. thus ruling out an “announcement effect” of the problem-oriented policing program.
Table 4.2 also differentiates the impact of the problem-oriented policing program by public
housing site. The results show that the number of problem-oriented policing activities was a
significant predictor of change in calls for service in two of the six sites: Gladstone and Brighton.
More problem-oriented policing activities in Gladstone and Brighton led to greater reductions in
calls for service over time. Problem-oriented policing activities in the other four sites did not
significantiy impact calls for service.
Problem-Oriented Policing Impact bv Crime Tvpe
Our research also sought to exwnine the differential impact of problem-oriented policing
on different types of crime problems in public housing settings. Table 4.3 displays the parameter
estimates for problem-oriented policing activities across a series of nine autoregressive models
predicting specific calls types that, as with the earlier models, control for intervention period
(before, during. and after intervention), building style, total units and percent AFDC.
49
This document is a research report submitted to the U.S. Department of Justice. This reporthas not been published by the Department. Opinions or points of view expressed are thoseof the author(s) and do not necessarily reflect the official position or policies of theU.S. Department of Justice.

‘ I able 4 . 3 . I’arainetcr Estimates Ibr I’rohleiii-Oriented Policing Activities Predicting Specilic Cull Types (Controlling for l’irne I’ci iod. Iluilding Style, ’I‘otnl IJnits, and Percent AFUC)
I’arameter I’erson Interpersonal I’roperty Vehicle Nuisance Suspicious Morals Assistance Narcotics
I ritercep t Time Period:
Pre-intervention I titervent ion Post-intervention
Building Style Total llnits Perce tit AFIiC POI’ Activity
0.283
-0.067 -0.123
- -0.209
0.002“ * 0.026** -0.004
0.432
-0.066 0.1 18
-0.313* 0.002*+ 0.025 * * -0.026**
-
0.148
0. I46 0.370*
0.200 -0.000 0.012
4.036**
-
- 1 354
-0.176 -0.008
-0.065 -0.000 0.056*
-0.1 18**
-
1.137
-0.460** 0.01 1
-0.502 -
0.003 * * -0.045* -0.02 1
0.378
0.022 -0.158
- 0.052
0.002* -0.02 1 0.0 12
-1.575 0.483
0.275 -0.209* 0.1 17 -0.0 10
- - -0.639 -0.020
0.00 1 * 0.005* * -0.039 0.0 I9* 0.01 1 -0.027**
0.726
0.270 0.264
- -0.206 0.004* -0.0 12 -0.0 I2
~~
Cov l’arm
DlAG AT< ( I ) 0.3824 0.00 10 0.4048 0.04 1 7 0.0002 0.0346 0.00s 1 0.0067 0.000 1 0.0001 Residual 0.000 1 0.000 I 0.000 1 0.000 I 0.000 1 0.000 I 0.000 I 0.0001
This document is a research report submitted to the U.S. Department of Justice. This reporthas not been published by the Department. Opinions or points of view expressed are thoseof the author(s) and do not necessarily reflect the official position or policies of theU.S. Department of Justice.

Table 4.3 reveals five important results. First, problem-oriented policing activities
impacted differently upon the different categories of call2 for service. Specifically. our results '
show that problem-oriented policing activities led to reductions in calls for service concerning
interpersonal violent crimes (robberies, assaults. domestic assaults), property crimes (burglar\-).
vehicle crimes (auto theft), as well as citizen requests for police assistance (which includes
broken se\ver line, traffic control problems, and other service needs such as mentally disoriented
person walking around or a dead animal found).
We did not, however, find that the problem-oriented policing activities reduced disorder
types af crimes (e.g. drugs, morals, nuisance, and suspicious persons). We propose several
reasons why we find these results in our data: first, it might be the case that problem-oriented
policing cannot reduce drug market or social disorder problems; second, the Jersey City problem-
oriented policing program did not set out to explicitly reduce disorder problems (although site
teams did aim from the outset to reduce drug problems and some of their problem solving efforts
appeared geared towards addressing disorder problems with a view to solving more serious crime
problems - see Chapter 5 ) ; thrd, we suggest that public housing residents typically do not call
the police for drug and disorder incidents. We find, for instance. few calls for service regarding
public disturbances and drug problems in our data over the two and one-half year study period.
Indeed. the mean number of calls per month for disorder types of problems averaged about seven
calls per month. By contrast. the mean number of calls per month was higher for interpersonal ( R
= 15) and assistance (X = 1 1) problems. We propose two reasons why we find very few residents
calling the police about disorder and drug problems: first, we suggest that public housing
residents are most likely fearful of drug dealers and worry about retaliation; second, we suggest
that public housing residents are exposed to higher rates of violent qpes of crimes. As such, they
5 1
This document is a research report submitted to the U.S. Department of Justice. This reporthas not been published by the Department. Opinions or points of view expressed are thoseof the author(s) and do not necessarily reflect the official position or policies of theU.S. Department of Justice.

may be more inclined to call only about these serious problems than call the police about
comparatively minor problems.
Second. Table 4.3 shows that the intervention period is not significmr across eve? call
category. This result suggests that the relationship between problem-oriented policing activities
and calls for service during each two week period is not spurious and cannot be explained b? the
presence or absence of the intervention period. This means that the problem-oriented policing
activities had a direct effect on impacting crime problems.
Third, physical and social structural factors had different influences on different
categories of calls for service. Most notably, we found that those public housing sites with more
housing units had relatively more calls for service overtime than those public housing sites with
fewer housing units. This result held for all crime categories except propem. and vehicle crimes.
Fourth. Table 3.3 shows that there is a relationship benveen percent of AFDC recipiznts
and violent crime (person and interpersonal) calls. This result suggests that public housing sites
\ \ ith more AFDC recipients (and a common proxy for percent youths) have more violent crime
problems than those public housing sites with fewer AFDC recipients.
Finally, the autoregressive statistic (DIAG AR (1)) shows that for most call categories
there is autocorrelation between time periods as one would expect with time series data.
Interestingly, however, our results show that person and property crimes seem to be more
random than other categories of crime, a result that reflects what we tend to know about patterns
ot'crimc problems.
This document is a research report submitted to the U.S. Department of Justice. This reporthas not been published by the Department. Opinions or points of view expressed are thoseof the author(s) and do not necessarily reflect the official position or policies of theU.S. Department of Justice.

Chapter Five:
Social Observations
Systematic social observations of human behavior in public places comprise an important
method to measure changes in behavior over time. especially as the result a crime control
intervention like problem-oriented policing. This chapter reports the results of a series of
systematic observations over a one year time period on the 172 common areas across the six
public housing sites in our study.
5.1 Theoretical Perspective
Our study of behavior in public places began with the assumption that common areas in
public housing sites, like street blocks, qualify as behavior settings (see also Felson, 1995;
Perkins and Taylor, 1996; Taylor, 1988; Taylor, 1997; Taylor and Harrell, 1996; Taylor et. al.,
1984; Taylor, Shumaker and Gottfiedson, 1985). These behavior settings are “...regularly
occurring. temporally and spatially bounded person-environment units” (Taylor, 1988: 128).
The:. are made up of three major components: the setting participants, a standing pattern of
bchavior, and the surrounding physical environment which contains the behavior (Taylor, 1988).
Residents of a behavior setting (e.g. a street block or common area) are hypothesized to
engage in a variety of territorial behaviors which maintain the standing patterns of behavior or
the setting program and enhance informal social control of the behavior setting (Taylor 1988).
Several factors are thought to affect territorial behaviors. One perspective focuses on the effects
of disorder on territorial functioning (Skogan 1990; Skogan 1986; Taylor 1986) arguing that an
increase in disorder or incivilities leads to fear of crime which in turn leads to a withdrawal of
residents and then a decrease in the amount of informal social control (see also Wilson and
53
This document is a research report submitted to the U.S. Department of Justice. This reporthas not been published by the Department. Opinions or points of view expressed are thoseof the author(s) and do not necessarily reflect the official position or policies of theU.S. Department of Justice.

Kelling, 198 1).
Disentangling social activities (both deviant and non-deviant) and control mechanisms
(both formal and informal) at different units of analysis, and understanding the dominant
characteristics of these elements at different units of analysis, provides a theoretical and
empirical means to examine the patterns of illicit activity and the impact of control efforts at a
variety of units of analysis.
At each specific unit of examination, the physical boundaries, use of space and means of
control can be separately identified. For example, in an apartment, the unit of analysis may be
defined by the physical walls; the predominant uses of space may be defined as cooking dinner,
sleeping and watching television; and the principal means of control may be defined as the
discipline exerted by parents or other persons living in the same apartment. For business units,
social activities are usually dictated by the type of business operation. For example. activities at
fast food stores are characterized by food preparation by the employees and customers coming
and going from the store. For these businesses, the principal means of control may be defined as
the control exerted over the behavior of employees coupled with employee surveillance over the
customers.
The individual apartment or business unit, however, is also part of an address. By
examining the use of space at an address (or say a public housing site) one can observe a greater
range of activities and control mechanisms than those activities and controls identified at a single
apartment At the same time, however, the activities and controls at the public housing site
Include the activities and controls that operate in the single apartment. For example, a teenager
living in a public housing site is controlled by the discipline exerted by his or her guardian. This
same teenager. however, is also part of a social control network that operates on the public
54
This document is a research report submitted to the U.S. Department of Justice. This reporthas not been published by the Department. Opinions or points of view expressed are thoseof the author(s) and do not necessarily reflect the official position or policies of theU.S. Department of Justice.

housing site either through a peer network living in the same public housing site or by the site
manager of the complex. Othc- controls can also be identified which temper the behavior of the
teenager when the individual person is examined as the unit of analysis. These social controls
derive, for example, from a variety of sources such as from schools and sporting clubs. However,
the specific place-controls exerted against all people who go about their day-to-day business
when the place becomes the unit of analysis provides a different matrix of controls than those
identified when the controls and activities of the individual person is examined.
Similarly, when business addresses are examined, a specific matrix of social controls can
be identified. For example, groups of stores create a focal point for activity providing local
citizens with access to a range of goods and services. While surveillance in the individual store is
usually conducted by the employee, surveillance across these groups of stores is sometimes
maintained by private security guards or the police. At some places police may be dispatched to
an address or drive-by a problem location providing formal control both over the individual store
and the address (or collection of stores). Additionally, these addresses are controlled through
informal control mechanisms dictated by the relationships that operate at individual housing or
Lvork units (e.g see La Gory, 1983).
Patterns of social activity and control mechanisms can also be identified at larger, more
macro. units of analysis. For example, at the area unit of analysis social networks exist between
community members (e.g. see Yancey, 1983) and physical barriers divide one set of routine
activities from another (e.g. see Shaw and McKay, 1942. See also Cohen and Felson, 1979). For
example, as one moves from a residential to a business section of a city the boundaries between
neishborhoods can be constructed based on the place where shops cease to exist and homes
dominate the landscape. Moreover, the degree to which one type of behavior (such as licit
55
This document is a research report submitted to the U.S. Department of Justice. This reporthas not been published by the Department. Opinions or points of view expressed are thoseof the author(s) and do not necessarily reflect the official position or policies of theU.S. Department of Justice.

behavior) prevails over another (such as illicit behavior) in the neighborhood is dependent both
on the level and type of control mechanisms at work.
By changing the unit of examination from the public housing site to the neighborhood the
types of social activities that predominate are also different. For example, those activities that
operate in the wider community. while embracing people's behavior at the address or
apartmenUbusiness level of analysis, also include a range of other ventures such as journeys of
people from their house to the store to work and to social events in the local area (see Cohen and
Felson, 1979).
Unlike the place-specific social controls at the apartment, or business. or public housing
site levels of analysis the social controls that are exerted in the wider comnunity derive primarily
from larger social structural factors such as schools. churches and the businesses that interact
with all users of the public and private space of the neighborhood. Consistent with this broad
focus, research using this macro (community) level of analysis generally examines social
net\\orks and these broad social structural factors which control human behavior (see Gans,
1963, Shaw and McKay, 1942; Yancey, 1983).
5.2 Systematic Social Observational Data
Researchers use a variety of methods to measure social activity. Surveying residents
about their perceptions of street activity, for example, is a commonly utilized method of inquiry
(see for example BroNn and Altman 1981; Bursik and Grasmick 1993; Greenberg and Rohe
1986: Hirschfield, Broum and Bowers 1996; Mazerolle, Kadleck and Roehl, 1998; Periuns and
Taylor 1996: Rosenbaum and Lavrakas 1995; Skogan 1986). Another u-ay of measuring social
activity is through on-site field observations of street activity (see for example Mazerolle,
Kadleck and Roehl, 1998; Perkins and Taylor 1996: Taylor 1995a; Taylor 1996). Ralph Taylor,
56
This document is a research report submitted to the U.S. Department of Justice. This reporthas not been published by the Department. Opinions or points of view expressed are thoseof the author(s) and do not necessarily reflect the official position or policies of theU.S. Department of Justice.

however, suggests that residents’ perceptions of disorder and on-site assessments of disorder mav
not be measuring the same underlying construct (Perkins and Taylor, 1996: Taylor, 199ja;
Taylor, 1995b; Taylor, 1996). On-site assessments appear to be measuring the actual conditions
of a location while resident surveys appear to be capturing the actual conditions of a location
filtered through the various psychological attributes and psychological processes of residents. In
fact, one study by Taylor (1 995c) finds that up to 90 percent of the variation in residents‘
perceptions of ecological conditions may be psychological rather than ecological.
The data reported in this chapter draw from on-site observations of social activity in the
172 common areas across the six public housing sites in our study. Our research supports and
extends prior research that uses on-site ratings by trained researchers in order to capture the
“ecological” changes in the neighborhood or street. We do not argue against the use of surveys
that focus on residents’ perceptions of their neighborhood (indeed see Mazerolle, Kadleck, and
Roehl, 1998). Rather, ours is an argument suggesting that residents may not be the most
objective lens from kvhich to view the physical changes on a street.
We conducted five waves of observations over the one and a half years of our evaluation
project (Spring 1995, Summer 1995, Fall 1995, Winter 1996, Spring 1996). During each wave
Lve conducted one observation in four distinct time periods (weekend day, weekend night,
Lveekda!, day, weekday night) for each of the 172 common areas. In total we conducted 3440
obsewations across the five waves, across the four time periods over the 172 common areas.
Structured field observations of routine licit activities (e.g. pedestrians, children playing, people
\valking along) and illicit activities (e.g. drug selling, fighting) were made of each cornmon area.
Our decision to conduct four observations per common area during each wave derived
from our understanding that common areas in public housing sites have stable patterns of
57
This document is a research report submitted to the U.S. Department of Justice. This reporthas not been published by the Department. Opinions or points of view expressed are thoseof the author(s) and do not necessarily reflect the official position or policies of theU.S. Department of Justice.

behavior, or rhythms of recurring behavior and activity, that are somewhat predictable and
routine (see also Mazerolle, Roehl and Kadleck, 1998; Taylor, 1988). Felson (1 995) also
suggests that activities occur in fairly predictable rhythms where patterns of behavior are dictated
by a host of factors including residents' working hours, sleeping times. and recreational times
(see also Mazerolle, Roehl and Kadleck, 1998).
We suggest that the reliabiliQ and validity of on-site observations increases as the unit of
analysis decreases in size. We propose that public housing common areas and other small units
of analysis (e.g. street blocks, lot spots) have fewer and less complex patterns of street activity
(or standing patterns of behavior) than neighborhoods, communities, or other larger units of
analysis that hade more complex and varied patterns of social behavior. For example, a public
housing common area may have four distinct time periods with four distinct patterns of behavior:
( 1 ) the morning hours when residents are teking children to school or going to work, (2) the
daytime hours when elderly people or non-daytime working adults use the common spaces, (3)
the afiernoon hours nhen children are coming home from school and adults are returning home
trom Lvork. and (4) the evening hours when people are at socializing in the common areas. This
kind of predictability in the standing patterns of behavior on a street block are rarely present for
neighborhoods for a number of reasons: the overall number of people frequenting a
neighborhood makes it more difficult to anticipate standing patterns of behavior; the range of
land use patterns across a neighborhood (businesses. single family homes, multi-dwellings)
creates more complex rhythms of social activity; and the diversity of people living and working
in neighborhoods leads to more complex and diverse patterns of social behavior.
58
This document is a research report submitted to the U.S. Department of Justice. This reporthas not been published by the Department. Opinions or points of view expressed are thoseof the author(s) and do not necessarily reflect the official position or policies of theU.S. Department of Justice.

5.3 Results
The analyses presented in this section shokv the percent change in licit, marginal, and
illicit activities over five waves of observational data. We measure changes in the nature of social
behavior in common areas by examining the proportion of licit activities to illicit activities over
time. It is difficult to make such comparisons using the raw numbers because the volume of
social activity varies widely from season to season. The licit activities observed during our field
observations include children playing, police patrolling, and people walking, conversing, and
engaging in recreation. Marginal behaviors consist of loitering, gambling, and suspicious or
borderline activities for which there are city ordinances. Illicit activities include more serious
crimes and disorders such as selling drugs, fighting, drinking in public, and blaring loud music.
Figures 5.1 through 5.6 present the changes in social activity by site. Overall, the graphs
show that the percent of observed illicit behavior is very small (about ten percent at the start of
the project and decreasing to less than five percent by the end of the project). This result is
consistent Lvith most criminological research reporting that crime is. in fact, a rare event and is
similarly a rare event in public housing sites. The vast majority of observed social activity across
the sis target public housing sites was regular, licit activities such as children playing, people
Lvalking, conversing, and engaging in recreational activities. Of particular note is the fact that the
percent of licit activities increased over the course of our problem-oriented policing project
across all six of the public housing sites in our study.
59
This document is a research report submitted to the U.S. Department of Justice. This reporthas not been published by the Department. Opinions or points of view expressed are thoseof the author(s) and do not necessarily reflect the official position or policies of theU.S. Department of Justice.

L C
Figure 5.1. Social Observations at Oakdale Public Housing Site
Illicit
60
This document is a research report submitted to the U.S. Department of Justice. This reporthas not been published by the Department. Opinions or points of view expressed are thoseof the author(s) and do not necessarily reflect the official position or policies of theU.S. Department of Justice.

Figure 5.2. Social Observations at Gladstone Public Housim- Site
E Ilkit 0 Marginal -l =Licit
61
This document is a research report submitted to the U.S. Department of Justice. This reporthas not been published by the Department. Opinions or points of view expressed are thoseof the author(s) and do not necessarily reflect the official position or policies of theU.S. Department of Justice.

I Figure 5.3. Social Observations at Woodlawn Public Housing Site
0 Marginal
62
This document is a research report submitted to the U.S. Department of Justice. This reporthas not been published by the Department. Opinions or points of view expressed are thoseof the author(s) and do not necessarily reflect the official position or policies of theU.S. Department of Justice.

Figure 5.4. Social Observations at Ivanhoe Public Housing Site
Illicit 0 Marginal r l Licit
63
This document is a research report submitted to the U.S. Department of Justice. This reporthas not been published by the Department. Opinions or points of view expressed are thoseof the author(s) and do not necessarily reflect the official position or policies of theU.S. Department of Justice.

Figure 5.5. Social Obsemations at Brighton Public Housing Site
0 Marginal I Licit
64
This document is a research report submitted to the U.S. Department of Justice. This reporthas not been published by the Department. Opinions or points of view expressed are thoseof the author(s) and do not necessarily reflect the official position or policies of theU.S. Department of Justice.

Figure 5.6. Social Observations at Bellevue Public Housing Site
0 Marginal =Licit
65
This document is a research report submitted to the U.S. Department of Justice. This reporthas not been published by the Department. Opinions or points of view expressed are thoseof the author(s) and do not necessarily reflect the official position or policies of theU.S. Department of Justice.

Our social observational data suggest two main outcomes: first, the ratio of licit to illicit
social activity in the six public housing sites in or- study increased over the one year intenention
period. Second, it appears that the problem-oriented policing program most likely led to
decreases in marginal activity and. to a lesser extent, the program probably led to decreases in
illicit actixrity. We remind readers, however, that the problem-oriented policing program goals
were to reduce serious crime activity. The results presented in Chapter Four showed significant
impacts on serious crime, especially in Bnghton and Gladstone, but no real impact on disorderly
types of activity. By contrast, the results fiom our social observations suggest that the problem-
oriented policing seems effective at reducing marginal type activities such as loitering, gambling,
and suspicious behavior.
LVe do not believe that the results from the social observations (Chapter Five) and the
calls for service (Chapter Four) are inconsistent with one anothe;. Rather, we propose two
arguments that bring the two findings together. First, calls for service do not adequately measure
the moun t of disorder activity in public housing sites because residents simply do not seem to
call about this type of low-level activity. Second, we believe that the focus of the problem-
oriented policing program implemented in the public housing sites in Jersey City was consistent
Lvith what Wilson and Kelling (1982) refer to as the “broken windows” hypothesis. It appears
that problem-solving teams attempted to impact serious crime problems by targeting some of the
inci\,iliry behaviors in public housing sites. Our charts presented in this chapter tend to support
these two arguments and suggest that the police were in fact successhi at reducing illicit
activities.
66
This document is a research report submitted to the U.S. Department of Justice. This reporthas not been published by the Department. Opinions or points of view expressed are thoseof the author(s) and do not necessarily reflect the official position or policies of theU.S. Department of Justice.

Chapter Six:
Conclusions
Crime problems in public housing sites have a reputation as being more intractable than
problems in other high crime places. High-rise public housing sites are typically located in poor
neighborhoods with high crime rates (Skogan and .4nnan. 1994 139-!30). Residents are
generally older and poor and the non-elderly residents are disproportionately single with children
and unemployed. Skogan and Annan (1 994) suggest that “residents often lack the capaciq to
defend themselves, be it against predators, gangs looking for revenge, or drug dealers engaged in
turf wars or intimidation” (1994: 130; see also Popkin et al, 1997). hiany policy makers believe
that only hard core policing tactics (e.g. arrests, sweeps) that characterize the “War on Drugs”
can reduce the significant crime problems in public housing sites and program evaluators report
very few interventions that seem to make lasting change.
Our evaluation of a problem-oriented policing program implemented in six of the most
crime ridden public housing sites in Jersey City challenges the notion that public housing sites
represent the last bastion of program resistance. Our research shows that the problem-oriented
policing activities, collectively implemented by site teams comprising police, public housing
officers. and social service liaison officers, can significantly reduce interpersonal, property,
vehicle, and assistance calls for service. Our research found that the reductions in calls for
sewice for these categories of crime were significant and attributable to the number of problem-
orienred policing activities implemented in each site. We did not find, however, significant
reductions in the number of calls for service over time for disorder-type problems and drug
market problems. We expect that the low base rate of calls from public housing residents
67
This document is a research report submitted to the U.S. Department of Justice. This reporthas not been published by the Department. Opinions or points of view expressed are thoseof the author(s) and do not necessarily reflect the official position or policies of theU.S. Department of Justice.

regarding incivilities and drug problems confounds this result. Our social observational data
throws Lveight behind clur supposition that the calls for sewice are an inadequate measure of the
impact of the problem-oriented policing program on disorderly p-pe activity. Indeed. our results
show that marginal and illicit activity decreased across the six public housing sites during the one
year intervention period.
Our research also found differences among the six public housing site teams in their
ability to impact crime problFs . Two site teams in particular - Gladstone and Brighton -
significantly reduced the number of calls for service over time. Importantly, we found that the
physical structure differences fiat were significant predictors of changes in calls for service over
time (total number of units) did not explain why Brighton and Gladstone site teams were most
successful in reducing crime problems. Moreover. social structural factors such as percent
unemployed, percent AFDC, and percent single headed households did not exhibit strong
relationships to the changes overtime in calls for service. These social structural factors also
varied qualitatively between the two successful sites: Brighton and Gladstone. For instance,
building style (Brighton was a low rise and Gladstone a high rise) and the sheer number of
problem-oriented policing activities alone could not explain the reason why these two site teams
u ere most successful in reducing serious crime problems. We concluded that stable membership
in the site-based problem-solving teams combined nith a high volume of completed problem-
solving activities contributed to the successful reduction in calls for service regarding serious
crime problems in Brighton and Gladstone.
Our research has several important methodological and policy implications and our
research offers some general and important insights inro the growing problem-oriented and
communit>.-oriented policing literature. The problem-oriented policing program implemented in
68
This document is a research report submitted to the U.S. Department of Justice. This reporthas not been published by the Department. Opinions or points of view expressed are thoseof the author(s) and do not necessarily reflect the official position or policies of theU.S. Department of Justice.

the Jersey City public housing sites comprised a wide range of responses: CPTED (e.g. lighting),
sitliational crime prevention (e.g. pay phone capabilities to enable outgoing calls only). civil
remedies (e.g. evictions and special leaseholder provisions), traditional policing (e.p. sn-eeps.
arrests, surveillances). treatment (e+ drug treatment and alcohol counseling), and informal
social control (e.g. stability of CSO's assigned to individual housing sites). ! , , e found that the
two most successful sites (Gladstone and Brighton) implemented more police-initiated strategies
than those sites that relied more upon public housing or social service responses. This is not to
say that traditional policing tactics are more effective, but that the coercive authority of the police
within a problem-oriented policing program is important to bringing about change. This finding
is consistent with Green's (1 996) evaluation of Oakland Police Department's Beat Health
program that found that city inspectors were effective in cleaning up blighted places with drug
dealing problems when they gained access to properties through police problem-solving efforts.
We conclude, therefore, that sworn officers need to take an active and high profile role in
problem-solving n-ithin a team context in order to bring about change.
Our research also challenges the widely-held notion that crime-ridden, high-rise public
housing sites Lvhere the residents are typically poor, single, unemployed and with children are
places that are highly resistant to change. We found that the problem-oriented policing program
implemented across six study sites had a differential impact and that one of the key defining
factors that led to decreases in violent crime, property, vehicle and assistance calls was the
stability of the problem-oriented policing teams. This result suggests that long term assignments
of police officers to lvork within particular public housing settings might reduce the distrust that
man>. public housing residents feel about the police in general, it might give the police time to
get to know the residents better, it would most likely give the police a knowledge base regarding
69
This document is a research report submitted to the U.S. Department of Justice. This reporthas not been published by the Department. Opinions or points of view expressed are thoseof the author(s) and do not necessarily reflect the official position or policies of theU.S. Department of Justice.

the types of social services available to help residents in trouble, and it would give the housing
authority personnel an opy-tunity to work with the p o k e to target some of the problem people
and places within public housing communities.
Our research offers some important measurement and methcdological insights. Firs:. our
study systematically measured the process of problem-oriented policing and carehl1)- integrared
the problem-oriented policing activities with our impact assessment. We documented the exTeni
of scanning efforts, we examined the types of analysis conducted on a defined problem, we
measured the quantity and qmdity of problem-solving responses, and we recorded efforts to
assess the impact of problem-oriented policing tactics. This process formed an integral
component to our assessment of how problem-oriented policing programs succeed (or flounder)
in public housing sites. Finally, by using a mixed model we were able to disentangle the relative
influences of problem-oriented policing activities across the six public housing sites in our study.
.As such. this method provides an innovative approach to comparing and contrasting the factors
that constrain or enhance the control of crime problems in public housing sites.
70
This document is a research report submitted to the U.S. Department of Justice. This reporthas not been published by the Department. Opinions or points of view expressed are thoseof the author(s) and do not necessarily reflect the official position or policies of theU.S. Department of Justice.

References
Annan, Sampson 0. and Wesley G. Skogan. 1953. Drug Enforcement in Public Hoicsing: Signs of Success in Denver. Washington, D.C.: The Police Foundation.
Brantingham. Paul and Patricia Brantingham. 198 1. Environmental Criniinologp. Prospect Heights, IL: U’aveland Press, Inc.
Brill, William and Associates. 1977. Victimization, Fear of Crime, and Altered Behavior: .4 Profile of the Crime Problem in Capper Dwellings. Washington. D. C.. LVashington, D.C.: U.S. Department of Housing and Urban Development..
Brown, Barbara B. and Irwin Altman. 198 1. Territoriality and residential crime: A conceptual fi-amework. In Paul J. Brantingham and Patricia L. Brantingham (eds.), Environmental Criminology. Prospect Heights, IL: Waveland.
Buerger, Michael E. and Lorraine Green Mazerolle. 1998. Third Party Policing: A Theoretical Analysis of an Emerging Trend. Justice Quarferly.15 (Number 2) pp 301-328.
Bursik, Robert J. and Harold G. Grasmick. 1993. Neighborhoods and Crime: The Dimensions of Effective Communiry Control. New York: Lexington.
Cohen. L.E. and Marcus Felson. i979. Social change and crime rate trends: A routine activity approach. American Sociological Review 44: 588-608.
DeFrances. Carol J. and Steven K. Smith. 1994. Crime and Neighborhoods. Washington, DC: U.S. Bureau of Justice Statistics.
DunLvorth. Terence and Aaron Saiger. 1993. Drugs and Crime in Public Housing: A Three-City .4nalwis. Santa Monica, CA: RAND.
Eck. John E. and William Spelman. 1987. Problem Solving: Problem-Oriented Policing in iVert.port News. Police Executive Research Forum. Washington, D.C.: National Institute of Justice.
Felson. Marcus. 1995. Zgot rhythms: crime rhythms and routine activities. Paper presented at the .4nnual Meetings of the American Society of Criminology, Boston, Massachusetts.
GajeLvski. F.. L. Green and D. Weisburd. 1993. Crime Prevention Programs in Public Housing: The Jersey City Approach to Drug and Violent Crime Problems in Public Housing. Grant proposal to the National Institute of Justice, Department of Justice. Washington DC.
Cians, H. 1962. The Urban Villagers. New York: Free Press.
71
This document is a research report submitted to the U.S. Department of Justice. This reporthas not been published by the Department. Opinions or points of view expressed are thoseof the author(s) and do not necessarily reflect the official position or policies of theU.S. Department of Justice.

Giacomazzi, A., E. McGarrell and Q. T h m a n . 1996. Community Policing and Public Housing: A Process Evaluation of a Collaborative Straregy to Reduce Crime, Fear and Disorder in SToknne, Washingronz Paper presented at the Annual Conference +the Academy of Criminal Justice Sciences. Las Vegas.
Gilsinian. James F. 1989. They is Clowning Tough: 91 1 and the Social Construction of Realiv. Criminology. 27(2): 329-341.
Goldstein. Herman. 1990. Problem-Oriented Policing. New York: McGraw-Hill, Inc.
Green, Lorraine. 1996. Policing Places with Drug Problems. Thousand Oaks, CA: Sage Publications.
Greenberg. Stephanie W. and William M. Rohe. 1986. Informal social control and crime prevention in modern urban neighborhoods. In Ralph B. Taylor (ed.), Urban Neighborhoods: Research and Policy. New York: Praeger.
Hirshfield, Alex, Peter Brown and Kate Bowers. 1996. New perspectives on relationships between crime, neighborhood location, social cohesion and disadvantage in urban areas. Paper presented at the Annual Meetings of the American Society of Criminology, Chicago.
Jeffery. C. Ray. 1977. Crime Prevention Through Environmental Design. Beverly Hills: Sage.
Littell, Ramon C.., George A. Milliken, Walter W. Stroup, and Russell D. Wolfinger. 1996. SAS System for Mixed Models. Cary, NC: SAS Institute Inc.
Klinger. Da\.id A. and George S. Bridges. 1997. Measurement Error in Calls for Service as an Indicator of Crime. Criminology. 35: 705-726.
hjlazerolle. Lorraine Green and Jan Roehl. 1998. Controlling Drugs and Social Disorder Using .
Civil Remedies: Final Report of a Randomized Field Experiment in Oakland, California. Final Report to the National Institute of Justice.
Xlazerolle. Lorraine Green, Colleen Kadleck. and Jan Roehl. 1998. Controlling Drug and Disorder Problems: The Role of Place Managers. Criminology. 36(2): 371-403.
hlazerolle. Lorraine Green, Jan Roehl. and Colleen Kadleck. 1998. Controlling Social Disorder Using Civil Remedies: Results from a Randomized Field Experiment in Oakland, California Civil Remedies and Crime Prevention: Crime Prevention Studies. Vol 9. blonsey. NY: Criminal Justice Press.
Nenman. Oscai. 1973. Defensible Space: Crime Prevention Through Urban Design. Xew- York: b 1 acmi 11 an.
72
This document is a research report submitted to the U.S. Department of Justice. This reporthas not been published by the Department. Opinions or points of view expressed are thoseof the author(s) and do not necessarily reflect the official position or policies of theU.S. Department of Justice.
Keuman. Oscar and Karen A. Franck. 1980. Factors Influencing Crime and Instabiliy in Urban Housing Developments. Washington. D.C.: National Institute of Justice. -
Perkins, Douglas D. and Ralph B. Taylor. 1996. Ecological assessments of communit): disorder: Their relationship to fear of crime and theoretical implications. American Journal of Community Psychology 24: 63-107.
Pierce. G., S. Spaar, and L. Briggs. 1988. The Character of Police Work: Strategic and Tactical Implications. Center for Applied Social Research. Boston: Northeastern University.
Popkin. Susan, Victoria Gwiasda, Jean Amendolia, Andrea Anderson, Gordon Hanson, Wendell Johnson, Elise Martel, Lynn Olson, Dennis Rosenbaum. 1997. The Hidden War: The Battle to Control Crime in Chicago 's Public Housing. Final Report to the National Institute of Justice. Abt Associates.
Rainwater, Lee. 1970. Behind Ghetto Walls: Black Families in a Federal Slum. Chicago: Aldine.
Reiss, Albert J. 1971. The Police and the Public. New Haven, Corm.: Uale University Press.
Roncek, Dennis W., Ralph Bell, and Jeffrey Francik. 198 1. Housing Projects and Crime. Social Problems 29: 15 1-166.
Rosenbaum, Dennis P. and Paul J. Lavrakas. 1995. Self-reports aboutplace: The application of survey and interview methodr to the studv of small areas. In John E. Eck and David LVeisburd (eds.), Crime and Place: Crime Prevention Studies Vol4. Washington, DC: Police Executive Research Forum
Searle. S.R., G. Castella, and C.E. McCulloch. 1992. Variance Components. Wiley: New York.
Shau. Clifford R. and Henry D. McKay [1942] 1969. Juvenile Delinquency and Urban Areas. (revised ed.). Chicago, 111: University of Chicago.
Sherman. Lawrence W., Patrick R. Gartin and Michael Buerger. 1989. Hot Spots of Predatory Crime: Routine Activities and the Criminology of Place. Criminology. 27(1): 27-55.
Sherman. Lawrence W., James W. Shaw and Dennis P. Rogan. 1995. The Kansas City Gun Experiment. Research in Brief Series. Washington D.C.: National Institute of Justice.
Sherman. LaLvrence W. and David Weisburd. 1995. General Deterrent Effects of Police Patrol in Crime 'Hot Spots': A Randomized, Controlled Trial. Justice Quarterly. 12(4): 625-648.
Skogan. IJ'esley G. 1956. Fear of crime and neighborhood change. in Albert J. Reiss, Jr. and lllichael Tonry (eds.), Communities and Crime. Chicago: University of Chicago Press
73
This document is a research report submitted to the U.S. Department of Justice. This reporthas not been published by the Department. Opinions or points of view expressed are thoseof the author(s) and do not necessarily reflect the official position or policies of theU.S. Department of Justice.

Skogan, Wesley G. 1990. Disorder and Decline: Crime and the Spiral of Decay in American Neighborhoods. New York: Free Press.
Skogan, Wesley G. and Sampson 0. Annan. 1994. Drugs in Public Housing: Toward an Effective Police Response. In D.L. MacKenzie and C.D. Uchida (eds.), Drugs and Crime: Evaluating Public Police Initiatives. Thousand Oaks, CA: Sage.
Taylor, Ralph B. 1988. Human Territorial Functioning. Cambridge: University of Cambridge Press.
Taylor, Ralph B. 1995a. The impact of crime on communities. Annals 539: 28-45.
Taylor, Ralph B. 1995b. Responses to disorder: relative impacts of neighborhood structure, crime and physical deterioration on residents and business personnel. Final Report for Grant 94-IJ-CX-0018.
Taylor, Ralph E. 199%. Going grime reduction: conceptual andpractical implications of measuring and distinguishing community disorder. Non-published manuscript. November 1995.
Taylor. Ralph B. 1996. Crime and grime over two decades: Stability, decline, and spatial inequality in Charm City neighborhoods. Draft Executive Summary .
Taylor, Ralph B., Stephen D. Gottfredson, and Sidney Brower. 1984. Block crime and Fear: Defensible Space, Local Social Ties, and Territorial Functioning. Journal of Research in Crime and Delinquency. 21(4): 303-33 1.
Ta? lor. Ralph B. and Adele V. Harrell. 1996. Physical Environment and Crime. Washington. DC: National Institute of Justice.
Ta>,lor, Ralph B., Sally A. Shumaker and Stephen D. Gottfredson. 1985. Neighborhood-level links between physical features and local sentiments: Deterioration, fear of crime, and confidence. Journal of Architecture and Planning Research 2: 26 1-275
Li.aring, Elin J. 1998. Incorporating Co-offending in Sentencing Models: An Analysis of Fines Imposed on Antitrust Offenders. Journal of Quantitative Criminology. 1413): 283-305.
li’amer. Barbara D. and Glenn L. Pierce. 1993. Reexamining Social Disorganization Theory Using Calls to the Police as a Measure of Crime. Criminology. 31(4): 493-517.
iIt’eisburd. David and Lorraine Green. 1994. Defining the Street-Level Drug Market. In D.L. MacKenzie and C.D. Uchida (eds.), Drugs and Crime: Evaluating Public Police Initiatiiyes. Thousand Oaks, CA: Sage.
Weisburd. David and Lorraine Green. 1995. Policing Drug Hot Spots: The Jersey City Dhl-A
74
This document is a research report submitted to the U.S. Department of Justice. This reporthas not been published by the Department. Opinions or points of view expressed are thoseof the author(s) and do not necessarily reflect the official position or policies of theU.S. Department of Justice.

Experiment. Justice Quarterly 12: 7 1 1-736.
Weisel, Deborah L. 19Qna. Tackling Drug Problems in Public Housing: A Guide fQr Police. Q
Washington, D.C.: Police Executive Research Forum.
Weisel, Deborah L. 1990b. Playing the Home Field: A Problem-Oriented Approach to Drug Control. American Journal of Police. 9( 1): 75-95.
Wilson, James Q. and George Kelling. 1982. 3roken windows. The Atlantic Monthly March: 29- 38.
Yancey, W. 1983. Spaced Out: Human Behavior and the Built Environment. In Pipkin, J. La Gory and J. Blau (edg) Remaking the City: Social Science Perspectives on Urban Design. Albany: The States University of New York Press.
75
This document is a research report submitted to the U.S. Department of Justice. This reporthas not been published by the Department. Opinions or points of view expressed are thoseof the author(s) and do not necessarily reflect the official position or policies of theU.S. Department of Justice.