probing synergism, antagonism, and additive effects in
TRANSCRIPT

Marquette Universitye-Publications@Marquette
Chemistry Faculty Research and Publications Chemistry, Department of
6-1-2006
Probing Synergism, Antagonism, and AdditiveEffects in Poly(vinyl Ester) (PVE) Composites withFire RetardantsEverson KandareMarquette University
Grace ChigwadaMarquette University
Dongyan WangCornell University
Charles WilkieMarquette University, [email protected]
Jeanne HossenloppMarquette University, [email protected]
Accepted version. Polymer Degradation and Stability, Vol. 91, No. 6 ( June 2006): 1209-1218. DOI. ©2006 Elsevier. Used with permission.NOTICE: this is the author’s version of a work that was accepted for publication in PolymerDegradation and Stability. Changes resulting from the publishing process, such as peer review,editing, corrections, structural formatting, and other quality control mechanisms may not bereflected in this document. Changes may have been made to this work since it was submitted forpublication. A definitive version was subsequently published in Polymer Degradataion and Stability,VOL 91, ISSUE 6, June 2006, DOI.

NOT THE PUBLISHED VERSION; this is the author’s final, peer-reviewed manuscript. The published version may be accessed by following the link in the citation at the bottom of the page.
Polymer Degradation and Stability, Vol. 91, No. 6 (June 2006): pg. 1209-1218. DOI. This article is © Elsevier and permission has been granted for this version to appear in e-Publications@Marquette. Elsevier does not grant permission for this article to be further copied/distributed or hosted elsewhere without the express permission from Elsevier.
1
Probing Synergism, Antagonism, and
Additive Effects in Poly(vinyl Ester)
(PVE) Composites with Fire
Retardants
Everson Kandare Department of Chemistry, Marquette University
Milwaukee, WI
Grace Chigwada Department of Chemistry, Marquette University
Milwaukee, WI
Dongyan Wang Department of Materials Science and Engineering, Cornell
University
Ithaca, NY
Charles A. Wilkie Department of Chemistry, Marquette University
Milwaukee, WI
Jeanne M. Hossenlopp Department of Chemistry, Marquette University
Milwaukee, WI

NOT THE PUBLISHED VERSION; this is the author’s final, peer-reviewed manuscript. The published version may be accessed by following the link in the citation at the bottom of the page.
Polymer Degradation and Stability, Vol. 91, No. 6 (June 2006): pg. 1209-1218. DOI. This article is © Elsevier and permission has been granted for this version to appear in e-Publications@Marquette. Elsevier does not grant permission for this article to be further copied/distributed or hosted elsewhere without the express permission from Elsevier.
2
Abstract:
Potential fire retardants, including copper hydroxy dodecyl sulfate
(CHDS), organically-modified montmorillonite (Cloisite 15A), and resorcinol
di-phosphate (RDP), were added to pure poly(vinyl ester) (PVE) individually
or in combinations at low concentration formulations. Thermogravimetric
analysis and cone calorimetry were used to study the thermal stability and
fire performance of the composites. Synergistic, antagonistic, and additive
effects were observed depending on the specific formulation. Time to self-
sustained combustion is greatly reduced, but the flame extinguishes faster,
for the composites containing CHDS alone or in combination with either RDP
or Cloisite 15A compared to the virgin polymer. The presence of copper in
PVE composites containing additive, CHDS, may be responsible for the
enhanced thermal stability and fire performance.
Keywords: Poly(vinyl ester), Layered hydroxy salt, Resorcinol di-phosphate,
Thermal stability, Fire retardancy.
1. Introduction
Halogen-containing fire retardants (FR) have been used in
engineering thermoplastics and epoxy resins to improve their thermal
stability and fire performance [1-4]. Despite their demonstrated
effectiveness in reducing flammability, the use of halogen-containing
fire retardants in commercial plastics is limited because of their
corrosivity and potential toxicity. Various non-halogen-containing fire
retardants, such as metal oxides, metal hydroxides, metal salts,
nitrogen containing, phosphorus containing and cellulose fibers, have
been used to enhance the thermal behavior of polymers [5-8].
Aluminum trihydrate (ATH) and magnesium hydroxide (MHD)
have been extensively used as fire retardants [5,6]. An inherent
disadvantage for ATH and MHD is that they are only effective at very
high loadings, about 65%, which can have detrimental effects on the
mechanical properties of the polymer. Phosphorus-containing additives
have shown excellent thermal stabilization effects on polymers,
however, they tend to cause plasticization [9]. It has been postulated
that phosphates are oxidized to phosphoric acids during combustion
and these acids may alter the degradation pathways of the polymer
and promote char formation [6].
NOT THE PUBLISHED VERSION; this is the author’s final, peer-reviewed manuscript. The published version may be accessed by following the link in the citation at the bottom of the page.
Polymer Degradation and Stability, Vol. 91, No. 6 (June 2006): pg. 1209-1218. DOI. This article is © Elsevier and permission has been granted for this version to appear in e-Publications@Marquette. Elsevier does not grant permission for this article to be further copied/distributed or hosted elsewhere without the express permission from Elsevier.
3
Layered inorganic/organic hybrids, including smectite clays such
as montmorillonite (MMT), hectorite (HET), and magadiite (MGH), and
synthetic layered hydroxides like layered hydroxy salts (LHSs), layered
double hydroxides (LDHs), and hydroxy double salts (HDSs), have
recently emerged as potential fire retardants [10-16]. Organic-
inorganic polymer nanocomposites have superior properties, such as
increased thermal stability, heat resistance, mechanical strength and
reduced permeability and moisture absorption, compared to the virgin
polymer [17].
Fire retardants when used individually are effective in improving
some, but not all of the physical properties of the virgin polymers.
Combining fire retardant additives can be more effective than using
them individually. Formulations with at least two fire retardants may
have additive, synergistic, and/or antagonistic effects. An additive
effect is the sum of the effects of the two components taken
independently. Synergism means that the observed effect is greater
than additive, while an antagonistic effect is less than an additive
[18,19]. In this study the cumulative effect of potential fire retardants,
resorcinol di-phosphate, montmorillonite clay (Cloisite 15A), and an
LHS, copper hydroxy dodecyl sulfate (CHDS), either individually or in
combination, has been investigated. The long-term goal of this work is
to develop fire retardant additive combinations that will be effective
with respect to multiple fire retardant measures at low concentrations,
hence avoiding high fraction loading.
2. Experimental
Cloisite 15A, an organically-modified montmorillonite, containing
a dimethyl dihydrogenated tallow ammonium cation (hydrogenated
tallow is a mixture of ~65% C18, ~30% C16, and ~5% C14)
(Southern Clay Products, Inc.), vinyl ester resin, bisphenol-A/novalac
epoxy, mass fraction of 67% in styrene [Derakane 441-400] (Ashland
Chemical Co.); 2-butanone peroxide [BuPO] initiator; cobalt
naphthenate catalyst [CoNp] (Aldrich Chemical Co.); sodium dodecyl
sulfate (75.0%) [SDS]; FTIR grade-potassium bromide [KBr] (Alfa
Aesar); hydrated copper nitrate (98.9%) [Cu(N03h·2V2H20] (Fisher
Scientific Company); ammonium hydroxide [NH40H] (EM Science,
Merck); and resorcinol di-phosphate [RDP] (Great Lakes Chemical
Company) were used as received.

NOT THE PUBLISHED VERSION; this is the author’s final, peer-reviewed manuscript. The published version may be accessed by following the link in the citation at the bottom of the page.
Polymer Degradation and Stability, Vol. 91, No. 6 (June 2006): pg. 1209-1218. DOI. This article is © Elsevier and permission has been granted for this version to appear in e-Publications@Marquette. Elsevier does not grant permission for this article to be further copied/distributed or hosted elsewhere without the express permission from Elsevier.
4
A layered hydroxy salt (LHS), copper hydroxy nitrate (CHN) was
prepared via a standard literature method [20]. Copper (II) nitrate
(100 g; 0.430 mol) was added to 1 L of distilled water and the pH of
the resultant solution was adjusted to 8.0 ± 0.1 by the addition of
aqueous ammonia. The dispersion was aged for 24 h after which the
precipitate was filtered off, washed, and dried. Dodecyl sulfate anions
were exchanged for the NO3 anions in CHN by mixing the dried CHN
precursor material with 0.2 M solution of sodium dodecyl sulfate. In an
anionic exchange reaction, 109 of CHN was mixed with 500 mL of the
exchange solution and shaken frequently for 48 h. The supernatant
was decanted and replaced with a fresh sodium dodecyl sulfate
solution for another 48 h, after which the exchanged product, copper
hydroxy dodecyl sulfate (CHDS) was recovered by filtration, washed,
and dried.
Vinyl ester composites (~120 g) were prepared at room
temperature by mixing the resin with fire retardants using a
mechanical stirrer for 3 h. The initiator, BuPO (1.3%), was added
followed by addition of catalyst, CoNp (0.3%), and the mixture was
stirred for a few minutes to achieve homogeneity. Pure PVE was
loaded to afford n% fraction of the additives, CHDS, RDP, or Cloisite
15A within the polymer matrix, yielding composites identified as
PVE/CHDS-n, PVE/RDP-n, or PVE/15A-n, respectively. Composites with
a% CHDS and b% RDP were prepared and are identified as
PVE/CHDS/RDP-a/b. Similarly, composites with both a% CHDS and c%
Cloisite 15A were prepared, and are identified as PVE/CHDS/15A-a/c.
Percent loadings were determined from the final mass of the
composite, assuming no loss of the additives during the preparation
process. Approximately 30 g of samples were rapidly transferred into
pre-formed 10 cm × 10 cm × 2 mm aluminum dishes making platelets
of uniform thickness for cone calorimetry analysis. Flat samples ~1
mm thickness were prepared for X-ray diffraction analysis (XRD).
Samples were cured overnight at room temperature and post cured at
80 ºC for 12 h.
X-ray diffraction patterns of the synthesized layered materials
were obtained from a 2 circle Rikagu powder diffractometer operating
in the parafocusing Bragg-Brentano configuration, with a ½ º
divergence slit, ½ º scatter slit, 0.15 mm receiving slit, 0.15 mm
monochromator receiving slit using Cu Kα. (λ = 1.54 Å) radiation

NOT THE PUBLISHED VERSION; this is the author’s final, peer-reviewed manuscript. The published version may be accessed by following the link in the citation at the bottom of the page.
Polymer Degradation and Stability, Vol. 91, No. 6 (June 2006): pg. 1209-1218. DOI. This article is © Elsevier and permission has been granted for this version to appear in e-Publications@Marquette. Elsevier does not grant permission for this article to be further copied/distributed or hosted elsewhere without the express permission from Elsevier.
5
source operated at 50 kV and 20 mA, with data acquisition in 2θ steps
of 0.072 per 20 s. Powdered samples were mounted on quartz slides
using 10% (v/v) GE 7031 epoxy in ethanol after it was found that the
epoxy did not perturb the observed peak patterns. Polymer composite
samples were mounted onto vertically oriented sample holders for XRD
analysis. XRD peaks used to determine d-spacing were fit to pseudo-
Voight functions stripping off the Cu Kα2 contribution using XFIT [21].
Basal spacings, d, of the synthesized clays and polymer composites
were obtained using Bragg equation; λ = 2d sin θ, averaging 00l (l =
1-3) reflections were possible. Assignments of phases of known
copper-containing species were made using the powder diffraction
database [22].
Fourier transform infrared (FTIR) spectra of the solid materials
and composites were obtained using the KBr method on a Nicolet
Magna-IR 560 spectrometer operated at 1 cm-1 resolution in the 400-
4000 cm-1 region. Thermogravimetric analysis (TGA) and differential
thermal analysis (DTA) were performed on an SDT 2960 simultaneous
DTA-TGA instrument from 50 to 650 ºC in N2 using a ramp rate of 20
ºC/min with sample sizes in the range of 21 ± 1 mg. All TGA
experiments were performed in triplicate; the reproducibility in the
amount of nonvolatile residue is ±2% while the temperature is
generally reproducible to ±3 ºC. Samples were analyzed by cone
calorimetry on an Atlas Cone 2 instrument at an incident flux of 35
kW/m2 with a cone shaped heater; the spark was continuous until the
sample ignited. All samples were run in triplicate and the average
value, and standard deviation, is reported; results from the cone
calorimeter are generally considered to be reproducible to ±10% [23].
Bright field transmission electron microscopy (TEM) images were
collected at 60 kV using a Zeiss 10c electron microscope.
3 Results and Discussion
3.1 X-ray diffraction
X-ray diffraction (XRD) is commonly used to monitor the
structural changes of layered inorganic/organic hybrids when they are
incorporated into a polymer matrix. XRD patterns for the additive,
copper hydroxy dodecyl sulfate (CHDS) and composites PVE/CHDS-10
and PVE/CHDSIRDP-5/5 are shown in Fig. 1A. Two phases with basal

NOT THE PUBLISHED VERSION; this is the author’s final, peer-reviewed manuscript. The published version may be accessed by following the link in the citation at the bottom of the page.
Polymer Degradation and Stability, Vol. 91, No. 6 (June 2006): pg. 1209-1218. DOI. This article is © Elsevier and permission has been granted for this version to appear in e-Publications@Marquette. Elsevier does not grant permission for this article to be further copied/distributed or hosted elsewhere without the express permission from Elsevier.
6
spacings, d, of 25.9 ± 0.9 Å (filled triangles) and 39.2 ± 0.2 Å (filled
circles) are observed for CHDS. Possible orientations of the dodecyl
sulfate anions in the interlayer space relative to the metal hydroxide
sheets have been described elsewhere [24]. Peaks marked with filled
triangles represent the monolayer CHDS phase while the phase
marked with filled circles represent the bilayer phase. The samples
were partially exchanged as evident from reflections marked in
asterisks due to the precursor, copper hydroxy nitrate (CHN) (PDF#
14-687) [22] as shown in trace a of Fig. 1A.
The XRD pattern of PVE loaded with 10% CHDS, PVE/CHDS-10,
is shown in trace b of Fig. 1A. Basal reflections due to the bilayer
phase in CHDS (d = 39.2 Å) disappeared suggesting possible
exfoliation or intercalation. Partial interdigitation and/or lack of
overlapping dodecyl sulfate anions in the bilayer phase leaves open
spaces within the galleries into which monomer and/or polymer chains
can be accommodated. This would result in expanded basal spacing
corresponding to a reduction in 2θ values to magnitudes beyond the
detection limit of the wide-angle X-ray diffractometer used. No shifts
in 2θ positions were observed for either the monolayer phase (d =
25.9 Å) or the CHN phase; suggesting no intercalation of monomer or
polymer chains into their galleries. When PVE is loaded with 5% CHDS
and 5% RDP, PVE/CHDS/RDP-5/5, the bilayer phase reflections
disappear while the monolayer phase basal reflections of CHDS are
depleted in intensity relative to the CHN phase as seen in trace c of
Fig. 1A. The addition of RDP thus appears to result in additional
intercalation or exfoliation of the CHDS phase when both additives are
incorporated into the polymer.
Fig. 1B shows the XRD patterns of the organically-modified
montmorillonite clay (Cloisite 15A), PVE/15A-10, and PVE/CHDS/15A-
5/5. Basal reflections at 2θ values of 2.4 and 4.7º corresponding to an
average d-spacing of 37.1 ± 0.6 Å are seen for Cloisite 15A marked
with open diamonds. No apparent shift in 2θ peak positions is seen
when Cloisite 15A is loaded at 10%. Both the Cloisite 15A and the
CHDS monolayer phases are seen in the XRD pattern of
PVE/CHDS/15A-5/5 (Fig. 1B, trace c). The combination of CHDS and
Cloisite 15A does not promote formation of exfoliated and/or
intercalated nanocomposites. However, the bilayer phase of the CHDS

NOT THE PUBLISHED VERSION; this is the author’s final, peer-reviewed manuscript. The published version may be accessed by following the link in the citation at the bottom of the page.
Polymer Degradation and Stability, Vol. 91, No. 6 (June 2006): pg. 1209-1218. DOI. This article is © Elsevier and permission has been granted for this version to appear in e-Publications@Marquette. Elsevier does not grant permission for this article to be further copied/distributed or hosted elsewhere without the express permission from Elsevier.
7
disappeared as seen with CHDS alone suggesting exfoliation and/or
intercalation of this phase.
Transmission electron microscopy (TEM) is an important
technique commonly used to investigate the morphology of the
composites. Fig. 2 shows TEM images for PVE/CHDS/RDP-5/5 sample
at both low and high magnifications. Low magnification TEM images
provide information about the nano-dispersion while high
magnification images indicate whether exfoliation and/or intercalation
has been achieved. The low magnification image shown in Fig. 2 (left)
is consistent with the formation of a microcomposite; showing fairly
well-distributed inorganic/organic material at the micrometer level,
within the polymer matrix. The high magnification TEM image shown in
Fig. 2 (right) suggests partial exfoliation of the CHDS consistent with
the observed intensity reduction of the monolayer CHDS phase relative
to CHN and disappearance of the bilayer CHDS phase in
PVE/CHDS/RDP-5/5.
3.2 Thermogravimetric analysis (TGA)
Thermogravimetric analysis was carried out on samples of pure
PVE and PVE containing fire retardants, CHDS, RDP, and Cloisite 15A
both individually and in combination. Fig. 3A shows TGA curves for
pure PVE, PVE/CHDS-10, PVE/RDP-10, and PVE/CHDS/RDP-5/5 while
Fig. 3B shows the derivatives of these curves. Independent or
concomitant addition of CHDS and RDP to the polymer matrix leads to
a significant reduction in the onset degradation temperature of the
polymer composites, measured as the temperature at which 10%
mass loss occurs, T10. Even though PVE/CHDS-10 loses more mass at
low temperatures, as seen in the mass difference curves (mass % of
PVE composites minus mass % of pure PVE at the same temperature)
shown in Fig. 4A, its thermal degradation profile is similar to that of
pure PVE at higher degradation temperatures. From the TGA curves
shown in Fig. 3A, PVE/RDP-10 is the least stable in the temperature
range of 350-460 °C. The thermal stability of PVE/CHDS/RDP-S/S is
significantly higher than that of PVE/RDP-10; there is a beneficial
additive effect from replacing some of the RDP by CHDS. However, no
synergistic effects are obvious for PVE/CHDSIRDP-5/5 from TGA
analysis as evaluated by T10, T50 (temperature at which 50% mass loss
occurs), Tmax (the temperature of maximum degradation rate) and the

NOT THE PUBLISHED VERSION; this is the author’s final, peer-reviewed manuscript. The published version may be accessed by following the link in the citation at the bottom of the page.
Polymer Degradation and Stability, Vol. 91, No. 6 (June 2006): pg. 1209-1218. DOI. This article is © Elsevier and permission has been granted for this version to appear in e-Publications@Marquette. Elsevier does not grant permission for this article to be further copied/distributed or hosted elsewhere without the express permission from Elsevier.
8
amount of char formed. These TGA results are summarized in Table 1.
Notably, the char yields in the presence of the RDP and/or CHDS are
higher than for pure PVE, suggesting possible condensed phase roles
for these additives. Differential thennogravimetric analysis (DTA)
curves for pure PVE, PVE/CHDS-10, PVE/RDP-10, and PVE/CHDS/RDP-
5/5 are shown in Fig. 4B. The DTA curves of the composites are
significantly different from those of pure PVE, suggesting a different
degradation pathway.
Fig. 5A shows TGA curves of pure PVE, PVE/CHDS-15, PVE/RDP-
15, and PVE/CHDS/RDP-5/10 while Fig. 5B shows the corresponding
derivatives (DTG) of these curves. Increasing the mass fraction of
CHDS and/or RDP from 10 to 15% did not improve the thermal
stability of the polymer, in fact further reductions in T10, T50, Tmax, and
generally in char formation are seen. However, an adjuvant effect [19]
in char formation was observed for the PVE/CHDS/RDP-5/10 system as
seen in the mass difference curves shown in Fig. 6A where the
PVE/CHDS/RDP-5/10 formulation results in higher final char yield than
either of the individual compounds at 15%. The thermal degradation
profile for PVE/CHDS/RDP-5/10 at higher degradation stages is similar
to that of PVE/RDP-15 with comparable T50 and Tmax values. The DTA
curves of the PYE composites, presented in Fig. 6B, are significantly
different from those of pure PYE, again suggesting a change in the
degradation mechanism. There is an additional advantage of replacing
some RDP with CHDS in terms of char formation.
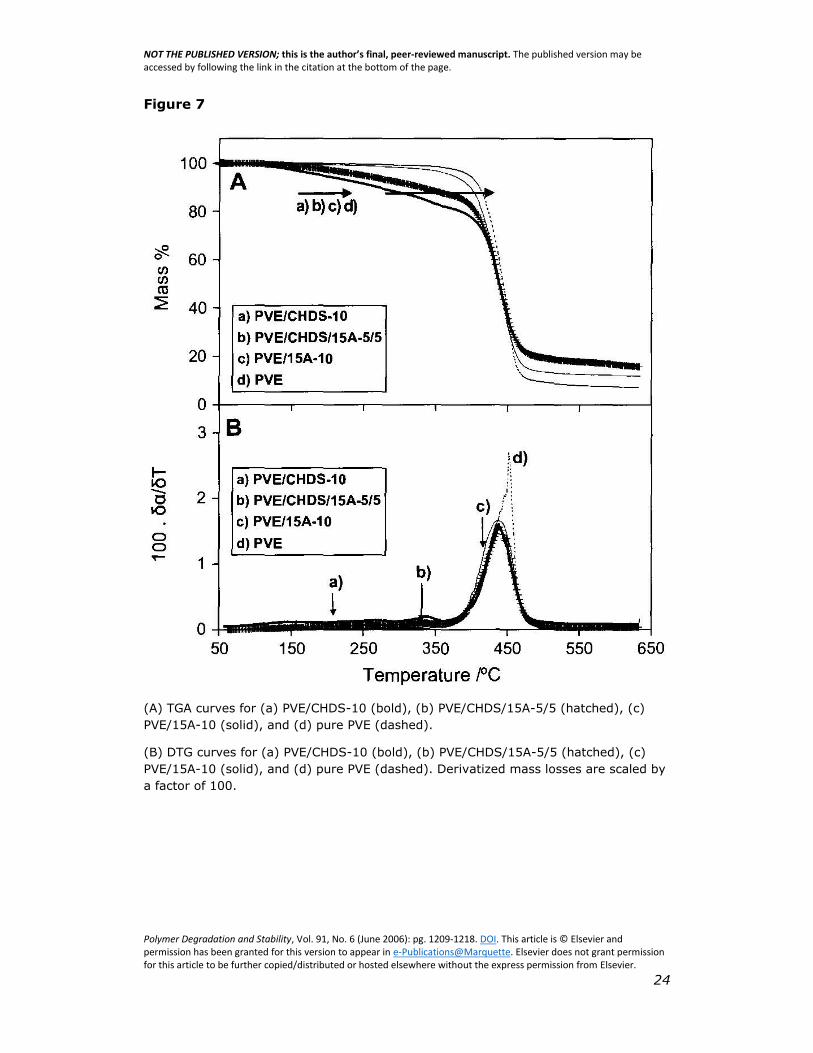
Fig. 7A shows the TGA curves of pure PYE and its composites
prepared from loading fire retardants CHDS and Cloisite 15A either
individually or in combination at 10%. The corresponding derivatives
of these TGA curves are shown in Fig. 7B. T10 values are significantly
reduced for these composites, compared to pure PVE, suggesting a
reduction in thermal stability of PYE composites in the low temperature
regime. However, the thermal degradation profile of pure PYE at
higher temperatures is similar to those of CHDS and/or Cloisite 15A
composites. As seen in Table 1 the parameters used to evaluate
thermal stability at higher temperatures, T50 and Tmax, are comparable.
A significant increment in char formation is observed for the
composites compared to the virgin polymer.

NOT THE PUBLISHED VERSION; this is the author’s final, peer-reviewed manuscript. The published version may be accessed by following the link in the citation at the bottom of the page.
Polymer Degradation and Stability, Vol. 91, No. 6 (June 2006): pg. 1209-1218. DOI. This article is © Elsevier and permission has been granted for this version to appear in e-Publications@Marquette. Elsevier does not grant permission for this article to be further copied/distributed or hosted elsewhere without the express permission from Elsevier.
9
As shown in the mass difference curves, Fig. 8A, the
combination of 5% CHDS and 5% Cloisite 15A destabilizes the
composite at lower temperatures but results in enhanced char
formation, compared with Cloisite 15A alone. DTA curves for PVE and
its composites are shown in Fig. 8B. Addition of Cloisite 15A alone
does not significantly change the degradation pathway of PVE. DTA
curves for pure PVE and PVE/15A-1O are similar with the exception
that the endothermic peak at around 450°C is broader for the later.
PVE/CHDS/15A-5/5 shows a comparable profile, with small exothermic
peaks between 250 and 400°C, which may be due to the thermal
degradation of organic moieties contained within the galleries of the
layered materials.
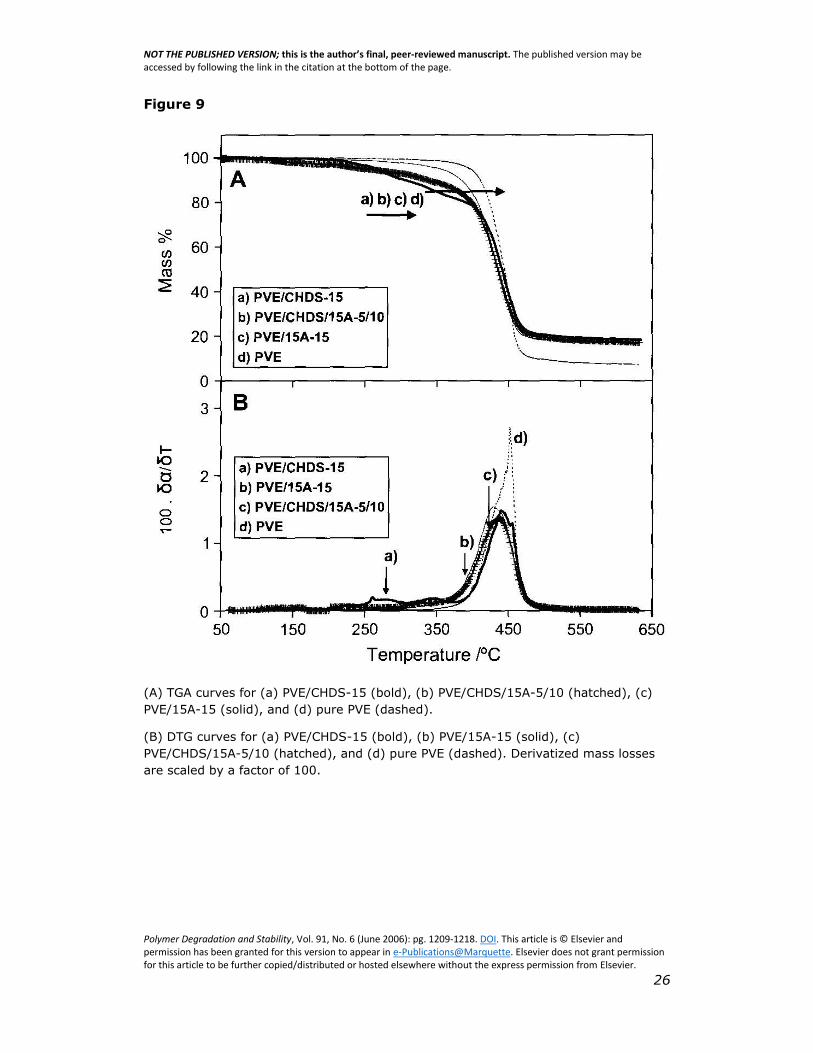
In order to investigate the variation of thermal stability with
percent additives, CHDS and Cloisite 15A cumulative mass fractions
were increased from 10 to 15%. The TGA curves and their
corresponding derivatives for pure PVE and its composites are shown
in Fig. 9A and B, respectively. Significant reductions in T10 are noted,
suggesting a destabilization effect in the low temperature region.
However, the degradation threshold temperatures at further stages of
thermal decomposition, as measured by T50 and Tmax, are comparable
to those of the virgin polymer. Noteworthy increments in char
formation are seen for the composites relative to the pure polymer.
Unlike combinations of CHDS and RDP, the amount of char formed
using CHDS and Cloisite 15A independently is not different from the
char obtained when these two additives are combined. This is clearly
illustrated in the mass difference curves shown in Fig. 10A. The DTA
curves for pure PVE and its CHDS and/or Cloisite 15A composites are
shown in Fig. 10B. Apart from exothermic processes seen in the DTA
profiles for PVE/CHDS/15A-5/10 and PVE/CHDS-15, and the reduction
in magnitude of their respective endothermic peaks at about 450 ºC,
there are no other obvious differences when compared to that of the
virgin polymer, suggesting no major changes in the degradation
pathway.
Also shown in Table 1 are the expected char% if the residues
were additive, based on the residue obtained individually from pure
PVE, CHDS, RDP, and Cloisite 15A. The fact that the observed residue
is higher than the calculated demonstrates the effectiveness of these
fire retardant additives in char formation. These fire retardants
NOT THE PUBLISHED VERSION; this is the author’s final, peer-reviewed manuscript. The published version may be accessed by following the link in the citation at the bottom of the page.
Polymer Degradation and Stability, Vol. 91, No. 6 (June 2006): pg. 1209-1218. DOI. This article is © Elsevier and permission has been granted for this version to appear in e-Publications@Marquette. Elsevier does not grant permission for this article to be further copied/distributed or hosted elsewhere without the express permission from Elsevier.
10
generally destabilize the polymer at lower temperatures, however,
there is a compensatory stabilization effect as indicated by the
formation of char at yields higher than expected. Catalytic char
induction and condensed or vapor phase action of phosphorus are
implicated in cases where RDP is used as an additive alone [25]. When
RDP is used in combination with a montmorillonite-based clay, Cloisite
15A, the latter can react with acid phosphates to form active
carbonization catalysts leading to the formation of char. The acids can
also form a molten viscous surface layer protecting the polymer
substrate from flame, heat and oxygen. The enhanced char yields
observed when RDP is combined with CHDS may be due to the
reaction of water with phosphates to form acid phosphates which have
been hypothesized to promote char formation [25]. The role of CHDS
may be to provide water via either dehydroxylation of the copper
hydroxide layers and/or combustion of the dodecyl sulfate.
3.3. Cone calorimetry
Cone calorimetry can be used to evaluate and predict the
behavior of polymeric materials in real fires. The parameters obtained
from this analysis include the heat release rate and especially its peak
value (PHRR); total heat release (THR); time to self-sustained
combustion (TSC); average mass loss rate (AMLR); average specific
extinction area (ASEA) (a measure of smoke); and char yield (CY).
Ideally, a decrease in the peak heat release rate, total heat released
and the mass loss rate is desired along with an increase in char and
time to sustained combustion.
Heat release rate (HRR) curves for pure PVE, PVE/CHDS-10,
PVE/RDP-10, and PVE/CHDS/RDP-5/5 at a flux of 35 kW/m2 are shown
in Fig. 11A. The addition of 10% CHDS alone or a combination of 5%
CHDS and 5% RDP lowers the time to sustained ignition of the
composites relative to the virgin polymer but the HRR curves for the
composites show that the evolution of heat is spread over a narrow
range of the combustion time. Polymer composites containing CHDS
start to bum earlier but they extinguish much faster than the pristine
PVE. Similar patterns are seen when Cloisite 15A is used in
combination with CHDS, as shown in the HRR curve for
PVE/CHDS/15A-5/5, Fig. 11B. RDP and Cloisite 15A PVE composites
bum over a wider time range.

NOT THE PUBLISHED VERSION; this is the author’s final, peer-reviewed manuscript. The published version may be accessed by following the link in the citation at the bottom of the page.
Polymer Degradation and Stability, Vol. 91, No. 6 (June 2006): pg. 1209-1218. DOI. This article is © Elsevier and permission has been granted for this version to appear in e-Publications@Marquette. Elsevier does not grant permission for this article to be further copied/distributed or hosted elsewhere without the express permission from Elsevier.
11
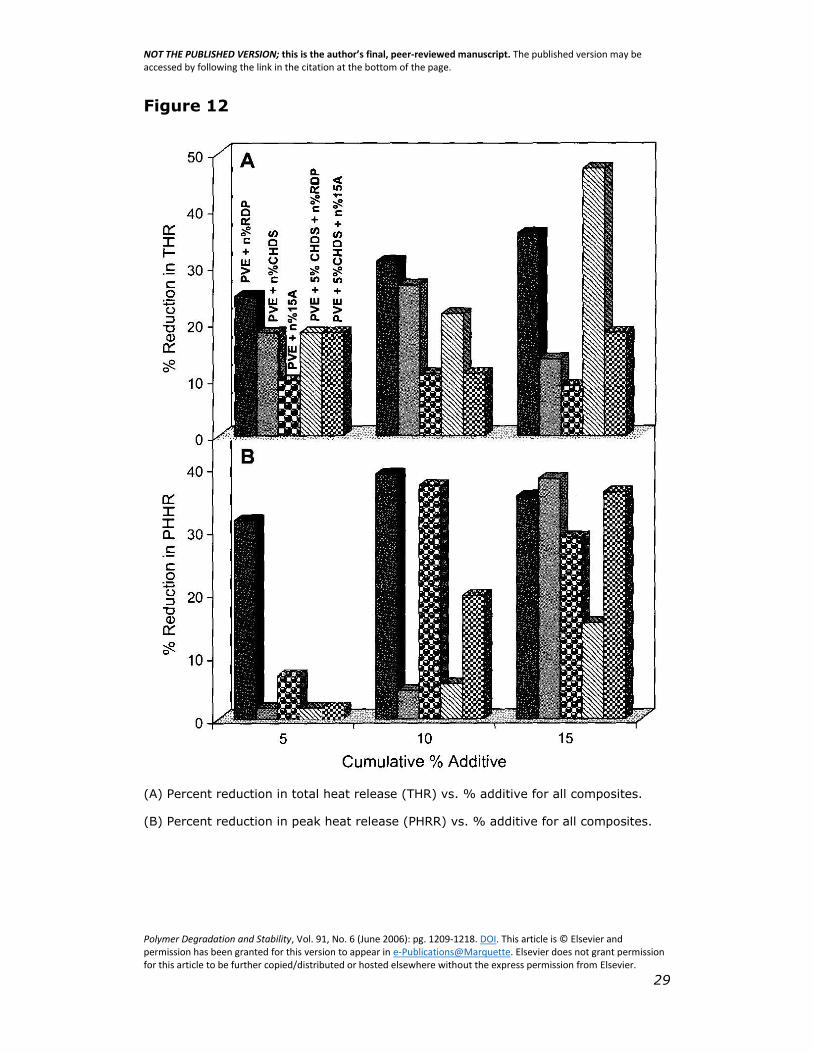
Fig. 12A shows the variation of percent reduction in total heat
release with percent fire retardant additive for all the composites
under investigation. Significant reductions, greater than 20%, in the
total heat released are observed when PVE is loaded with RDP alone.
This is not uncommon, as PVE composites containing phosphorus-
based fire retardants have been shown to have lower THRs but a wider
heat release distribution profile [2]. CHDS when used alone gives the
largest reduction in THR, 27%, at 10% loading. Combination of CHDS
and RDP resulted in an additive effect for the PVE/CHDS/RDP-5/10
formulation. PVE/CHDS-5 gives 18% reduction and PVE/RDP-10 gives
31% reduction in THR while the PVE/CHDSI RDP-5/10 formulation
results in 47%, an additive effect within the limits of experimental
uncertainty. An antagonistic effect was observed for the
PVE/CHDS/RDP-5/5 composite. PVE/CHDS-5 gives a reduction of 18%
and PVE/RDP-5 gives a reduction of 25% in THR while the
PVE/CHDS/RDP-5/5 formulation gives 22%, an antagonistic effect.
Cloisite 15A alone has no effect on the THR suggesting that the
polymeric material completely bums. No significant improvement was
seen in percent reduction in THR when CHDS was used in combination
with Cloisite 15A.
PHRR percent reductions of >30% were observed for PVE/RDP
composites even at 5% loading. RDP is effective in reducing PHRR,
however, an antagonistic effect is seen when it is combined with
CHDS. There is very little or no reduction in PHRR for PVE/CHDS-10
and PVE/CHDS/RDP-5/5, as shown in Fig. 12B. The CHDS additive
shows a 38% reduction in PHRR at 15%, however, the same
composition gave the lowest improvement in THR. Synergism is clearly
seen for the PVE/CHDS/l5A-5/5 system, where the percent reduction
in PHRR is more than additive. PVE/CHDS-5 gives a reduction of 6%
and PVE/15A-5 gives a reduction of 7% in PHRR while the
PVE/CHDS/15A-5/5 formulation gives 20%, a synergistic effect. Table
2 gives a summary of the results obtained for PVE and its composites
with different additive loadings.
The experimentally obtained reductions in THR are significantly
larger than the calculated values, suggesting that THR reductions are
not a result of replacing some fraction of PVE (THR = 79 MJ/m2 for 30
g) with an equal amount of the fire retardant additives, CHDS, RDP, or
Cloisite 15A with lower THR values for 30 g of samples, 51, 55, and 52

NOT THE PUBLISHED VERSION; this is the author’s final, peer-reviewed manuscript. The published version may be accessed by following the link in the citation at the bottom of the page.
Polymer Degradation and Stability, Vol. 91, No. 6 (June 2006): pg. 1209-1218. DOI. This article is © Elsevier and permission has been granted for this version to appear in e-Publications@Marquette. Elsevier does not grant permission for this article to be further copied/distributed or hosted elsewhere without the express permission from Elsevier.
12
MJ/m2, respectively. This is clear evidence that these fire retardant
additives are effective in reducing the flammability of the PVE. Notable
increments in char formation for the composite materials relative to
the pure polymer are seen and the values are also reported in Table 2.
The improvement in fire retardancy is shown by positive changes in
two parameters, the reduction in the THR and the increase in the char
remaining after combustion.
Significant reductions in the amount of smoke as measured by
the ASEA for PVE/CHDS/RDP formulations as compared to PVE/RDP
composites at the same cumulative loadings are observed. This is
consistent with the work performed by Pike and coworkers [26], who
reported that low-valent metal additives prevent cracking of
hydrocarbon char at high temperature, suggesting that less volatile
molecules are produced, reducing the smoke and increasing the char.
No significant reductions were seen in the average mass loss rate for
all composites with the exception of PVE/CHDS-15, PVE/15A, and
PVE/CHDS/I5A-5/10. This suggests that in all the other cases the
decomposition rate is slightly or not at all affected by the presence of
the additives within the polymer matrix. Future work will focus on
developing a high throughput screening technique to find the mass
fraction that would give improvements in more than one parameter.
In order to explore the mechanism of fire retardancy in copper-
containing formulations, the composite, PVE/CHDS/RDP-5/5 was
heated in the TGA at 20 ºC/min. Samples were extracted at different
times in the heating profile and the resulting residues were analyzed
by XRD. The results are shown in Fig. 13. The XRD pattern of
PYE/CHDS/RDP-5/5 from the TGA residue at 250 ºC reveals the
presence of the CHN phase (PDF# 14-687) [22]. The CHDS and
Cloisite 15A phases are not evident from the XRD pattern at this
temperature, suggesting their collapse and/or existence in an
amorphous state. CU20 (PDF# 35-1091) [22] and metallic copper
(PDF# 4-836) [22] are seen in the XRD pattern of the residue
collected at 300 ºC. Of particular interest is the disappearance of Cu20
phase in the 400 ºC trace with the formation of metallic copper and a
second phase with a sharp peak at 28.4º that could not be identified.
Disproportionation of Cu(I) may lead to the formation of metallic
copper, Cu (0) and Cu (II) as illustrated by the equation; 2Cu (I) → Cu

NOT THE PUBLISHED VERSION; this is the author’s final, peer-reviewed manuscript. The published version may be accessed by following the link in the citation at the bottom of the page.
Polymer Degradation and Stability, Vol. 91, No. 6 (June 2006): pg. 1209-1218. DOI. This article is © Elsevier and permission has been granted for this version to appear in e-Publications@Marquette. Elsevier does not grant permission for this article to be further copied/distributed or hosted elsewhere without the express permission from Elsevier.
13
(0) + Cu (II). This suggests that the unidentified phase may be a Cu
(II) containing compound.
The presence of metallic copper as shown in the XRD patterns of
the TGA residues for PVE/CHDS/RDP-5/5 at 350, 400, and 450 ºC may
prevent depolymerization of PVE through reductive coupling, thus
promoting char formation. Cu (II) readily reduces to Cu (I) or Cu (0)
[27]; the stabilization effect observed stems from the ability Cu (II) to
form zero-or low-valent metal species upon pyrolysis. Interestingly,
the evolution of copper species with temperature for PVE/CHDS/RDP-
5/5 is similar to the pattern seen with PVE/CHDS-10, suggesting that
RDP has little or no effect on the reaction catalyzed by metallic copper.
The copper reaction is proposed to be reductive coupling following the
abstraction of pendant hydroxyl groups by metallic copper [24].
Reductive coupling promotes intermolecular cross-linking of
conjugated polyenes produced during the initial stages of degradation
otherwise these polyenes could undergo cyclization reactions leading
to the formation of benzene and other aromatics, which would burn to
produce heat and smoke. A similar stabilizing effect on the thermal
degradation of poly(vinyl chloride) (PVC) using copper (I) salts (CuCl,
CuBr, and CuI) and Cu (II) complexes has been reported [26,28].
The XRD patterns of the TGA residue at the indicated
temperatures for PVE/CHDS/RDP-5/5 do not show any evidence of
polycrystalline Cu(OH)2, the expected product of hydroxyl abstraction
from polymer chains. The absence of Cu(OH)2 reflections in the XRD
patterns of the TGA residue suggests it may exist in an amorphous
phase. In the case of CHDS alone, FTIR spectra of the samples heated
to 350 and 400 ºC [24] exhibited peaks at 3740 cm-1 consistent with
non-hydrogen bonded Cu-OH groups [29]. However, FTIR spectra of
the TGA residues of PVE/CHDS/RDP-5/5 at various temperatures
shown in Fig. 14 do not exhibit this feature. This may suggest
interaction between RDP and CHDS additives or intermediates formed
during decomposition. Further characterization of this system will be
the subject of future work.
LHSs and smectite clays act as fire retardants through several
modes of action that include: (i) dilution of flammable volatiles by non-
combustible gases (H20 and CO2) generated from the thermal
degradation of the additives, (ii) the formation of a stable char layer

NOT THE PUBLISHED VERSION; this is the author’s final, peer-reviewed manuscript. The published version may be accessed by following the link in the citation at the bottom of the page.
Polymer Degradation and Stability, Vol. 91, No. 6 (June 2006): pg. 1209-1218. DOI. This article is © Elsevier and permission has been granted for this version to appear in e-Publications@Marquette. Elsevier does not grant permission for this article to be further copied/distributed or hosted elsewhere without the express permission from Elsevier.
14
over the polymer substrate reducing diffusion of combustible matter
(mass transport) and/or energy transfer, (iii) the endothermic
decomposition of the layered material resulting in release of H20 and
absorption of heat from the burner polymer, hence retarding thermo-
oxidative degradation. With RDP, phosphoric acid produced during
pyrolysis forms a protective layer above the polymer substrate
preventing volatilization of fuels and oxygen penetration to the
condensed phase [30].
4. Conclusion
The thermal and combustion behaviors of PVE formulations
containing CHDS, RDP, and Cloisite 15A, individually or in combination,
have been studied using both cone calorimetry and TGA. Significant
increments in TGA char formation, up to 260%, in some cases were
observed when the fire retardants were used individually or in
combination. These notable increments in char formation suggest the
effectiveness of these additives as potential fire retardants. No
synergistic effect as measured by char yields are apparent for
formulations where CHDS was mixed with RDP or Cloisite 15A either
from cone calorimetry or the TGA residue. Antagonistic effects in PHRR
were observed in all cases except for the PVE/CHDS/15A-5/5
composite; there is no improvement in the time to self-sustained
combustion. PVE/CHDS/RDP-5/10 gave a higher percent reduction in
THR (~47%) when compared with composites, PVE/CHDS-15 (~14%),
PEV/RDP-15 (~33%) or PVE/15A-15 (~9%). Replacing some RDP by
CHDS enhances thermal stability in the system described above as
evaluated by THR.
Acknowledgements
We thank the Office of Naval Research (CAW, grant number
NOOO 14-03-1-0 172) for financial assistance and M. Bartelt and J.
Collins for technical support of the X-ray diffractometer.
References
1. Georlette P, Simons J, Costa L. In: Grand AF, Wilkie CA, editors. Fire
retardancy of polymeric materials. Marcel Dekker, Inc.; 2000. p.245-
84.

NOT THE PUBLISHED VERSION; this is the author’s final, peer-reviewed manuscript. The published version may be accessed by following the link in the citation at the bottom of the page.
Polymer Degradation and Stability, Vol. 91, No. 6 (June 2006): pg. 1209-1218. DOI. This article is © Elsevier and permission has been granted for this version to appear in e-Publications@Marquette. Elsevier does not grant permission for this article to be further copied/distributed or hosted elsewhere without the express permission from Elsevier.
15
2. Chigwada G, Jash P, Jiang DD, Wilkie CA. Polym Degrad Stab 2005;89:85.
3. Jakab E, Uddin MdA, Bhaskar T, Sakata Y. J Anal Appl Pyrol 2003; 68-
69:83.
4. Cusak PA, Heer MS, Monk AW. Polym Degrad Stab 1991;32:177.
5. Kicko-Walczak E. Polimery 1999;44:724.
6. Weil ED, Kim HK. Flame retardant unsaturated resins-an overview and new
developments. Eighth annual BCC conference on advances in flame
retardancy of polymeric materials, Stamford, Connecticut; 1997.
7. Liang H, Shi W. Polym Degrad Stab 2004;84:525.
8. Zheng X, Wilkie CA. Polym Degrad Stab 2003;81 :539.
9. Levchik SV, Bright DA, Dashevsky S, Moy P. In: AI-Malaika S, Golovoy A,
Wilkie CA, editors. Specialty polymer additives: principles and
applications. London: Blackwell Scientific; 2001. p. 259-69.
10. Bubniak GA, Schreiner WH, Mattoso N, Wypych F. Langmuir
2002;18:5967.
11. Leroux F, Besse J. Chern Mater 2001;13:3507.
12. Chen W, Qu B. Chern Mater 2003;15:3208.
13. Messersmith BP, Stupp S1. Chern Mater 1995;7:454.
14. Kandare E, Hall D, Jiang DD, Hossenlopp JM. In: Wilkie CA, Nelson GL,
editors. Fire and polymers IV: materials and concepts for hazard
prevention. ACS symposium series. Oxford University Press, in press.
15. Kandare E, Hossenlopp JM. Polym Mater 2005;16:215.
16. Kandare E, Deng H, Wang D, Hossenlopp JM. Polym Adv Technol, in
press.
17. Alexandre M, Dubois P. Mater Sci Eng 2000;R28: I.
18. Weil ED. In: Kuryla WC, Papa AJ, editors. Flame retardancy of polymeric
materials. Marcel Dekker, Inc.; 1975. p. 185-243.
19. Weil ED. In: Grand AF, Wilkie CA, editors. Fire retardancy of polymeric
materials. Marcel Dekker, Inc.; 2000. p. 115-45.
NOT THE PUBLISHED VERSION; this is the author’s final, peer-reviewed manuscript. The published version may be accessed by following the link in the citation at the bottom of the page.
Polymer Degradation and Stability, Vol. 91, No. 6 (June 2006): pg. 1209-1218. DOI. This article is © Elsevier and permission has been granted for this version to appear in e-Publications@Marquette. Elsevier does not grant permission for this article to be further copied/distributed or hosted elsewhere without the express permission from Elsevier.
16
20. Tanaka H, Terada SJ. Therm Anal 1993;39:1011.
21. Cheary RW, Coelho AA. Programs XFIT and FOURYA, deposited in CCP14.
Powder Diffraction Library, Engineering and Physical Sciences Research
Council, Daresbury Laboratory, Warrington, England; 1996.
<http://www.ccpI4.ac.ukltutorial/xfit-95/xfit.htm>.
22. Powder diffraction file alphabetical indexes. Inorganic phases. Swartmore,
PA: JCPDS, International Centre for Diffraction Data; 1999.
23. Gilman JW, Kashiwagi T, Nyden M, Brown JET, Jackson CL, Lomakin S, et
al. In: AI-Maliaka S, Golovoy A, Wilkie CA, editors. Chemistry and
technology of polymer additives. London: Blackwell Scientific; 1999. p.
249-65.
24. Kandare E, Chigwada G, Wang D, Wilkie CA, Hossenlopp JM. Submitted
for publication.
25. Green J. In: Grand AF, Wilkie CA, editors. Fire retardancy of polymeric
materials. Marcel Dekker, Inc.; 2000. p. 147-70.
26. Pike RD, Starnes WH, Jeng JP, Bryant WS, Kourtesis P, Adams CW, et al.
Macromolecules 1997;30:6957.
27. Shriver DF, Atkins P, Langford CH. Inorganic chemistry. 2nd ed. New
York: Freeman;1994. p. 295.
28. Starnes WH, Pike RD, Cole JR, Doyal AS, Kimlin EJ, Lee JT, et al. Polym
Degrad Stab 2003;82: 15.
29. Masciocchi N, Corradi E, Sironi A, Moretti G, Minelli G, Porta PJ. Solid
State Chern 1997;131:252.
30. Wang Z, Qu B, Fan W, Huang PJ. Appl Polym Sci 2001;81:206.
About the Authors
Jeanne M. Hossenlopp : Department of Chemistry, Marquette University, P.O.
Box 1881, Milwaukee, WI 53201-1881, USA
Tel.: +1 4142883537; fax: +1 4142887066
Email: [email protected]

NOT THE PUBLISHED VERSION; this is the author’s final, peer-reviewed manuscript. The published version may be accessed by following the link in the citation at the bottom of the page.
Polymer Degradation and Stability, Vol. 91, No. 6 (June 2006): pg. 1209-1218. DOI. This article is © Elsevier and permission has been granted for this version to appear in e-Publications@Marquette. Elsevier does not grant permission for this article to be further copied/distributed or hosted elsewhere without the express permission from Elsevier.
17
Appendix
Table 1: TGA Data for PVE Composites with CHDS, RDP and Cloisite 15A
T10, Temperature at which 10% mass loss occurs; T50, temperature at which 50%
mass loss occurs; ΔT50, T50 (composite) − T50 (pure PVE); Tmax, temperature at
maximum degradation rate. Italicized entries are the expected char based on the
residue obtained from pure PVE, CHDS and/or Cloisite 15A fractions.
Table 2: Cone calorimetry data for PVE composites with CHDS, RDP, and Cloisite 15A
TSC, Time to sustained combustion; PHRR, peak heat release rate (% reduction);
THR, total heat release (% reduction); AMLR, average mass loss rate; CY, char%;
ASEA, average specific extinction area (a measure of smoke).

NOT THE PUBLISHED VERSION; this is the author’s final, peer-reviewed manuscript. The published version may be accessed by following the link in the citation at the bottom of the page.
Polymer Degradation and Stability, Vol. 91, No. 6 (June 2006): pg. 1209-1218. DOI. This article is © Elsevier and permission has been granted for this version to appear in e-Publications@Marquette. Elsevier does not grant permission for this article to be further copied/distributed or hosted elsewhere without the express permission from Elsevier.
18
Figure 1
(a) XRD data for (a) partially exchanged CHDS revealing the presence of two phases;
(●) with basal spacing, d = 39.2 Å and (▲) with d = 25.9 Å; reflections from
the precursor, CHN (*) observed, (b) PEV/CHDS-10, and (c) PVE/CHDS/RDP-
5/5. The XRD of the partially exchanged CHDS is scaled by a factor of ¼.
(B) XRD data for (a) Cloisite 15A, (b) PVE/15A-10, and (c) PVE/CHDS/15A-5/5.
Cloisite 15A data in trace a is scaled by a factor of ⅛. In trace c both CHDS
(▲) and Cloisite 15A (◊) reflections are observed. Data are offset by clarity
and not scaled unless mentioned otherwise.

NOT THE PUBLISHED VERSION; this is the author’s final, peer-reviewed manuscript. The published version may be accessed by following the link in the citation at the bottom of the page.
Polymer Degradation and Stability, Vol. 91, No. 6 (June 2006): pg. 1209-1218. DOI. This article is © Elsevier and permission has been granted for this version to appear in e-Publications@Marquette. Elsevier does not grant permission for this article to be further copied/distributed or hosted elsewhere without the express permission from Elsevier.
19
Figure 2
TEM images at low (left) and high (right) magnifications for PVE/CHDS/RDP-5/5. For
low magnification the scale bar (bottom left) represents 500 nm, while for high
magnification the scale bar (bottom left) represents 100 nm.

NOT THE PUBLISHED VERSION; this is the author’s final, peer-reviewed manuscript. The published version may be accessed by following the link in the citation at the bottom of the page.
Polymer Degradation and Stability, Vol. 91, No. 6 (June 2006): pg. 1209-1218. DOI. This article is © Elsevier and permission has been granted for this version to appear in e-Publications@Marquette. Elsevier does not grant permission for this article to be further copied/distributed or hosted elsewhere without the express permission from Elsevier.
20
Figure 3
(A) TGA curves for (a) PVE/RDP-10 (solid), (b) PVE/CHDS/RDP-5/5 (hatched), (c)
PVE/CHDS-10 (bold), and (d) pure PVE (dashed).
(B) DTG curves for (a) PVE/RDP-10 (solid), (b) PVE/CHDS/RDP-5/5 (hatched), (c)
PVE/CHDS-10 (solid), and (d) pure PVE (dashed). Derivatized mass losses are scaled
by a factor of 100.

NOT THE PUBLISHED VERSION; this is the author’s final, peer-reviewed manuscript. The published version may be accessed by following the link in the citation at the bottom of the page.
Polymer Degradation and Stability, Vol. 91, No. 6 (June 2006): pg. 1209-1218. DOI. This article is © Elsevier and permission has been granted for this version to appear in e-Publications@Marquette. Elsevier does not grant permission for this article to be further copied/distributed or hosted elsewhere without the express permission from Elsevier.
21
Figure 4
(A) Curves of mass loss differences for PVE composites (a) PVE/CHDS-10 (bold), (b)
PVE/CHDS/RDP-5/5 (hatched), and (c) PVE/RDP-10 (solid) as a function of
degradation temperature.
(B) DTA curves for (a) PVE/CHDS-10 (bold), (b) PVE/CHDS/RDP-5/5 (hatched), (c)
PVE/RDP-10 (solid), and (d) pure PVE (dashed).

NOT THE PUBLISHED VERSION; this is the author’s final, peer-reviewed manuscript. The published version may be accessed by following the link in the citation at the bottom of the page.
Polymer Degradation and Stability, Vol. 91, No. 6 (June 2006): pg. 1209-1218. DOI. This article is © Elsevier and permission has been granted for this version to appear in e-Publications@Marquette. Elsevier does not grant permission for this article to be further copied/distributed or hosted elsewhere without the express permission from Elsevier.
22
Figure 5
(A) TGA curves for (a) PVE/CHDS/RDP-5/10 (hatched), (b) PVE/CHDS-15 (bold), (c)
PVE/RDP-15 (solid), and (d) pure PVE (dashed).
(B) DTG curves for (a) PVE/RDP-15 (solid), (b) PVE/CHDS/RDP-5/10 (hatched), (c)
PVE/CHDS-15 (bold), and (d) pure PVE (dashed). Derivatized mass losses are scaled
by a factor of 100.

NOT THE PUBLISHED VERSION; this is the author’s final, peer-reviewed manuscript. The published version may be accessed by following the link in the citation at the bottom of the page.
Polymer Degradation and Stability, Vol. 91, No. 6 (June 2006): pg. 1209-1218. DOI. This article is © Elsevier and permission has been granted for this version to appear in e-Publications@Marquette. Elsevier does not grant permission for this article to be further copied/distributed or hosted elsewhere without the express permission from Elsevier.
23
Figure 6
(A) Curves of mass loss differences for PVE composites (a) PVE/CHDS/RDP-5/10
(hatched), (b) PVE/CHDS-15 (bold), and (c) PVE/RDP-15 (solid) as a function of
degradation temperature.
(B) DTA curves for (a) pure PVE (dashed), (b) PVE/RDP-15 (solid), (c) PVE/CHDS-15
(bold), and (d) PVE/CHDS/RDP-5/10 (hatched).
NOT THE PUBLISHED VERSION; this is the author’s final, peer-reviewed manuscript. The published version may be accessed by following the link in the citation at the bottom of the page.
Polymer Degradation and Stability, Vol. 91, No. 6 (June 2006): pg. 1209-1218. DOI. This article is © Elsevier and permission has been granted for this version to appear in e-Publications@Marquette. Elsevier does not grant permission for this article to be further copied/distributed or hosted elsewhere without the express permission from Elsevier.
24
Figure 7
(A) TGA curves for (a) PVE/CHDS-10 (bold), (b) PVE/CHDS/15A-5/5 (hatched), (c)
PVE/15A-10 (solid), and (d) pure PVE (dashed).
(B) DTG curves for (a) PVE/CHDS-10 (bold), (b) PVE/CHDS/15A-5/5 (hatched), (c)
PVE/15A-10 (solid), and (d) pure PVE (dashed). Derivatized mass losses are scaled by
a factor of 100.

NOT THE PUBLISHED VERSION; this is the author’s final, peer-reviewed manuscript. The published version may be accessed by following the link in the citation at the bottom of the page.
Polymer Degradation and Stability, Vol. 91, No. 6 (June 2006): pg. 1209-1218. DOI. This article is © Elsevier and permission has been granted for this version to appear in e-Publications@Marquette. Elsevier does not grant permission for this article to be further copied/distributed or hosted elsewhere without the express permission from Elsevier.
25
Figure 8
(A) Curves of mass loss differences for PVE composites (a) PVE/15A-10 (solid), (b)
PVE/CHDS/15A-5/5 (hatched), and (c) PVE/CHDS-10 (bold) as a function of
degradation temperature.
(B) DTA curves for (a) PVE/15A-10 (solid), (b) pure PVE (dashed), (c) PVE/CHDS/15A-
5/5 (hatched), and (d) PVE/CHDS-10 (bold).
NOT THE PUBLISHED VERSION; this is the author’s final, peer-reviewed manuscript. The published version may be accessed by following the link in the citation at the bottom of the page.
Polymer Degradation and Stability, Vol. 91, No. 6 (June 2006): pg. 1209-1218. DOI. This article is © Elsevier and permission has been granted for this version to appear in e-Publications@Marquette. Elsevier does not grant permission for this article to be further copied/distributed or hosted elsewhere without the express permission from Elsevier.
26
Figure 9
(A) TGA curves for (a) PVE/CHDS-15 (bold), (b) PVE/CHDS/15A-5/10 (hatched), (c)
PVE/15A-15 (solid), and (d) pure PVE (dashed).
(B) DTG curves for (a) PVE/CHDS-15 (bold), (b) PVE/15A-15 (solid), (c)
PVE/CHDS/15A-5/10 (hatched), and (d) pure PVE (dashed). Derivatized mass losses
are scaled by a factor of 100.

NOT THE PUBLISHED VERSION; this is the author’s final, peer-reviewed manuscript. The published version may be accessed by following the link in the citation at the bottom of the page.
Polymer Degradation and Stability, Vol. 91, No. 6 (June 2006): pg. 1209-1218. DOI. This article is © Elsevier and permission has been granted for this version to appear in e-Publications@Marquette. Elsevier does not grant permission for this article to be further copied/distributed or hosted elsewhere without the express permission from Elsevier.
27
Figure 10
(A) Curves of mass loss differences for PVE composites (a) PVE/15A-15 (solid), (b)
PVE/CHDS/15A-5/10 (hatched), and (c) PVE/CHDS-15 (bold) as a function of
degradation temperature.
(B) DTA curves for (a) PVE/CHDS/15A-5/10 (hatched), (b) PVE/15A-15 (solid), (c)
PVE/CHDS-15 (bold), and (d) pure PVE (dashed).

NOT THE PUBLISHED VERSION; this is the author’s final, peer-reviewed manuscript. The published version may be accessed by following the link in the citation at the bottom of the page.
Polymer Degradation and Stability, Vol. 91, No. 6 (June 2006): pg. 1209-1218. DOI. This article is © Elsevier and permission has been granted for this version to appear in e-Publications@Marquette. Elsevier does not grant permission for this article to be further copied/distributed or hosted elsewhere without the express permission from Elsevier.
28
Figure 11
(A) Heat release rate curves for (a) PVE/CHDS-10 (bold), (b) PVE/CHDS/RDP-5/5
(hatched), (c) pure PVE (dashed), and (d) PVE/RDP-10 (solid) from cone calorimetry
measurements at 35 kW/m2.
(B) Heat release rate curves for (a) PVE/CHDS-10 (bold), (b) PVE/CHDS/15A-5/5
(hatched), (c) pure PVE (dashed), and (d) PVE/15A-10 (solid) from cone calorimetry
measurements at 35 kW/m2.
NOT THE PUBLISHED VERSION; this is the author’s final, peer-reviewed manuscript. The published version may be accessed by following the link in the citation at the bottom of the page.
Polymer Degradation and Stability, Vol. 91, No. 6 (June 2006): pg. 1209-1218. DOI. This article is © Elsevier and permission has been granted for this version to appear in e-Publications@Marquette. Elsevier does not grant permission for this article to be further copied/distributed or hosted elsewhere without the express permission from Elsevier.
29
Figure 12
(A) Percent reduction in total heat release (THR) vs. % additive for all composites.
(B) Percent reduction in peak heat release (PHRR) vs. % additive for all composites.

NOT THE PUBLISHED VERSION; this is the author’s final, peer-reviewed manuscript. The published version may be accessed by following the link in the citation at the bottom of the page.
Polymer Degradation and Stability, Vol. 91, No. 6 (June 2006): pg. 1209-1218. DOI. This article is © Elsevier and permission has been granted for this version to appear in e-Publications@Marquette. Elsevier does not grant permission for this article to be further copied/distributed or hosted elsewhere without the express permission from Elsevier.
30
Figure 13
XRD pattern of PVE/CHDS/RDP-5/5 and its residues after heating to indicated
temperatures (250, 300, 350, 400, 450, and 650 ºC) at 20 ºC/min in TGA. Cu (Δ),
Cu2O (о), and an unidentified phase (■) are revealed in the XRD patterns of the
residues. Data are offset for clarity but otherwise not scaled.

NOT THE PUBLISHED VERSION; this is the author’s final, peer-reviewed manuscript. The published version may be accessed by following the link in the citation at the bottom of the page.
Polymer Degradation and Stability, Vol. 91, No. 6 (June 2006): pg. 1209-1218. DOI. This article is © Elsevier and permission has been granted for this version to appear in e-Publications@Marquette. Elsevier does not grant permission for this article to be further copied/distributed or hosted elsewhere without the express permission from Elsevier.
31
Figure 14
Fourier transform infrared (FTIR) traces for PVE/CHDS/RDP-5/5 and TGA residues of
PVE/CHDS/RDP-5/5 heated to different temperatures indicated in the plot. Data are
offset for clarity but otherwise not scaled.