probable capture fisheries scenarios for danajon...
TRANSCRIPT

Probable Capture Fisheries Probable Capture Fisheries Scenarios for Scenarios for DanajonDanajon BankBank
Input to the Formulation of the Input to the Formulation of the DanajonDanajonBank Fisheries Management PlanBank Fisheries Management Plan
29 June 200529 June 2005

TopicsTopics
TrophicTrophic system system –– the conceptthe conceptData inputsData inputsTrophicTrophic system for system for DanajonDanajon BankBankScenarios and simulationScenarios and simulationSummarySummary

Trophic level: the concept Trophic level: the concept Trophic level: the concept Tr
ophi
c le
vel
Trop
hic
leve
l
PhytoplanktonPhytoplankton
Top predatorsTop predators
Prey fishPrey fish
ZooplanktonZooplankton
. . . . . . .... .. .. .. .. .. .. .. *.*. .. .. ... . ..*.*.*.*.*.*.
*.*. *.*.*.*.*.*.
≅ 10%≅ 10%
≅ 10%≅ 10%
≅ 10%≅ 10%
*.*.
44
33
22
11

Ecology of fisheriesEcology of fisheriesEcology of fisheriesFisheries form part of a complex ecosystem
Fisheries Fisheries form part of a form part of a complex complex ecosystemecosystem

Some data inputSome data input
TrophicTrophic group group -- BiomassBiomassConsumption to biomass ratioConsumption to biomass ratioRate of mortalityRate of mortalityEcotrophicEcotrophic efficiencyefficiencyDiet compositionDiet compositionFishery harvestFishery harvestGate pricesGate prices

TrophicTrophic groupsgroups
danggitdanggit, , kitongkitong, , samaralsamaralRabbitfishRabbitfish1313banakbanak, , gisawgisaw, , molmolmolmolDemersalDemersal herbivoresherbivores1212gunoguno, , bolinaobolinao, , libgaolibgao, solid, solidCoastal Coastal planktivoresplanktivores1111
nokosnokos tarorotontaroroton, , bisayabisaya, , kubotankubotan, , bukobuko--bukobukoSquidsSquids44
1414
1010998877
66
55
332211
uyapuyapSergestidsSergestids
hiloshilos--hiloshilos, , mangsimangsi, , gilanggilang, , maubgasmaubgasSardinesSardinestamarongtamarong, , tikabtikab, , anduhawanduhawPelagic Pelagic planktivoresplanktivorespasayanpasayan, , loconlocon, , lunhanlunhan, , bulitbulitShrimpsShrimpslambaylambay, , kasagkasagBlue crabsBlue crabs
pakolpakol, , ngisingisi--ngisingisi, , kyampawkyampaw, , liptilipti, , labayanlabayan, , lupitlupit, , katambakkatambak, , tad, tad, lagawlagaw, , tuwastuwas, , silaysilay
ReefReef--associated associated zoobenthoszoobenthos feedersfeeders
moongmoong, , sapsapsapsap, , caraballascaraballas, , samooksamook, , bogobogo, , timbungantimbungan, , asoosasoos, , bugaongbugaong
SoftSoft--bottom bottom zoobenthoszoobenthosfeedersfeeders
ahaanahaan, , islawanislawan, , awmanawman, , panangitanpanangitan, , gawotgawot, , pugapopugapoReefReef--associated associated piscivorespiscivoresubodubod, , tikitiki--tikitiki, , sunugansunugan, , banghutinbanghutinSoftSoft--bottom bottom piscivorespiscivoresbawobawo, , talakitoktalakitok, , kubalkubal--kubalkubal, , balilabalila, bat, bat--ogog, lapis, , lapis, tangigitangigi, , diwitdiwitPelagic Pelagic piscivorespiscivores

Diet compositionDiet composition
mangsi, maubgas
0 10 20 30 40 50 60
M ollusks
Other benthic crustaceans
Coastal planktivores
Shrimps
Zooplankton
Phytoplankton
potpot, timbungan, buagaong
0 5 10 15 20 25
Reef zoobenthos feeders
Echinoderms
Soft-bottom zoobenthos feeders
Coastal planktivores
Phytoplankton
Sergestids
M ollusks
Other benthic crustaceans
Zooplankton
Algae, seaweeds
Shrimps
Crabs
Detritus
Worms
(percent composition of food group)

Harvest estimatesHarvest estimatesHarvest estimates
Gillnets
Blast f ishing
Seine nets
Pots and Traps
Spears
Hook & lines
Traw ls
Impounding nets
Others
Jigs
Other f ine mesh
41.7%
15.9%
10.7%
8.8%
8.7%
6.8%7.5%
(Based on catch survey in the focal of Danajon Bank)

Gate priceGate price
55OctopusOctopus1010SergestidsSergestids1313Other crabsOther crabs1919Coastal Coastal planktivoresplanktivores2424SardinesSardines3131SoftSoft--bottom bottom piscivorespiscivores4343SoftSoft--bottom bottom zoobenthoszoobenthos feedersfeeders6060Pelagic Pelagic planktivoresplanktivores6060Pelagic Pelagic piscivorespiscivores6262ReefReef--associated associated zoobenthoszoobenthos feedersfeeders6565RabbitfishRabbitfish7676SquidsSquids8080DemersalDemersal grazers/herbivoresgrazers/herbivores
117117Blue crabsBlue crabs130130ReefReef--associated associated piscivorespiscivores163163ShrimpsShrimps
Pesos/kiloPesos/kiloFish groupFish group
1919ScoopnetScoopnet2626dynamitedynamite2828beach seinebeach seine3131round haul seineround haul seine3333multiple multiple handlinehandline3636stationary stationary liftnetliftnet3636drift gillnetdrift gillnet3838encircling gillnetencircling gillnet4040set gillnet with plungerset gillnet with plunger4646danishdanish seineseine5454simple hook and linesimple hook and line5656bottom set gillnetbottom set gillnet6262trammel nettrammel net6464drivedrive--in gillnetin gillnet6666bottom set bottom set longlinelongline6767fish trapfish trap7474fish corralfish corral7777handspearhandspear7878spear with compressorspear with compressor8080squid jigsquid jig8080hook and line with floathook and line with float9999otter trawlotter trawl9999crab crab liftnetliftnet
118118crab gillnetcrab gillnet118118crab potcrab pot
Pesos/kiloPesos/kiloFishing gearFishing gear
Fishes
Fishing gears

Focal area in Focal area in DanajonDanajon BankBank
Area: 1,227 km2

pasayan(shrimps)
lambay, kasag(crabs)
banak, gisaw(algal grazers, herbivores)
bawo, talakitok, tangigi(pelagic piscivores)
ahaan, awman, pugawo(reef piscivores)
Trop
hic
leve
l
1
2
3
4
potpot, moong, timbungan
(soft-bottom zoobenthosfeeders)mangsi, gilang
maubgas (sardines)
bolinao, guno(coastal planktivores)
AlgaeDetritusPhytoplankton
Zooplankton
Trophic structure of Danajon Bank ecosystem
TrophicTrophic structure of structure of DanajonDanajon Bank Bank ecosystemecosystem
Average trophic level of the fishery: 2.89Average Average trophictrophic level of the fishery: 2.89level of the fishery: 2.89

pasayan(shrimps)
lambay, kasag(crabs)
banak, gisaw(algal grazers, herbivores)
bawo, talakitok, tangigi(pelagic piscivores)
ahaan, awman, pugawo(reef piscivores)
Trop
hic
leve
l
1
2
3
4
potpot, moong, timbungan
(soft-bottom zoobenthosfeeders)mangsi, gilang
maubgas (sardines)
bolinao, guno(coastal planktivores)
AlgaeDetritusPhytoplankton
Zooplankton
Trophic structure of Danajon Bank ecosystem
TrophicTrophic structure of structure of DanajonDanajon Bank Bank ecosystemecosystem
Average trophic level of the fishery: 2.5Average Average trophictrophic level of the fishery: 2.5level of the fishery: 2.5

pasayan(shrimps)
lambay, kasag(crabs)
banak, gisaw(algal grazers, herbivores)
bawo, talakitok, tangigi(pelagic piscivores)
ahaan, awman, pugawo(reef piscivores)
Trop
hic
leve
l
1
2
3
4
potpot, moong, timbungan
(soft-bottom zoobenthosfeeders)mangsi, gilang
maubgas (sardines)
bolinao, guno(coastal planktivores)
AlgaeDetritusPhytoplankton
Zooplankton
Trophic structure of Danajon Bank ecosystem
TrophicTrophic structure of structure of DanajonDanajon Bank Bank ecosystemecosystem
Average trophic level of the fishery: 3.0Average Average trophictrophic level of the fishery: 3.0level of the fishery: 3.0

0.0 0.5 1.0 1.5 2.0 2.5 3.0 3.5
Soft-bottom zoobenthos feeders
Blue crabs
Sardines
Pelagic piscivores
Reef-assoc. zoob. feeders
Coastal planktivores
Squids
Pelagic planktivores
Shrimps
Rabbitf ish
Demersal grazers/herbiv.
Reef-associated piscivores
Soft-bottom piscivores
Octopus
Other crabs
Sergestids
Total harvestable biomass
harvestable biomass (t/km2/yr)
Total harvestable biomass: 3.32 t/km2
Biomass estimates (initial year)Biomass estimates (initial year)Biomass estimates (initial year)
shrimps: 0.76 t/km2
other crabs: 0.59 t/km2
soft-bottom zoob.feeders: 0.42 t/km2
sardines: 0.32 t/km2
blue crabs: 0.22 t/km2
Top predators?
Equivalent value: PhP 237,581/km2
Value for focal area: PhP 291 Million

Trophic level: the concept Trophic level: the concept Trophic level: the concept Tr
ophi
c le
vel
Trop
hic
leve
l
PhytoplanktonPhytoplankton
Top predatorsTop predators
Prey fishPrey fish
ZooplanktonZooplankton
. . . . . . .... .. .. .. .. .. .. .. *.*. .. .. ... . ..*.*.*.*.*.*.
*.*. *.*.*.*.*.*.
≅ 10%≅ 10%
≅ 10%≅ 10%
≅ 10%≅ 10%
*.*.
44
33
22
11

SimulationSimulation
AA Increase of trawls, Danish seines, Increase of trawls, Danish seines, and blast fishing activitiesand blast fishing activities
Collapse of Collapse of management regimemanagement regime
BB Removal of all illegal and Removal of all illegal and destructive gears and effort destructive gears and effort redistributed indiscriminatelyredistributed indiscriminately
Partial/haphazard Partial/haphazard management management interventionsinterventions
CC Removal of all illegal and Removal of all illegal and destructive gears and effort destructive gears and effort redistributed appropriatelyredistributed appropriately
Appropriate Appropriate management options management options in place in place

-5%
0%
5%
10%
15%
20%
25%
30%
0 1 2 3 4 5 6
Year
% c
hang
e in
bio
mas
s
No management
Partial management
Sound management
Trend in harvestable biomass in the years Trend in harvestable biomass in the years following interventionfollowing intervention

Value (in Value (in PhPPhP) of harvestable biomass in the ) of harvestable biomass in the years following interventionyears following intervention
-5.0%
5.0%
15.0%
25.0%
35.0%
0 1 2 3 4 5 6
Partial management
Sound management
No management

-5%
0%
5%
10%
15%
20%
25%
30%
0 1 2 3 4 5 6
Year
% c
hang
e in
bio
mas
s
No management
Trend in harvestable biomass in the years Trend in harvestable biomass in the years following interventionfollowing intervention
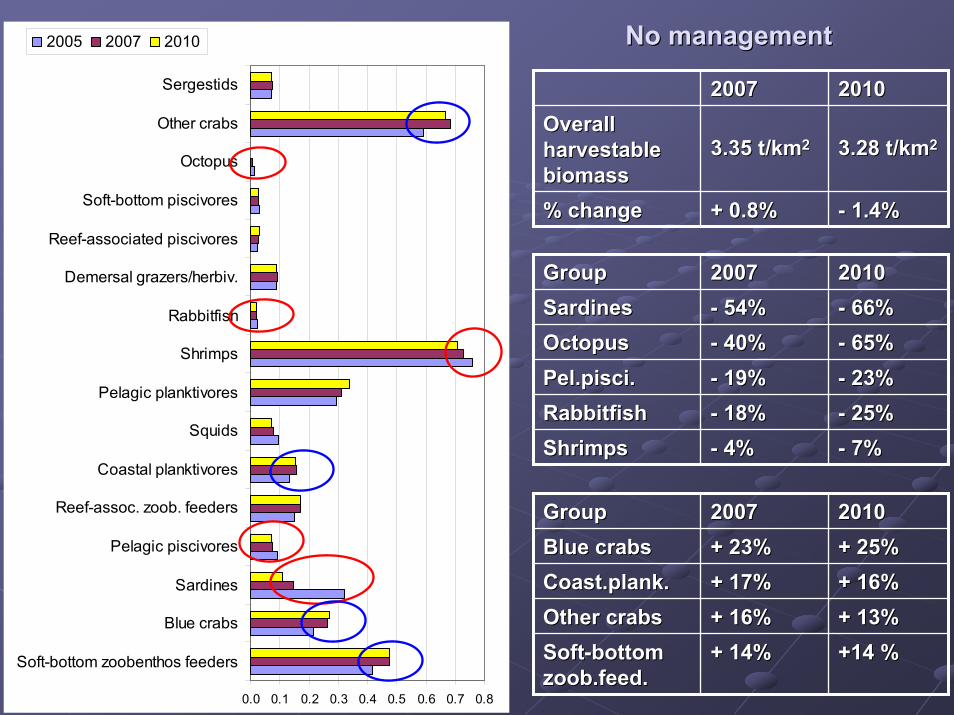
No managementNo managementNo management
0.0 0.1 0.2 0.3 0.4 0.5 0.6 0.7 0.8
Soft-bottom zoobenthos feeders
Blue crabs
Sardines
Pelagic piscivores
Reef-assoc. zoob. feeders
Coastal planktivores
Squids
Pelagic planktivores
Shrimps
Rabbitfish
Demersal grazers/herbiv.
Reef-associated piscivores
Soft-bottom piscivores
Octopus
Other crabs
Sergestids
2005 2007 2010
-- 7%7%-- 4%4%ShrimpsShrimps-- 25%25%-- 18%18%RabbitfishRabbitfish-- 23%23%-- 19%19%Pel.pisciPel.pisci..-- 65%65%-- 40%40%OctopusOctopus-- 66%66%-- 54%54%SardinesSardines2010201020072007GroupGroup
3.28 t/km3.28 t/km223.35 t/km3.35 t/km22Overall Overall harvestable harvestable biomassbiomass
-- 1.4%1.4%+ 0.8%+ 0.8%% change% change
2010201020072007
+14 %+14 %+ 14%+ 14%SoftSoft--bottom bottom zoob.feedzoob.feed..
+ 25%+ 25%+ 23%+ 23%Blue crabsBlue crabs+ 16%+ 16%+ 17%+ 17%Coast.plankCoast.plank..+ 13%+ 13%+ 16%+ 16%Other crabsOther crabs
2010201020072007GroupGroup

-5%
0%
5%
10%
15%
20%
25%
30%
0 1 2 3 4 5 6
Year
% c
hang
e in
bio
mas
s
Partial management
Trend in harvestable biomass in the years Trend in harvestable biomass in the years following interventionfollowing intervention

0.00 0.25 0.50 0.75 1.00 1.25
Soft-bottom zoobenthos feeders
Blue crabs
Sardines
Pelagic piscivores
Reef-assoc. zoob. feeders
Coastal planktivores
Squids
Pelagic planktivores
Shrimps
Rabbitfish
Demersal grazers/herbiv.
Reef-associated piscivores
Soft-bottom piscivores
Octopus
Other crabs
Sergestids
2005 2007 2010 Partial managementPartial managementPartial management
+ 53%+ 53%+ 35%+ 35%ShrimpsShrimps+ 97%+ 97%+ 97%+ 97%RabbitfishRabbitfish
+ 135%+ 135%+ 124%+ 124%Reef Reef piscipisci..+ 136%+ 136%+ 134%+ 134%PelPel. . PisciPisci..
+ 133%+ 133%+ 120%+ 120%OctopusOctopus+ 120%+ 120%+ 105%+ 105%SoftSoft--bottom bottom
piscipisci..+ 117%+ 117%+ 102%+ 102%SquidsSquids
2010201020072007GroupGroup
4.16 t/km4.16 t/km224.03 t/km4.03 t/km22Overall Overall harvestable harvestable biomassbiomass
+ 25.1%+ 25.1%+ 21.3%+ 21.3%% change% change
2010201020072007GroupGroup
-- 19%19%-- 15%15%SergestidsSergestids-- 90%90%-- 69%69%PelPel. Plank.. Plank.-- 75%75%-- 69%69%Blue crabsBlue crabs2010201020072007GroupGroup

-5%
0%
5%
10%
15%
20%
25%
30%
0 1 2 3 4 5 6
Year
% c
hang
e in
bio
mas
s
Sound management
Trend in harvestable biomass in the years Trend in harvestable biomass in the years following interventionfollowing intervention

0.0 0.2 0.4 0.6 0.8 1.0
Soft-bottom zoobenthos feeders
Blue crabs
Sardines
Pelagic piscivores
Reef-assoc. zoob. feeders
Coastal planktivores
Squids
Pelagic planktivores
Shrimps
Rabbitfish
Demersal grazers/herbiv.
Reef-associated piscivores
Soft-bottom piscivores
Octopus
Other crabs
Sergestids
2005 2007 2010
3.90 t/km3.90 t/km223.92 t/km3.92 t/km22Overall Overall harvestable harvestable biomassbiomass
+ 17.3%+ 17.3%+ 18.0%+ 18.0%% change% change
2010201020072007Sound managementSound managementSound management
-- 18%18%-- 10%10%ReefReef--assoc. assoc. zoobzoob. Feeders. Feeders
-- 100%100%-- 95%95%Pelagic plank.Pelagic plank.2010201020072007GroupGroup
+ 59%+ 59%+ 54%+ 54%ReefReef--assoc. assoc. piscivorespiscivores
+ 26%+ 26%+ 23%+ 23%CrabsCrabs
+ 129%+ 129%+ 124%+ 124%SquidsSquids+ 121%+ 121%+ 127%+ 127%PelPel. . PisciPisci..
+ 80%+ 80%+ 80%+ 80%RabbitfishRabbitfish+ 78%+ 78%+ 77%+ 77%SoftSoft--bottom bottom
piscivorespiscivores+ 60%+ 60%+ 65%+ 65%SardinesSardines
+ 162%+ 162%+ 143%+ 143%OctopusOctopus2010201020072007GroupGroup

SummarySummary
Collapse of management regime will lead to Collapse of management regime will lead to overall decline of the harvestable biomassoverall decline of the harvestable biomassPartial management will lead to the biggest Partial management will lead to the biggest overall increase in the harvestable biomass but overall increase in the harvestable biomass but drastic decline of important commodity like the drastic decline of important commodity like the “blue crab”“blue crab”Sound management will lead to a moderate Sound management will lead to a moderate increase in the harvestable biomass but increase in the harvestable biomass but increase in the desirable species especially the increase in the desirable species especially the carnivorescarnivores

Thank youThank you