probability-weighted outcomes under ifrs 9: a...
TRANSCRIPT

1
Probability-Weighted Outcomes Under IFRS 9: A Macroeconomic ApproachBY BARNABY BLACK, GLENN LEVINE, AND DR. JUAN M. LICARI
The incoming IFRS 9 regulation provides for the use of macroeconomic forecasts and probability-
weighted outcomes, particularly when accounting for the impairment of financial assets. Indeed, the
spirit of IFRS 9 suggests that finance officers should be more forward-looking in their recognition
of credit losses on a firm’s balance sheet, with the macroeconomy often taking a central place in
any impairment forecast. Paragraph B5.5.42, for example, “requires the estimate of expected credit
losses to reflect an unbiased and probability-weighted amount that is determined by evaluating a
range of possible outcomes.” More specifically, two key areas of IFRS 9 suggest that macroeconomic
scenario forecasts may be utilized:
1. Section 5.5.3, which outlines the method for calculating lifetime expected credit losses once an
instrument has passed from Stage 1 to Stage 2.
2. Section 5.5.9, which describes the procedure for assessing whether an instrument has undergone
a significant deterioration in credit risk.
This report focuses primarily on Option 1 above, and how probability weights can be derived from
macroeconomic forecasts to produce an unbiased estimate of lifetime expected losses. Given the
accounting standard’s goal of consistency, however, the scenario weights derived from Option 1 may
also be used in Option 2. 1
Like the IFRS 9 standard itself, this article does not prescribe a specific plan of action or a one-
size-fits-all approach to the use of macroeconomic forecasts and probability weights. Rather,
it is designed to help institutions build a framework that addresses the “forward-looking” and
“probability-weighted” aspects of IFRS 9 impairment calculation using macroeconomic forecasts.
THE CONVERGENCE OF RISK, FINANCE, AND ACCOUNTING
Barnaby Black is an Assistant Director in the Moody's Analytics London office. His responsibilities involve leading client projects regarding IFRS 9 impairment, capital and impairment forecasting, and stress testing, particularly for retail and SME portfolios. He has an MS in Operational Research and Statistics from Southampton University and a BS in the same field from the University of Kent.
Barnaby Black Assistant Director, Economist
Glenn Levine is an Associate Director in the Moody’s Analytics Capital Markets Research Group. He provides support for the EDF product suite and is the lead researcher for Stressed EDF. Prior to his current role, he was a Senior Economist in the Economics and Consumer Credit division based in Sydney, Australia. He holds an MS from the London School of Economics and a bachelor’s degree from the University of New South Wales.
Glenn Levine Associate Director, Senior Research Analyst
In this article, we discuss development of a framework that addresses the forward-looking and probability-weighted aspects of IFRS 9 impairment calculation using macroeconomic forecasts. In it, we address questions around the practical use of alternative scenarios and their probabilities. We also include a case study to illustrate these concepts in practice.
View all articles of this edition at MoodysAnalytics.com/RiskPerspectives
Dr. Juan M. Licari is a managing director at Moody's Analytics and the head of the Economic and Consumer Credit Analytics team in EMEA. Dr. Licari’s team provides consulting support to major industry players, builds econometric tools to model credit phenomena, and has implemented several stress testing platforms to quantify portfolio risk exposure. He has a PhD and an MA in economics from the University of Pennsylvania and graduated summa cum laude from the National University of Cordoba in Argentina.
Dr. Juan M. Licari Managing Director, Chief International Economist
1 See paragraph 54 of IFRS staff paper, Transition Resource Group for Impairment of Financial Instruments, December 11, 2015.
2 MOODY'S ANALYTICS
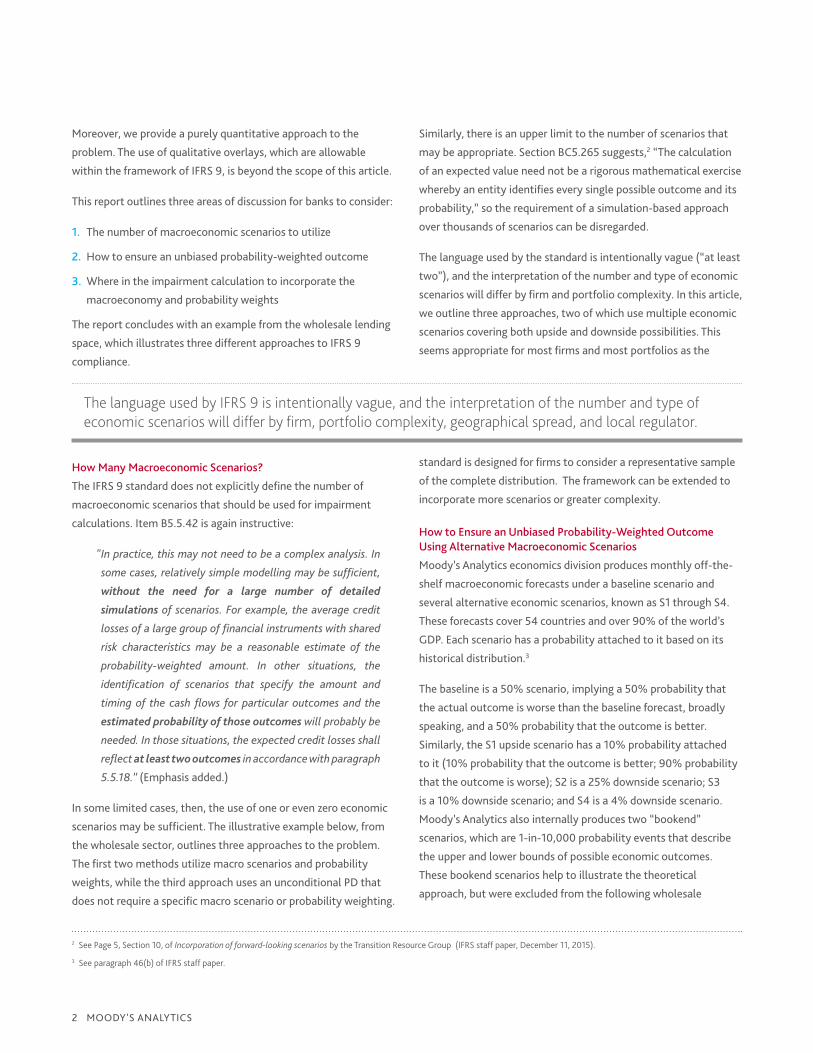
Moreover, we provide a purely quantitative approach to the
problem. The use of qualitative overlays, which are allowable
within the framework of IFRS 9, is beyond the scope of this article.
This report outlines three areas of discussion for banks to consider:
1. The number of macroeconomic scenarios to utilize
2. How to ensure an unbiased probability-weighted outcome
3. Where in the impairment calculation to incorporate the
macroeconomy and probability weights
The report concludes with an example from the wholesale lending
space, which illustrates three different approaches to IFRS 9
compliance.
How Many Macroeconomic Scenarios?
The IFRS 9 standard does not explicitly define the number of
macroeconomic scenarios that should be used for impairment
calculations. Item B5.5.42 is again instructive:
" In practice, this may not need to be a complex analysis. In
some cases, relatively simple modelling may be sufficient,
without the need for a large number of detailed
simulations of scenarios. For example, the average credit
losses of a large group of financial instruments with shared
risk characteristics may be a reasonable estimate of the
probability-weighted amount. In other situations, the
identification of scenarios that specify the amount and
timing of the cash flows for particular outcomes and the
estimated probability of those outcomes will probably be
needed. In those situations, the expected credit losses shall
reflect at least two outcomes in accordance with paragraph
5.5.18.” (Emphasis added.)
In some limited cases, then, the use of one or even zero economic
scenarios may be sufficient. The illustrative example below, from
the wholesale sector, outlines three approaches to the problem.
The first two methods utilize macro scenarios and probability
weights, while the third approach uses an unconditional PD that
does not require a specific macro scenario or probability weighting.
Similarly, there is an upper limit to the number of scenarios that
may be appropriate. Section BC5.265 suggests,2 “The calculation
of an expected value need not be a rigorous mathematical exercise
whereby an entity identifies every single possible outcome and its
probability,” so the requirement of a simulation-based approach
over thousands of scenarios can be disregarded.
The language used by the standard is intentionally vague (“at least
two”), and the interpretation of the number and type of economic
scenarios will differ by firm and portfolio complexity. In this article,
we outline three approaches, two of which use multiple economic
scenarios covering both upside and downside possibilities. This
seems appropriate for most firms and most portfolios as the
standard is designed for firms to consider a representative sample
of the complete distribution. The framework can be extended to
incorporate more scenarios or greater complexity.
How to Ensure an Unbiased Probability-Weighted Outcome Using Alternative Macroeconomic Scenarios
Moody’s Analytics economics division produces monthly off-the-
shelf macroeconomic forecasts under a baseline scenario and
several alternative economic scenarios, known as S1 through S4.
These forecasts cover 54 countries and over 90% of the world’s
GDP. Each scenario has a probability attached to it based on its
historical distribution.3
The baseline is a 50% scenario, implying a 50% probability that
the actual outcome is worse than the baseline forecast, broadly
speaking, and a 50% probability that the outcome is better.
Similarly, the S1 upside scenario has a 10% probability attached
to it (10% probability that the outcome is better; 90% probability
that the outcome is worse); S2 is a 25% downside scenario; S3
is a 10% downside scenario; and S4 is a 4% downside scenario.
Moody’s Analytics also internally produces two “bookend”
scenarios, which are 1-in-10,000 probability events that describe
the upper and lower bounds of possible economic outcomes.
These bookend scenarios help to illustrate the theoretical
approach, but were excluded from the following wholesale
The language used by IFRS 9 is intentionally vague, and the interpretation of the number and type of economic scenarios will differ by firm, portfolio complexity, geographical spread, and local regulator.
2 See Page 5, Section 10, of Incorporation of forward-looking scenarios by the Transition Resource Group (IFRS staff paper, December 11, 2015).
3 See paragraph 46(b) of IFRS staff paper.

PROBABILITY-WEIGHTED OUTCOMES UNDER IFRS 9: A MACROECONOMIC APPROACH
example as the guidance recommends that firms “should not
estimate a worst-case scenario nor the best-case scenario.”4
The baseline scenario is therefore the median outcome, and not
the mean. The IFRS 9 guidelines require expected losses to be
calculated on the probability-weighted mean of the distribution,
not the median, so even if a single scenario were to be used, the
baseline may not be appropriate. (Other economists may forecast
the mode – the most likely outcome – which is also inappropriate,
without overlays, within IFRS 9.) These scenario probabilities
describe a cumulative distribution function (CDF) showing
probabilities for the economy to perform better or worse than a
given forecast (Figure 1).
Figure 1 Scenario probabilities – cumulative distribution function
Source: Moody’s Analytics
An expected value can be derived from a CDF in two ways. First,
we could “integrate” the CDF to calculate the area under the
curve. This would give a single mean economic outcome that could
be conditioned on in expected loss calculations. However, as will
be discussed later, it may be preferable to use several economic
scenarios, push these scenarios across credit expected loss inputs
(PDs, EADs, LGDs), and then weight these scenario-conditional
risk parameters by the scenario probabilities. A second option is to
“differentiate” the CDF, or take its slope at each point, to produce
a probability distribution function (PDF). Figure 2 describes the
PDF using US GDP (in billions of 2009 USD).
Figure 2 Scenario probabilities – probability density function
Source: Moody’s Analytics
We can calculate an expected value by using the probability
masses from this PDF to weight either the economic data or the
credit outcomes conditioned on that economic data, depending on
which stage of the process the weights are applied to.
How and Where to Incorporate Macroeconomic Scenarios and Probability Weights
IFRS 9 provides no explicit guidance on how the probability-
weighted outcomes should be used, although we can glean some
insight from the standard itself and follow-up discussions. For
example, using the above approach, should the probability weights
be applied to the economic data to produce a single, probability-
weighted economic scenario which is then put through the credit
model? Or should the user put all relevant scenarios through
the credit model and then apply the scenario weights to obtain a
probability-weighted credit outcome?
Public discussion at the Transition Resource Group for
Impairment of Financial Instruments emphasized that using a
single macroeconomic scenario may not be appropriate if the
relationship between credit losses and the macroeconomy is
nonlinear. This will often be the case in a properly specified credit
model. Moreover, even if the credit estimate is unbiased, a single
weighted scenario may be undesirable as the standard emphasizes
evaluating a range of outcomes, not a range of scenarios. This is
because firms may gain additional insight into the exposure of
their portfolio by assessing a distribution of credit outcomes.
LO
0.0
0.2
0.4
0.6
0.8
1.0
S4 S3 S2 BL S1 H1
LO-S4 S4-S3 S3-S2 S2-BL BL-SL S1-H1
0
0.002
0.004
0.006
0.008
0.01
4 See paragraph 46(d) of IFRS staff paper.

4 MOODY'S ANALYTICS
This can be illustrated through a simple example. Imagine it is
2006 and there are two firms that both have a large subprime
mortgage exposure. Firm A models its expected credit losses
under a single, probability-weighted economic scenario, showing
only mild credit losses under this scenario. Firm B, however, uses
several economic scenarios and notices that while its expected
probability-weighted credit losses are modest, its losses under
a sharp recession (such as S4) are severe enough to put it out of
business.
From an accounting perspective, both Firm A and Firm B may
recognize similar expected losses under IFRS 9. Yet from a
statistical perspective, the measure of expected credit losses
recognized by Firm A may be biased because of the non-linear
relationship between credit losses and the macroeconomy. And
from a risk manager’s perspective, the information available
from Firm B’s accounting of expected losses provides a far richer
information set and the possibility to take mitigating action if the
risk of an S4-type scenario is considered material.
Case Study: Wholesale Portfolio Example
The Moody’s Analytics CreditEdge model provides a suitable
framework for IFRS 9 compliance with C&I exposures.5 This
example uses the EDF metric, which provides an unconditional
firm-level PD with a tenure of one to 10 years, and the Stressed
EDF satellite model, which uses the core EDF metric to provide
a firm-level PD forecast conditioned on any economic scenario.
Stressed EDF already produces monthly forecasts conditioned on
the Moody’s Analytics scenarios described above, and so is well-
suited to this purpose.
In this example, we may decide IFRS 9 stage allocation by
comparing the unconditional EDF at the reporting date with EDF
at origination to determine whether a significant deterioration
in credit risk has occurred. A suitable criterion, such as if a firm’s
implied credit rating has deteriorated by, say, three or more
notches, would determine stage allocation.
Once an instrument has passed into Stage 2, lifetime EL must be
calculated and accounted. There are three options for performing
this calculation, based on the discussion in previous sections:6
1. Apply the economic scenario probability weights to the
Stressed EDF forecasts produced by conditioning on those
economic scenarios. This is our recommended approach for the
reasons outlined previously. Figure 3 illustrates this example
using JP Morgan. The probability-weighted PD is above the
baseline through the forecast period.
Figure 3 JP Morgan, scenario conditional 1-year PD curves & weighted
average (expected value)
Source: Moody’s Analytics
2. Combine the economic scenarios into a single probability-
weighted scenario. This will, however, produce a biased
measure of lifetime EL if the relationship between the
macroeconomy and PD is non-linear. This is the case, by design,
with the Stressed EDF model. Moreover, it glosses over the
potential distribution of credit losses. Figure 4 illustrates the
approach.
Figure 4 JP Morgan, 1-year PD conditioned on a single probability-weighted
average economic scenario
Source: Moody’s Analytics
Jan-15 Jul-15 Jan-16 Jul-16 Jan-17 Jul-17 Jan-180
0.1
0.2
0.3
0.4
0.5
0.6History (EDF) Stressed EDF
Jun-18
5 A modeling approach for retail portfolios is detailed in Black, Chincalkar, & Licari, Complying with IFRS 9 Impairment Calculations for Retail Portfolios, Risk Perspectives Magazine, June 2016, Moody’s Analytics.
6 The IFRS staff paper outlines three approaches that broadly mirror the three options, plus a fourth possibility which uses the modal or most likely economic scenario in combination with a qualitative overlay. Our recommendations borrow heavily from this directive.
Jan-15 Jul-15 Jan-16 July-16 Jan-17 Jul-17 Jan-180
0.5
1
1.5
2.0
2.5
History (EDF)Baseline
S1S2
S3S4
Weighted Average
EDF
(%)
Jun-18
EDF
(%)

PROBABILITY-WEIGHTED OUTCOMES UNDER IFRS 9: A MACROECONOMIC APPROACH
3. A third option is to use the unconditional EDF to calculate
lifetime EL. That is, if an instrument has eight years left until
maturity, simply use the eight-year EDF as a measure of
lifetime PD. The resulting EL calculation can be considered
a weighted distribution of economic scenarios. That is, the
EDF metric combines data from a firm’s balance sheet with
the firm’s stock price, which is also the market’s expectation
of discounted future profits, with every possible profit path
weighted by the probability of that path occurring. The measure
is also unbiased by the construction of the EDF model, which
is calibrated to physical default probabilities using Moody’s
Analytics default database.
All three options may be suitable in different situations, depending
on the relationship between credit risk and the macroeconomy
and the desired objective of the reporting process. Figure 5
summarizes the results using the two-year cumulative PD from
each approach.
Concluding Remarks
In this article we have analyzed the use of macroeconomic
scenarios as part of the forward-looking, probability-weighted
IFRS 9 framework. Some of the key questions around the practical
use of alternative scenarios and their probabilities have been
answered, and a case study illustrates these concepts in practice.
We argue in favor of leveraging a handful of alternative forecasts in
order to comply with recent regulation. The shape and severity of
the scenarios can vary over industries and firms, but the regulatory
language is fairly clear when requesting the need to account for
alternative outcomes under a probability-weighted framework.
Figure 5 JP Morgan, two-year cumulative PD under the three approaches
(%)
Two-Year Cumulative PD
1. Probability weighted on the
SEDFs1.19
2. Probability weighted on the
economic scenarios0.86
3. Unconditional EDF 0.91
Source: Moody’s Analytics

6 MOODY'S ANALYTICS

PROBABILITY-WEIGHTED OUTCOMES UNDER IFRS 9: A MACROECONOMIC APPROACH
© 2016 Moody’s Corporation, Moody’s Investors Service, Inc., Moody’s Analytics, Inc. and/or their licensors and affiliates (collectively, “MOODY’S”). All rights reserved.
CREDIT RATINGS ISSUED BY MOODY’S INVESTORS SERVICE, INC. AND ITS RATINGS AFFILIATES (“MIS”) ARE MOODY’S CURRENT OPINIONS OF THE RELATIVE FUTURE CREDIT RISK OF ENTITIES, CREDIT COMMITMENTS, OR DEBT OR DEBT-LIKE SECURITIES, AND CREDIT RATINGS AND RESEARCH PUBLICATIONS PUB-LISHED BY MOODY’S (“MOODY’S PUBLICATIONS”) MAY INCLUDE MOODY’S CURRENT OPINIONS OF THE RELATIVE FUTURE CREDIT RISK OF ENTITIES, CREDIT COMMITMENTS, OR DEBT OR DEBT-LIKE SECURITIES. MOODY’S DEFINES CREDIT RISK AS THE RISK THAT AN ENTITY MAY NOT MEET ITS CONTRACTUAL, FINANCIAL OBLIGATIONS AS THEY COME DUE AND ANY ESTIMATED FINANCIAL LOSS IN THE EVENT OF DEFAULT. CREDIT RATINGS DO NOT ADDRESS ANY OTHER RISK, INCLUDING BUT NOT LIMITED TO: LIQUIDITY RISK, MARKET VALUE RISK, OR PRICE VOLATILITY. CREDIT RATINGS AND MOODY’S OPINIONS IN-CLUDED IN MOODY’S PUBLICATIONS ARE NOT STATEMENTS OF CURRENT OR HISTORICAL FACT. MOODY’S PUBLICATIONS MAY ALSO INCLUDE QUANTITA-TIVE MODEL-BASED ESTIMATES OF CREDIT RISK AND RELATED OPINIONS OR COMMENTARY PUBLISHED BY MOODY’S ANALYTICS, INC. CREDIT RATINGS AND MOODY’S PUBLICATIONS DO NOT CONSTITUTE OR PROVIDE INVESTMENT OR FINANCIAL ADVICE, AND CREDIT RATINGS AND MOODY’S PUBLICATIONS ARE NOT AND DO NOT PROVIDE RECOMMENDATIONS TO PURCHASE, SELL, OR HOLD PARTICULAR SECURITIES. NEITHER CREDIT RATINGS NOR MOODY’S PUBLICATIONS COMMENT ON THE SUITABILITY OF AN INVESTMENT FOR ANY PARTICULAR INVESTOR. MOODY’S ISSUES ITS CREDIT RATINGS AND PUB-LISHES MOODY’S PUBLICATIONS WITH THE EXPECTATION AND UNDERSTANDING THAT EACH INVESTOR WILL, WITH DUE CARE, MAKE ITS OWN STUDY AND EVALUATION OF EACH SECURITY THAT IS UNDER CONSIDERATION FOR PURCHASE, HOLDING, OR SALE.
MOODY’S CREDIT RATINGS AND MOODY’S PUBLICATIONS ARE NOT INTENDED FOR USE BY RETAIL INVESTORS AND IT WOULD BE RECKLESS AND INAPPRO-PRIATE FOR RETAIL INVESTORS TO USE MOODY’S CREDIT RATINGS OR MOODY’S PUBLICATIONS WHEN MAKING AN INVESTMENT DECISION. IF IN DOUBT YOU SHOULD CONTACT YOUR FINANCIAL OR OTHER PROFESSIONAL ADVISER.
ALL INFORMATION CONTAINED HEREIN IS PROTECTED BY LAW, INCLUDING BUT NOT LIMITED TO, COPYRIGHT LAW, AND NONE OF SUCH INFORMATION MAY BE COPIED OR OTHERWISE REPRODUCED, REPACKAGED, FURTHER TRANSMITTED, TRANSFERRED, DISSEMINATED, REDISTRIBUTED OR RESOLD, OR STORED FOR SUBSEQUENT USE FOR ANY SUCH PURPOSE, IN WHOLE OR IN PART, IN ANY FORM OR MANNER OR BY ANY MEANS WHATSOEVER, BY ANY PERSON WITHOUT MOODY’S PRIOR WRITTEN CONSENT.
All information contained herein is obtained by MOODY’S from sources believed by it to be accurate and reliable. Because of the possibility of human or me-chanical error as well as other factors, however, all information contained herein is provided “AS IS” without warranty of any kind. MOODY’S adopts all necessary measures so that the information it uses in assigning a credit rating is of sufficient quality and from sources MOODY’S considers to be reliable including, when appropriate, independent third-party sources. However, MOODY’S is not an auditor and cannot in every instance independently verify or validate information received in the rating process or in preparing the Moody’s Publications.
To the extent permitted by law, MOODY’S and its directors, officers, employees, agents, representatives, licensors and suppliers disclaim liability to any person or entity for any indirect, special, consequential, or incidental losses or damages whatsoever arising from or in connection with the information contained herein or the use of or inability to use any such information, even if MOODY’S or any of its directors, officers, employees, agents, representatives, licensors or suppliers is advised in advance of the possibility of such losses or damages, including but not limited to: (a) any loss of present or prospective profits or (b) any loss or damage arising where the relevant financial instrument is not the subject of a particular credit rating assigned by MOODY’S.
To the extent permitted by law, MOODY’S and its directors, officers, employees, agents, representatives, licensors and suppliers disclaim liability for any direct or compensatory losses or damages caused to any person or entity, including but not limited to by any negligence (but excluding fraud, willful misconduct or any other type of liability that, for the avoidance of doubt, by law cannot be excluded) on the part of, or any contingency within or beyond the control of, MOODY’S or any of its directors, officers, employees, agents, representatives, licensors or suppliers, arising from or in connection with the information contained herein or the use of or inability to use any such information.
NO WARRANTY, EXPRESS OR IMPLIED, AS TO THE ACCURACY, TIMELINESS, COMPLETENESS, MERCHANTABILITY OR FITNESS FOR ANY PARTICULAR PURPOSE OF ANY SUCH RATING OR OTHER OPINION OR INFORMATION IS GIVEN OR MADE BY MOODY’S IN ANY FORM OR MANNER WHATSOEVER.
Moody’s Investors Service, Inc., a wholly-owned credit rating agency subsidiary of Moody’s Corporation (“MCO”), hereby discloses that most issuers of debt securi-ties (including corporate and municipal bonds, debentures, notes and commercial paper) and preferred stock rated by Moody’s Investors Service, Inc. have, prior to assignment of any rating, agreed to pay to Moody’s Investors Service, Inc. for appraisal and rating services rendered by it fees ranging from $1,500 to approximately $2,500,000. MCO and MIS also maintain policies and procedures to address the independence of MIS’s ratings and rating processes. Information regarding certain affiliations that may exist between directors of MCO and rated entities, and between entities who hold ratings from MIS and have also publicly reported to the SEC an ownership interest in MCO of more than 5%, is posted annually at www.moodys.com under the heading “Investor Relations — Corporate Governance — Direc-tor and Shareholder Affiliation Policy.”

Find additional integrated risk management articles, interviews, and multimedia content at MoodysAnalytics.com/RiskPerspectives
Asia (excluding Japan)[email protected]
CONTACT US Visit us at moodysanalytics.com or contact us at a location below:
© 2016 Moody’s Corporation, Moody’s Investors Service, Inc., Moody’s Analytics, Inc. and/or their licensors and affiliates (collectively, “MOODY’S”). All rights reserved.