probabilistic seismic hazard analysis with local site effects
TRANSCRIPT

A Workshop on Microzonation ©Interline Publishing, Bangalore
Probabilistic Seismic Hazard Analysis with Local Site Effects
P.Anbazhagan, J. S. Vinod and T.G.Sitharam*
Department of Civil Engineering, Indian Institute of Science, Bangalore, India 560012. *Corresponding author: [email protected]
Abstract A probabilistic seismic hazard analysis for Bangalore, south India, is presented in this paper with an emphasis on the local site conditions. Analyses were carried out using the earthquake catalogue available over a radius of 350 km around Bangalore city. Earthquake data were analyzed statistically and recurrence relationship has been obtained using Guttenberg-Richter (G-R) relationship. Probabilistic seismic hazard analyses were then carried out for Bangalore region considering known six seismogenic sources. Results of the present investigation were presented in the form of peak ground acceleration and response spectra at bed rock level and considering the local site conditions. From the extensive field investigation using MASW (Multichannel Analysis of Surface Wave ) from 58 locations in Bangalore region it has been observed that the shear wave velocity falls in the range of 0.18 ≤ Vs ≤ 0.36 (Site Class D). Based on this, a response spectrum is generated by considering the Bangalore region under site class D. The hazard curves of mean annual rate of exceedance for peak ground acceleration and spectral acceleration have been generated at rock level and also by taking into consideration the local site condition. Further, the uniform hazard response spectrum with 5% damping for Bangalore has been generated for 10% probability of exceedance in 50 years for bed rock condition and considering local site effects. The peak ground acceleration (PGA) value of 0.121g at bed rock level and a value of 0.35g considering the local site condition for Bangalore region have been observed from the present investigation.
Introduction Probabilistic seismic hazard analysis (PSHA) is the most widely used approach for the determination of seismic design loads for engineering structures. The use of probabilistic concept has allowed uncertainties in the size, location, and rate of recurrence of earthquakes and in the variation of ground motion characteristics with earthquake size and location to be explicitly considered for the evaluation of seismic hazard. In addition, PSHA provides a frame work in which these uncertainties can be identified, quantified and combined in a rational manner to provide a more complete picture of the seismic hazard. The primary output from a PSHA is a hazard curves showing the variation of a selected ground-motion parameter, such as peak ground acceleration (PGA) or spectral acceleration (SA), against the annual frequency of exceedance (or its reciprocal, return period). In the present investigation, PSHA has been carried out for Bangalore region, South India with an emphasis on local soil condition. South India was once considered as a stable continent and has recently experienced many earthquakes indicating that it has become seismically moderately active. Bangalore densely populated, is an economically and industrially important city in India. It is one of the fastest growing cities in Asia. Even for moderate earthquake Bangalore is vulnerable due to mushrooming of all kinds of buildings founded on encroached areas of tank beds, which were silted up over a period of time (more than 150 lake beds in Bangalore have been converted and used for habitation in the last 60 years). The seismicity studies in southern Indian by geologists and seismologists highlights that south India is becoming seismically active when compare to past. In this regard, deterministic seismic hazard analysis has been carried out by Sitharam and Anbazhagan (2007) and Sitharam et al (2006) for

Probabilistic Seismic Hazard… 123
Bangalore region; they have reported a maximum credible earthquake (MCE) and identified seismogenic sources to Bangalore city. However, current investigation focuses on the probabilistic seismic hazard analysis for Bangalore region. Analyses were carried out using the available earthquake catalogue over a radius of 350 km around Bangalore city. Earthquake data available were analyzed statistically and recurrence relationship has been obtained using Guttenberg-Richter (G-R) relationship. Probabilistic seismic hazard analyses were then carried out for Bangalore region considering known six seismogenic sources. Results of the present investigation are presented in the form of peak ground acceleration and response spectra for both at rock level and for the ground level.
Study area and seismicity of the region Study region considered for the present investigation covers an area of 350 km around Bangalore as per regulatory guide 1.167 (1997). Other detail such as regional geology and seismological details for the Bangalore city has been collected from extensive literature review, study of maps, remote sensing data etc. The study area marked in the India map is shown in Figure 1.The study area having the center point as Bangalore city with latitude of 12058’’ N and longitude of 77036’’ E having a radius of 350km around which covers the latitude 9.80 N to 16.2 0 N and longitude of 74.50 E to 80.70 E. It covers major part of Karnataka state, northern part of Tamil Nadu state, portion of Kerala and and Andra Pradesh state. Geological formation of the study area is similar to the Indian Peninsula, which is geologically considered as one of the oldest land masses of the earth’s crust.
Bangalore city Latitude of 12058’’N
Study Area 350km around Bangalore
Mumbai city
Figure 1 Study area in the India map.

Microzonation 124
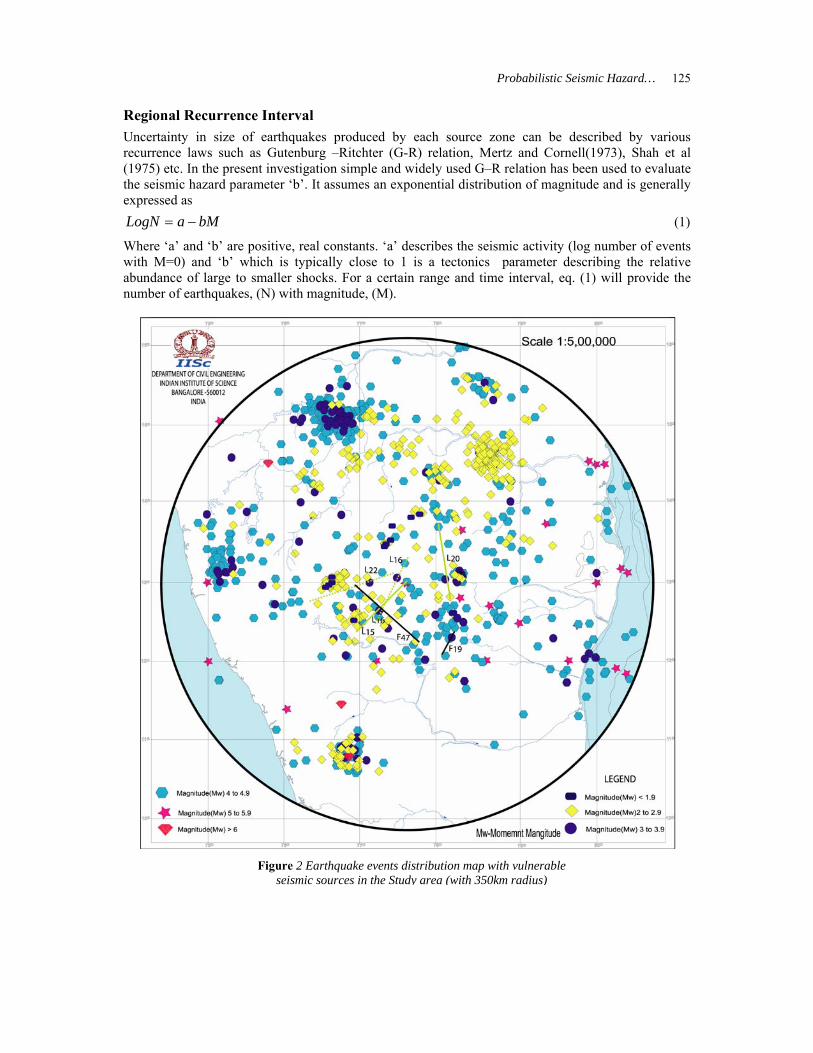
In the recent past, many researchers have addressed the seismicity of Peninsular India (Kaila et al 1972; Chandra 1977; Rao and Rao 1984; Tandon, 1992; Khattri, 1992; Seismotectonic Atlas, 2000; Parvez et al., 2003; Bilham, 2004; Iyengar and Raghukanth 2004; Sitharam et al., 2006 and Sitharam and Anbazhagan, 2007). As per IS 1893 (2002), seismic study area falls in the upgraded zone III and zone II in the seismic zonation map of India. Srinivasan and Sreenivas (1977), Valdiya (1998), Purnachandra Rao (1999), Ramalingeswara Rao (2000), Subrahmanya (1996 and 2002), Ganesha Raj (2001), Sridevi Jade (2004), Ganesha Raj and Nijagunappa (2004), Sitharam et. al (2006) and Sitharam and Anbazhagan (2007) highlight that seismic activity in the peninsular India has increased when compared to the past. Seismic data collected from various agencies [United State Geological Survey (USGS), Indian Metrological Department (IMD), Geological Survey of India (GSI) and Amateur Seismic Centre (ASC) and Gauribidanur (GB) Seismic station] contain information about the earthquake size in different scales such as intensity, local magnitude, surface wave magnitude and body wave magnitudes. These magnitudes are converted to moment magnitudes (Mw) to achieve the status of the uniform magnitude by using magnitude relations given by Heaton et al (1986). The earthquake events collected are about 1421 with minimum moment magnitude of 1.0 and a maximum of 6.2. The data set contains 394 events which are less than 3, 790 events from 3 to 3.9, 212 events from 4 to 4.9, 22 events from 5 to 5.9 and 3 events are magnitude 6 and above. List of selected major earthquakes used in this study are given in Table 1. The earthquake events collected with latitudes and longitudes are used to prepare the Seismotectonic map for Bangalore region which is shown in Figure 2. Figure 2 shows the earthquake data and seismogenic sources identified by Sitharam and Anbazhagan (2007). Figure 2 shows that distribution of seismic data in the study area. There are cluster of earthquakes of moment magnitude (Mw) of 2 to 2.9 found at intersection of 10.80 N and 76.90 E, 12.50 N and 76.50 E, 13.00 N and 76.50 E, 14.30 N and 78.00 E and 14.50 N and 78.60 E. Mw of 3.to 3.9 at more frequently occurred within the area of 15.10 N and 76.80 E, Mw of 4-4.9 distributed through out the study area and clustered at two locations (13.20 N and 75.10 E and 15.10 N and 76.60 E). The range of 5 to 5.9 randomly distributed in the study area and reported close to the study area. Magnitude 6 and above reported at 3 locations, also falls close to the western part of Bangalore.
Table 1 Number of earthquakes reported in each decade for Bangalore region.
From To 1<M<1.9 2<M<2.9 3<M<3.9 4<M<4.9 >5 Total 1807 1816 2 2 1817 1826 4 4 1827 1836 2 2 1837 1846 1 1 1847 1856 1 1 1857 1866 10 5 15 1867 1876 2 2 1877 1886 2 1 3 1887 1896 4 4 1897 1906 1 1 1907 1916 1 1 1917 1926 0 1927 1936 0 1937 1946 0 1947 1956 0 1957 1966 4 4 1967 1976 1 17 4 22 1977 1986 443 105 0 548 1987 1996 13 381 342 65 801 1997 2006 4 4 2 10 Total 13 381 790 211 26 1421
Probabilistic Seismic Hazard… 125
Regional Recurrence Interval Uncertainty in size of earthquakes produced by each source zone can be described by various recurrence laws such as Gutenburg –Ritchter (G-R) relation, Mertz and Cornell(1973), Shah et al (1975) etc. In the present investigation simple and widely used G–R relation has been used to evaluate the seismic hazard parameter ‘b’. It assumes an exponential distribution of magnitude and is generally expressed as
bMaLogN −= (1)
Where ‘a’ and ‘b’ are positive, real constants. ‘a’ describes the seismic activity (log number of events with M=0) and ‘b’ which is typically close to 1 is a tectonics parameter describing the relative abundance of large to smaller shocks. For a certain range and time interval, eq. (1) will provide the number of earthquakes, (N) with magnitude, (M).
Figure 2 Earthquake events distribution map with vulnerable seismic sources in the Study area (with 350km radius)
Microzonation 126
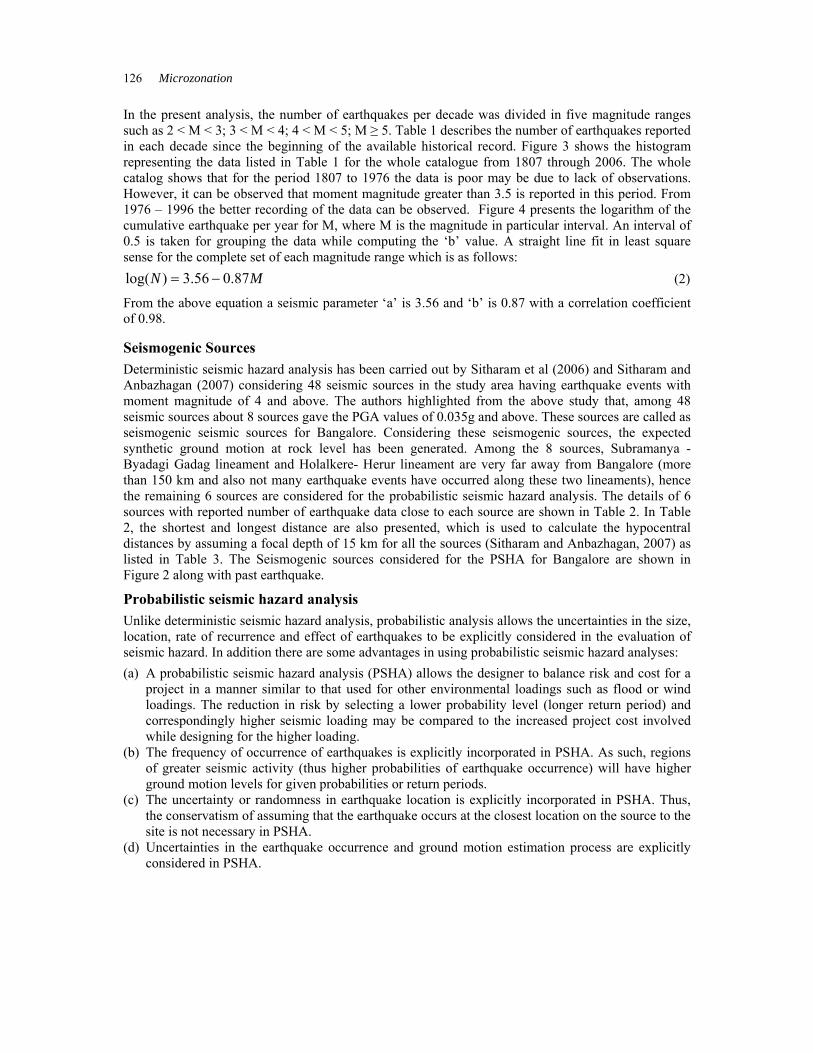
In the present analysis, the number of earthquakes per decade was divided in five magnitude ranges such as 2 < M < 3; 3 < M < 4; 4 < M < 5; M ≥ 5. Table 1 describes the number of earthquakes reported in each decade since the beginning of the available historical record. Figure 3 shows the histogram representing the data listed in Table 1 for the whole catalogue from 1807 through 2006. The whole catalog shows that for the period 1807 to 1976 the data is poor may be due to lack of observations. However, it can be observed that moment magnitude greater than 3.5 is reported in this period. From 1976 – 1996 the better recording of the data can be observed. Figure 4 presents the logarithm of the cumulative earthquake per year for M, where M is the magnitude in particular interval. An interval of 0.5 is taken for grouping the data while computing the ‘b’ value. A straight line fit in least square sense for the complete set of each magnitude range which is as follows:
MN 87.056.3)log( −= (2)
From the above equation a seismic parameter ‘a’ is 3.56 and ‘b’ is 0.87 with a correlation coefficient of 0.98.
Seismogenic Sources Deterministic seismic hazard analysis has been carried out by Sitharam et al (2006) and Sitharam and Anbazhagan (2007) considering 48 seismic sources in the study area having earthquake events with moment magnitude of 4 and above. The authors highlighted from the above study that, among 48 seismic sources about 8 sources gave the PGA values of 0.035g and above. These sources are called as seismogenic seismic sources for Bangalore. Considering these seismogenic sources, the expected synthetic ground motion at rock level has been generated. Among the 8 sources, Subramanya - Byadagi Gadag lineament and Holalkere- Herur lineament are very far away from Bangalore (more than 150 km and also not many earthquake events have occurred along these two lineaments), hence the remaining 6 sources are considered for the probabilistic seismic hazard analysis. The details of 6 sources with reported number of earthquake data close to each source are shown in Table 2. In Table 2, the shortest and longest distance are also presented, which is used to calculate the hypocentral distances by assuming a focal depth of 15 km for all the sources (Sitharam and Anbazhagan, 2007) as listed in Table 3. The Seismogenic sources considered for the PSHA for Bangalore are shown in Figure 2 along with past earthquake.
Probabilistic seismic hazard analysis Unlike deterministic seismic hazard analysis, probabilistic analysis allows the uncertainties in the size, location, rate of recurrence and effect of earthquakes to be explicitly considered in the evaluation of seismic hazard. In addition there are some advantages in using probabilistic seismic hazard analyses: (a) A probabilistic seismic hazard analysis (PSHA) allows the designer to balance risk and cost for a
project in a manner similar to that used for other environmental loadings such as flood or wind loadings. The reduction in risk by selecting a lower probability level (longer return period) and correspondingly higher seismic loading may be compared to the increased project cost involved while designing for the higher loading.
(b) The frequency of occurrence of earthquakes is explicitly incorporated in PSHA. As such, regions of greater seismic activity (thus higher probabilities of earthquake occurrence) will have higher ground motion levels for given probabilities or return periods.
(c) The uncertainty or randomness in earthquake location is explicitly incorporated in PSHA. Thus, the conservatism of assuming that the earthquake occurs at the closest location on the source to the site is not necessary in PSHA.
(d) Uncertainties in the earthquake occurrence and ground motion estimation process are explicitly considered in PSHA.

Probabilistic Seismic Hazard… 127
Tabl
e 2:
Vul
nera
ble
sour
ces c
onsi
dere
d fo
r th
e PS
HA
.
Microzonation 128
1
10
100
1000
1816 1826 1836 1846 1856 1866 1876 1886 1896 1906 1916 1926 1936 1946 1956 1966 1976 1986 1996 2006
1807 1817 1827 1837 1847 1857 1867 1877 1887 1897 1907 1917 1927 1937 1947 1957 1967 1977 1987 1997
Years
Num
ber o
f ear
thqu
akes
1<M<1.92<M<2.93<M<3.94<M<4.9>5Total
Figure 3 Histogram of earthquake data in the study area
y = -0.87x + 3.56R2 = 0.98
-2
-1.5
-1
-0.5
0
0.5
1
3 3.5 4 4.5 5 5.5 6 6.5
Magnitude (Mw)
Log
(Cum
ulat
ive
Eve
nt p
er Y
ear)
Figure 4 Frequency magnitude relationship for the study area

Probabilistic Seismic Hazard… 129
The methodology for probabilistic seismic hazard analysis used in the present investigation was one proposed by Cornell in 1986. It is assumed that the occurrence of earthquakes in a seismic source results from a Poisson process. Then the probability that a given site a ground motion parameter, Z, will exceed a specific level, z during a specified time, T, is represented by the expression
TzezZP Tz )(1)( )( νν ≤−=> − (3)
here )(zν is (mean annual rate of exceedance) the average frequency during time period T at which the level of ground motion parameters, Z, exceed level z at a given site. The function )(zν incorporates the uncertainty in time, size and location of future earthquakes and uncertainty in the level of ground motion they produce at the site. It is given by:
dmdrrmzZPmrfmfmNzr
n
N
n
m
mmnn
u
⎥⎦
⎤⎢⎣
⎡>= ∫∑ ∫
∞
== = 010 ),|()|()()()(
0
ν (4)
Where )( in mλ is the frequency of events of magnitude mi occurring on source n obtained by discretizing the earthquake recurrence relationship for source n. The estimation of uncertainity involved in magnitude, distance and peak ground acceleration are discussed below.
Magnitude uncertainty The magnitude recurrence model for a seismic source specifies the frequency of seismic events of various sizes per year. For Bangalore region, the seismic parameters are determined using Gutenberg-Richter (G-R) magnitude-frequency relationship which is given in Equation 2. The recurrence relation of each fault capable of producing earthquake magnitude in the range m0 to mu is calculated using the truncated exponential recurrence model developed by Cornel and Van Mark (1969), and it is given by the following expression:
)(
)(
0
0
0
1)()(
mm
mm
i u
eemNmN
−−
−−
−=
β
ββ for ummm <≤0 (5)
Where β =b ln (10) and Ni(m0) proposal weightage factor for particular source based on the deaggregation.
Deaggregation The recurrence relation established from the available earthquake catalogue represents the entire Bangalore region. However, PSHA have to be carried out based on the vulnerable seismogeneic sources identified. For each source, recurrence is necessary to discriminate near by sources from far-off sources and to differentiate activity rate for the different sources. Such seismic source recurrence relation is rarely known due to paucity of large amount of data accruing in historical times. An alternative is to empirically calculate the ‘b’ value from known measured slip rate of each seismic source. For the sources under consideration, no such slip rate measurements are reported. Moreover, PI earthquakes are associated with poor surface expressions of faults and hence reliable estimation of slip rates has not been yet possible (Rajendran and Rajendran, 1999; RaghuKanth and Iyengar, 2006). Hence, it is necessary to proceed on a heuristic basis invoking the principle of conservation of seismic activity. According to this, the regional seismicity measured in terms of the number of earthquakes per year with m 0m≥ , should be equal to the sum of such events occurring on individual source. Deaggregation procedure followed by Iyengar and Ghosh (2004); RaghuKanth and Iyengar (2006) for PSHA of Delhi and Mumbai (in south India) have been used here to find the weightage factor for each source based on the length (α) and number of earthquakes (χ) for the corresponding source. The

Microzonation 130
length weighting factor for the source i has been arrived from ∑=i
ii L
Lα and earthquake event
weighting factor (χi) has been taken as the ratio of the past events associated with source i to the total number of events in the region as given below:
regioninearthquakeofnumberTotalsourcecloseearthquakeofNumber
i =χ (6)
The recurrence relation of source i have been arrived by averaging both weighting and multiplying the regional recurrence relation as given below:
)()(5.0)( 00 mNmNiii χα += (7)
The weighting factors calculated for each source have considered the source length and number of events which are shown in Table 3. Finally, the probability density function (PDF) for each source has been evaluated. Typical plot of PDF versus magnitude is shown in Figure 5.
Spatial uncertainty The probability distribution for distance from the site to earthquake rupture on the source is computed conditionally on the earthquake magnitude because it is affected by the rupture size of the earthquake rupture. Thus the relative orientations of each source with respect to Bangalore become important. The shortest and longest distance from each source to city center has been evaluated from Bangalore seismotectonic map considering all the sources as line source (Sitharam and Anbazhagan, 2007). The hypocentral distance has been evaluated by considering focal depth of 15 km from the ground similar to the one used for DSHA (Sitharam et. al., 2006; Sitharam and Anbazhagan, 2007).
0.00
0.10
0.20
0.30
0.40
0.50
0.60
4.00 4.50 5.00 5.50 6.00 6.50 7.00 7.50Magnitude. M
Prob
abili
ty d
ensi
ty fu
ctio
n
Figure 5 Probability density functions of magnitude for L15

Probabilistic Seismic Hazard… 131
The conditional probability distribution function of the hypocentral distance, R for an earthquake magnitude M=m for a linear ruptured segment, is assumed to be uniformly distributed along a fault and is given by Kiureghian and Ang (1977),which is as follows:
0)|( ==< mMrRP for 2/120
2 )( LDR +< (8)
)()(
)|( 02/122
mXLLdr
mMrRP−
−−==< for
[ ]{ } 2/120
220
2 )()( mXLLDRLD −++<≤+ (9)
1)|( ==< mMrRP for [ ]{ } 2/120
2 )(mXLLDR −++> (10)
where X(m) = rupture length, km, for magnitude m given by the equation [ ]f
m LmX i ,10min)( ))(59.044.2( +−= (Wells and Coppersmith, 1994). Where Lf is the total fault length. The details of the notations used for the above expressions are details in Figure 6. The min function is used to confine the rupture to the fault length. Occasionally, the expected length of rupture, given a magnitude, will exceed the fault length for maximum magnitude estimated by techniques other than rupture length. The conditional distance probability function P(R = rj/ mi) is obtained by discretizing the cumulative distance probability relationship using a suitable step size. Typical PDF for L 15 lineament is shown in Figure 7.
Site
h
d
D
ro
L0
L
X
Rupture
Source
r
Figure 6 Schematic representation of Fault Rupture model

Microzonation 132
Ground motion prediction equation Generally ground motion prediction equation can be expressed in the following form log (y) = f (magnitude, style of faulting, distance, site) + εσ where ε is the residual of a particular ground motion measured as the difference relative to the median motion and expressed as a number of standard deviation (Bommer and Abrahamson, 2006). In the present investigation, ground motion prediction equation (for peak ground acceleration and spectral acceleration) for rock site in Peninsular India developed by RaghuKanth (2005) has been used:
( ) ( ) )ln(ln66ln 42
321 ∈+−−−+−+= RcRMcMccy (11)
Where y, M, R and ∈ refer to PGA/spectral acceleration (g), moment magnitude, hypocentral distance and error associated with the regression respectively. The coefficients in equation (11), c1, c2, c3, and c4 are obtained from RaghuKanth and Iyengar (2004) and RaghuKanth (2005).
Local Site effects It is well understood that there can be considerable variation in local site conditions and hence the surface level spectral acceleration values can be different from bed rock values. Generally local site conditions are defined in terms of shear wave velocity. Thus for a specific site, precise correction of the bedrock results will be possible only when soil section data is available including variation of Vs with depth. The widely followed method for classifying a site is the average shear wave velocity in the top 30 m of a site commonly known as V30. This parameter has been adopted by many building codes for classifying a site for purposes of incorporating local site conditions in the estimation of design ground motion. This site classification according to NEHRP-USA (BSSC) 20 is shown in Table 4.
0
0.01
0.02
0.03
0 20 40 60 80 100 120
Distance
Prob
abili
ty D
ensi
ty F
uctio
n
Figure 7 Typical PDF for the source L15

Probabilistic Seismic Hazard… 133
Table 4 Definition of NEHRP site categories
Site class Range of V30 (km/s) A V30 > 1.5 B 0.76 < V30 ≤1.5 C 0.36 < V30 ≤0.76 D 0.18 < V30 ≤0.36 E, F V30 ≤ 0.18
From the extensive field investigation carried out using MASW survey (at 58 locations in the study area) it has also been observed that the shear wave velocity for the Bangalore region falls in the range of 0.18 km/sec ≤ Vs ≤ 0.36 km/sec (Site Class D). Keeping this in mind surface level response spectrum has been developed considering Bangalore is Class D region. Results of eq. (11) are modified for local site condition for class D (RaghuKanth, 2005): ys = ybr Fs and ln(Fs) = a1ybr + a2 + ln δs where a1 and a2 are regression coefficients and δs is the error term corresponding to site classification s= D. These coefficients along with the standard deviation the error σ (lnδs) (Table 5) were obtained from RaghuKanth (2005).
Table 5: Site Coefficients for composite Peninsular India
FD Period Sec. a1 a2 σ (ln ? D )
0 -2.61 0.80 0.36 0.01 -2.62 0.80 0.37 0.015 -2.62 0.69 0.37 0.02 -2.61 0.55 0.34 0.03 -2.54 0.42 0.31 0.04 -2.44 0.58 0.31 0.05 -2.34 0.65 0.29 0.06 -2.78 0.83 0.29 0.075 -2.32 0.93 0.19 0.09 -2.27 1.04 0.29 0.10 -2.25 1.12 0.19 0.15 -2.38 1.40 0.28 0.20 -2.32 1.57 0.19 0.30 -1.81 1.56 0.16 0.40 -1.28 1.43 0.16 0.50 -0.69 1.34 0.21 0.60 -0.56 1.32 0.21 0.70 -0.42 1.29 0.21 0.75 -0.36 1.28 0.19 0.80 -0.18 1.27 0.21 0.90 0.17 1.25 0.21 1.00 0.53 1.23 0.15 1.20 0.77 1.14 0.17 1.50 1.13 1.01 0.17 2.00 0.61 0.79 0.15 2.50 0.37 0.68 0.15 3.00 0.13 0.60 0.13 4.00 0.12 0.44 0.15

Microzonation 134
Results and discussions The primary output from a PSHA is a hazard curve showing the variation of a selected ground-motion parameter, such as peak ground acceleration (PGA) or spectral acceleration (SA), against the annual frequency of exceedance (or its reciprocal, return period). The mean annual rate of exceedance has been calculated for six seismogenic sources separately and summation of these representing the cumulative hazard curves. For the purpose of the analysis a computer program has been developed based on the methodology as detailed by Cornell (1968) and Kramer (1996). Figure 8 presents the variation of mean annual rate of exceedance with peak ground acceleration for all sources at rock level. This clearly highlights that the sources close to Bangalore produce more hazard when compared to the source far away from Bangalore.
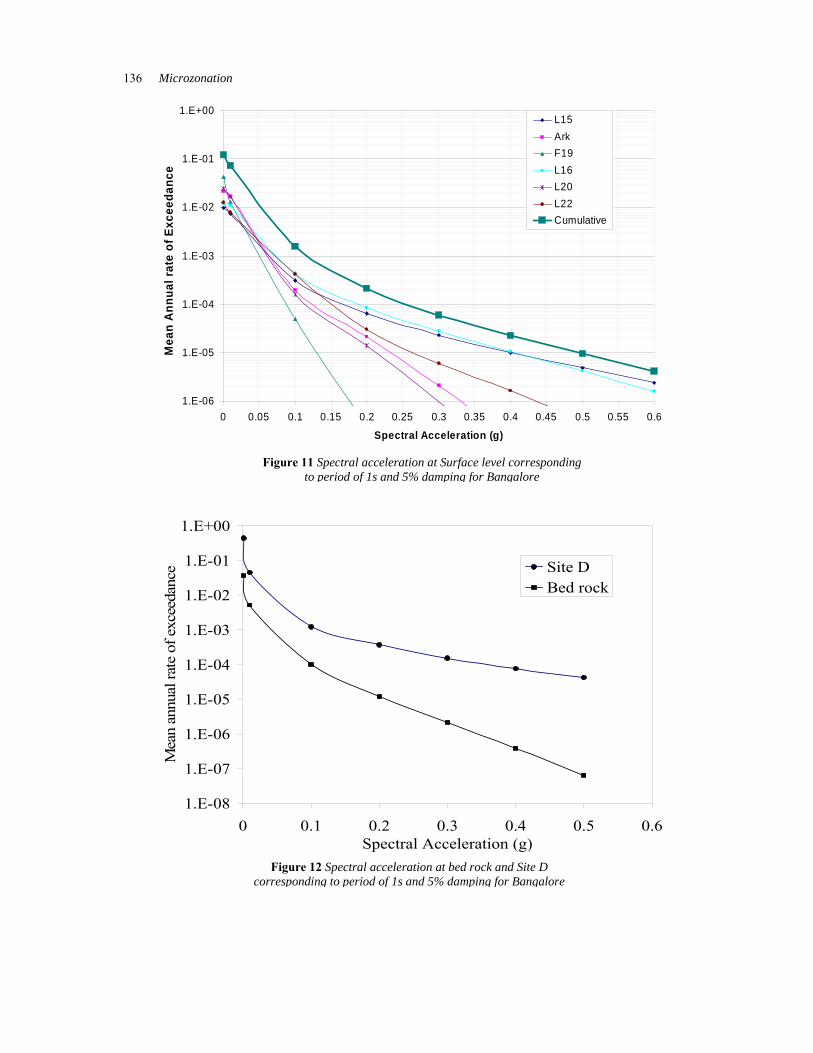
Even though PGA is used to characterize the ground motion, the spectral acceleration is generally used for design of engineering structures. Figure 9 presents the plot of cumulative mean annual rate of exceedance versus spectral acceleration for period of 1s and 5% damping (represented as hazard curve). For the design of structures, a uniform hazard response spectrum (UHRS) / equivalent hazard spectrum is used. UHRS is developed from a probabilistic ground motion analysis that has an equal probability of being exceeded at each period of vibration. Figure 10 shows the UHRS (with damping of 5%) at rock level for 10% probability of exceedance in 50 years. The zero-period spectral acceleration (ZPA = PGA) evaluated in this study (0.121g) is comparable with the value obtained in deterministic approach (0.136) by Sitharam et al, (2006) and Sitharam and Anbazhagan (2007). Figure 11 shows the mean spectral acceleration mean annual rate of exceedance versus spectral acceleration for a period of 1s and 5% damping considering the Site class D. From Figure 10 and 11 it is very clear that the spectral acceleration from each source due to the local soil condition get modified (increased), resulting that increasing in the cumulative spectral acceleration.
Figure 8 Hazard curves for different at rock level for Bangalore
1.0E-06
1.0E-05
1.0E-04
1.0E-03
1.0E-02
1.0E-01
1.0E+00
0 0.05 0.1 0.15 0.2 0.25 0.3 0.35 0.4 0.45 0.5 0.55 0.6Peak Ground Acceleration (g)
Mea
n A
nnua
l rat
e of
Exc
eeda
nce
L15F47F19L16L20L22Cumulative

Probabilistic Seismic Hazard… 135
1.E-08
1.E-07
1.E-06
1.E-05
1.E-04
1.E-03
1.E-02
1.E-01
1.E+00
0 0.1 0.2 0.3 0.4 0.5 0.6
Spectral Aceeleration (g)
Mea
n A
nuua
l rat
e of
Exc
eeda
nce F47
L15L16F19L20L22Cumulative
Figure 9 Spectral acceleration at rock level corresponding to period of 1s and 5% damping for Bangalore
00.05
0.10.15
0.20.25
0.30.35
0.40.45
0 0.2 0.4 0.6 0.8 1 1.2 1.4 1.6 1.8 2
period (sec)
Spec
tral
acc
eler
atio
n (g
)
Figure 10 Uniform Hazard Response Spectrum at rock level with 10% probability of exceedance in 50 years (5% damping) for Bangalore
Microzonation 136
Figure 11 Spectral acceleration at Surface level corresponding to period of 1s and 5% damping for Bangalore
1.E-06
1.E-05
1.E-04
1.E-03
1.E-02
1.E-01
1.E+00
0 0.05 0.1 0.15 0.2 0.25 0.3 0.35 0.4 0.45 0.5 0.55 0.6
Spectral Acceleration (g)
Mea
n A
nnua
l rat
e of
Exc
eeda
nce
L15ArkF19L16L20L22Cumulative
1.E-08
1.E-07
1.E-06
1.E-05
1.E-04
1.E-03
1.E-02
1.E-01
1.E+00
0 0.1 0.2 0.3 0.4 0.5 0.6Spectral Acceleration (g)
Mea
n an
nual
rate
of e
xcee
danc
e Site DBed rock
Figure 12 Spectral acceleration at bed rock and Site D corresponding to period of 1s and 5% damping for Bangalore

Probabilistic Seismic Hazard… 137
Figure 12 presents the variation of mean annual rate of exceedance versus cumulative spectral acceleration for a period of 1s and 5% damping for rock and site class D. Figure 13 presents the plot of UHRS for 10% probability of exceedance in 50 years considering local site conditions. A value of PGA (ZPA = PGA) 0.35g is obtained when local site effect is taken into account. The observed PGA value at considering the local soil conditions is higher than bed rock level, shows the considerable seismic wave modification (increasing) due to local soil condition.
Conclusions In this paper the results of probabilistic seismic hazard analysis of Bangalore, South India with an emphasis on the local site condition has been presented. Analyses have been carried out using the data collected over a radius of 350 km around Bangalore City. The seismic hazard parameter ‘b’ value was estimated to be 0.87 from G-R relationship. Further, the probabilistic seismic hazard analysis for Bangalore city has been carried out using the regional recurrence relation with appropriate deaggregation weighting factors for the seismogenic sources. The curves of mean annual rate of exceedance for peak ground acceleration and spectral acceleration have also been generated at rock level and taking into account of the local site condition. Further, the uniform hazard response spectrum at rock level with 5% damping for Bangalore has been generated for 10% probability of exceedance in 50 years. The peak ground acceleration (PGA) value of 0.121g at rock level and value of 0.35g was obtained considering local soil conditions. The spectral acceleration values obtained considering the local soil conditions are higher than that observed from the bed rock level spectral acceleration for Bangalore region. Acknowledgements Authors thank the Department of Science and Technology (DST), Seismology Division, Govt. of India for funding the project “Seismic microzonation of Bangalore” (Ref no.DST/23(315)/SU/2002 Dated October 2003). ISRO-IISc Space Technology Cell, Indian Institute of Science, Bangalore, India for funding the project titled “Use of remote sensing and GIS for Seismic Hazard Analyses of southern India, (Ref. No. ISTC/CCE/TGS/195/2007 dated 07 March 2007).
0
0.1
0.2
0.3
0.4
0.5
0.6
0 0.5 1 1.5 2
period (s)
Spec
tral
Acc
eler
atio
n (g
)
Bed rockSite Class D
Figure 13: Uniform Hazard Response Spectrum for bed rock and Site D with 10% probability of exceedance in 50 years (5% damping) for Bangalore

Microzonation 138
References 1. Arora, S. K.: A study of the Earth's crust near Gauribidanur in southern India, Bull. Seism. Soc.
Am. 61,671 –683, 1971. 2. Bilham, R. (2004); Earthquakes in India and the Himalaya: tectonics, geodesy and history, Annals
of Geophysics, 47(2), 839-858. 3. Chandra U. (1977); Earthquakes of Peninsular India: a seismotectonic study, Bull. Seism. Soc.
Am. 65, 1387-1413. 4. Cornell, C. A. and Van Marke, E. H.: The major influence on seismic risk, Proceedings of the
Third Conference on Earthquake Engineering, Vol. A-1, Santiago, Chile, pp. 69–93, 1969. 5. Cornell, C. A.: Engineering seismic risk analysis, Bull. Seismol. Soc. Am. 58, 1583–1606, 1968. 6. Ganesha Raj, K.: Major Lineaments of Karnataka and their significance with respect to Seismicity
– Remote sensing based analysis, Ph.D. Thesis, Gulbarga University, Karnataka, India, 2001. 7. Ganesha Raj. K and Nijagunappa, R.: Major Lineaments of Karnataka State and their Relation to
Seismicity: Remote Sensing Based Analysis, Jr.Geol.Soc.India Vol.63, pp.430-439, 2004. 8. Heaton, T. F. Tajima and A.W.Mori.: Estimating Ground motions using recorded Accelerogram,
Surveys in Geophysics, 8, 25-83, 1986. 9. IS 1893 (part 1): Criteria for Earthquake Resistant Design of Structure, Bureau of Indian
standards, New Delhi, 2002. 10. Iyengar, R. N. and Ghosh, S., Microzonation of earthquake hazard in greater Delhi area. Curr.
Sci., 87, 1193–1202, 2004. 11. Iyengar, R.N and Raghu Kanth, S. T. G.: Attenuation of Strong Ground Motion in Peninsular
India, Seismological Research Letters, 75, 4, 530-540, 2004. 12. Kaila K. L. Gaur V. K. Harinarain: Quantitative seismicity maps of India, Bull. Seism. Soc. Am.
62, 1119-1131, 1972. 13. Khattri, K.N.: Seismic Hazard in Indian region, Current science, Vol. 62 No 1&2, 109-116, 1992 14. Kiureghian. D, A., and A. H.-S. Ang.: A fault-rupture model for seismic risk analysis. Bull.
Seism. Soc. Am., 67(4): 1173-1194, 1977. 15. Kramer. S. L. (1996) “Geotechnical Earthquake Engineering “, Published by Pearson Education
Ptd Ltd. 16. Krishna, V. G., and D. S. Ramesh.: Propagation of crustal-waveguide-trapped Pg and seismic
velocity structure in the South Indian Shield, Bull. Seism. Soc. Am.90 ,1281 –1294, 2000. 17. Mertz, H. A and Cornell, C. A.: Seismic risk based on a quadratic magnitude – frequency law,
Bull. Seism. Soc. Am., 73(6), 1949– 2006, 1973 18. Parvez. A.I, Franco Vaccari and PanzaOctober, G. F.: A deterministic seismic hazard map of India
and adjacent areas, Geophysical Journal International, 155,489–508, 2003. 19. Purnachandra Rao, N.: Single station moment tensor inversion for focal mechanisms of Indian
intra-plate earthquakes, Current Science, 77, 1184-1189, 1999. 20. Raghu Kanth, S. T. G. and Iyengar, R.N.: Seismic hazard estimation for Mumbai city, Current
Science, Vol. 91, No. 11, 1486-1494, 2006. 21. Raghu Kanth, S. T. G.: Engineering Models for Earthquake Sources, Ph D Thesis, Indian Institute
of Science, Bangalore India, 2005. 22. Rajendran, K. and Rajendran, C. P., Seismogenesis in the stable continental interiors: an appraisal
based on two examples from India. Tectonophysics, 305, 355–370, 1999. 23. Ram, A. and H. S. Rathor.: On frequency magnitude and energy of significant Indian earthquakes,
Pure Appl. Geophys. 79, 26-32, 1970, 24. Ramalingeswara Rao, B.: Historical Seismicity and deformation rates in the Indian Peninsular
Shield, Journal of Seismology, 4, 247-258, 2000. 25. Ramalingeswara Rao. B. and Sitapathi Rao,P.: Historical seismicity of Peninsular India Bulletin
of the Seismological Society of America, vol.74: 2519 – 2533, 1984.

Probabilistic Seismic Hazard… 139
26. Seismotectonic Atlas of India-(2000); published by Geological Survey of India. 27. Shah, H. C, Mortgat, C. P, Kiremidjian, A. S. and Zsutty, T. C.: A study of seismic risk for
Nicaragua, Part I, “Report II, The John A Blume Earthquake Engineering Centre, Stanford, California, 1975.
28. Sitharam, T. G. and Anbazhagan, P., “Seismic Hazard Analysis for Bangalore Region,” Journal of Natural Hazards, 40: 261–278, 2007.
29. Sitharam, T. G., Anbazhagan, P. and Ganesha Raj, K.: “Use of remote sensing and seismotectonic parameters for seismic hazard analysis of Bangalore”, Nat. Hazards Earth Syst. Sci., 6, 927–939, 2006.
30. Sridevi Jade.: Estimation of plate velocity and crustal deformation in the Indian subcontinent using GPS geodesy, Current Science, 86, 1443-1448, 2004.
31. Srinivasan, R. and Sreenivas, B.L.: Some new geological features from the Landsat imagery of Karnataka, Jour. Geol. Soc. India, 18, 589-597, 1977.
32. Subrahmanya, K. R. Deformation related lineaments in the Indian Peninsula near 130, Journal of Geophysics, XXIII-2, 59-68, 2002
33. Subrahmanya, K. R.: Active intraplate deformation in south India, Tectonophysics, 262, 231-241, 1996.
34. Tandon, A.N.: Seimology in India –an Overview up to 1970, Current science, Vol. 62 No 1&2, 9-16, 1992.
35. Tseng, T. L., and Chen, W.P: “Probing the Southern Indian Shield with P-Wave Receiver-Function Profiles”, Bulletin of the Seismological Society of America; February 2006; v. 96; no. 1; p. 328-333, 2006.
36. Valdiya, K.S.: Late Quaternary Movements and Landscape Rejuvenation in South-eastern Karnataka and Adjoining Tamil Nadu in Southern India Shield, Journal of Geological Society of India, India, 51, 139-166, Feb.1998.
37. Wells, D. L. and Coppersmith, K. J.: New empirical relationships among magnitude, rupture length, rupture width, rupture area, and surface displacement, Bull. Seism. Soc. Am., 4(84), 975– 1002, 1994.