probabilistic accident consequence uncertainty … de...the objective of this exercise is to develop...
TRANSCRIPT
EUR-18821 FZKA 6307 ISBN 92-894-2084-7 European Communities, 2001 Probabilistic Accident Consequence Uncertainty Assessment: Countermeasures Uncertainty Assessment Report status: Approved by NRPB Prepared by: L H J Goossens Delft University of Technology The Netherlands J A Jones National Radiological Protection Board UK J Ehrhardt Forschungszentrum Karlsruhe GmbH Germany B C P Kraan Delft University of Technology The Netherlands R M Cooke Delft University of Technology The Netherlands
1

ABSTRACT Accident consequence assessment codes are used to evaluate the risks of hypothetical accidents at nuclear plants, allowing for the range of atmospheric conditions that could occur at the time of the accident. The codes include an allowance for the effect of countermeasures, such as sheltering, evacuation and stable iodine tablets, in reducing doses following such accidents. Uncertainty analyses have been undertaken on various aspects of the predictions of such codes. This report describes a project to use expert judgement to determine distributions on the values of some of the parameters used in the countermeasures modules of accident consequence assessment codes. The distributions obtained are appropriate for use only in such calculations and should not be used for emergency response in the event of an accident. In the codes countermeasures are taken once calculated doses are above preset intervention levels (doses defined by international bodies such as the IAEA). Whether in real situations emergency managers will act accordingly is hard to predict. Uncertainties associated with these decisions are termed “volitional” uncertainties. These uncertainties, however, cannot be assessed by expert judgements as they express the decision at stake in an emergency situation. Uncertainties on the times to implement countermeasures and on the times for the general population to respond to these measures can be assessed by experts, as they represent “lack-of-knowledge” uncertainties. This paper will describe the difference in approach of both types of uncertainties and will show the results of aggregating expert judgements on the latter type of uncertainties in early countermeasures strategies. Ten experts from seven European countries provided subjective assessments.
2

FOREWORD This report is part of a series of reports that summarises the results of the expert judgement study on countermeasures variables as part of a broader study on the uncertainty analysis of the computer package COSYMA, executed under the Fourth Framework Program of the European Commission. This report is published as EUR 18821 as part of the series of reports: EUR 18820 up to EUR 18827. This report also relates to a series of expert judgement studies performed under the Third Framework Program of the European Commission, dealing with the physical phenomena in the COSYMA computer package: atmospheric dispersion and deposition (EUR 15855/15856), food chain (EUR 16771), deposited material and external doses (EUR 16772), internal dosimetry (EUR 16773), late health effects (EUR 16774) and early health effects (EUR 16775). The authors would like to acknowledge all the participants in the expert judgement elicitation process, in particular the pre-panel expert panel members and the expert elicitation panel members. While the project staff organised the process, processed the results, and wrote and edited the report, the experts provided the technical context that is the foundation of this report. The authors would also like to express their thanks for the support and fruitful remarks of Dr. G.N. Kelly (EC/DG XII).
3

CONTENTS Abstract 2 Foreword 3 Contents 4 CHAPTER 1. BACKGROUND TO THE STUDY 1.1 Introduction 5 1.2 Objectives 6 1.3 Structure of document 6 1.4 References 6 CHAPTER 2. TECHNICAL ISSUES CONSIDERED RELEVANT 2.1 Introduction 8 2.2 Types of uncertainty 9 2.3 Use of uncertainty analyses for decision making 10 2.4 Brief description of countermeasures models used in COSYMA 11 2.5 Selection of variables for presentation to formal expert elicitation panel 12 2.6 Formal expert judgement method 12 2.7 Scope of analysis 12 2.8 References 13 CHAPTER 3. SUMMARY OF EXPERT ELICITATION METHOD
FOR THE COUNTERMEASURES PANEL 3.1 Introduction 17 3.2 Definition of elicitation variables and case structures 17 3.3 Expertise required for the elicitation process 23 3.4 Expert elicitation 25 3.5 Mathematical processing of elicited distributions 27 3.6 References 29 CHAPTER 4. RESULTS AND ANALYSIS 4.1 Introduction 31 4.2 Summary of elicitation meetings 31 4.3 Summary of individual expert assessments 31 4.4 Summary of aggregated results 37 4.5 Comparison of results from current risk study with code-calculated values 38 CHAPTER 5. SUMMARY AND CONCLUSIONS 5.1 Project accomplishments 77 5.2 Uncertainty included in distributions 77 5.3 Application of distributions 78 5.4 Conclusions 78 Appendices 79
4

CHAPTER 1. BACKGROUND TO THE STUDY 1.1 Introduction Under the Third Framework Program of the European Union the EC/USNRC Joint Study1,2 was initiated to further develop and apply expert judgement elicitation techniques to estimate the uncertainties associated with the predictions of probabilistic accident consequence assessment (ACA) codes. The uncertainties in the various aspects of consequence assessment modelling were considered separately by several expert panels. These panels were formed jointly with scientists from Europe and from the United States of America. Under the EC Fourth Framework Programme on Nuclear Fission Research a further study was conducted on the quantification of the uncertainty of some aspects of implementing countermeasures whereby experts were invited to participate in a formal expert judgement procedure on the organisational and behavioural aspects of people in relation to possible emergency actions. This report presents the results and findings of the expert panel considering "countermeasures". The development of two new probabilistic accident consequence codes – COSYMA3 in the European Union (EU) and MACCS4 in the US - was completed in 1990, and both codes have been distributed to a large number of potential users. These codes have been developed to enable estimates to be made of the risks presented by nuclear installations, based on the postulated frequencies and magnitudes of potential accidents. These risk estimates provide one of a number of inputs into judgements on risk acceptability and areas where further reductions in risk might be achieved at reasonable cost. They also enable comparisons to be made with quantitative safety objectives. Knowledge of the uncertainty associated with these risk estimates has an important role in the effective prioritisation and allocation of risk and the appropriate use of the results of risk assessments in regulatory activities. Originally all countermeasures were to be considered in this panel. The decision was made to not consider late countermeasures and to restrict the early countermeasures to sheltering, evacuation, the intake of stable iodine tablets, and driving times. As discussed later in this report, uncertainties in countermeasures variables come partly from considerations made by emergency managers in real time emergency situations; they are difficult, if not impossible, to elicit from experts. For that reason, the emphasis of the elicitations made lies in assessing cognitive (and stochastic) uncertainties. This is part of a project designed to assess the uncertainty in the COSYMA and MACCS offsite radiological consequence calculations for hypothetical nuclear power plant accidents. The first exercise under this project performed uncertainty assessments for models in ACA codes, covering atmospheric dispersion and deposition modelling5, food chain6 and external dose7 calculations, important parameters in the internal dosimetry8 models, and in the early9 and late somatic10 health effects coefficients. The elicited distributions have been used in consequence uncertainty analyses using the COSYMA and MACCS consequence codes. The uncertainty analyses performed for the COSYMA software package are reported in EUR-1882611 and in the special Issue2 of the Workshops. As the countermeasures strategies applied in Europe and in the US differ it was decided to perform separate expert judgement studies on both sides of the Atlantic Ocean. This report provides the results of the countermeasures expert panel for COSYMA.
5
1.2 Objectives The overall aim of the Study is to assess the uncertainties associated with consequence calculations for accidental releases of radio-nuclides from commercial nuclear power plants. The objective of this exercise is to develop a library of uncertainty distributions that can be used for uncertainty studies, and for deriving default values in current accident consequence codes. The behavioural aspects modelled in consequence assessment codes, when applied for European studies, are identical even though the "models" representing the aspects may be different in each code. One of the guiding principles of this expert elicitation exercise is that the experts should be asked to respond only to questions about physically measurable or observable quantities, even though the actual measurement of these quantities may be impractical due to resource constraints. Therefore the experts will not be expected to answer questions on the mathematical models themselves, to which they may not be able to easily relate, particularly when the models have been derived empirically. The advantages of this approach are that all (European) consequence programs may make use of the information derived from the elicitation questions posed to the experts, since they are somewhat divorced from the basic modelling. The disadvantage, however, is that the uncertainty distributions suggested by the experts may have to be processed in order to derive the distributions for those model parameters used within a particular program. 1.3 Structure of Document This report summarises the achievements of the countermeasures expert panel. Chapter 2 of this report provides a discussion of the technical issues that were considered prior to the actual expert elicitation process. Chapter 2 also provides a short characterisation of consequence uncertainty studies, briefly describes why uncertainty information is necessary for decision making, summarises the COSYMA code, describes the process used for selecting the variables that were assessed, explains why formal expert elicitation methods were chosen, and delineates the scope of the project. Chapter 3 summarises the methods used for acquiring the distributions for the elicitation variables and the processing of the distributions into aggregated distributions usable for uncertainty analyses in accident consequence codes, such as COSYMA. Results are summarised in Chapter 4, and conclusions are presented in Chapter 5. This report also contains technical appendices. Appendix A presents a summary of the COSYMA accident consequence code. The case structure document and the elicitation questionnaire are provided in Appendix B. The rationales provided by the experts and the raw (unprocessed) data received from the experts are provided in Appendix C. Brief biographies of the experts are presented in Appendix D. Appendix E contains the aggregated responses of the expert panel as a whole. 1.4 References 1. Goossens L.H.J. & F.T. Harper, 1998. Joint EC/USNRC expert judgement driven
radiological protection uncertainty analysis. Journal of Radiological Protection 18(4):249-264.
6

2. Goossens, L.H.J. and Kelly, G.N. Expert judgement and accident consequence uncertainty analysis (COSYMA). Special Issue of Radiation Protection Dosimetry, 2000 Vol. 90, No. 3
3. Kelly GN. COSYMA: A new programme package for accident consequence assessment. Report EUR 13028, Luxembourg, 1991
4. Chanin DI, Sprung JL, Ritchie LT, Jow H-N. MELCOR Accident Consequence Code System (MACCS): User's Guide. Report NUREG/CR-4691, Albuquerque/NM/USA, 1990
5. Harper FT, Goossens LHJ, Cooke RM, Hora SC, Young ML, Päsler-Sauer J, Miller LA, Kraan BCP, Lui C, McKay MD, Helton JC, Jones JA. Probabilistic accident consequence uncertainty analysis: Dispersion and deposition uncertainty assessment. Report NUREG/CR-6244, EUR 15855, Washington,DC/USA, and Brussels-Luxembourg, 1995
6. Brown J, Goossens LHJ, Harper FT, Kraan BCP, Haskin FE, Abbott ML, Cooke RM, Young ML, Jones JA, Hora SC, Rood A, Randall J. Probabilistic accident consequence uncertainty analysis: Food chain uncertainty assessment, Report NUREG/CR-6523, EUR 16771, Washington,DC/USA, and Brussels-Luxembourg, 1997
7. Goossens LHJ, Boardman J, Harper FT, Kraan BCP, Cooke RM, Young ML, Jones JA, Hora SC. Probabilistic accident consequence uncertainty analysis: External exposure from deposited material uncertainty assessment, Report NUREG/CR-6526, EUR 16772, Washington,DC/USA, and Brussels-Luxembourg, 1997
8. Goossens LHJ, Harrison JD, Harper FT, Kraan BCP, Cooke RM, Hora SC. Probabilistic accident consequence uncertainty analysis: Internal dosimetry uncertainty assessment, Report NUREG/CR-6571, EUR 16773, Washington,DC/USA, and Brussels-Luxembourg, 1998
9. Haskin FE, Harper FT, Goossens LHJ, Kraan BCP, Grupa JB, Randall J. Probabilistic accident consequence uncertainty analysis: Early health effects uncertainty assessment, Report NUREG/CR-6545, EUR 16775, Washington,DC/USA, and Brussels-Luxembourg, 1997
10. Little M, Muirhead C, Goossens LHJ, Harper FT, Kraan BCP, Cooke RM, Hora SC. Probabilistic accident consequence uncertainty analysis: Late (somatic) health effects uncertainty assessment, Report NUREG/CR-6555, EUR 16774, Washington,DC/USA, and Brussels-Luxembourg, 1997
11. Jones JA, Ehrhardt J, Goossens LHJ, Brown J, Cooke RM, Fischer F, Hasemann I and Kraan BCP, Probabilistic accident consequence uncertainty assessment using COSYMA: Overall uncertainty analysis, Report EUR 18826, Brussels-Luxembourg, to be published in 2000
7

CHAPTER 2. TECHNICAL ISSUES CONSIDERED RELEVANT 2.1 Introduction Uncertainty analysis was introduced into a broad decision-making context with the Reactor Safety Study (WASH-1400)1. Although the techniques have undergone considerable development since this study, the essentials have remained unchanged. The intent of uncertainty analysis is to quantify the uncertainty in the output of quantitative decision support modelling in order to provide the decision maker with a measure of how robust or accurate the conclusions are, based on the model. To accomplish this, a joint distribution is placed on the parameters of models and propagated through the model to yield distributions on the model's output. Uncertainty analysis is typically performed in situations in which the uncertainties in model predictions have the potential to significantly impact on the decision-making process and "stakeholders" have differing interests and perceptions of the risks and benefits of possible decisions. There is no formula dictating how the results of quantitative models should be used to support such decision making; hence, there can be no formula for the use of uncertainty analyses either. Rather, uncertainty analysis provides a tool with which stakeholders can better express their pros and cons. In this sense, uncertainty analysis can contribute to a rational discussion of proposed courses of action. As a collateral benefit, uncertainty analysis provides a perspective for assessing the quality of the quantitative decision-support modelling and can help direct resources for reducing uncertainties in future. Uncertainty analyses using expert elicitation techniques have primarily been done for the Level 1 (core damage frequency assessment) and Level 2 (assessment of radio-nuclides transport from the melt to the environment) portions of risk assessment. For the Level 3 (consequence analysis) portion of the risk assessments uncertainty/sensitivity analyses have primarily consisted of studies in which the uncertainty distributions of the code input parameters are provided by code developers and not by experts in the many different scientific fields of interest. The formal use of expert judgement has the potential to circumvent this problem. Although the use of expert judgement is common in the resolution of complex problems, it is most often used informally and rarely made explicit. The use of a formal expert judgement process has the benefits of an improved expression of uncertainty, greater clarity and consistency of judgements, and an analysis that is more open to scrutiny. Formalised expert elicitation methods have also been used for other applications. For a short overview see Harper et al2 and Goossens et al3
In terms of probabilistic nuclear accident consequence analyses, formal expert elicitation methods were used extensively in the assessment of core damage frequency and radio-nuclide transport from the reactor to the environment in the NUREG-11504 study of the risks of reactor operation. Their use was not without criticism or difficulties, but it was judged by a special review committee5 to be preferable to the current alternative (i.e., risk analysts making informal judgements). Within the EC, formal expert judgement has found increasing use in recent years. A pilot study6 in which the techniques were applied to the atmospheric dispersion and deposition module of the COSYMA code acted as a forerunner of the first phase of the current project.
8

This chapter briefly summarises the types of uncertainty, and briefly describes the need of uncertainty analyses for decision making, and it sketches the methods and issues that arise in carrying out an uncertainty analysis for accident consequence models. 2.2 Types of Uncertainty The NRC Probabilistic Risk Analysis (PRA) Working Group7 had defined two types of uncertainty which may be present in any calculation. These are (1) stochastic uncertainty caused by the natural variability in a parameter and (2) state-of-knowledge uncertainty, which results from a lack of complete information about phenomena. The latter may be further divided into (1) parameter uncertainty, which results from a lack of knowledge about the correct inputs to analytical models; (2) model uncertainty, which is a result of the fact that perfect models cannot be constructed, and (3) completeness uncertainty, which refers to the uncertainty as to whether all the significant phenomena and relationships have been considered. Parameter uncertainty arises because we rarely know with certainty the correct value of the code input parameters. Moreover, this lack of knowledge contributes also to modelling uncertainty. Models of physical processes generally have many underlying assumptions and are not valid for all cases. Alternative models are proposed by different analysts. Completeness uncertainty is similar to modelling uncertainty, but occurs in the stage of adequate identification of the physical phenomena. A common method of uncertainty analysis is based on the propagation of a distribution over an input parameter, rather than a point value for a parameter. In the past, distributions over code input parameters have typically been provided by code developers with informal guidance from phenomenological experts in the appropriate field. The resulting distribution over the model output provides insight regarding the impact of input parameter uncertainty on model predictions. In particular in the countermeasures modules of codes, the target variables1 are not only of a physical nature, but are (fully or partly) determined by decision making in emergency circumstances or by political considerations. In the project three types of uncertainties are distinguished: stochastic uncertainty caused by non-deterministic physical processes, cognitive uncertainty caused by lack of information regarding intrinsically deterministic processes, and volitional uncertainty caused by lack of knowledge regarding what one wants or intends to do. Of these, stochastic and cognitive uncertainties can be measured and (in principle) be observed in the real world, and can thus be represented as subjective probability. Target variables can be phrased in the form of unambiguous elicitation variables2. The volitional uncertainty cannot be represented straightforwardly as subjective probability. The reason for this is that subjective probability is operationalised as "willingness to wager". In wagering on one's own volition, the volition is obviously influenced by the stake of the wager itself. This makes it impossible to speak of a degree of belief with regard to intentions and volitions, independent of the method of measurement. Although willingness to wager can be regarded an observable quantity, it is related to one’s own decisions which means it influences the decision maker's behaviour. For that reason one cannot apply expert judgement to acquire information on volitional uncertainties. 1 Target variables are model parameters for which uncertainty distributions must be generated. 2 Elicitation variables are observable quantities those for which experts can provide distributions.
9

Uncertainties on parameter values which are fully volitional cannot be adequately assessed by people with expertise in the behaviour of emergency managers. Uncertainties on parameter values which are partly cognitive can be assessed by (emergency response) experts who are able to assess the behaviour of large populations or organisations adequately. In essence, these parameters are not determined by emergency managers' decisions, and need to be addressed by the expert panel. Two issues apart from behavioural aspects are relevant with respect to emergency actions. The first issue concerns any procedural aspects prior to making a decision on, e.g., whether or not to evacuate. Procedural aspects might be measurements in the field. The second issue concerns operational aspects after the decision to implement an emergency action is made. E.g., in cases of evacuations, it takes time for emergency workers to enter the affected area with the necessary equipment. The time required to drive out of the affected area can be considered to have operational aspects as well. The uncertainty on the decision making aspects is volitional, but the uncertainties on procedural and operational aspects are only partly volitional and partly of a stochastic/cognitive nature. 2.3 Use of Uncertainty Analyses for Decision Making The Main Report2 on the atmospheric dispersion and deposition elicitation exercise briefly describes the history of consequence uncertainty analyses. The US and European developments are sketched and summarised as lessons learned from the past. The use of uncertainty analyses in decision making processes is required when: * decision making is supported by quantitative model(s), * the modelling is associated with potentially large uncertainties, * the consequences predicted by models are associated with utilities and disutilities in a
non-linear way (like threshold effects), * the choice between alternative courses of action might change as different plausible
scenarios are fed into the quantitative models, and * the scenarios of concern are low probability, high consequence events. In a regulatory context, which is one typical decision making process, the full decision problem is not dealt with. The regulatory authority is typically charged with regulating the risks from one type of activity. The choice between alternatives is made at a different level, where the trade-off of utilities against disutilities of different stakeholders is factored in. It is, nonetheless, incumbent upon the regulatory authority to provide such information as is deemed necessary for responsible decision making. Nuclear regulatory agencies have pioneered the use of uncertainty analysis and continue to set the standards in this field. Accident consequence codes compute many quantities of interest (or "endpoints") including time-varying radiation levels over a large spatial grid, numbers of acute and chronic fatalities, number of persons evacuated, amount of land denied, economic and environmental damages. In
10

the point value mode of calculation, the consequence codes compute distributions over these quantities resulting from uncertainty in meteorological conditions at the time of the accident. In performing a full scope uncertainty analysis, distributions over code parameters other than weather parameters are generated for each quantity. The question of how best to compress the information into a form that can be used by decision makers receives considerable attention. In some applications of the information, it may be important for the decision maker to distinguish statistical uncertainty resulting from variation in meteorological conditions or other sources from state-of-knowledge uncertainty over code parameters. Stochastic uncertainty is here to stay, whereas state-of-knowledge uncertainty may change as knowledge grows; distinguishing between the stochastic and state-of-knowledge uncertainty could be helpful in research prioritisation. For allocating future research resources, it is important to know the contribution of each parameter's uncertainty to the overall uncertainty and to identify those parameters for which uncertainty can be significantly reduced by future research efforts. 2.4 Brief Description of Countermeasures Models Used in COSYMA The program package COSYMA comprises a series of programs and data libraries for accident consequence assessments. It is structured in three principle subsystems, each of which is an ACA program for one specific area of application within an overall analysis. The applications of the different ACA programs, designated the NE, NL and FL subsystems of COSYMA8 (where the first letter refers to near or far distance and the second to early or late health effects and the appropriate emergency actions), are illustrated in Figure 2.1. The contents of the different subsystems, in particular, the emergency actions which are included, are indicated in Table 2.1. A brief overview of the COSYMA package is provided in Appendix A. Sheltering is considered in COSYMA to be an action aimed at reducing near-range exposure. Thus, the distance ranges covered by the NE and NL subsystems determine the contents of the questions on sheltering in the questionnaire. Evacuation is considered in COSYMA to be an action aimed at reducing short-term exposure, for both early and late health effects. Thus, the distance range covered by the NE and NL subsystems determines the contents of the questions on evacuation in the questionnaire. Evacuation can, in certain areas, be preceded by sheltering. Relocation is considered in COSYMA to be an action aimed at reducing long-term exposure. Relocation was not considered in this project. Forced land decontamination is considered in COSYMA to be an action aimed at reducing long-term exposure. Decontamination was not considered in this project. Skin decontamination is considered in COSYMA to be an action aimed at reducing short-term exposure. It was decided that it would not be possible to include questions on skin decontamination in the questionnaire. Distribution of stable iodine tablets is considered in COSYMA to be an action aimed at reducing thyroid cancer. Thus, the distance range covered by the NE subsystem and the reduction of short-term exposure to radioactive iodine, determine the contents of the questions on stable iodine tablets in the questionnaire. The consequences of the stable iodine tablets
11

distribution are also calculated in the NL and FL subsystems with respect to thyroid cancer incidences. Food restrictions are considered in COSYMA to be an action aimed at reducing long-term exposure. Thus, the conditions covered by the NL and FL subsystems determine the contents of the questions on sheltering in the questionnaire. There are no specific population behaviour elements with respect to food restrictions, so no questions were asked on food restrictions. 2.5 Selection of Variables for Presentation to Formal Expert Elicitation Panel ShelteringGiven the timing of the type of accident considered, there is a certain delay time between the time of the accident (reactor shutdown) and the time at which the decision on sheltering is made. The uncertainty of this delay time is volitional. However, there is a second delay time between the decision on sheltering and its implementation by the population. The uncertainty of that delay time under various conditions and the percentages of people following the decision to shelter was asked in the questionnaire. Distinction was made between sheltering and self-evacuation. EvacuationFor evacuation, as for sheltering, the uncertainty of the delay time between the decision on evacuation and its implementation by the population, under various conditions, was asked in the questionnaire. A distinction was made between organised evacuation and self-evacuation. Additionally the percentages of people following the decision to evacuate were asked. Questions on driving times were asked separately. Administration of stable iodine tablets For the administration of stable iodine tablets, as for sheltering, the uncertainty of the delay time between the decision to administer and its implementation by the population, under various conditions, was asked in the questionnaire. Driving times to leave an evacuation areaThe driving times to leave an area were asked in the questionnaire, both for self-evacuation and organised evacuations. 2.6 Formal Expert Judgement Method For the countermeasures panel the same formal expert judgement method is applied as for the other panels of the joint study. The methodology and approach are explained in the Procedures Guide9. 2.7 Scope of Analysis This panel has been convened to consider the issues relating to the uncertainties in sheltering, evacuation, and distribution of stable iodine tablets. The questions posed referred to the behaviour of people directly or indirectly affected by (groups of) emergency actions in the time periods before, during and after the implementation of those actions. In the expert panel
12
the organisational and behavioural aspects of emergency actions are the main subject, which is relevant for the following emergency actions: sheltering, evacuation, the intake of stable iodine tablets, and driving times to leave an evacuation area. The questions were conditional on the practical application of the accident consequence codes. The following items were not specified in the questionnaire for that reason and need to be considered when assigning confidence bounds on the values of the elicitation variables: * parameter variations due to seasonal, weekend/working day and day/night conditions * variations in driving times caused by adverse weather conditions, traffic and road
network conditions • initial delay of the start of actions due to delayed information of the authorities, time
to complete the emergency management and monitoring staff, time to obtain monitoring data, availability of transportation means and other technical or personnel support.
2.8 References 1. USNRC, Reactor Safety Study – An assessment of accident risks in US commercial
nuclear power plants, WASH-1400 (NUREG-75/014), Washington, DC, October 1975
2. Harper FT, Goossens LHJ, Cooke RM, Hora SC, Young ML, Päsler-Sauer J, Miller LA, Kraan BCP, Lui C, McKay MD, Helton JC, Jones JA. Probabilistic accident consequence uncertainty analysis: Dispersion and deposition uncertainty assessment. Report NUREG/CR-6244, EUR 15855, Washington, DC/USA, and Brussels-Luxembourg, 1995
3. Goossens LHJ, Cooke RM and Kraan BCP, Evaluation of weighting schemes for expert judgement studies, Report prepared for the EC, DG XII, Delft University of Technology, Delft, NL, 1996
4. USNRC. Severe accident risks: An assessment for five US nuclear power plants. Report NUREG-1150, 1990
5. Lewis HW, et al, USNRC, Risk Assessment Review Group Report to the US Nuclear regulatory Commission, NUREG/CR-0400, Washington, DC, September 1978
6. Cooke RM. Uncertainty in dispersion and deposition in accident consequence modeling assessed with performance-based expert judgment, Reliability Engineering and System Safety, 1994, Vol.45, pp.35-46
7. USNRC, PRA Working Group, A review of NRC staff uses of probabilistic risk assessment, NUREG-1489, Washington, DC, March 1994
8. Hasemann I and Ehrhardt J, COSYMA: Dose models and countermeasures for external exposure and inhalation, Report KfK 4333, Forschungszentrum Karlsruhe, January 1994
9. Cooke RM and Goossens LHJ, Procedures guide for structured expert judgement, Report EUR 18820, Brussels-Luxembourg, 2000
13

Figure 2.1. General structure of COSYMA8
near range modelling ofatmospheric dispersion
<50 km
far range modellingof atmospheric
dispersion> 50 km up to ̃3000 km
short-termcountermeasures
short-termdoses
early health effects
economic costs
long-termcountermeasurers
long-term doses
late health effects
economic costs
long-termcountermeasures
long-termdoses
late health effects
economic costs
COSYMA
subsystem NE subsystem NL subsystem FL
COSYMA
14

COSYMA-Subsystem EFFECT N E N L F L
Exposure Pathways External irradiation from the cloud External irradiation from deposit on the ground Inhalation from the cloud Inhalation of resuspended material External irradiation of from deposit on skin and clothes Ingestion of containment food
* * * * *
* * * * * *
* * * * * *
Organ doses Acute doses (integration times ≥ 1d, ≤1a) Lifetime doses (intgration times ≥1a, ≤ 70 a)
*
*
*
Countermeasures Sheltering Evacuation Relocation Forced land decontamination Stable iodine tablets Food restrictions
* * *
* * * * *
* * * *
Table 2.1. Contents of the different subsystems of COSYMA8
15

CHAPTER 3. SUMMARY OF EXPERT ELICITATION METHOD FOR THE COUNTERMEASURES PANEL 3.1 Introduction The joint methodology used to develop uncertainty distributions for use in probabilistic accident consequence calculations in this project is summarised in this section. A more detailed description of the methodology is presented in the Procedures Guide for Structured Expert Judgement1. The methodology formulated for this project is a combination of methods from previous US and EC studies as well as methods developed specifically for the project. Figure 3.1 is a graphical representation of the methodology applied in this project for the development of distributions over consequence code input parameters. This chapter reviews the methodology applied in this project, specifically as it pertains to the development of distributions over countermeasures variables. 3.2 Definition of Elicitation Variables and Case Structures Elicitation variables are the variables presented to the experts for assessment. Experts were asked to provide distributions over the variables within the context of a set of initial conditions. Each set of initial conditions for an individual question is termed a case. The ensemble of all cases for the elicitation variables is termed the case structure. The primary consideration in the development of elicitation variables, cases, and case structures was the importance of designing elicitation questions that were not dependent on specific analytical models. 3.2.1 Definition of Elicitation Variables It was the responsibility of the probability elicitation team to develop elicitation variables that relate directly to observable behavioural and organisational quantities. The "processes" for countermeasures strategies modelled in COSYMA and MACCS are different, and require different approaches to modelling the behavioural and organisational variables in the countermeasures models of both codes. One of the guiding principles of this expert elicitation exercise is that the experts should be asked to respond only to questions about observable or measurable quantities, even though the actual measurement of these quantities may be impracticable due to resource constraints. Therefore, the experts were not expected to answer questions on the mathematical models themselves, to which they may not be able to easily relate, particularly when the models have been derived empirically. The practical implications for the countermeasures exercise are such that all target variables identified for expert judgement appear to be observables, which has the advantage that probabilistic inversion of assessed distributions of variables into distributions of model coefficients is not required. The study was limited to those issues where alternative sources of information, such as experimental or observational data or even validated computer models, were not available, or where multiple sources of information provided conflicting or incomplete evidence of the uncertainties.
16

Define goals and phliosophiesfor uncertainty assessment
Develop expert selection criteria S
eli
Defineelicitationvariables
Dry run elicitation variablesand case structures
Modify elicitationvariables and case structuresselect experts on the basis of criteria
Providand case
Train experts in probability distribution development
Present elicitation variables and case structures to experts
Finalize elicitation variables and case structures
Experts prepare response toassessment and rationale
Expert elicitation sessions
Develop casestructures
Prioritise code input variables
Select code inputvariables for analysis
1st expert meeting(group)
Data and rationale
2nd expert meeting
(individual)
Process elicitation variables
Document
Figure 3.1. Sequence of methods used to develop the uncertainty distributions
17

3.2.2 Development of Case Structures Expert judgements applicable for uncertainty analysis must be cast in the form of subjective probability distributions. Subjective probability measures degree of belief with respect to possible observations. In this study experts were asked only about physically observable quantities. For further details on the applied methodology, we refer to Cooke2. Degree of belief was elicited in the form of 5%, 50% and 95% quantiles of subjective probability distributions. The 5% quantile of the distribution for an uncertain quantity X is the number x05 such that Prob{X<x05} = 5%. For each assessment, certain background information was supplied. It was not the intention to provide all physically relevant information; rather the information provided corresponds to the information which accident consequence code models require. For example, to predict the effects of emergency actions, the variation in the number of people in a designated area at different times is relevant physical information. However, the models in question use only a stated single number of people to determine the emergency actions effects. Hence only this information was provided. Where specific information was given to the experts, they were asked to ignore any uncertainty surrounding that value. An expert panel was convened to consider the issues relating to the uncertainties in implementing emergency actions. The questions posed referred to the behaviour of people directly or indirectly affected by (groups of) emergency actions in the time periods before, during and after the implementation of those actions. In the expert panel the organisational and behavioural aspects of emergency actions were the main subject. Only the following emergency actions were considered by this panel: sheltering, evacuation, the intake of stable iodine tablets, and driving times to leave an evacuation area. Emergency guidelines distinguish between three types of emergency actions: 1. General emergency: take action immediately 2. Site area emergency: crisis team, but no immediate offsite action, only when declared
later as a general emergency 3. Alert: only notification to appropriate people/authorities. For a full understanding of what is meant in this context by the emergency states, the reader is referred to the IAEA document3 of which the relevant pages were handed out to the experts. The check of the emergency action status is based on observable plant conditions and off-site measurements (if available). Whilst the details of the response vary from country to country (and even site to site) the following broad steps can be taken to represent the sequence leading to an off-site response: 1. Initiating event(s) for the accident (at the plant) 2. Declaration of site area emergency (plant notifies responsible authority) 3. Declaration of general emergency (plant notifies responsible authority) 4. Activation of off-site emergency system (by responsible authority) 5. Assessment of situation (by responsible authority) 6. Decision to implement countermeasures (by responsible authority) 7. Mobilisation of resources (by responsible authority) 8. People take action.
18

For the purposes of this study, the accident sequence is defined with the following time points and time periods: tal tpa t=0 tae tep tpc tooa| | | | | | | +--------------------------------------------------------------------------------------------------------- Tnot Torg Tbeh Tdr |--------||-------------------------------------------||-----------------||---------------------------| The above sequence starts with the time at which the initiating event has evolved into a potential severe accident sequence sufficient to declare a general emergency (tal ). It should be emphasised that the initiating event itself (started at time point tie, which is not indicated in the above line of sequences) may not be directly a reason to declare any emergency alert. The pre-panel considered whether the point tie would be identifiable by the experts. It was possible that the experts would consider several different states of the systems as the initiating event. Therefore, the delay times between these two time points cannot be assessed by experts as it depends on each practical situation. It was decided to use the IAEA definitions for giving an alert, lead to the eventual use of the time point tal as a starting point for the sequence. The events for alert are provided in the IAEA document3. Recognition of the state of alert by plant personnel is followed by the time at which the plant officials notify the responsible authority about a general emergency (tpa); this time period is called notification period (Tnot). Another issue was the time of release (t=0 in the diagram) in relation to the use of it in COSYMA. The time moment tpa is very crucial and it was discussed whether one can actually elicit the duration of the time period from alerting the local authorities (tpa) until the time of release of material to the atmosphere (t=0). It was felt that this time could not be elicited, as the experts involved would not know when the release may occur. Note that t=0 can be at any place on the time sequence. The next period represents the time to organise the off-site response, and is characterised by two time points: the time at which the responsible authorities notify the local emergency staff (police and so on) to start taking countermeasures (tae) and the time at which the local emergency staff notify people of the need for countermeasures (tep). Next follows a period of response by people (Tbeh), defined as ending with the time at which people start implementing the countermeasures recommended (tpc). In this period the preparation of the necessary means of evacuation by the emergency services (if required) is also taken into account. The last period (for evacuation only) is the period to leave the evacuation area (Tdr), ending when people have left the area where countermeasures are active (tooa). The emergency planning zone is often defined as a segment or circle, based on fixed distances from the plant (2 to 5 km from point of release) where detailed plans for sheltering and evacuation are prepared. However, accident consequence assessment studies routinely consider low probability accidents, for which detailed planning in not undertaken. For this reason, two other areas were defined in the case structure, both outside the emergency planning zone, one within 30 km of the site (a segment or circle, where both sheltering and evacuation would be triggered) with the other more than 30 km from the site (a segment, where only sheltering could be triggered). There were problems because different countries have different procedures, and experts tended to interpret the questions in the light of the procedures in their own countries. For example, France always shelters in an area near the site, followed by evacuation if needed; the UK treats sheltering and evacuation as separate
19

countermeasures, and would not expect advice to shelter being subsequently revised into advice to evacuate. There are also differences in notification to the public: in France it may be sirens, in the UK the police go door to door. Administration of stable iodine tablets was assumed to be implemented in the area around the plant where the dose to the thyroid was above a threshold value. Stable iodine tablets were assumed to be taken only once by people. Two situations were distinguished: pre-distribution and stocks held in distribution facilities for distribution ‘on the day’. Six assessment cases were distinguished in the elicitation questionnaire based on the above mentioned time schedule. The draft questionnaire was discussed by a "pre-panel" consisting of 4 people with experience in emergency response. The effectiveness of iodine tablets (rather than the time required to distribute and take them) was not considered by the panel for two reasons. First, this would require a medical background unlike the other questions being asked. Second, the time sequence assumed in COSYMA is rather simplistic; the effectiveness of iodine tablets in reducing thyroid dose is calculated on the assumption that the radioactive iodine is inhaled instantaneously. No expert panel could be formed to consider the effectiveness of skin decontamination as only one group of people (at Imperial College UK) was known to have undertaken experiments on this point. It was decided that severe weather conditions should be left out of the questionnaire in most places. Some actions are only initiated if doses are above the appropriate intervention level. In these cases, the distributions provided by the experts included the time required to assess the current situation. Six cases (designated A to F) were distinguished. Case A: This asked for the time period to notify the authorities after a declaration of general emergency after the initiating event has been alerted at the plant (at tal). No distinction is made between an initiating event with an immediate declaration of general emergency and an initiating event which started off as a site area emergency. The experts were asked about the time required to notify the person responsible for taking offsite actions. Important issues raised by the pre-panel were: • To notify means to get hold of the right person to take responsibility. • Distributions should be sought for four different conditions (day time, night time, weekend,
and during rush hours) as the experts may consider that these could affect the timings. • It was felt that responses would not differ depending on when (t=0) occurs and so this was
not included in the description of the conditions considered. Case B asked for the time period for the responsible authority to organise the emergency services and to notify people in the various areas, for two situations Case B1: after an initiating event is observed , for which an immediate general emergency has been declared. Case B2: after an initiating event is observed, for which a general emergency has been declared after a site area emergency.
20

Important issue: The question under case B2 addresses the organisation of emergency services and notification to the public for a general emergency after an earlier period of a site area emergency. In case B2 the authorities already know there is a problem at the site, and this may shorten the time required to organise emergency services once a general emergency has been declared. The delay time between the two emergency situations cannot be assessed by the experts and is therefore left out of the assessments. Day and night must both be considered as there may be no notifications to the public during night times or there could be large (possibly deliberate) delays. The questions were asked for several situations, for both cases B1 and B2: • For sheltering, within the emergency planning zone, and inside and outside the 30 km
zone of the site. • For immediate evacuation without sheltering first, within the emergency planning zone,
and within the 30 km zone of the site. • For delayed evacuation after a period of sheltering first, within the emergency planning
zone, and within the 30 km zone of the site. In the questionnaire again four conditions were taken: day time, night time, weekend, and during rush hours. Case C: People are notified by the emergency services to shelter only within the area outside the emergency planning zone, but within the 30 km zone of the site.
The questionnaire for case C was divided in three sections:
1. What is the percentage of people not responding: staying outdoors, ignoring the notification to shelter; staying outdoors, not receiving the notification to shelter; and deciding to evacuate spontaneously.
2. If the notification to shelter is followed by people, how much time (Tbeh) does it take for parts of the population to implement the action, during day time only. This was asked for the majority of people (68%) and the vast majority of people (95%).
3. People are told to shelter until further notice. What fraction of the people who initially shelter will leave their shelters in less than the period for which sheltering is required?
It was considered that the answers to these questions might depend on the type of message and the credibility of the authorities. The answers could depend on whether the accident occurred in summer or winter and during day or night time. Social conditions, such as whether people are likely to be "living" outdoors (e.g., as in summer in southern European countries) could also affect the assessment. The experts were asked to consider these conditions in their assessments. Case D: People are notified by the emergency services to evacuate from an area outside the emergency planning zone, but within the 30 km zone of the site. The questionnaire for case D was divided in to three sections: 1. What is the percentage of people not responding to the order of organised evacuation who
ignore the notification to evacuate; do not receive the notification to evacuate; and decide to evacuate, but not following the order (e.g., going the wrong direction).
2. If the notification to evacuate is followed by people, how much time (Tbeh) does it take for parts of the population that decides for organised evacuation, to implement the action and
21

start to evacuate in an organised way. The time period considered here ends when people start to leave their homes by the approved transport arrangements, but does not include the driving time. Evacuation only takes place in the area within 30 km of the site. This was asked for the majority of people (68%) and the vast majority of people (95%), both during working days, and during weekends and holidays.
3. If the notification to evacuate is followed by people, but some people do not follow the approved method of evacuation, how much time (Tbeh) does it take for those parts of the population evacuating by themselves to do so? The time period considered here ends when people start to leave their homes by their own transport arrangements, but does not include the the driving time. Evacuation only takes place in the area within 30 km of the site. This was asked for the majority of people (68%) and the vast majority of people (95%), both during working days, and during weekends and holidays.
Case E: The experts were asked for the time from when people leave their home to the time when they are outside the contaminated zone, and so receive no further dose. This does not include the time to prepare for evacuation (which was included in question D), but is simply the time to leave the area (by car or on foot). The experts were asked to distinguish suburban (ie residential) and urban (i.e. shopping centres). The experts were also asked to consider day time situations with light or heavy traffic and night time situations for any traffic conditions. Preparation time should be included in the implementation time as asked for in Case D. Case E only deals with driving times or walking times. In the questionnaire time periods were asked for leaving the emergency planning zone and the next zone within 30 km of the site, in situations during day time and light traffic, during day time and heavy traffic, and during night time. Case F: Time periods for those people who should do so, to take stable iodine tablets after being notified by the emergency services (Tbeh). It was considered important to distinguish between situations where tablets are distributed in advance and kept at home by people living near a site, and where tablets are distributed in the event of an accident. Three questions were asked: What is the percentage of people not responding who have the tablets at home or have to take the
tablets at a pharmacy or other distribution facility. The time to take in tablets, having the tablets at home, for the majority of people (68%) and the
vast majority of people (95%). The time to take in tablets, having to take the tablets at a pharmacy or other distribution facility,
for the majority of people (68%) and the vast majority of people (95%). The final case structure document and questionnaire are shown in Appendix B. 3.3 Expertise Required for the Elicitation Process The design for the probability elicitation sessions in this study was taken from the methodology described in the Procedures Guide for Structured Expert Judgement1. This design includes an
22
elicitation team composed of the phenomenological experts whose judgements are sought, a normative specialist who manages the session, and a substantive assistant from the project staff who aids communication between the expert and the specialist and helps answer questions about the assumptions and conditions of the study. The normative specialist is an expert in probability elicitation. The role of the normative specialist is to ensure that the expert's knowledge is properly encoded into probability distributions. To accomplish this aim, the specialist must be alert to the potential for biases in judgement formation. The specialist also tests the consistency of judgements by asking questions from various points of view and checking agreement among the various answers. Another role is ensuring that the expert expresses rationales for the judgements and is able to substantiate any assumptions that are made. Along with the phenomenological expert, the normative specialist ensures that the distributions are properly recorded and annotated to eliminate ambiguity in their meaning. The substantive assistant brings knowledge of project assumptions and conditions to the study. The role of this participant is to promote a common understanding of the issues and to clarify and articulate how the data will be interpreted in the modelling activities. This team member also has responsibility for assisting the expert with documentation of rationales. The substantive assistant helped during the expert training, but only a normative specialist was present in the elicitation sessions for this panel. 3.3.1 Selection of Phenomenological Experts The project staff sought to engage the best experts available in the fields of countermeasures. Experience in previous studies has shown that the selection of experts can be subjected to much scrutiny. Thus, it was necessary to construct a defensible selection procedure. The selection procedure for this study involved the following: (1) a list of experts was compiled from the literature and by requesting nominations from organisations familiar with the areas; (2) the experts were contacted and curriculum vitae (CV) were requested; (3) the pre-panel experts assisted in the selection process. The expert selection was based on a common set of selection criteria, which included reputation in the relevant fields, familiarity with the uncertainty concepts, diversity in background, balance of viewpoints, interest in this project, and availability to undertake the task in the time prescribed. Ten experts from seven European countries (Belgium, Finland, France, Germany, the Netherlands, Sweden, United Kingdom) were selected to guarantee a wide diversity of expertise and experience from various nuclear emergency situations. Two experts worked together and provided a joint assessment. There are therefore nine sets of assessments. Table 3.1 lists the experts who participated in this study. Brief biographies of the individual experts are provided in Appendix D. The number identifies each expert's results in the figures in section 4. 3.3.2 Selection of Normative Specialists and Substantive Assistants Normative specialists have the responsibility of managing the elicitation sessions. These specialists come from various fields such as psychology, decision analysis, statistics, or risk and safety analysis. The characteristic that distinguishes these specialists is a cognisance of the methods and literature for probability elicitation and experience in applying these methods. Normative specialists must be able to manage the elicitation sessions by providing assistance in developing and expressing quantitative judgements.
23
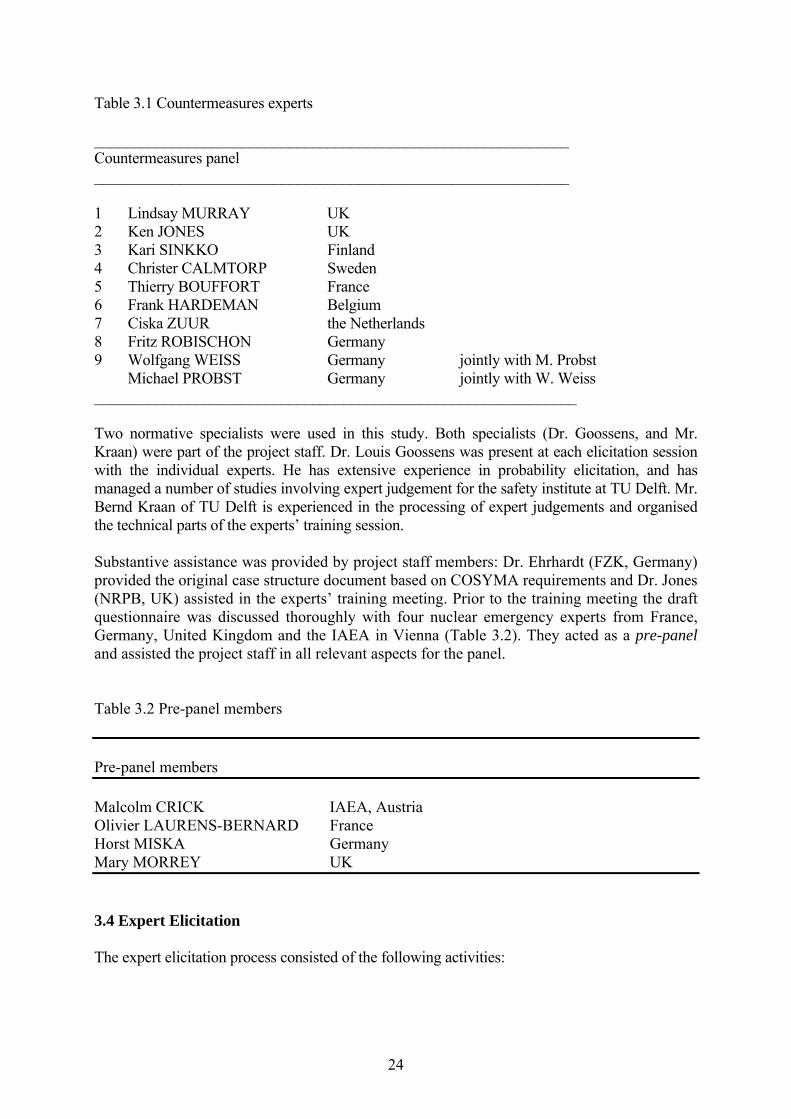
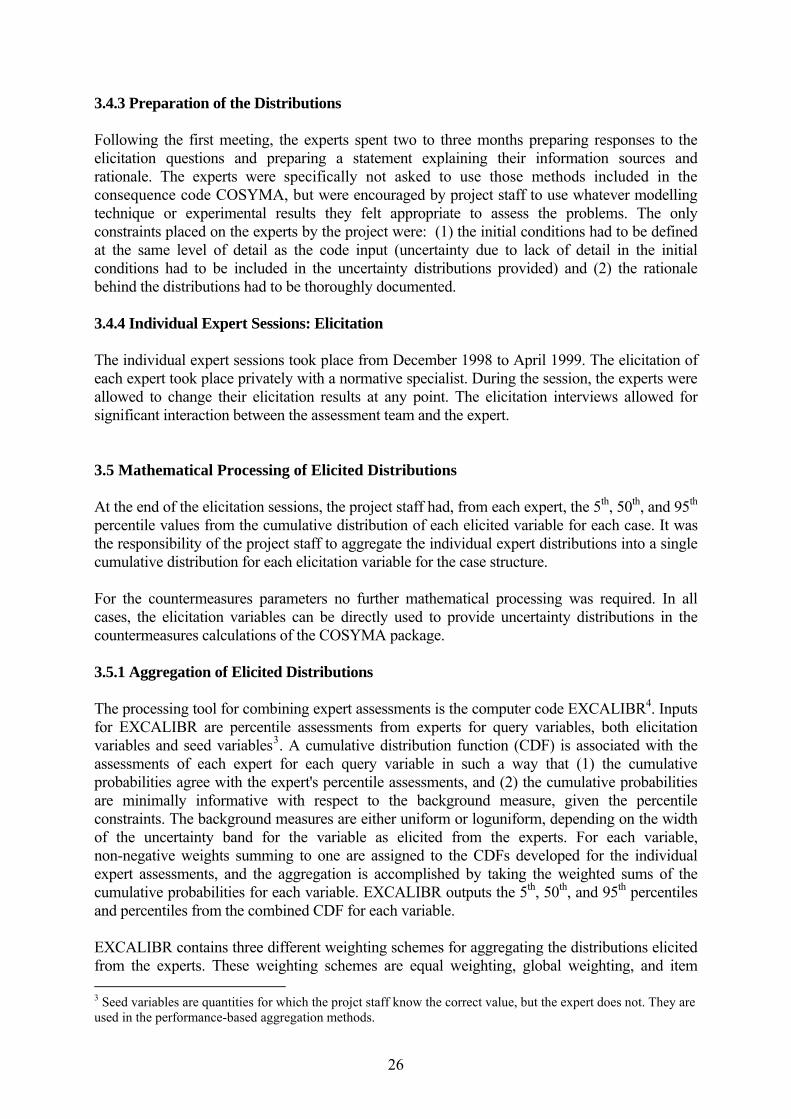
Table 3.1 Countermeasures experts _____________________________________________________________ Countermeasures panel _____________________________________________________________ 1 Lindsay MURRAY UK 2 Ken JONES UK 3 Kari SINKKO Finland 4 Christer CALMTORP Sweden 5 Thierry BOUFFORT France 6 Frank HARDEMAN Belgium 7 Ciska ZUUR the Netherlands 8 Fritz ROBISCHON Germany 9 Wolfgang WEISS Germany jointly with M. Probst Michael PROBST Germany jointly with W. Weiss ______________________________________________________________ Two normative specialists were used in this study. Both specialists (Dr. Goossens, and Mr. Kraan) were part of the project staff. Dr. Louis Goossens was present at each elicitation session with the individual experts. He has extensive experience in probability elicitation, and has managed a number of studies involving expert judgement for the safety institute at TU Delft. Mr. Bernd Kraan of TU Delft is experienced in the processing of expert judgements and organised the technical parts of the experts’ training session. Substantive assistance was provided by project staff members: Dr. Ehrhardt (FZK, Germany) provided the original case structure document based on COSYMA requirements and Dr. Jones (NRPB, UK) assisted in the experts’ training meeting. Prior to the training meeting the draft questionnaire was discussed thoroughly with four nuclear emergency experts from France, Germany, United Kingdom and the IAEA in Vienna (Table 3.2). They acted as a pre-panel and assisted the project staff in all relevant aspects for the panel. Table 3.2 Pre-panel members Pre-panel members Malcolm CRICK IAEA, Austria Olivier LAURENS-BERNARD France Horst MISKA Germany Mary MORREY UK 3.4 Expert Elicitation The expert elicitation process consisted of the following activities:
24

(1) Dry run elicitation: A dry run discussion round was conducted with all four pre-panel experts separately. The purpose of the dry run was to evaluate the final case structures and to define the questions of the elicitation questionnaire. (2) Expert training meeting: The purpose of the expert training meeting was to train the experts in providing their judgements in terms of probability distributions and to present the technical problems to be assessed. (3) Expert prepares assessment: The expert prepared his assessment of the problems posed in the training meeting. (4) Individual expert sessions: The individual expert sessions were conducted approximately two to three months after the expert training meeting. The purpose of the sessions was to elicit from each expert the required distributions of the elicitation variables in the questionnaire. The experts also provided the project staff with the rationale behind the distributions in written form. 3.4.1 Dry Run Elicitation The dry-run discussions were held in two rounds. A joint meeting was first held in Delft, 28-29 January 1998, followed by separate meetings with each pre-panel expert separately in March 1999. The draft case structure document and elicitation questionnaires were handed out prior to both meetings. The pre-panel experts were not asked to prepare quantitative responses to the questions, but were requested to judge the merits of the questions, to detect possible ambiguities in the questionnaires and to indicate the relevance of the questions in general, not related to the ACA codes in particular. The case structures and questionnaires to be presented to the experts in the first meeting were prepared according to the lessons learned in the dry run. See section 3.2.2. 3.4.2 Expert Training Meeting At the expert training meeting, held 19-20 October 1998 in Delft, the Netherlands, a brief description of the process and the elicitation questions were provided to the experts. The experts were introduced to the purposes of the study, including how their judgements were to be used. The case structure document was provided to the experts. This gave a clear definition of the variables to be assessed. A description of how the information provided by the experts would eventually be used by the project staff was provided. The experts were also introduced to background material on the COSYMA code and methods of probability elicitation. This required the distribution of materials explaining the accident consequence field, the relationship of the questions posed to the parameters in the model, and the specific initial conditions and assumptions to be used in answering the elicitation questions. Training was conducted to introduce the experts to the psychological biases in judgement formation and to give them feedback on their performance in assessing probability distributions. During the training, feedback was provided to the experts by measuring their performance on the development of probabilistic distributions for training variables. The training variables were non-technical almanac type questions for which the answers were known by the project staff. Some of the experts were unable to attend the expert training meeting. They were individually briefed later on training issues.
25
3.4.3 Preparation of the Distributions Following the first meeting, the experts spent two to three months preparing responses to the elicitation questions and preparing a statement explaining their information sources and rationale. The experts were specifically not asked to use those methods included in the consequence code COSYMA, but were encouraged by project staff to use whatever modelling technique or experimental results they felt appropriate to assess the problems. The only constraints placed on the experts by the project were: (1) the initial conditions had to be defined at the same level of detail as the code input (uncertainty due to lack of detail in the initial conditions had to be included in the uncertainty distributions provided) and (2) the rationale behind the distributions had to be thoroughly documented. 3.4.4 Individual Expert Sessions: Elicitation The individual expert sessions took place from December 1998 to April 1999. The elicitation of each expert took place privately with a normative specialist. During the session, the experts were allowed to change their elicitation results at any point. The elicitation interviews allowed for significant interaction between the assessment team and the expert. 3.5 Mathematical Processing of Elicited Distributions At the end of the elicitation sessions, the project staff had, from each expert, the 5th, 50th, and 95th percentile values from the cumulative distribution of each elicited variable for each case. It was the responsibility of the project staff to aggregate the individual expert distributions into a single cumulative distribution for each elicitation variable for the case structure. For the countermeasures parameters no further mathematical processing was required. In all cases, the elicitation variables can be directly used to provide uncertainty distributions in the countermeasures calculations of the COSYMA package. 3.5.1 Aggregation of Elicited Distributions The processing tool for combining expert assessments is the computer code EXCALIBR4. Inputs for EXCALIBR are percentile assessments from experts for query variables, both elicitation variables and seed variables3. A cumulative distribution function (CDF) is associated with the assessments of each expert for each query variable in such a way that (1) the cumulative probabilities agree with the expert's percentile assessments, and (2) the cumulative probabilities are minimally informative with respect to the background measure, given the percentile constraints. The background measures are either uniform or loguniform, depending on the width of the uncertainty band for the variable as elicited from the experts. For each variable, non-negative weights summing to one are assigned to the CDFs developed for the individual expert assessments, and the aggregation is accomplished by taking the weighted sums of the cumulative probabilities for each variable. EXCALIBR outputs the 5th, 50th, and 95th percentiles and percentiles from the combined CDF for each variable. EXCALIBR contains three different weighting schemes for aggregating the distributions elicited from the experts. These weighting schemes are equal weighting, global weighting, and item 3 Seed variables are quantities for which the projct staff know the correct value, but the expert does not. They are used in the performance-based aggregation methods.
26
weighting. The different weighting schemes are distinguished by the means by which the weights are assigned to the CDFs of each expert. The equal weighting aggregation scheme assigns equal weight to each expert. If N experts have assessed a given set of variables, the weights for each density are 1/N; hence for variable i in this set the decision maker's CDF is given by: N Fewdm,i = (1/N) Σ fj,i j=1 where fj,i is the cumulative probability associated with expert j's assessment for variable i. Global and item based weighting techniques are termed performance based weighting techniques because weights are developed based on an expert's performance on seed variables. Global weights are determined, per expert, by the expert's calibration score and overall information score. The calibration score is determined per expert by his assessments of seed variables. The information score is related to the width of the uncertainty band and the placement of the median provided by the expert. As with global weights, item weights are determined by the expert's calibration score. Whereas global weights are determined per expert, item weights are determined per expert and per variable in a way that is sensitive to the expert's informativeness for each variable. Investigating the different weighting schemes was not the objective of this joint effort. Attempts were made to identify robust experimental data or real-life data in the relevant fields of interest, but failed. A few real-life data were, however, used in the training session. No relevant real-life data were identified to be suitable for achieving performance based weightings, and so equal weighting was used. 3.5.2 Mathematical Processing of Dependencies Between Variables It has long been known that significant errors in uncertainty analysis can be caused by ignoring dependencies between uncertainties5. New techniques for estimating and analysing dependencies in uncertainty analysis have been developed in the course of the joint CEC/USNRC accident consequence uncertainty analysis. We discuss how the various dependencies were elicited from experts and how we combined them. Eliciting dependencies The best source of information about dependencies is often the experts themselves. The most thorough approach would be to elicit directly the experts' joint distributions. The practical drawbacks to this approach have forced analysts to look for other dependence elicitation strategies. One obvious strategy is to ask experts directly to assess a (rank) correlation coefficient. However, even trained statisticians have difficulty with this type of assessment task6. Within the joint CEC/USNRC study a new strategy has been employed for eliciting dependencies from experts. When the analyst has identified a potential dependence between (co-ntinuous) variables X and Y, experts first assess their marginal distributions for X and Y. They are then asked:
27

Suppose Y were observed in a given case and its value were found to lie above the median value for Y; what is your probability that, in this same case, X would also
lie above its median value? An appropriate joint distribution was selected which has
the assessed marginal distributions of X and Y. minimal information among all such distributions.
For two reasons it was decided that not all dependencies were to be elicited; firstly there are too many questions and secondly, in eliciting all dependencies, it is almost impossible to assure that the resulting correlation matrix is positive definite. Therefore it was decided that the experts were to be elicited on a selection of all possible dependencies. If this selection is such that the resulting dependency structure is an acyclic graph, it is possible to find a joint distribution which • satisfies the marginal distribution of the selected variables • has a correlation matrix which is positive definite and satisfies the results as
specified in the dependency structure. From the set of distributions, which share the properties as stated above, we select the distribution which has maximum entropy among all the distributions7. The dependency document is constructed by both the consequence analyst and the uncertainty analyst. The consequence analyst drafts a list with potential important dependencies, this list is then reviewed by the uncertainty analyst to see if the corresponding dependency structure would result in an a-cyclic dependency structure. After a number of iterations the final dependency document is given to the experts. 3.6 References 1. Cooke RM and Goossens LHJ, Procedures guide for structured expert judgement,
Report EUR 18820, Brussels-Luxembourg, 2000 2. Cooke RM, Experts in uncertainty, Oxford University Press, 1991 3. International Atomic Energy Agency, Generic assessment procedures for determining
protective actions during a reactor incident, IAEA-TECDOC-955, Vienna, August 1997
4. Cooke RM and Solomatine D. EXCALIBR - Integrated system for processing expert judgements, Version 3.0, User's manual, Delft, Delft University of Technology and SoLogic Delft, 1992
5. Apostolakis G and Kaplan S, Pitfalls in risk calculations, Reliability Engineering, 1981, Vol. 2, pp.135-145
6. Gokhale D. and Press S. Assessment of a prior distribution for the correlation coefficient in a bivariate normal distribution. Journal of the Royal Statistical Society A, 1982, vol 145, pp. 237-249
7. Cooke RM and Kraan BCP. Dealing with dependencies in uncertainty analysis. In: P.C. Cacciabue and I.A. Papazoglou (Eds.), Probabilistic Safety Assessment and Management (ESREL '96 - PSAM-III, June 24-28, 1996, Crete, Greece), Volume 1, Springer, 1996, pp.625-630
28

CHAPTER 4. RESULTS AND ANALYSIS 4.1 Introduction This section summarises the experts’ responses to the elicitation questionnaire and includes the main results of the individual expert assessments and the aggregated elicited distributions. 4.2 Summary of Elicitation Meetings The elicitation sessions were performed on an individual basis. Eight experts were visited and one expert sent in the questionnaire with consultations by phone and e-mail. In only a few cases the assessments were adapted as a result of the discussion at the session. Most difficulties were experienced in the interpretation of the dependencies questions. 4.3 Summary of Individual Expert Assessments Representative results are summarised and discussed in this section. Because a large number of figures are included in this chapter, they are presented at the end of the chapter so as not to interrupt the flow of the text. The complete set of expert rationales and the elicited distributions are published in Appendix C of this report. In this section, the figures show range graphs as output by the EXCALIBR software. The item name explains each question of the questionnaire, indicating first the case (A through F) followed by an abbreviation explained on the first page of Appendix C. The figures use the numbers 1 to 9 to identify the results of the 9 experts; the experts can be identified by the numbers in table 3.1. In Appendix C the data and rationales are provided with the names of each expert associated with their rationale. This section discusses individual assessments and aggregated results. Aggregation employed equal weighting of the individual elicited distributions. In the figures DM represents the aggregated results. In the figures for each expert, the range is given marked by [ # ] representing their 5th percentile, median and 95th percentile assessments respectively. The numbers below each range graph represent the lowest 5th percentile assessment and the highest 95th percentile assessment among all experts. All times are given in minutes, all fractions are given in percentages. Throughout sections 4.3 and 4.4 the term range factor is used to express the ratio between the 95th and 5th percentiles of the distribution. Each case will be separately dealt with. General remarks relevant for the interpretation of the individual assessments of the experts: 1. The 30 km zone is meaningless for the U.K. as there exist no specific plans for public safety
countermeasures beyond the emergency planning zone. In Finland, in the first instance evacuation only takes place within the 5 km zone around the sites. If necessary, evacuation can be extended to an area up to 20 km from the site. In Sweden the zone of 12 to 15 km radius around the nuclear power plant is called the Inner Emergency Preparedness zone, and the surrounding zone up to 50 km is called the Indication zone. For this assessment an emergency planning zone of 12 km was taken, the other area was kept at 30 km. In Sweden no evacuation beyond 12 km from the plant is undertaken. In France no emergency actions are undertaken beyond the 30 km zone. In Belgium the emergency planning zone for evacuation is 10 km, and for sheltering 10 km with a possibility to extend that distance when considered necessary. Pre-distribution of stable iodine tablets is done up to 10 km from the nuclear sites; the possibility of obtaining the tablets on an individual basis (but without
29

stimulation) goes up to 20 km. The limitation of the emergency planning zone to 10 km has many practical implications such as sirens are installed to only cover that range; ordered sheltering over a wider range would then require mobile facilities from the emergency services. In some cases in Germany, the emergency planning zone is taken to be 8 km for evacuation and 10 km for other actions, and the outer zone is taken at 25 km. Stable iodine tablets are only distributed in Germany within a zone with a radius of 10 km.
2. Notification of people depends largely on the communication means. Automated telephone warning systems might reduce the time necessary to broadcast awareness among a threatened population and related advice to shelter, to evacuate or to take in stable iodine tablets. Responses are generally given in current (sometimes less sophisticated) systems, increasing assessed time periods.
3. Sheltering means staying indoors and keeping windows and doors closed. 4.3.1 Case A: Individual Assessments Case A asked: What is the time period Tnot required to notify any authority, who is responsible for taking off-site emergency actions, about a general emergency situation? Several conditions at time tal are considered. To notify means: to get hold of right person to take responsibility, until all notification formalities are fulfilled. The question was asked for four different conditions: day time, night time, weekends and during rush hours. The assessments are shown in figure 4.1. Three experts assessed short notification time periods (several minutes) mainly caused by well organised systems. Most experts assessed longer time periods by taking alarm conditions, lack of organisation and the dynamics of power plants (fast dynamics may lead to shorter time periods) into account. Availability of persons at night might increase the time periods. 95th percentiles of the order of 2 hours were assessed by several experts. No large differences were provided for the four conditions. 4.3.2 Case B: Individual Assessments Case B1 asked: What is the time period (Torg1) for the responsible authority to a) organise the emergency services and b) let them notify the people in the various areas. No separate assessments were asked for the time period for the responsible authority to notify the emergency services (tae - tpa) and the time period for the emergency services to notify the people in the subsequent areas (tep - tae). The questions were asked for situations in which an immediate general emergency has been declared, and for various conditions: day time, night time, weekends, and during rush hours. For the areas outside the emergency planning zone the answers should include delay for assessment of current status of the accident. These areas may include large residential areas. Figures 4.2 to 4.4 provide the assessments for sheltering: in the emergency planning zone, within the 30 km zone of the site, and outside the 30 km zone. Figures 4.5 and 4.6 provide the assessments for immediate evacuation without sheltering first: in the emergency planning zone, and within the 30 km zone of the site. Figures 4.7 and 4.8 provide the assessments for delayed evacuation after a period of sheltering first: in the emergency planning zone, and within the 30 km zone of the site.
30

Organising sheltering and notifying people can take 10 minutes to 4 hours: this is the range of medians in the assessments. Seven experts gave relatively low time period assessments for the emergency planning zone (ranging from 5 minutes to two hours), while the other two experts assessed higher time periods (ranging from 2 hours up to 6 hours). Large values for the 95th percentile were mainly caused by the fact that some people cannot be reached within a short period of time and delays of 2 to 3 hours were considered very likely to reach everybody. There are relatively small differences comparing all four conditions. For the other two zones the assessments are reasonably comparable, albeit that higher time periods are expected (up to 11 hours). Decisions to act beyond the 30 km zone can take much more effort (and time) as it has large impact on (a larger) population. The picture for immediate evacuation is much the same having somewhat higher time periods (ranging from 10 minutes up to 13 hours). The time period to definitively decide to evacuate can be larger than for taking a decision on sheltering only, because of the larger impact on the population. In France, there will never be an immediate evacuation as they will always have a period of sheltering first. For delayed evacuation a similar pattern is assessed, albeit that somewhat lower time periods were expected due to the fact that authorities and most people will already be alerted because of the sheltering period prior to the announcement to evacuate. The median values for the time periods range from about 10 minutes up to about 10 hours, with 5th and 95th percentiles ranging from about 1 minute to about 48 hours. Case B2 asked: What is the time period (Torg2) for the responsible authority to a) organise the emergency services and b) let them notify the people in the various areas. No separate assessments are asked for the time period for the responsible authority to notify the emergency services (tae - tpa) and the time period for the emergency services to notify the people in the subsequent areas (tep - tae). The questions were asked for situations in which a general emergency has been declared after a period of site area emergency, and for various conditions: day time, night time, weekends, and during rush hours. For the areas outside the emergency planning zone the answers should include delay for assessment of current status of the accident. These areas may include large residential areas. Figures 4.9 to 4.11 provide the assessments for sheltering: in the emergency planning zone, within the 30 km zone of the site, and outside the 30 km zone. Figures 4.12 and 4.13 provide the assessments for immediate evacuation without sheltering first: in the emergency planning zone, and within the 30 km zone of the site. Figures 4.14 and 4.15 provide the assessments for delayed evacuation after a period of sheltering first: in the emergency planning zone, and within the 30 km zone of the site. Where a site area emergency precedes the general emergency alert, similar assessments were provided by the experts as in case B1. Generally speaking, somewhat lower time periods were expected because authorities and most people are already alerted to some extent; however one expert assessed time periods up to 40 hours (95th percentiles). In general, no large differences were given for the four conditions during the day, particularly not for rural areas, but differences might be significant for urban areas. 4.3.3 Case C: Individual Assessments Case C deals with the situation in which people are notified by the emergency services to shelter only within the area outside the emergency planing zone, but within the 30 km zone of
31

the site. The question was subdivided in three parts. Figures 4.16 through 4.19 show the range graphs for questions C1, C2, C3 (day time) and C3 (night time) respectively. Case C1 asked: What is the percentage of people not responding? A general remark made by the experts is that reliable data or studies on responses of people are not available. Furthermore it has been noted that, because radiation is not (easily) observable, people tend be difficult to convince to shelter (or evacuate). Another point is that the response of people very much depends on the quality of the information. For cases in which people stay outdoors, ignoring the notification to shelter seven experts gave medians of 5 or 10 percent, with 5th and 95th percentiles between 0.1 and 20 percent. One expert expected low percentages, with 5th and 95th percentiles of 0.1 and 2 percent, while another expert expected high values, with 5th and 95th percentiles of 20 and 65 percent. For staying outdoors, not having received the notification a similar pattern was provided by the experts. There was a wider range of median assessments, but in the same order of magnitude. For people who decide to evacuate spontaneously, in general a large range was assessed: seven experts had ranges from 1 to 50 percent, while two experts had assessed high values, ranging from 35 to 90 percent. Case C2 asked: If the notification to shelter is followed by people, how much time (Tbeh) does it take for parts of the population to implement the action, during day time only. Large differences in assessments were given. Three experts assessed low ranges for the majority of people (1 to 20 minutes). Three other experts gave somewhat higher assessments ranging from 10 to 50 minutes, while the other three experts expected high response time periods ranging from 15 minutes to 3 hours. Estimates for the response of the vast majority showed a similar pattern with higher 95th percentiles up to 5 hours. Case C3 asked about the behaviour of people when they are told to shelter, whether they will continue to shelter for the required period. The assessments showed a scattered picture. It must be taken into account that in some countries the required sheltering periods are limited and will not exceed 3 hours (Belgium and France). Most experts expected reasonable behaviour of people with around 5, 15 and 30 percent not sheltering for required periods of 3 hours, 8 hours and 12 hours (all starting in day time) respectively. For required sheltering periods of 3 hours, 8 hours and 24 hours (all starting at night time) the values were comparable. For the longest required shelter period, one expert considered that up to 80 to 90 percent of the people will leave their shelters before the end of the period. 4.3.4 Case D: Individual Assessments Case D deals with the situations in which people are notified by the emergency services to evacuate within the area outside the emergency planning zone, but within the 30 km zone of the site. Figures 4.20 through 4.26 show the range graphs of questions D1 (average conditions, at school, and under severe weather conditions), D2 (following the order to evacuate during working days, and during weekends and holidays), and D3 (not following the order to evacuate, but going their own way, during working days, and during weekends and holidays). In Sweden people are asked to evacuate in their own cars which makes it difficult to distinguish between organised evacuation and self-evacuation. Also in some cases in Germany, organised evacuations are hardly possible because of the geographical circumstances.
32
Question D1 asked for the percentages of people who do not respond to the order of an organised evacuation. Ignoring the notification to evacuate was assessed to have somewhat lower percentages than ignoring the notification to shelter: all assessments were below 15 percent. Those not receiving the message to evacuate are more comparable to those not receiving the message to shelter. The percentage of people who decide to evacuate but who do not follow the order was assessed to be rather low by most experts, ranging from 0.1 to 20 percent. Three experts assessed much higher percentages, even up to 90 percent. It must be stressed that no real data or extensive studies are available to support the assessments. Another point is whether the organised evacuation is announced as being mandatory (to follow the order) or on a voluntary basis. This question also addressed specific conditions: people at school and under severe weather conditions. Ignoring the notification at school was assessed to be rather low: up to 5 percent, one expert gave 10 percent at the most, and some experts assessed a 5th percentile of 0.01 % actually meaning zero (nobody ignores the notification). Deciding to evacuate in a different manner was assessed to be somewhat higher, up to 30 percent. Not responding under severe weather conditions, was assessed to have higher values. Ignoring the notification showed median values ranging from 1 to 20 percent, being somewhat higher (but not very much) compared to average conditions. The percentage not receiving the message was assessed to be slightly higher than under average conditions. The percentage of people deciding to evacuate on their own shows values comparable with average conditions. Question D2 asked: If the notification to evacuate is followed by people, how much time (Tbeh) does it take for parts of the population that decides for organised evacuation, to implement the action and start to evacuate in an organised way. The time period considered here ends when people start to leave their homes by the approved transport arrangements, but does not include the driving time. Evacuation only takes place in the area within 30 km of the site. Three experts gave low assessments for the majority (5 to 10 minutes) and the vast majority (10 to 20 minutes) to follow the order during working days. Four other experts assessed for these cases values in the order of 60 to 90 minutes. Two other experts assessed response times in the order of several hours, with a 95th percentile as high as 6 hours. The assessments for situations during weekends and holiday periods were rather similar but with somewhat higher 95th percentiles (up to almost 10 hours). The larger time periods are caused by people getting their families together, making the right decisions, having mobility problems (handicaps, older people), farmers not leaving their cattle behind, wanting to guard own property, and so on. Question D3 asked: When the notification to evacuate is followed by people, but some people do not follow the approved method of evacuation, how much time (Tbeh) does it take for those parts of the population evacuating by themselves to do so? The time period considered here ends when people start to leave their homes by their own transport arrangements, but does not include the driving time. Evacuation only takes place in the area within 30 km of the site. For the responses of both the majority and the vast majority of people similar assessments were provided as for the situations in which people follow the order. Median assessments were generally somewhat lower, but the 5th and 95th percentiles were similar. The reason is that evacuation by privately owned cars is more assured than by mass transit systems which require collection arrangements and assumes buses and bus drivers to be available on time.
33

4.3.5 Case E: Individual Assessments Case E deals with time periods to leave an evacuation area. In these cases, the time periods start from the time when people leave their homes to the time they are outside the contaminated zone. This time period does not include the time to prepare for evacuation (which was part of question D). Figures 4.27 through 4.32 show the range graphs of the times in questions E1 (for the emergency planning zone during day time and light traffic, during day time and heavy traffic, and during night time) and question E2 (for the 30 km zone outside the emergency planning zone during day time and light traffic, during day time and heavy traffic, and during night time). Question E1 related to leaving the emergency planning zone in three different areas: rural, suburban and urban, under three conditions (day or night and light and heavy traffic). The assessments show a large spread of time periods, very much depending on the local situations. Most experts assessed medians ranging from half an hour to one and a half hour with increasing population density and traffic. One expert assessed low values (around 10 minutes) while two other experts assessed high medians (of the order of several hours). For urban areas most people could walk out of the emergency planning zone without the need for personal vehicles or mass transit systems. Question E2 asked for the times for the area within 30 km of the site and outside the emergency planning zone. Leaving this area takes about twice as much time as leaving the emergency planning zone. 4.3.6 Case F: Individual Assessments Case F deals with time periods for people to take stable iodine tablets after being notified to do so. The assessments related only to people who were supposed to take the tablets. Figures 4.33 through 4.35 show the range graphs of the questions F1 through F3. Question F1 asked about the percentage of people not responding to the notification. Again as in previous cases, very little data or studies are available. Where people already have the tablets at home, most experts assessed low percentages: less than 10 percent, with a few exceptions. One expert expected almost no response at all: 85 to 95 percent not responding. One main reason is that tablets can get lost at home easily when distributed a longer time prior to the emergency situation. The expected behaviour in cases one has to take the tablets at distribution facilities is assessed to be somewhat better. Five experts assessed non-responses below 10 percent (highest 95th percentile in this group of experts) with very low 5th percentiles in a few cases (down to 0.001% actually meaning that nobody does not take the tablets). The four other experts assessed much higher values: up to 75 percent not responding. Question F2 asked for assessments of time periods to take the tablets, where people already have the tablets at home. At home, this can be done quickly: eight experts assessed values between 1 and 30 minutes for the majority of people to take the tablets, and between 1 and 90 minutes for the vast majority. One expert expected high time periods for the majority of people (up to 5 hours) and two experts expected high values for the vast majority (up to 6 hours). The longer 95th percentiles are mainly determined by the time lost to search for the tablets.
34

Question F3 asked for assessments of time periods to take the tablets, while having the tablets distributed at pharmacies and so on. In these cases, similar assessments were provided, but the time periods were expected to be much larger; seven experts gave values ranging from 10 minutes to 2 hours (for the majority of people) and from 10 minutes to 3 hours (for the vast majority of people). The two other experts assesed 95th percentiles as high as 10 hours (for the majority of people) and 12 hours (for the vast majority of people). 4.3.7 Correlations: Individual Assessments Seven experts provided data on correlations. One expected no correlations in any case, and one only expected small correlations in a few cases. Two experts expected some correlations (small conditional probabilities) and three expected strong correlations in several cases. 4.4 Summary of Aggregated Results This section presents the results of the equal-weighted aggregation of the individual elicited distributions into single distributions over each elicited parameter. The results are shown in Appendix E. It must be stressed here that each expert provided assessments very much related to local circumstances. For that reason, aggregation of all assessments is justified only if we assume that the group of experts sufficiently covered the range of situations in the whole of Europe. Case A results: The assessed median values for notifying the authorities by plant personnel in cases of an emergency situation were between 20 and 30 minutes (from day time to weekends) with a range factor of 30 to 40, indicating a large spread in individual assessments. Case B results: Organising emergency services and notifying the threatened population takes more time. For general emergency situations: For sheltering in the emergency planning zone the medians were of the order of 70 to 90 minutes with range factors of 30 to 50. For the next area up to 30 km it takes 75 to 140 minutes (with larger range factors: 50 to 60). Beyond that area 90 to 200 minutes are needed (with similar range factors). For immediate evacuation without sheltering first, the time periods were larger: 85 to 110 minutes for the emergency planning zone and 80 to 450 minutes (with range factors over 100) for the zone up to 30 km. For delayed evacuation both zones were expected to need much shorter time periods: around 55 and 90 minutes respectively (with lower range factors: around 25). For a general emergency situation after a period of site area emergency the time periods were somewhat different. For sheltering in the three zones distinguished the times were around 30 minutes, 100 minutes and 140 minutes respectively, with range factors of the order of 35, 300 and 400. For immediate evacuation the time periods were around 50 minutes and 400 minutes for both zones, while for delayed evacuation these periods were around 60 minutes and 200 minutes respectively (with range factors varying between 20 and 160). Case C results: For sheltering, the median values for the percentage of people ignoring the notification, not having received the notification, and deciding to evacuate spontaneously were around 7, 9 and 21 percent respectively. The range factors vary considerably: 70, 270 and 30 respectively, particularly indicating large differences in the assessments of the second category. The time period to respond was expected to be around 25 and 50 minutes for the majority and the vast majority of people (with range factors of about 50). The percentage of people expected to leave their shelters too soon almost doubled as the required sheltering
35

period increases from 3 to 8 and then to 12 hours, for sheltering starting in day time: the median values are 7, 15 and 28 percent (range factors of about 20). For sheltering started in night time, these percentages almost triple: the median values are 3.6, 10 and 31 percent respectively (with range factors in the order of 50, 20 and 10 respectively). Case D results: For organised evacuation, the median values for percentage of people ignoring the notification, not having received the notification, and not following the order were around 5, 7 and 10 percent respectively. The range factors again varied considerably: around 25, 40 and 200 respectively. At schools the percentage of people ignoring the notification, and not following the right order had medians of 1 and 3 percent with range factors of 576 and 1330, indicating very large differences in individual assessments. Under severe weather conditions, the percentages were not much higher than under average conditions: 6 to 11 percent. If the notification to evacuate is followed, there was expected to be no difference in the time period to follow the order, on working days or on weekends and holidays: 50 minutes for the majority of people and 80 minutes for the vast majority. Range factors were around 50. If people do evacuate but on their own way, the time periods decrease to about 20 and 40 minutes for the majority and vast majority of people respectively. Case E results: For driving (or walking) times for evacuation the following aggregated data were found. Leaving the emergency planning zone takes about 25 minutes for rural and suburban areas with light traffic at day time. Leaving an urban area takes about 43 minutes. If the traffic becomes heavy, the leaving times increase to about 30, 50 and 90 minutes for rural, suburban and urban areas respectively. At night, the leaving times are similar to light traffic at day time. Leaving the next zone, up to 30 km from the site, takes an additional 37, 56 and 87 minutes for rural, suburban and urban areas respectively, in cases of light traffic in day time. For heavy traffic, these times increase to 52, 100 and 145 minutes respectively. During the night, the times are also more similar to light traffic at day time: 40, 63 and 91 minutes respectively. The range factors are between 12 and 24 for all cases except one (40). Case F results: If tablets are kept at home, it was expected that about 7 percent of the people who should take the tablets (range factor is 199) will not do so, while for taking tablets at distribution facilities this percentage was about 5 (range factor is 6680). Both cases showed large differences in opinions expressed in the individual assessments with some experts including the possibility that no-one takes the tablets. If people want to take the tablets, it takes about 11 and 25 minutes for the majority and vast majority of people to do so once having the tablets at home already. The range factors are 83 and 130 indicating the problem of finding the tablets at home. If the tablets have to be collected at distribution facilities, it takes 48 and 70 minutes respectively, with lower range factors (34 and 60), indicating possible queuing at these facilities. Correlations: Appendix E also contains the aggregated data for the assessed dependencies. Although in some cases, individual assessments of dependencies can be as high as 0.9 or 1, and as low as 0.1, the average values are all around 0.5 (showing no dependence) or somewhat above or below that value (showing low dependencies in some cases).
36

4.5 Comparison of Results from Current Study with Code-Calculated Values The current version of COSYMA includes default values for the countermeasures parameters. In this section, some of the COSYMA default values are compared with aggregated values obtained from the experts’ panel on emergency actions. The time sequence referred to in this section, is explained in section 3.2.2. It should be noted that the default values of the code can easily be changed by the user. Sheltering: The model assumes a delay time between the end of the chain reaction and the time when sheltering is implemented by the population; the default value is 2 hours. In the questionnaire this time period might be best approximated by the sum of the time period to notify the authorities (Tnot), the time period to organise emergency services for sheltering (Torg) and the time period for people to respond to the notification to shelter (Tbeh). For the vast majority (95 %) of the people the median values of the total time periods assessed are 136 minutes, 145 minutes and 159 minutes for the emergency planning zone, the zone within 30 km around the site and the zone beyond 30 km of the site respectively. The assessed values correspond well with the COSYMA default value of 2 hours (120 minutes) for all emergency zones. It should be taken into account that the start of the delay time used in COSYMA may not coincide exactly with the time point to declare a general emergency. The percentage of people following the decision to shelter is in COSYMA assumed to be 60%; 30% are assumed to self-evacuate, 10% to stay outdoors. The median assessments are derived from the questions under C1: 63% shelters, 21% self-evacuates and 16% stays outdoors (ignores the notification or does not receive the notification). Evacuation: Before people are evacuated they are assumed to shelter; thus the delay between the end of the chain reaction and the start of evacuation is the sum of the initial delay for sheltering plus the duration of the sheltering period which is assumed to be 4 hours in the evacuation area. In the questionnaire sheltering periods of 3 hours, 8 hours and 12 hours (during day time) and 3 hours, 8 hours and 24 hours (starting during night time) were asked. For the 3 hours sheltering period, 6.7% (day time) and 3.6% (night time) of the sheltered people leave their shelters prior to the requested 3 hours. Furthermore, the experts assessed that 11.6% of the people will not evacuate at all. Of the other 88.5% about 10% does not follow the order, but evacuates on their own way. In COSYMA all people are assumed to evacuate (i.e. also those not sheltering). The experts also assessed a delay time between the moment of a general emergency in the plant and the moment people are actually ready to evacuate. That delay time is the sum of the time period to notify the authorities (Tnot), the time period to organise emergency services for evacuation after a first period of shelter (Torg), and the time period for people to respond to the notification to evacuate (Tbeh). The median values of the experts’ assessments of the delay time for the vast majority of people (95%) are 154 and 179 minutes for evacuations out of the emergency planning zone and out of the 30 km zone around the site respectively, when people follow the order to evacuate. In cases people do not follow the order but evacuate on their own way, the medians of the delay time are 112 and 137 minutes. COSYMA calculates with a delay time for all zones of 2 hours (120 minutes).
37

Administration of stable iodine tablets: The intake of stable iodine tablets is, in COSYMA, assumed to be 2 hours after the end of the chain reaction in a geometrically defined area and 4 hours after the end of the chain reaction in a dose-based area. The experts only assessed the response time of people to take in the tablets, and did not consider the time required by the authority to inform people that they should take tablets. Therefore the COSYMA default values are not strictly equivalent to the times provided by the experts. For the vast majority of people (95% of the people who are willing to take tablets) the median values are 25 minutes (if the tablets are already at home) and 70 minutes (if the tablets have to be collected at a distribution facility) respectively. A relatively low percentage of people is assumed not to take tablets: 7.4% (if the tablets are already in the home) and 4.8% (if the tablets have to be collected). In COSYMA all people are assumed to take the tablets. Driving times to leave the evacuation area: The spectrum of individual driving times for leaving the evacuation area is approximated by four 3-step distribution functions. Each distribution function applies for a certain range of the population density within the evacuation area. It consists of three different values, each for a certain fraction of the population. The driving times can be chosen separately for two distance ranges depending on the outermost radius of the evacuation area (inside and outside 5.6 km). For the self-evacuating people the driving times of the next lower population density group are applied if the fraction of this population group is less than 50%. The data are given in tables 4.1 and 4.2. Table 4.1 Driving times for outer radius of evacuation area <= 5.6 km applied in COSYMA calculations population density
<= 1000 p/km² population density <= 5000 p/km²
Population density <= 10000 p/km²
population density > 10000 p/km²
group fraction driving time fraction driving time fraction driving time fraction driving time 1 0.10 13 min 0.10 25 min 0.10 70 min 0.10 160 min 2 0.40 11 min 0.40 18 min 0.40 50 min 0.40 110 min 3 0.50 6 min 0.50 8 min 0.50 15 min 0.50 25 min
Table 4.2 Driving times for outer radius of evacuation area > 5.6 km applied in COSYMA calculations population density
<= 1000 p/km² population density <= 5000 p/km²
population density <= 10000 p/km²
population density > 10000 p/km²
group fraction driving time fraction driving time fraction driving time fraction driving time 1 0.10 14 min 0.10 50 min 0.10 125 min 0.10 500 min 2 0.40 12 min 0.40 35 min 0.40 85 min 0.40 290 min 3 0.50 6 min 0.50 12 min 0.50 15 min 0.50 60 min
The questions of the driving times were asked in a slightly different manner. The fractions of the COSYMA table can be derived from the quantile points of the assessments: the median values correspond to the fraction of 0.5, the 95th percentile values should be somewhat larger than the values of the fraction of 0.4. Furthermore the population densities were not specified
38

in the questionnaire, but three distinct areas were defined: rural, suburban and urban areas. The questions referred to driving out of the emergency planning zone (5 km which coincides reasonably with 5.6 km in COSYMA) and out of the next zone (which is within 30 km of the site). The evacuation area is not specified in COSYMA. Table 4.3 and 4.4 show the data from the aggregated experts’ assessments for both emergency zones and light traffic on day time. Other assessments were made for heavy traffic on day time and for traffic at night (see cases E1 and E2). Table 4.3 Driving times of evacuation for the emergency planning zone (radius = 5 km) as assessed by the experts for light traffic in day time. Rural area Suburban area Urban area Group Quantile Driving time Quantile Driving time Quantile Driving time 1 0.95 126 min 0.95 107 min 0.95 140 min 2 0.50 26 min 0.50 27 min 0.50 43 min Table 4.4 Driving times of evacuation for the zone outside the emergency planning zone (radius = 30 km) as assessed by the experts. Rural area Suburban area Urban area Group Quantile Driving time Quantile Driving time Quantile Driving time 1 0.95 154 min 0.95 217 min 0.95 235 min 2 0.50 37 min 0.50 56 min 0.50 87 min The assessed values (which are larger for heavy traffic in day time) tend to be larger in all cases. The default values in COSYMA are considerably lower than the experts’ values. Apart from that the experts also assessed the time period for people to prepare for evacuation prior to actually leaving or driving out of the evacuation area. It takes the vast majority of people about 80 minutes (median value) for organised evacuation and 20 minutes for self-evacuation (cases D2 and D3). This time period is already taken into the delay time for evacuations mentioned earlier in section 4.5. Conclusions: The default values used in the COSYMA calculations tend to agree reasonably with the experts’ aggregated assessments for sheltering and evacuation. The default values for the driving times appear to be somewhat optimistic. COSYMA does not allow for some of the population ignoring the instructions for all emergency actions.
39

Range graph of input data Item no. : 1 Item name: A1-day time Scale : UNI Experts 1 [———#————————] 2 [—#—] 3 [#—] 4 [———————#—————————————————————————————————————] 5 [————————————#————————————] 6 [—#———————] 7 [—————————#—————————————————————————] 8 #] 9 [————————————#—————————————————————————————————————————————————] DM [•••••••#••••••••••••••••••••••••••••••••••••••••••••] ——————————————————————————————————————————————————————————————————————————— 2.0 1.800E+0002 Range graph of input data Item no. : 2 Item name: A1-night time Scale : UNI Experts 1 [—————————#————————] 2 [——#——] 3 [#———] 4 [———————————#————————————————————————————————————————————————————————] 5 [—————————#————————] 6 [——#————————————] 7 [——————#———————————————————————————] 8 [———#——] 9 [—————————#——————————————————————————————————————————————] DM [•••••••••••#••••••••••••••••••••••••••••••••••••••••••••••••] ——————————————————————————————————————————————————————————————————————————— 2.0 1.200E+0002 Range graph of input data Item no. : 3 Item name: A1-weekend Scale : UNI Experts 1 [—————————#————————] 2 [———#——] 3 [#———] 4 [———————————#————————————————————————————————————————————————————————] 5 [—————————#————————] 6 [——#————————————] 7 [—————————————————————————#——————————————————————————————————————————————] 8 [——————#————————] 9 [—————————————————————————————————————#——————————————————] DM [•••••••••••••••#•••••••••••••••••••••••••••••••••••••••••••••••••••] ——————————————————————————————————————————————————————————————————————————— 2.0 1.200E+0002 Range graph of input data Item no. : 4 Item name: A1-rush hours Scale : UNI Experts 1 [——————#—————] 2 [—#—] 3 [#—] 4 [———————#—————————————————————————————————————] 5 [—————#——————] 6 [—#————————] 7 [—————————#—————————————————————————] 8 [———#—————] 9 [————————————#—————————————————————————————————————————————————] DM [•••••••••#••••••••••••••••••••••••••••••••••••••••••] ——————————————————————————————————————————————————————————————————————————— 2.0 1.800E+0002
Figure 4.1. Case A: Range graphs of time period required to notify any authority by plant personnel during, day time (top), night time (middle above), weekend (middle below) and rush hours (bottom)
40

Range graph of input data Item no. : 5 Item name: B1-sh-epz-day Scale : UNI Experts 1 [—#———] 2 [———————————#————————————] 3 [#———] 4 [—————#——————] 5 [—————#——————] 6 [———#——————————————————] 7 [—————#————————] 8 [———#—] 9 [——————————————————#————————————————————————] DM [••••••••••••#••••••••••••••••••••••••••••••••••••••••••••••] ——————————————————————————————————————————————————————————————————————————— 5.0 3.600E+0002 Range graph of input data Item no. : 6 Item name: B1-sh-epz-nigh Scale : UNI Experts 1 [———#———] 2 [—————————————————————————#———————————] 3 [—#————] 4 [—————#——————] 5 [—————#——————] 6 [————#—————————————————————————————] 7 [————————#—————] 8 [—#——] 9 [———————————#————————————] DM [••••••••••••••#•••••••••••••••••••••••••••••••••••••••••••••••••] ——————————————————————————————————————————————————————————————————————————— 5.0 3.600E+0002 Range graph of input data Item no. : 7 Item name: B1-sh-epz-wen Scale : UNI Experts 1 [——#——] 2 [——————————————————#—————————————————] 3 #——] 4 [—————————#—————————————————————————————————————] 5 [————#————] 6 [———#——————————————————————] 7 [————#——————] 8 [—#—] 9 [——————————————————#—————————] DM [•••••••••••#•••••••••••••••••••••••••••••••••••••••••••••••••••] ——————————————————————————————————————————————————————————————————————————— 5.0 4.800E+0002 Range graph of input data Item no. : 8 Item name: B1-sh-epz-rush Scale : UNI Experts 1 [———#———] 2 [—————#—————] 3 [#———] 4 [————————————#————————————————————————] 5 [—————#——————] 6 [————#—————————————————————————————] 7 [—————#————————] 8 [———#———] 9 [——————————————————#————————————————————————] DM [•••••••••••••••••#•••••••••••••••••••••••••••••••••••••••••••] ——————————————————————————————————————————————————————————————————————————— 5.0 3.600E+0002
Figure 4.2. Case B1: Range graphs of time period for the responsible authority to organise emergency services and to notify people for sheltering in the emergency planning zone, during day time (top), night time (middle above), weekend (middle below) and rush hours (bottom)
41

Range graph of input data Item no. : 9 Item name: B1-sh-<30-day Scale : UNI Experts 1 [—#———————————————] 2 [——————————#—————————] 3 #———] 4 [————#——————————] 5 [——————————#——————————] 6 [————————#—————————————————————] 7 [———————#——————————] 8 [——#—] 9 [———————————————#—————————————————————] DM [•••••••••••#•••••••••••••••••••••••••••••••••••••••••••••••••••••••] ——————————————————————————————————————————————————————————————————————————— 5.0 4.200E+0002 Range graph of input data Item no. : 10 Item name: B1-sh-<30-nigh Scale : UNI Experts 1 [——————————————————————————————————————#———————————————————————————] 2 [—————————————#—————] 3 [#——] 4 [———#——————] 5 [————————————#—————————————] 6 [————————#————————————————] 7 [———————#——————] 8 [#] 9 [————————————#——————] DM [••••••••••••#••••••••••••••••••••••••••••••••••••••••••••••••••••••••] ——————————————————————————————————————————————————————————————————————————— 5.0 6.600E+0002 Range graph of input data Item no. : 11 Item name: B1-sh-<30-wend Scale : UNI Experts 1 [——————————————————————————————————————————#—————————————————————————————] 2 [——————————#———————] 3 #——] 4 [——#———————] 5 [—————————————————————#——————————————————————] 6 [—————————#——————————————————] 7 [————#———————] 8 [#] 9 [——————————————#——————] DM [••••••••••••#••••••••••••••••••••••••••••••••••••••••••••••••••••] ——————————————————————————————————————————————————————————————————————————— 5.0 6.000E+0002 Range graph of input data Item no. : 12 Item name: B1-sh-<30-rush Scale : UNI Experts 1 [————————————————#—————————] 2 [—————————#————] 3 #———] 4 [————#—————————] 5 [—————————#—————————] 6 [——————————————————#—————————————————————————————] 7 [———————#—————————] 8 [——#——] 9 [——————————————#———————————————————] DM [••••••••••••••••••••••#•••••••••••••••••••••••••••••••••••••••••••••••] ——————————————————————————————————————————————————————————————————————————— 5.0 4.500E+0002
Figure 4.3. Case B1: Range graphs of time period for the responsible authority to organise emergency services and to notify people for sheltering in the area outside the emergency planning zone, but within 30 km of the site, during day time (top), night time (middle above), weekend (middle below) and rush hours (bottom)
42

Range graph of input data Item no. : 13 Item name: B1-sh->30-day Scale : UNI Experts 1 [—#———————————————] 2 [——————————#—————————] 3 #———] 4 5 6 [——————————#——————————————————————————] 7 [———————————————————————#——————————————————] 8 [——#—] 9 [———————————————#—————————————————————] DM [••••••••••••••#••••••••••••••••••••••••••••••••••••••••••••••••••••••] ——————————————————————————————————————————————————————————————————————————— 5.0 4.200E+0002 Range graph of input data Item no. : 14 Item name: B1-sh->30-nigh Scale : UNI Experts 1 [——————————————————————————————————————#———————————————————————————] 2 [—————————————#—————] 3 [#——] 4 5 6 [———————#———————————————————] 7 [————————————————————#—————————————] 8 [#] 9 [————————————#——————] DM [•••••••••••••••••••••#••••••••••••••••••••••••••••••••••••••••••••••••] ——————————————————————————————————————————————————————————————————————————— 5.0 6.600E+0002 Range graph of input data Item no. : 15 Item name: B1-sh->30-wend Scale : UNI Experts 1 [——————————————————————————————————————————#—————————————————————————————] 2 [——————————#———————] 3 #——] 4 5 6 [————————#——————————————————————] 7 [—————————————————————#——————————————] 8 [#] 9 [——————————————#——————] DM [•••••••••••••••••••••••#•••••••••••••••••••••••••••••••••••••••••] ——————————————————————————————————————————————————————————————————————————— 5.0 6.000E+0002 Range graph of input data Item no. : 16 Item name: B1-sh->30-rush Scale : UNI Experts 1 [————————————————#—————————] 2 [—————————#————] 3 #———] 4 5 6 [———————————————————#———————————————————————————————————————] 7 [—————————————————————#—————————————————] 8 [——#——] 9 [——————————————#———————————————————] DM [•••••••••••••••••••••••••#•••••••••••••••••••••••••••••••••••••••••••••] ——————————————————————————————————————————————————————————————————————————— 5.0 4.500E+0002
Figure 4.4. Case B1: Range graphs of time period for the responsible authority to organise emergency services and to notify people for sheltering in the area outside the 30 km zone of the site, during day time (top), night time (middle above), weekend (middle below) and rush hours (bottom)
43

Range graph of input data Item no. : 17 Item name: B1-ie-epz-day Scale : UNI Experts 1 [—#—] 2 [———————#——————] 3 [—#——] 4 [———#——] 5 6 [——#—————————————] 7 [———#—————] 8 [——————————————#———————] 9 [——————————————————————#—————————————————————] DM [••••••••#•••••••••••••••••••••••••••••••••••••••••••••••••••••] ——————————————————————————————————————————————————————————————————————————— 10.0 6.000E+0002 Range graph of input data Item no. : 18 Item name: B1-ie-epz-nigh Scale : UNI Experts 1 [——#] 2 [———————————#————] 3 [—#—] 4 [—————#———————————] 5 6 [———#—————————————] 7 [———#——] 8 [——————————#———————————] 9 [——————————————————————#——————————————————————] DM [•••••••#•••••••••••••••••••••••••••••••••••••••••••••••••••••] ——————————————————————————————————————————————————————————————————————————— 10.0 7.800E+0002 Range graph of input data Item no. : 19 Item name: B1-ie-epz-wend Scale : UNI Experts 1 [——#] 2 [—————#——————————] 3 [#—] 4 [—————#———————————] 5 6 [———#—————————————] 7 [——#———] 8 [——————————#———————————] 9 [——————————————————————#——————————————————————] DM [••••••••#•••••••••••••••••••••••••••••••••••••••••••••••••••••] ——————————————————————————————————————————————————————————————————————————— 10.0 7.800E+0002 Range graph of input data Item no. : 20 Item name: B1-ie-epz-rush Scale : UNI Experts 1 [——#—] 2 [——————————#———] 3 [—#——] 4 [——————#———————————————] 5 6 [—————————#——————————————————] 7 [———#—————] 8 9 [——————————————————————#—————————————————————] DM [••••••••#••••••••••••••••••••••••••••••••••••••••••••••••••••••] ——————————————————————————————————————————————————————————————————————————— 10.0 6.000E+0002
Figure 4.5. Case B1: Range graphs of time period for the responsible authority to organise emergency services and to notify people for immediate evacuation in the emergency planning zone, during day time (top), night time (middle above), weekend (middle below) and rush hours (bottom)
44

Range graph of input data Item no. : 21 Item name: B1-ie-<30-day Scale : UNI Experts 1 [——————————————————#————————————————————————————————————] 2 [—————#——————] 3 #] 4 5 6 [—#———] 7 [#—] 8 9 [———————#————————] DM [•••••••#•••••••••••••••••••••••••••••••••••••••••••••••••••] ——————————————————————————————————————————————————————————————————————————— 1.0 2.880E+0003 Range graph of input data Item no. : 22 Item name: B1-ie-<30-nigh Scale : UNI Experts 1 [—————————————#————————————————————————————————————] 2 [—————————#—————] 3 #] 4 5 6 [—#————] 7 [#—] 8 9 [———————#————————————] DM [••••••••••#•••••••••••••••••••••••••••••••••••••••••••••••••] ——————————————————————————————————————————————————————————————————————————— 15.0 2.880E+0003 Range graph of input data Item no. : 23 Item name: B1-ie-<30-wend Scale : UNI Experts 1 [—————————————#————————————————————————————————————] 2 [—————#—————] 3 | 4 5 6 [—#————] 7 #—] 8 9 [———————#————————————] DM [••••••••••#•••••••••••••••••••••••••••••••••••••••••••••••••] ——————————————————————————————————————————————————————————————————————————— 15.0 2.880E+0003 Range graph of input data Item no. : 24 Item name: B1-ie-<30-rush Scale : UNI Experts 1 [—————————————#————————————————————————————————————] 2 [—————#——————] 3 | 4 5 6 [———#————] 7 #—] 8 9 [———————#————————] DM [•••••••#•••••••••••••••••••••••••••••••••••••••••••••••••••] ——————————————————————————————————————————————————————————————————————————— 15.0 2.880E+0003
Figure 4.6. Case B1: Range graphs of time period for the responsible authority to organise emergency services and to notify people for immediate evacuation in the area outside the emergency planning zone, but within 30 km of the site, during day time (top), night time (middle above), weekend (middle below) and rush hours (bottom)
45

Range graph of input data Item no. : 25 Item name: B1-de-epz-day Scale : UNI Experts 1 [———#———] 2 [————————————#————————————] 3 [——#———] 4 [——#—————] 5 [—————#——————] 6 [———#——————————————] 7 [—#———————] 8 [—————#——————] 9 [——————————————————#————————————————————————] DM [•••••••#••••••••••••••••••••••••••••••••••••••••••••••••••••] ——————————————————————————————————————————————————————————————————————————— 10.0 3.600E+0002 Range graph of input data Item no. : 26 Item name: B1-de-epz-nigh Scale : UNI Experts 1 [———————#————] 2 [——————————————————————————————#——————————————] 3 [————#————] 4 [———#——————] 5 [———————#——————] 6 [————#——————————————————————————————] 7 [—#—————————] 8 [——————#———————] 9 [——————————————#———————————————] DM [•••••••••••#••••••••••••••••••••••••••••••••••••••••••••••••••••••••••] ——————————————————————————————————————————————————————————————————————————— 10.0 3.000E+0002 Range graph of input data Item no. : 27 Item name: B1-de-epz-wend Scale : UNI Experts 1 [—————#——] 2 [—————————————————————#————————————————————] 3 [——#———] 4 [——#—————] 5 [————#—————] 6 [——#—————————————————————] 7 [#———————] 8 [—————#————] 9 [—————————————————————#——————————] DM [•••••••#••••••••••••••••••••••••••••••••••••••••••••••••••••••] ——————————————————————————————————————————————————————————————————————————— 10.0 4.200E+0002 Range graph of input data Item no. : 28 Item name: B1-de-epz-rush Scale : UNI Experts 1 [—————#—] 2 [—————#—————] 3 [——#———] 4 [——#—————] 5 [—————#——————] 6 [——————#————————————————————————————] 7 [—#———————] 8 9 [——————————————————#————————————————————————] DM [••••••••#•••••••••••••••••••••••••••••••••••••••••••••••••••••] ——————————————————————————————————————————————————————————————————————————— 10.0 3.600E+0002
Figure 4.7. Case B1: Range graphs of time period for the responsible authority to organise emergency services and to notify people for delayed evacuation after a period of sheltering in the emergency planning zone, during day time (top), night time (middle above), weekend (middle below) and rush hours (bottom)
46

Range graph of input data Item no. : 29 Item name: B1-de-<30-day Scale : UNI Experts 1 [———#————————————————] 2 [————————————#————————————] 3 [——#———] 4 5 6 [————————#—————————————————————————] 7 [——#——————————————————] 8 9 [——————————————————#—————————————————————————] DM [••••••••••••#•••••••••••••••••••••••••••••••••••••••••••••••••••••••••] ——————————————————————————————————————————————————————————————————————————— 15.0 3.600E+0002 Range graph of input data Item no. : 30 Item name: B1-de-<30-nigh Scale : UNI Experts 1 [———#————————————————] 2 [———————————————#——————] 3 [——#—] 4 5 6 [————————#——————————————————] 7 [#———————————] 8 9 [———————#——————] DM [•••••••••#••••••••••••••••••••••••••••••••••••••••••••••••••••••••••••] ——————————————————————————————————————————————————————————————————————————— 15.0 6.000E+0002 Range graph of input data Item no. : 31 Item name: B1-de-<30-wend Scale : UNI Experts 1 [————#————————————————————] 2 [——————————————#————————] 3 [—#——] 4 5 6 [———————————#———————————————————————] 7 [—#—————————————] 8 9 [——————————————————#—————————] DM [••••••••••••#••••••••••••••••••••••••••••••••••••••••••••••••••••••••] ——————————————————————————————————————————————————————————————————————————— 15.0 4.800E+0002 Range graph of input data Item no. : 32 Item name: B1-de-<30-rush Scale : UNI Experts 1 [—————#————————————] 2 [————————————————#————] 3 [—#———] 4 5 6 [——————————————————#————————————————————————————————] 7 [—#————————————————] 8 9 [———————————————#—————————————————————] DM [•••••••••••••#•••••••••••••••••••••••••••••••••••••••••••••••••••••••••] ——————————————————————————————————————————————————————————————————————————— 15.0 4.200E+0002
Figure 4.8. Case B1: Range graphs of time period for the responsible authority to organise emergency services and to notify people for delayed evacuation after a period of sheltering in the area outside the emergency planning zone, but within 30 km of the site, during day time (top), night time (middle above), weekend (middle below) and rush hours (bottom)
47

Range graph of input data Item no. : 33 Item name: B2-sh-epz-day Scale : UNI Experts 1 [———#———————] 2 [————————————#————————————————————————] 3 [#—————] 4 [—————#————————————] 5 [#————] 6 [————#————————————————————————————] 7 [—————#————————————] 8 [—#———] 9 [———————————————————————————————#————————————————————————] DM [••••••••#••••••••••••••••••••••••••••••••••••••••••••••••••••••••] ——————————————————————————————————————————————————————————————————————————— 3.0 1.800E+0002 Range graph of input data Item no. : 34 Item name: B2-sh-epz-nigh Scale : UNI Experts 1 [————#————] 2 [—————————————————————————————#——————————————] 3 [#————] 4 [———#——————] 5 [#] 6 [—#—————————————————————————] 7 [———#——————] 8 [#——] 9 [——————————————————#——————————————] DM [•••••#••••••••••••••••••••••••••••••••••••••••••••••••••••••••••] ——————————————————————————————————————————————————————————————————————————— 5.0 3.000E+0002 Range graph of input data Item no. : 35 Item name: B2-sh-epz-wend Scale : UNI Experts 1 [——#———] 2 [—————————————————————#————————————————————] 3 #——] 4 [—#—————] 5 [—#] 6 [—#—————————————————] 7 [—#—————] 8 [#] 9 [—————————————#—————————] DM [••••#•••••••••••••••••••••••••••••••••••••••••••••••••••••••] ——————————————————————————————————————————————————————————————————————————— 3.0 4.200E+0002 Range graph of input data Item no. : 36 Item name: B2-sh-epz-rush Scale : UNI Experts 1 [——————#——————] 2 [——————————#—————————] 3 [#————] 4 5 [————#—] 6 [———#———————————————————————————————————] 7 [————#——————————] 8 [—————#————] 9 [——————————————————————————#—————————————————————] DM [••••••••••••••#•••••••••••••••••••••••••••••••••••••••••••••••••••••] ——————————————————————————————————————————————————————————————————————————— 3.0 2.100E+0002
Figure 4.9. Case B2: Range graphs of time period for the responsible authority to organise emergency services and to notify people for sheltering in the emergency planning zone, during day time (top), night time (middle above), weekend (middle below) and rush hours (bottom)
48

Range graph of input data Item no. : 37 Item name: B2-sh-<30-day Scale : UNI Experts 1 [——————————————————#————————————————————————————————————] 2 [#—] 3 | 4 [#—] 5 #] 6 #——] 7 [#] 8 | 9 [—#—] DM [•#••••••••••••••••••••••••••••••••••••••••••••••••••] ——————————————————————————————————————————————————————————————————————————— 3.0 2.880E+0003 Range graph of input data Item no. : 38 Item name: B2-sh-<30-nigh Scale : UNI Experts 1 [—————————————#————————————————————————————————————] 2 [——#—] 3 | 4 [#—] 5 #] 6 [#—] 7 [#] 8 | 9 [—#—] DM [•#••••••••••••••••••••••••••••••••••••••••••••••••••] ——————————————————————————————————————————————————————————————————————————— 5.0 2.880E+0003 Range graph of input data Item no. : 39 Item name: B2-sh-<30-wend Scale : UNI Experts 1 [—————————————#————————————————————————————————————] 2 [—#—] 3 | 4 #——] 5 #] 6 [#—] 7 [#] 8 | 9 [—#—] DM [•#••••••••••••••••••••••••••••••••••••••••••••••••••] ——————————————————————————————————————————————————————————————————————————— 3.0 2.880E+0003 Range graph of input data Item no. : 40 Item name: B2-sh-<30-rush Scale : UNI Experts 1 [—————————————#————————————————————————————————————] 2 [—#] 3 | 4 5 #] 6 [#——] 7 [#] 8 [] 9 [—#—] DM [••#•••••••••••••••••••••••••••••••••••••••••••••••••••] ——————————————————————————————————————————————————————————————————————————— 3.0 2.880E+0003
Figure 4.10. Case B2: Range graphs of time period for the responsible authority to organise emergency services and to notify people for sheltering in the area outside the emergency planning zone, but within 30 km of the site, during day time (top), night time (middle above), weekend (middle below) and rush hours (bottom)
49

Range graph of input data Item no. : 41 Item name: B2-sh->30-day Scale : UNI Experts 1 [———————————#—————————————————————————————————————————————————] 2 [#] 3 | 4 #———] 5 [#] 6 [#—] 7 #—] 8 | 9 [—#] DM [•#••••••••••••••••••••••••••••••••••••••••••••••] ——————————————————————————————————————————————————————————————————————————— 3.0 4.320E+0003 Range graph of input data Item no. : 42 Item name: B2-sh->30-nigh Scale : UNI Experts 1 [————————#—————————————————————————————————————————————————] 2 [—#] 3 | 4 #———] 5 [#] 6 [#——] 7 [#] 8 | 9 [—#] DM [•#••••••••••••••••••••••••••••••••••••••••••••••] ——————————————————————————————————————————————————————————————————————————— 5.0 4.320E+0003 Range graph of input data Item no. : 43 Item name: B2-sh->30-wend Scale : UNI Experts 1 [————————#—————————————————————————————————————————————————] 2 [—#] 3 | 4 #———] 5 [#] 6 [#——] 7 #—] 8 | 9 [—#] DM [•#••••••••••••••••••••••••••••••••••••••••••••••] ——————————————————————————————————————————————————————————————————————————— 3.0 4.320E+0003 Range graph of input data Item no. : 44 Item name: B2-sh->30-rush Scale : UNI Experts 1 [————————#—————————————————————————————————————————————————] 2 [] 3 | 4 #———] 5 [#] 6 [—#———] 7 #—] 8 [] 9 [—#] DM [•#••••••••••••••••••••••••••••••••••••••••••••••] ——————————————————————————————————————————————————————————————————————————— 3.0 4.320E+0003
Figure 4.11. Case B2: Range graphs of time period for the responsible authority to organise emergency services and to notify people for sheltering in the area outside the 30 km zone of the site, during day time (top), night time (middle above), weekend (middle below) and rush hours (bottom)
50

Range graph of input data Item no. : 45 Item name: B2-ie-epz-day Scale : UNI Experts 1 [——#——————] 2 [——————————————#———————] 3 [—#————] 4 [———#——————] 5 6 [————#—————————————————] 7 [———#——————] 8 [——————#———————] 9 [——————————————————————#——————————————————————————————] DM [•••••••#•••••••••••••••••••••••••••••••••••••••••••••••••••] ——————————————————————————————————————————————————————————————————————————— 10.0 3.000E+0002 Range graph of input data Item no. : 46 Item name: B2-ie-epz-nigh Scale : UNI Experts 1 [————#—————————] 2 [—————————————————————————#———————————] 3 [——#———] 4 [—————#—————————————————————————] 5 6 [———#—————————————————————————] 7 [——#—————] 8 [—————#——————] 9 [——————————————————#—————————————————————————] DM [•••••••#••••••••••••••••••••••••••••••••••••••••••••••••••••••••••] ——————————————————————————————————————————————————————————————————————————— 10.0 3.600E+0002 Range graph of input data Item no. : 47 Item name: B2-ie-epz-wend Scale : UNI Experts 1 [————#—————————] 2 [————————————#————————————————————————] 3 [—#———] 4 [—————#————————————] 5 6 [———#—————————————————————————] 7 [——#—————] 8 [—————#——————] 9 [——————————————————#—————————————————————————] DM [••••••••#••••••••••••••••••••••••••••••••••••••••••••••••••••] ——————————————————————————————————————————————————————————————————————————— 10.0 3.600E+0002 Range graph of input data Item no. : 48 Item name: B2-ie-epz-rush Scale : UNI Experts 1 [——————#——————————] 2 [——————#———————————————] 3 [—#————] 4 5 6 [————————#—————————————————————————————————] 7 [———#——————] 8 9 [——————————————————————#——————————————————————————————] DM [••••••••••#••••••••••••••••••••••••••••••••••••••••••••••••••••] ——————————————————————————————————————————————————————————————————————————— 10.0 3.000E+0002
Figure 4.12. Case B2: Range graphs of time period for the responsible authority to organise emergency services and to notify people for immediate evacuation in the emergency planning zone, during day time (top), night time (middle above), weekend (middle below) and rush hours (bottom)
51

Range graph of input data Item no. : 49 Item name: B2-ie-<30-day Scale : UNI Experts 1 [——————————————————#————————————————————————————————————] 2 [—————#—————] 3 | 4 5 6 [#——] 7 [#] 8 9 [——#—————————————] DM [••••••#••••••••••••••••••••••••••••••••••••••••••••••••••••] ——————————————————————————————————————————————————————————————————————————— 10.0 2.880E+0003 Range graph of input data Item no. : 50 Item name: B2-ie-<30-nigh Scale : UNI Experts 1 [—————————————#————————————————————————————————————] 2 [————————#———] 3 | 4 5 6 [#———] 7 [#—] 8 9 [————#———————————————] DM [•••••••••#•••••••••••••••••••••••••••••••••••••••••••••••••] ——————————————————————————————————————————————————————————————————————————— 15.0 2.880E+0003 Range graph of input data Item no. : 51 Item name: B2-ie-<30-wend Scale : UNI Experts 1 [—————————————#————————————————————————————————————] 2 [———#—————] 3 | 4 5 6 [—#] 7 [#] 8 9 [————#———————————————] DM [••••••••••#•••••••••••••••••••••••••••••••••••••••••••••••••] ——————————————————————————————————————————————————————————————————————————— 10.0 2.880E+0003 Range graph of input data Item no. : 52 Item name: B2-ie-<30-rush Scale : UNI Experts 1 [—————————————#————————————————————————————————————] 2 [—————#—————] 3 | 4 5 6 [—#————] 7 [#] 8 9 [——#—————————————] DM [••••••#••••••••••••••••••••••••••••••••••••••••••••••••••••] ——————————————————————————————————————————————————————————————————————————— 10.0 2.880E+0003
Figure 4.13. Case B2: Range graphs of time period for the responsible authority to organise emergency services and to notify people for immediate evacuation in the area outside the emergency planning zone, but within 30 km of the site, during day time (top), night time (middle above), weekend (middle below) and rush hours (bottom)
52

Range graph of input data Item no. : 53 Item name: B2-de-epz-day Scale : UNI Experts 1 [#———] 2 [——————#———————] 3 [#—] 4 [—#———] 5 [———————#——————] 6 [#——————] 7 [#————] 8 [———#———] 9 [————————#———————] DM [•••#••••••••••••••••••••••••••••••••••••••••••••••••••••••••••••••••] ——————————————————————————————————————————————————————————————————————————— 10.0 6.000E+0002 Range graph of input data Item no. : 54 Item name: B2-de-epz-nigh Scale : UNI Experts 1 [#———————] 2 [———————————————#——————] 3 [—#——] 4 [———#——————————————] 5 [———————#——————] 6 [#———————————] 7 [#————] 8 [———#———] 9 [————————#———————] DM [•••••#••••••••••••••••••••••••••••••••••••••••••••••••••••••••••••••] ——————————————————————————————————————————————————————————————————————————— 10.0 6.000E+0002 Range graph of input data Item no. : 55 Item name: B2-de-epz-wend Scale : UNI Experts 1 [#———————] 2 [——————————————#———————————————] 3 [#—] 4 [———#——————] 5 [———————#——————] 6 [#———————————] 7 [#————] 8 [———#———] 9 [————————#———————] DM [•••••#••••••••••••••••••••••••••••••••••••••••••••••••••••••••••••••] ——————————————————————————————————————————————————————————————————————————— 10.0 6.000E+0002 Range graph of input data Item no. : 56 Item name: B2-de-epz-rush Scale : UNI Experts 1 [#———————] 2 [———#———] 3 [#—] 4 5 [———————#——————] 6 [——#—————————————] 7 [#————] 8 9 [————————#———————] DM [••••••#••••••••••••••••••••••••••••••••••••••••••••••••••••••••••••••] ——————————————————————————————————————————————————————————————————————————— 10.0 6.000E+0002
Figure 4.14. Case B2: Range graphs of time period for the responsible authority to organise emergency services and to notify people for delayed evacuation after a period of sheltering in the emergency planning zone, during day time (top), night time (middle above), weekend (middle below) and rush hours (bottom)
53

Range graph of input data Item no. : 57 Item name: B2-de-<30-day Scale : UNI Experts 1 [————————————————————————————#————————————————————————————————————] 2 [——#——] 3 #] 4 5 6 [#—————] 7 [#———] 8 9 [——————#——] DM [•••••••#•••••••••••••••••••••••••••••••••••••••••••••••••••] ——————————————————————————————————————————————————————————————————————————— 10.0 1.440E+0003 Range graph of input data Item no. : 58 Item name: B2-de-<30-nigh Scale : UNI Experts 1 [—————————————————#——————————————————————————————————————————————] 2 [——#—] 3 | 4 5 6 [#——] 7 #—] 8 9 [——#—] DM [•••#••••••••••••••••••••••••••••••••••••••••••••••••••••] ——————————————————————————————————————————————————————————————————————————— 15.0 2.880E+0003 Range graph of input data Item no. : 59 Item name: B2-de-<30-wend Scale : UNI Experts 1 [—————————————————#——————————————————————————————————————————————] 2 [—#—] 3 | 4 5 6 [#——] 7 #—] 8 9 [——#—] DM [•••#••••••••••••••••••••••••••••••••••••••••••••••••••••] ——————————————————————————————————————————————————————————————————————————— 10.0 2.880E+0003 Range graph of input data Item no. : 60 Item name: B2-de-<30-rush Scale : UNI Experts 1 [—————————————————#——————————————————————————————————————————————] 2 [—#] 3 | 4 5 6 [—#———] 7 #—] 8 9 [——#—] DM [••••#•••••••••••••••••••••••••••••••••••••••••••••••••••] ——————————————————————————————————————————————————————————————————————————— 10.0 2.880E+0003
Figure 4.15. Case B2: Range graphs of time period for the responsible authority to organise emergency services and to notify people for delayed evacuation after a period of sheltering in the area outside the emergency planning zone, but within 30 km of the site, during day time (top), night time (middle above), weekend (middle below) and rush hours (bottom)
54
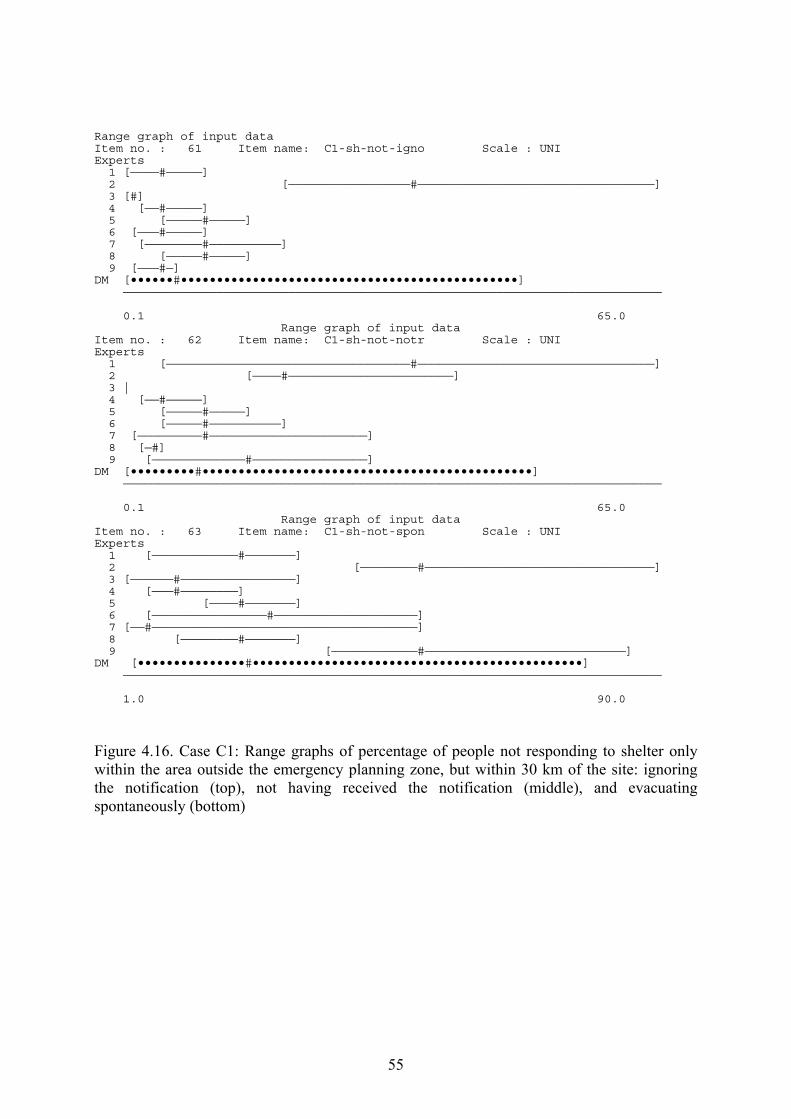
Range graph of input data Item no. : 61 Item name: C1-sh-not-igno Scale : UNI Experts 1 [————#—————] 2 [—————————————————#—————————————————————————————————] 3 [#] 4 [——#—————] 5 [—————#—————] 6 [———#—————] 7 [————————#——————————] 8 [—————#—————] 9 [———#—] DM [••••••#•••••••••••••••••••••••••••••••••••••••••••••••] ——————————————————————————————————————————————————————————————————————————— 0.1 65.0 Range graph of input data Item no. : 62 Item name: C1-sh-not-notr Scale : UNI Experts 1 [——————————————————————————————————#—————————————————————————————————] 2 [————#———————————————————————] 3 | 4 [——#—————] 5 [—————#—————] 6 [—————#——————————] 7 [—————————#——————————————————————] 8 [—#] 9 [—————————————#————————————————] DM [•••••••••#••••••••••••••••••••••••••••••••••••••••••••••] ——————————————————————————————————————————————————————————————————————————— 0.1 65.0 Range graph of input data Item no. : 63 Item name: C1-sh-not-spon Scale : UNI Experts 1 [————————————#———————] 2 [————————#————————————————————————————————] 3 [——————#————————————————] 4 [———#————————] 5 [————#———————] 6 [————————————————#————————————————————] 7 [——#—————————————————————————————————————] 8 [————————#———————] 9 [————————————#————————————————————————————] DM [•••••••••••••••#••••••••••••••••••••••••••••••••••••••••••••••] ——————————————————————————————————————————————————————————————————————————— 1.0 90.0
Figure 4.16. Case C1: Range graphs of percentage of people not responding to shelter only within the area outside the emergency planning zone, but within 30 km of the site: ignoring the notification (top), not having received the notification (middle), and evacuating spontaneously (bottom)
55

Range graph of input data Item no. : 64 Item name: C2-sh-yes-maj Scale : UNI Experts 1 [——————————#———————————————————————————————————————————————————————] 2 [————#—————] 3 [————————#———————] 4 [—#———] 5 [———————————#————————————] 6 [#———] 7 [——#—] 8 [—#————] 9 [——————————————————#————————————————————————] DM [••••••••#•••••••••••••••••••••••••••••••••••••••••] ——————————————————————————————————————————————————————————————————————————— 1.0 1.800E+0002 Range graph of input data Item no. : 65 Item name: C2-sh-yes-vmaj Scale : UNI Experts 1 [——#————————————————————————————————————————————] 2 [———#—] 3 [—————————#———————] 4 [—#—————————] 5 [———————#——————] 6 [—#————] 7 [——#———] 8 [——#——————] 9 [————————————————————————————————————#—————————————————————————————] DM [••••••••••#•••••••••••••••••••••••••••••••••••••••••••••••] ——————————————————————————————————————————————————————————————————————————— 1.0 3.000E+0002
Figure 4.17. Case C2: Range graphs of time periods for the majority (top) and vast majority (bottom) of people to implement the notification to shelter only
56

Range graph of input data Item no. : 66 Item name: C3-sh-leave<3d Scale : UNI Experts 1 [—————————#———————————] 2 [————————————————————————————————————#————————————————————————] 3 [———#———————] 4 [———————————#————————————] 5 [———————————#————————————————————————] 6 [———————————#————————————————————————] 7 [———————————#———————————] 8 [——————#————] 9 [———————#——————] DM [••••••••••••••••#•••••••••••••••••••••••••••••••••••••••••••] ——————————————————————————————————————————————————————————————————————————— 0.1 30.0 Range graph of input data Item no. : 67 Item name: C3-sh-leave<8d Scale : UNI Experts 1 [——————————————#——————————————] 2 [—————————————————————————————#—————————————————————————————] 3 [————#————————] 4 [———————#——————] 5 [——————#———————] 6 [——————————————#————————————————————————————————————————————] 7 [————————————#—————————————————————————————] 8 [——#———————] 9 [——————————————————————#—————————————————————] DM [••••••••••••••••••••#••••••••••••••••••••••••••••••••••••••••••] ——————————————————————————————————————————————————————————————————————————— 0.2 50.0 Range graph of input data Item no. : 68 Item name: C3-sh-leave<12 Scale : UNI Experts 1 [—————————————#——————————————————————] 2 [———————————————————————#—————————————————] 3 [——————#—————] 4 [———#————] 5 [————#———] 6 [———————————————————————————#———————————————————————————] 7 [—————————————#———————————————————————————] 8 [————#————] 9 [—————————————#———————————————————————] DM [•••••••••••••••••••••#•••••••••••••••••••••••••••••••••••••••] ——————————————————————————————————————————————————————————————————————————— 0.4 80.0
Figure 4.18. Case C3: Range graphs of percentages of people to leave their shelters within the required period of 3 hours (top), 8 hours (middle), and 12 hours (bottom), when the sheltering started during day time
57

Range graph of input data Item no. : 69 Item name: C3-sh-leave<3n Scale : UNI Experts 1 [—#——————————————] 2 [—————————————————————————————————#————————————————————————————————————] 3 [——#——————] 4 [——————————————————#—————————————————] 5 [——#———] 6 [——————————————#——————————————————] 7 [——#——————————————] 8 [———#———] 9 [——————————#——————————] DM [••••••••••••#•••••••••••••••••••••••••••••••••••••••••••••••••••••] ——————————————————————————————————————————————————————————————————————————— 0.1 20.0 Range graph of input data Item no. : 70 Item name: C3-sh-leave<8n Scale : UNI Experts 1 [———————————#—————————————————————————————————————] 2 [———————————#————————————] 3 [———#—————————] 4 [————————————————————————#————————————————————————] 5 [———————————#————————————] 6 [————————————————#————————————————————————] 7 [—————————————————————#————————————————————————] 8 [——————#————] 9 [———————————#————————————] DM [•••••••••••••••••••••#•••••••••••••••••••••••••••••••••••••••] ——————————————————————————————————————————————————————————————————————————— 0.2 30.0 Range graph of input data Item no. : 71 Item name: C3-sh-leave<24 Scale : UNI Experts 1 [————————————————#—————————————————————————————————————————————] 2 [———————#———————] 3 [———————————————#———————————————] 4 [———#————] 5 [————#———] 6 [————————————————————————————————#————————————————————————] 7 [————————————————#————————————————————————] 8 [———#———] 9 [————————————#————————————————————] DM [••••••••••••••••••#••••••••••••••••••••••••••••••••••••••••] ——————————————————————————————————————————————————————————————————————————— 1.0 90.0
Figure 4.19. Case C3: Range graphs of percentages of people to leave their shelters within the required period of 3 hours (top), 8 hours (middle), and 24 hours (bottom), when the sheltering started during night time
58

Range graph of input data Item no. : 72 Item name: D1-ev-day-igno Scale : UNI Experts 1 [—#———] 2 [——————————————————#————————————————————————————————————] 3 [—————#——————] 4 [———————#——————————————] 5 [———#——————————————] 6 [——————————————#——————————————————] 7 [——————#——————————] 8 [——————————————————#——————————————————] 9 [——————#———————] DM [•••••••••••••••#••••••••••••••••••••••••••••••••••••••••] ——————————————————————————————————————————————————————————————————————————— 0.1 20.0 Range graph of input data Item no. : 73 Item name: D1-ev-day-notr Scale : UNI Experts 1 [——————————————————————————————————#—————————————————————————————————] 2 [——————————#———————————] 3 [———#—————] 4 [#—] 5 [#————] 6 [—————#———————] 7 [————#—————] 8 [—#] 9 [—————————————#————————————————] DM [•••••#••••••••••••••••••••••••••••••••••••••••••••••••] ——————————————————————————————————————————————————————————————————————————— 0.1 65.0 Range graph of input data Item no. : 74 Item name: D1-ev-day-nfor Scale : UNI Experts 1 #———] 2 [———————————————#————————————————] 3 [———#———] 4 [—#———] 5 [————————#———————] 6 [———#—————] 7 [———#———] 8 [———#———] 9 [————————————#———————————————————] DM [•••••••#•••••••••••••••••••••••••••••••••••••••••••••••••••••] ——————————————————————————————————————————————————————————————————————————— 0.1 90.0
Figure 4.20. Case D1: Range graphs of percentage of people not responding to evacuate following the order within the area outside the emergency planning zone, but within 30 km of the site: ignoring the notification (top), not having received the notification (middle), and evacuating, but not following the order (bottom)
59

Range graph of input data Item no. : 75 Item name: D1-ev-sch-igno Scale : UNI Experts 1 [——#———] 2 [—————————————————————————————#————————————————————————————————————] 3 #——] 4 [——————#——————————————————————] 5 | 6 [——————————————#——————————————] 7 [——————#——————] 8 | 9 [——————————————#——————————————] DM [••••••#••••••••••••••••••••••••••••••••••••••••••••••••] ——————————————————————————————————————————————————————————————————————————— 0.01 10.0 Range graph of input data Item no. : 76 Item name: D1-ev-sch-nfor Scale : UNI Experts 1 #—] 2 [———————————#————————————] 3 #] 4 [————#————] 5 | 6 [————#————] 7 [—#—————————] 8 [——————#————] 9 [————————————————————————#————————————————————————————————————] DM [••••••#•••••••••••••••••••••••••••••••••••••••••••••••] ——————————————————————————————————————————————————————————————————————————— 0.01 30.0
Figure 4.21. Case D1: Range graphs of percentage of people not responding to evacuate following the order, from schools, within the area outside the emergency planning zone, but within 30 km of the site: ignoring the notification (top), and evacuating, but not following the order (bottom)
60

Range graph of input data Item no. : 77 Item name: D1-ev-swc-igno Scale : UNI Experts 1 [———————————#———————————————————————————————————————————————————————————] 2 [———————————#—————————————————————————————] 3 [—————#——————————————] 4 5 [—#———] 6 [——————————————#—————————————————————————————] 7 [—————————————#——————————————] 8 [—————————————————————————————#——————————————] 9 [—————#—————] DM [••••••••••••••#••••••••••••••••••••••••••••••••••••••••••••] ——————————————————————————————————————————————————————————————————————————— 0.1 25.0 Range graph of input data Item no. : 78 Item name: D1-ev-swc-notr Scale : UNI Experts 1 [——————————————————————————————————#—————————————————————————————————] 2 [———————————#——————————————] 3 [————#—————————] 4 5 6 [—————#——————————] 7 [————#————————————————] 8 [—#] 9 [—————————————#————————————————] DM [••••••••••#•••••••••••••••••••••••••••••••••••••••••••••••] ——————————————————————————————————————————————————————————————————————————— 0.1 65.0 Range graph of input data Item no. : 79 Item name: D1-ev-swc-nfor Scale : UNI Experts 1 #—————] 2 [————————————————————————#——————————————————————————————] 3 [—————#—————————] 4 [—#———] 5 [—#—] 6 [—————#———————————] 7 [—#———] 8 [—————#—————] 9 [—————————————————#————————————————————————] DM [•••••••#•••••••••••••••••••••••••••••••••••••••••••••••••••••••••] ——————————————————————————————————————————————————————————————————————————— 0.1 60.0
Figure 4.22. Case D1: Range graphs of percentage of people not responding to evacuate following the order, under severe weather conditions, within the area outside the emergency planning zone, but within 30 km of the site: ignoring the notification (top), not having received the notification (middle), and evacuating, but not following the order (bottom)
61

Range graph of input data Item no. : 80 Item name: D2-ev-fo-wd-ma Scale : UNI Experts 1 [—#—————————————————————] 2 [——#—] 3 [—————#——————] 4 [————————————————————————#—————————————————————————] 5 [#] 6 [#—] 7 [#—] 8 [—————#—————] 9 [——————————————————#—————————————————————————————————————] DM [••••••••#•••••••••••••••••••••••••••••••••••••••••••••••••] ——————————————————————————————————————————————————————————————————————————— 5.0 3.600E+0002 Range graph of input data Item no. : 81 Item name: D2-ev-fo-wd-vm Scale : UNI Experts 1 [—#——————————————————] 2 [—#———] 3 [———————#——————————————] 4 [——————————————#——————————————] 5 [#] 6 [#——] 7 #—] 8 [———#——] 9 [——————————————————#—————————————————————————————————] DM [•••••••#••••••••••••••••••••••••••••••••••••••••••••••••••] ——————————————————————————————————————————————————————————————————————————— 10.0 6.000E+0002
Figure 4.23. Case D2: Range graphs of time periods for the majority (top) and vast majority (bottom) of people to evacuate following the order, during working hours
62

Range graph of input data Item no. : 82 Item name: D2-ev-fo-wh-ma Scale : UNI Experts 1 [#————————————————] 2 [——#] 3 [————#————] 4 [——————————————————#——————————————————————————————————————————————] 5 [#] 6 #] 7 #—] 8 [————#————] 9 [—————————#———————————————————————————] DM [••••••#••••••••••••••••••••••••••••••••••••••••••••] ——————————————————————————————————————————————————————————————————————————— 5.0 4.800E+0002 Range graph of input data Item no. : 83 Item name: D2-ev-fo-wh-vm Scale : UNI Experts 1 [—#——————————————] 2 [#———] 3 [——————#———————————] 4 [————————————#————————————————————————] 5 #] 6 [#———] 7 #—] 8 [——#——] 9 [———————————————#—————————————————————] DM [••••••#••••••••••••••••••••••••••••••••••••••••••••••••••••] ——————————————————————————————————————————————————————————————————————————— 10.0 7.200E+0002
Figure 4.24. Case D2: Range graphs of time periods for the majority (top) and vast majority (bottom) of people to evacuate following the order, during weekends and holidays
63

Range graph of input data Item no. : 84 Item name: D3-ev-nf-wd-ma Scale : UNI Experts 1 [—#———————————————————] 2 [—#] 3 [—————#—————] 4 5 #] 6 #—] 7 [#———] 8 [—————#————] 9 [—————————————————#—————————————————————————————————] DM [••#•••••••••••••••••••••••••••••••••••••••••••••••••••••] ——————————————————————————————————————————————————————————————————————————— 3.0 3.900E+0002 Range graph of input data Item no. : 85 Item name: D3-ev-nf-wd-vm Scale : UNI Experts 1 [—#—————————————————] 2 [#] 3 [——————#——————————————] 4 5 #] 6 [#—] 7 [#——] 8 [———#——] 9 [—————————————————#———————————————————————————————] DM [••#•••••••••••••••••••••••••••••••••••••••••••••••••••••••] ——————————————————————————————————————————————————————————————————————————— 5.0 6.300E+0002
Figure 4.25. Case D3: Range graphs of time periods for the majority (top) and vast majority (bottom) of people to evacuate, but not following the order, during working hours
64

Range graph of input data Item no. : 86 Item name: D3-ev-nf-wh-ma Scale : UNI Experts 1 [——#—————————————————————————] 2 [——#] 3 [———————#———————] 4 5 #] 6 [#] 7 [#————] 8 [———————#——————] 9 [———————————————#————————————————————————————————————] DM [•••#••••••••••••••••••••••••••••••••••••••••••••••••••••] ——————————————————————————————————————————————————————————————————————————— 3.0 3.000E+0002 Range graph of input data Item no. : 87 Item name: D3-ev-nf-wh-vm Scale : UNI Experts 1 [—#—————————————————————] 2 [—] 3 [————————#—————————————————] 4 5 [#] 6 [#] 7 [#———] 8 [———#————] 9 [—————————————————————#——————————————————————————————] DM [•••#•••••••••••••••••••••••••••••••••••••••••••••••••••••••] ——————————————————————————————————————————————————————————————————————————— 5.0 5.100E+0002
Figure 4.26. Case D3: Range graphs of time periods for the majority (top) and vast majority (bottom) of people to evacuate, but not following the order, during weekends and holidays
65

Range graph of input data Item no. : 88 Item name: E1-epz-daylt-r Scale : UNI Experts 1 [—#——————————————————] 2 [————————————#——————] 3 [—#—] 4 [—————#———————————————————————————————————————————————————————————————] 5 [—————————#————————————] 6 [———#—————] 7 [—#——————————] 8 9 [————————————————#—————————————————————————] DM [•••••••#•••••••••••••••••••••••••••••••••••••••••••] ——————————————————————————————————————————————————————————————————————————— 5.0 1.800E+0002 Range graph of input data Item no. : 89 Item name: E1-epz-daylt-s Scale : UNI Experts 1 [——#————————————————————————————————————————————————] 2 [—————————————————————————#——————————————————] 3 [——#——] 4 [—————————————#——————————————————] 5 [———————————————#——————————————————] 6 [————————————#——————————————————] 7 [—————#———————————————————] 8 9 DM [•••••••••••••#•••••••••••••••••••••••••••••••••••••••••••••••••••] ——————————————————————————————————————————————————————————————————————————— 5.0 1.200E+0002 Range graph of input data Item no. : 90 Item name: E1-epz-daylt-u Scale : UNI Experts 1 [————#———————————————————————————————————————————————————] 2 [——————————————————————————————#——————————————] 3 [—#——] 4 5 [———————————————————————————#——————————————————————————————] 6 [——————————————————————#——————————————————————————————] 7 [——————#———————————————] 8 9 DM [••••••••••••••••••#•••••••••••••••••••••••••••••••••••••••••••••••••] ——————————————————————————————————————————————————————————————————————————— 5.0 1.500E+0002
Figure 4.27. Case E1: Range graphs of time periods to leave the emergency planning zone for evacuation during the day with light traffic from a rural area (top), from a suburban area (middle), and from an urban area (bottom)
66

Range graph of input data Item no. : 91 Item name: E1-epz-dayht-r Scale : UNI Experts 1 [———#————————————————] 2 [—————————————————————————#————————————————————————] 3 [—#—] 4 [—————#———————————————————————————————————————————————————————————————] 5 [—————————#————————————] 6 [—————#————————] 7 [—#——————————————————] 8 9 [————————————————————#————————————] DM [••••••••••#••••••••••••••••••••••••••••••••••••••••••••••••••••••] ——————————————————————————————————————————————————————————————————————————— 5.0 1.800E+0002 Range graph of input data Item no. : 92 Item name: E1-epz-dayht-s Scale : UNI Experts 1 [——#———————————————————————————————] 2 [————————#——————————————————] 3 [#—] 4 [———#—————————] 5 [——————————————————#—————————————————————————————————————] 6 [————————————#—————————] 7 [#——————————————————] 8 9 DM [••••••••••••#••••••••••••••••••••••••••••••••••••••••••••••] ——————————————————————————————————————————————————————————————————————————— 5.0 2.400E+0002 Range graph of input data Item no. : 93 Item name: E1-epz-dayht-u Scale : UNI Experts 1 [———————————#——————————————————————————————] 2 [——————————————#———————————————] 3 [#] 4 5 [——————————————————————————————#—————————————————————————————] 6 [——————————————————————#——————————————] 7 [——#——————————————————————] 8 9 DM [•••••••••••••••••••••#•••••••••••••••••••••••••••••••••••••••••] ——————————————————————————————————————————————————————————————————————————— 5.0 3.000E+0002
Figure 4.28. Case E1: Range graphs of time periods to leave the emergency planning zone for evacuation during the day with heavy traffic from a rural area (top), from a suburban area (middle), and from an urban area (bottom)
67

Range graph of input data Item no. : 94 Item name: E1-epz-night-r Scale : UNI Experts 1 [—#——————————————————] 2 [—#——————] 3 [—#—] 4 [—————#———————————————————————————————————————————————————————————————] 5 [—————————#————————————] 6 [—————#—————] 7 [—#——————————] 8 9 [————————————————#—————————————————————————] DM [••••••••#•••••••••••••••••••••••••••••••••••••••••] ——————————————————————————————————————————————————————————————————————————— 5.0 1.800E+0002 Range graph of input data Item no. : 95 Item name: E1-epz-night-s Scale : UNI Experts 1 [————#———————————————————————————————————————————————] 2 [————#———————————————] 3 [————#————] 4 [———————————————#———————————————————————————————] 5 [————————————————————————#———————————————————————————————] 6 [———————————————————————————————#————————————————————————————————————] 7 [——————————#———————————————————————————————] 8 9 DM [•••••••••••••••••••••••#•••••••••••••••••••••••••••••••••••••••] ——————————————————————————————————————————————————————————————————————————— 5.0 75.0 Range graph of input data Item no. : 96 Item name: E1-epz-night-u Scale : UNI Experts 1 [——#—————————————————————————————————————] 2 [——#————] 3 [—#——] 4 5 [———————————————————————————#——————————————————————————————] 6 [——————————————————————————————#—————————————————————————————————————] 7 [——————#———————————————] 8 9 DM [••••••••••••••••••#•••••••••••••••••••••••••••••••••••••••••••] ——————————————————————————————————————————————————————————————————————————— 5.0 1.500E+0002
Figure 4.29. Case E1: Range graphs of time periods to leave the emergency planning zone for evacuation during the night from a rural area (top), from a suburban area (middle), and from an urban area (bottom)
68
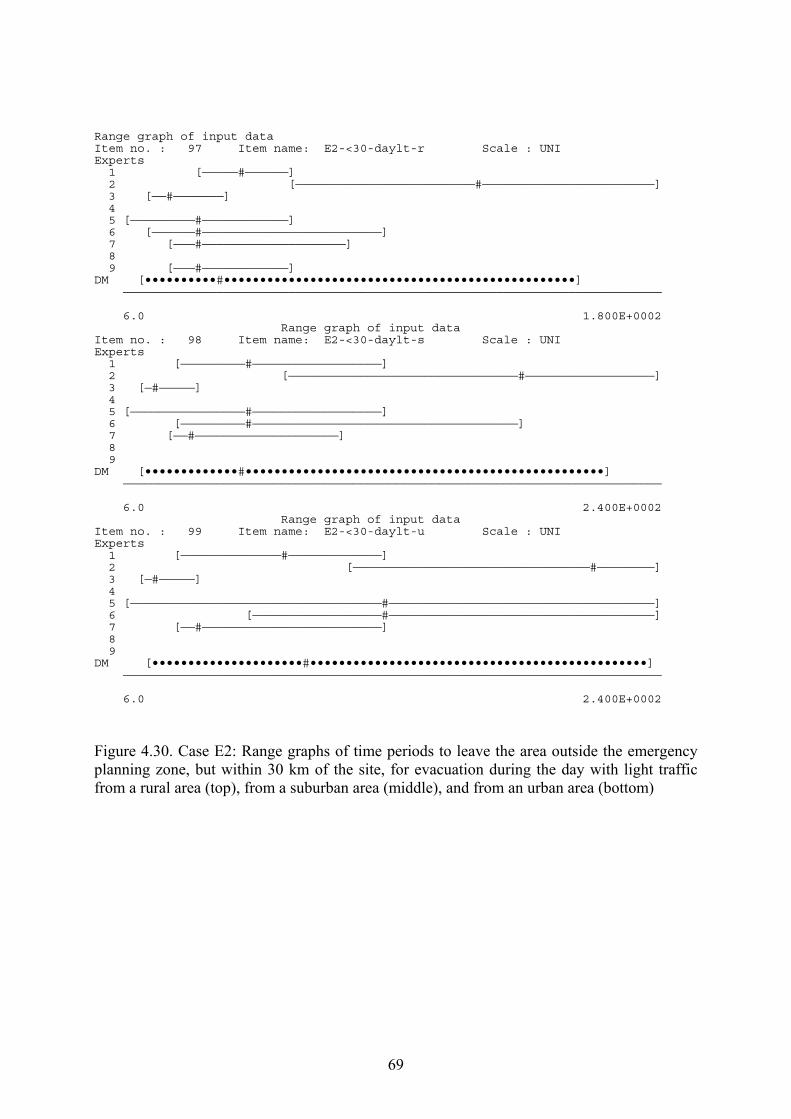
Range graph of input data Item no. : 97 Item name: E2-<30-daylt-r Scale : UNI Experts 1 [—————#——————] 2 [—————————————————————————#————————————————————————] 3 [——#———————] 4 5 [—————————#————————————] 6 [——————#—————————————————————————] 7 [———#————————————————————] 8 9 [———#————————————] DM [••••••••••#•••••••••••••••••••••••••••••••••••••••••••••••••] ——————————————————————————————————————————————————————————————————————————— 6.0 1.800E+0002 Range graph of input data Item no. : 98 Item name: E2-<30-daylt-s Scale : UNI Experts 1 [—————————#——————————————————] 2 [————————————————————————————————#——————————————————] 3 [—#—————] 4 5 [————————————————#——————————————————] 6 [—————————#—————————————————————————————————————] 7 [——#————————————————————] 8 9 DM [•••••••••••••#••••••••••••••••••••••••••••••••••••••••••••••••••] ——————————————————————————————————————————————————————————————————————————— 6.0 2.400E+0002 Range graph of input data Item no. : 99 Item name: E2-<30-daylt-u Scale : UNI Experts 1 [——————————————#—————————————] 2 [—————————————————————————————————#————————] 3 [—#—————] 4 5 [———————————————————————————————————#—————————————————————————————————————] 6 [——————————————————#—————————————————————————————————————] 7 [——#—————————————————————————] 8 9 DM [•••••••••••••••••••••#•••••••••••••••••••••••••••••••••••••••••••••••] ——————————————————————————————————————————————————————————————————————————— 6.0 2.400E+0002
Figure 4.30. Case E2: Range graphs of time periods to leave the area outside the emergency planning zone, but within 30 km of the site, for evacuation during the day with light traffic from a rural area (top), from a suburban area (middle), and from an urban area (bottom)
69

Range graph of input data Item no. : 100 Item name: E2-<30-dayht-r Scale : UNI Experts 1 [——————#———————————————] 2 [——————————————#—————————————————————————————] 3 [#————] 4 5 [—————#——————] 6 [—————————#——————————————————————————————] 7 [——#——————————————————————] 8 9 [———#———————————————] DM [•••••••••#••••••••••••••••••••••••••••••••••••••••••••••••••] ——————————————————————————————————————————————————————————————————————————— 6.0 3.000E+0002 Range graph of input data Item no. : 101 Item name: E2-<30-dayht-s Scale : UNI Experts 1 [—————————#————————] 2 [——————#———————————————————————————————] 3 [#———] 4 5 [——————————————————————————————————————#—————————————————————————] 6 [————————————————#———————————————————————————————————————————————————] 7 [———#——————————————————————] 8 9 DM [•••••••••••••••••#••••••••••••••••••••••••••••••••••••••••••••••••••••] ——————————————————————————————————————————————————————————————————————————— 15.0 3.600E+0002 Range graph of input data Item no. : 102 Item name: E2-<30-dayht-u Scale : UNI Experts 1 [—————————————#—————————] 2 [—————————#—————————————] 3 #———] 4 5 [————————————————————————————#——————————————————] 6 [—————————————————————————#—————————————————————————————————————] 7 [————#——————————————————] 8 9 DM [•••••••••••••••••••#••••••••••••••••••••••••••••••••••••••••••] ——————————————————————————————————————————————————————————————————————————— 15.0 4.800E+0002
Figure 4.31. Case E2: Range graphs of time periods to leave the area outside the emergency planning zone, but within 30 km of the site, for evacuation during the day with heavy traffic from a rural area (top), from a suburban area (middle), and from an urban area (bottom)
70
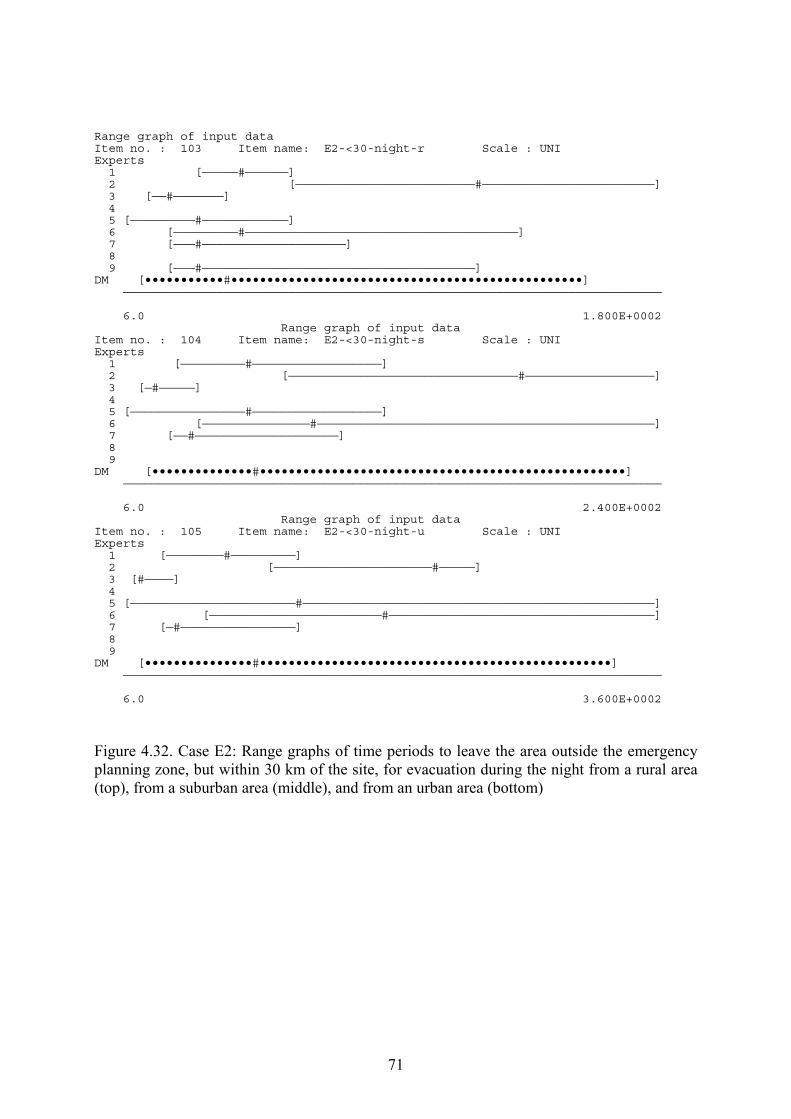
Range graph of input data Item no. : 103 Item name: E2-<30-night-r Scale : UNI Experts 1 [—————#——————] 2 [—————————————————————————#————————————————————————] 3 [——#———————] 4 5 [—————————#————————————] 6 [—————————#——————————————————————————————————————] 7 [———#————————————————————] 8 9 [———#——————————————————————————————————————] DM [•••••••••••#•••••••••••••••••••••••••••••••••••••••••••••••••] ——————————————————————————————————————————————————————————————————————————— 6.0 1.800E+0002 Range graph of input data Item no. : 104 Item name: E2-<30-night-s Scale : UNI Experts 1 [—————————#——————————————————] 2 [————————————————————————————————#——————————————————] 3 [—#—————] 4 5 [————————————————#——————————————————] 6 [———————————————#———————————————————————————————————————————————] 7 [——#————————————————————] 8 9 DM [••••••••••••••#•••••••••••••••••••••••••••••••••••••••••••••••••••] ——————————————————————————————————————————————————————————————————————————— 6.0 2.400E+0002 Range graph of input data Item no. : 105 Item name: E2-<30-night-u Scale : UNI Experts 1 [————————#—————————] 2 [——————————————————————#—————] 3 [#————] 4 5 [———————————————————————#—————————————————————————————————————————————————] 6 [————————————————————————#—————————————————————————————————————] 7 [—#————————————————] 8 9 DM [•••••••••••••••#•••••••••••••••••••••••••••••••••••••••••••••••••] ——————————————————————————————————————————————————————————————————————————— 6.0 3.600E+0002
Figure 4.32. Case E2: Range graphs of time periods to leave the area outside the emergency planning zone, but within 30 km of the site, for evacuation during the night from a rural area (top), from a suburban area (middle), and from an urban area (bottom)
71

Range graph of input data Item no. : 106 Item name: F1-iod-not-hom Scale : UNI Experts 1 [#—] 2 [———————————#———————————] 3 [———————————————#———————————————] 4 [—#——] 5 [—#———] 6 [————#———] 7 [——#———————————————————] 8 [———#——] 9 #] DM [••••#••••••••••••••••••••••••••••••••••••••••••••••••••••••••••••••••••] ——————————————————————————————————————————————————————————————————————————— 0.1 95.0 Range graph of input data Item no. : 107 Item name: F1-iod-not-dis Scale : UNI Experts 1 #—] 2 [———#————] 3 | 4 [———————————————————#—————————————————————————————————————————————————] 5 [—————————————————————————————#—————————] 6 [——————————————#————————————————————————] 7 [————————#———————————————————————————————————————] 8 [#] 9 #] DM [•••#•••••••••••••••••••••••••••••••••••••••••••••••••••••] ——————————————————————————————————————————————————————————————————————————— 0.001 75.0
Figure 4.33. Case F1: Range graphs of percentage of people not responding to the notification to take in stable iodine tablets, when the tablets are already at home (top), and when the tablets have to be collected at a distribution facility (bottom)
72

Range graph of input data Item no. : 108 Item name: F2-iod-hom-maj Scale : UNI Experts 1 [—#————] 2 [#] 3 [#—] 4 [#————] 5 [——#——] 6 [#] 7 [#—————] 8 [#] 9 [—————————#———————————————————————————————————————————————————————————] DM [•#•••••••••••••••••••••••••••••••••••••••••••] ——————————————————————————————————————————————————————————————————————————— 1.0 3.000E+0002 Range graph of input data Item no. : 109 Item name: F2-iod-hom-vma Scale : UNI Experts 1 #—————————————————————————————————————————————————————————————————————————] 2 [—————#——] 3 [#—] 4 [#——] 5 [——#——] 6 #] 7 #———] 8 #—] 9 [————————#——————————————————————————————————————————————] DM [•#••••••••••••••••••••••••••••••••••••••••••••••••••] ——————————————————————————————————————————————————————————————————————————— 1.0 7.200E+0002
Figure 4.34. Case F2: Range graphs of time periods for the majority (top) and vast majority (bottom) of people to take in stable iodine tablets, when the tablets are already at home
73

Range graph of input data Item no. : 110 Item name: F3-iod-dis-maj Scale : UNI Experts 1 #] 2 [——————#———————] 3 [———#——————] 4 [—#—] 5 [—#———] 6 [—#———] 7 [#————] 8 [#—] 9 [——————————#————————————————————————————————————————————————————] DM [•••#••••••••••••••••••••••••••••••••••••••••••••] ——————————————————————————————————————————————————————————————————————————— 10.0 6.000E+0002 Range graph of input data Item no. : 111 Item name: F3-iod-dis-vma Scale : UNI Experts 1 | 2 [—#—] 3 [——#———] 4 [#——] 5 [#—] 6 [—#——] 7 [#————] 8 #——] 9 [———————————#———————————————————————————————————————————————————] DM [••#••••••••••••••••••••••••••••••••••••••••••••] ——————————————————————————————————————————————————————————————————————————— 10.0 1.200E+0003
Figure 4.35. Case F3: Range graphs of time periods for the majority (top) and vast majority (bottom) of people to take in stable iodine tablets, when the tablets have to be collected at a distribution facility
74

CHAPTER 5. SUMMARY AND CONCLUSIONS 5.1 Project Accomplishments Distributions of countermeasures variables for organisational and behavioural aspects of emergency actions were successfully elicited from a panel of ten experts from seven European countries. Individual assessments and aggregated distributions, developed by combining individual assessments, are now available for these variables. The aggregated elicited distributions represent the state-of-the-art knowledge as an average in emergency actions over (Western) Europe as a whole. The individual and aggregated distributions are available on computer media and can be obtained from the project staff. 5.2 Uncertainty Included in Distributions The distributions elicited from the experts concern physically measurable quantities, conditional on the case structures provided to the experts. The individual distributions contain uncertainty that includes the coarseness of the initial conditions of the case structure and natural variability. The experts were not directed to use any particular modelling approach but were allowed to use whatever models, tools, and perspectives they considered appropriate for the problem. The elicited distributions obtained were subsequently developed by the experts from a variety of information sources. The aggregated elicited distributions, therefore, include variations that result from different modelling approaches and perspectives. The aggregated countermeasures variables distributions capture the uncertainty in the stochastic processes to be expected in the organisational and behavioural aspects of emergency actions after a release of radioactive material. All experts’ data have been collected. In this section only the overall findings are presented. Following the accident sequence time periods presented in section 3.2.2, for the first period (time to notify the authorities (Tnot)), two groups of responses are found: assessments with relatively short periods of time, several minutes, and assessments with longer periods with large uncertainties, half an hour to 2 hours. For the time to organise emergency services and notify the people (Torg) large differences in assessments are found, with values ranging from several minutes (5th percentiles) to several hours, for sheltering. In cases of evacuations, similar patterns were assessed with even larger periods of time. The next period of time is that to implement the emergency actions by the people (Tbeh). Again, differences are given with median values ranging from minutes to hours, if the notification to evacuate as instructed by the authorities, is followed by people. Somewhat smaller values are given when people do not follow the instructions of the emergency services, but find their own way of evacuation. Driving times are very locally determined and vary from a few minutes (5th percentile value) to about one hour for median assessments and up to several hours for the 95th percentiles. Finally, taking stable iodine tablets takes 10 to 20 minutes when already available at home with 95th percentiles up to 5 hours, and somewhat larger times when distributed at special facilities, again with high 95th percentiles (up to 12 hours). These times do not include the time taken by the authorities to notify people that they should take the tablets.
75

In general, large differences between experts’ assessments were found mainly because they are all based on local situations with their own local infrastructures. The same is true for the assessments of people who have to respond to a notification or do not respond accordingly. 5.3 Application of Distributions The results of this project will allow the countermeasures components of consequence uncertainty analyses to be performed in a manner consistent with current uncertainty analysis methodologies. The risk integration step in the COSYMA uncertainty analysis (reported in EUR 18826) (the step in which the uncertainty in all modules of the analyses was assessed) relied on Latin Hypercube Sampling (LHS) techniques. The countermeasures variables distributions assessed in this study can be made available in a form compatible with LHS and other sampling techniques. The distributions obtained will, in principle, allow the uncertainty analyst to perform consequence uncertainty studies on any countermeasures model available. Additionally, the experts provided numerical data on dependencies between the countermeasures variables. The methods of this project were also consistent with the philosophy and structure of the Expert Judgement Procedures Guide (EUR 18820) and the NUREG-1150 philosophy in that an attempt was made to include all modelling perspectives, and consensus among the experts was not required. Although this project focused on the development of distributions for COSYMA input parameters, the elicited information is non-model-specific and subsequently can be fitted by other analytical models. In addition, the development of distributions over physically measurable parameters means that the distributions will have applications beyond the scope of consequence code uncertainty analysis (e.g., emergency response planning). The library of uncertainty distributions for countermeasures variables will have many applications outside of the scope of this project. The distributions also provide additional insights regarding areas which are not part of the current consequence codes, and they can be a useful guide for directing future research. 5.4 Conclusions Valuable information has been obtained from this exercise. The goal, to create a library of uncertainty distributions for countermeasures variables relating to the organisational and behavioural aspects of emergency actions for use in probabilistic risk assessments, was fulfilled. Furthermore, in this exercise, formal expert judgement elicitation has proven to be a valuable vehicle to synthesise the best available information by a highly qualified group. With a well designed elicitation approach, addressing issues such as elicitation variable selection, case structure development, probability training, communication between the experts and project staff, and documentation of the results and rationale - followed by an appropriate application of the elicited information - expert judgement elicitation can play an important role. Indeed, it possibly will become the only technique to assemble the required information when it is impractical to perform experiments or when the available experimental results do not lead to an unambiguous and a non-controversial conclusion.
76

APPENDICES APPENDIX A Summary of the COSYMA accident consequence code APPENDIX B Case structure document and elicitation questionnaire for the expert
panel on early emergency action APPENDIX C Responses and rationales of the expert panel on early emergency
actions APPENDIX D Short biographies of the experts on early emergency actions APPENDIX E Aggregated results of expert responses
APPENDIX A Summary of the COSYMA Accident Consequence Code COSYMA is intended for probabilistic calculations of the off-site consequences of hypothetical accidental releases of radioactive material to atmosphere at nuclear sites. It calculates the health effects, impact of countermeasures and economic costs of the releases. The processes considered in the calculations, and the routes of exposure following accidental releases to atmosphere, are illustrated in Figure B.1. The calculation is divided into a number of steps, as is also illustrated in Figure 1. COSYMA is a modular code, with different modules addressing the different stages of the calculation. However, while Figure 1 illustrates the steps in the calculation, the modules of the codes do not correspond exactly with the boxes shown in that figure. The following sections give brief descriptions of the models included in COSYMA. In some cases, COSYMA includes more than one model for a particular feature. This appendix also specifies which of the models was used for this uncertainty analysis. COSYMA was developed by the National Radiological Protection Board (NRPB) of the UK and Forschungszentrum Karlsruhe (FZK) of Germany, as part of the European Commission's MARIA project(1). It represents a fusion of ideas from the NRPB program MARC(2), the FZK program system UFOMOD(3) and input from other MARIA contractors. The program package was first made available in 1990 for use on mainframe computers, and several updates have been released since then. A PC version was first released in 1993 and has since been updated(4).*
* The mainframe and PC versions of COSYMA are made available on behalf of the European
Commission. People wishing to obtain the mainframe version of the system should contact Dr J Ehrhardt, FZK,
77

COSYMA is a package of programs and data bases, rather than a single program. The mainframe version contains three main accident consequence assessment programs together with a number of preprocessing and evaluation programs. The three main sub-systems of COSYMA are known as the NE, NL and FL sub-systems. The NE (near, early) sub-system is limited to calculating early health effects and the influence of emergency actions to reduce those effects and is intended for use in the region near to the site. The NL (near, late) subsystem is limited to calculating late health effects and the associated countermeasures, and is intended mainly for use in the region near to the site. The FL (far, late) sub-system is concerned with calculating late health effects and appropriate countermeasures at larger distances from the site. Each of these programs is further sub-divided into a series of modules for the various steps in the calculation. PC COSYMA incorporates the NE and NL sub-systems of the mainframe version. The main endpoints of COSYMA are the numbers of health effects, the impact of countermeasures and the economic costs resulting from an accidental release. A large number of intermediate results are obtained in the process of calculating the major endpoints; these results include activity concentrations, individual and collective doses and the countermeasures that would be imposed at different locations. The package contains a series of evaluation programs that allow these results to be presented in a variety of ways.
Following an accidental release to atmosphere, people can be irradiated by a number of routes of exposure. The ones considered in COSYMA are:- - external ( irradiation from material in the plume, - external ( irradiation from material deposited on the ground - external β irradiation of skin from material deposited on skin and clothes - internal irradiation following the inhalation of material from the plume or of material that
has been deposited and subsequently resuspended - internal irradiation from the ingestion of contaminated foods.
COSYMA includes some models directly within the various modules or subsidiary programs, but in other cases it uses results of models taken from data libraries. Thus the atmospheric dispersion models are used directly. COSYMA does not however, include models for the contamination of food or dosimetric calculations, using instead data libraries giving the results of other models, which are not part of COSYMA, itself, but whose uncertainty is considered within the current study. B.1 Atmospheric dispersion and deposition Mainframe COSYMA contains five different models of atmospheric dispersion that are appropriate for different applications or are based on different assumptions and approximations(5).
Germany (e-mail [email protected]; those wishing to obtain the PC version of the system should contact Dr J A Jones, NRPB, UK (e-mail [email protected]).
78

79
The NE and NL sub-system include the MUSEMET(6) model, which was originally written at Forschungsanlage Julich but has been extensively modified at FZK for use with COSYMA. This is a segmented Gaussian plume model allowing for changes of atmospheric conditions and wind direction during plume travel. This model derives the sequences of atmospheric conditions affecting the plume from a data file giving hourly averages for wind speed and direction, stability category, precipitation intensity and mixing layer depth. It allows for the effects on the subsequent dispersion of plume rise and buildings near the release point. It also includes the effects of wet and dry deposition of the dispersing material. This model is also included in PC COSYMA. The NE and NL sub-systems can also be used with the COSGAP or RIMPUFF dispersion models, which are provided as separate programs. COSGAP(7) is a Gaussian plume dispersion model, which is similar to MUSEMET but does not consider changes of wind direction during plume travel. It is based on the dispersion model in MARC. RIMPUFF(8), developed by Risø National Laboratory, Denmark, is a Gaussian puff trajectory model which derives the atmospheric conditions affecting the plume by interpolating between data from a number of meteorological stations in the region of interest. The NL sub-system also contains the ISOLA(9) model for very long release durations. This uses statistics of atmospheric conditions and is only appropriate for releases that are sufficiently small that no countermeasures and no early health effects would be expected. The FL sub-system is linked to the Mesos model(10), developed by Imperial College, UK. This is a trajectory model for dispersion over long distances that uses meteorological data for a large area, such as the whole of Europe. Accident consequence assessment programs need to consider the consequences should the accident occur in any of a wide range of atmospheric conditions. It is not possible to calculate the consequences for every sequence of conditions that might arise, and so some method is required to sample a representative set of conditions from those possible. Both the mainframe and PC versions of COSYMA include a flexible program to undertake this sampling. Only the MUSEMET dispersion model is included in this study, using the NE and NL sub-systems. The uncertainty in dispersion modelling includes both the uncertainty on the spread of the plume around its trajectory, and the uncertainty on the location of the plume trajectory. The other Gaussian models included in COSYMA (RIMPUFF, COSGAP and ISOLA) use similar descriptions of the growth of plumes and of the trajectory. Therefore the uncertainty on consequences predicted using MUSEMET should be similar to the uncertainties predicted using the other Gaussian models. However, MESOS uses a different method of calculating plume trajectories, and the uncertainties on calculations using MESOS may not be the same as those using Gaussian plume or puff models. B.2 Dose calculations As stated earlier, COSYMA does not include dosimetric models but uses information from data libraries which are calculated with these models. The libraries include information on the doses from 197 radionuclides. The data library used for calculating external exposure from γ emitting material deposited on the ground contains outdoor doses per unit deposit integrated to a series of times. These doses are

80
combined with location factors representing the reduction of external γ irradiation by the shielding effects of buildings and typical behaviour of the population. The library is drawn from a number of sources, using results of models developed at NRPB(11,12) and Forschungszentrum für Umwelt und Gesundheit (GSF)(13), Germany. The doses for those radionuclides making major contributions to the dose from fission reactor accidents are derived from a model describing the deposition patterns in urban areas and the subsequent transfer of material between the different surfaces. Location factors are used to describe the protection offered by buildings. The doses from internal irradiation following ingestion or inhalation are calculated using data libraries of dose per unit intake derived using models which are consistent with those in ICRP publications 56, 67 and 69. COSYMA needs information on the dose received in different periods after the accident, and so this information is included in the data libraries. The method used for calculating doses and risks of health effects in the mainframe version of COSYMA allows for the variation of dose per unit intake with age at intake, and so the libraries contain information on doses for different age groups in the population. The PC version uses a simpler method which only considers the doses to adults. B.3 Food chain models COSYMA requires information on the concentration of material in foods as a function of time after the accident. It does not include a food chain model, but uses the results of such models through data libraries which give the activity concentration for a range of radionuclides in a number of foods at a series of times following unit deposition. The concentration of material in foods depends on the time of year at which the deposition occurs. COSYMA uses two data libraries, for deposition in summer and winter. Within a run of COSYMA, the “summer” or “winter” data library is used depending on the date in the year of the meteorological sequence being analysed. COSYMA uses libraries derived from the NRPB model FARMLAND(14) and the GSF model ECOSYS(15). The libraries were created using agreed values for the food chain parameters for application within the European Union, but there are differences because of other modelling assumptions made and because of the foods considered in each. The foods which can be considered with FARMLAND are milk, meat and liver from cattle, pork, meat and liver from sheep, green vegetables, grain products, potatoes and other root vegetables. The foods which can be considered with ECOSYS are milk, beef pork, grain products, potatoes and other root vegetables, and leafy and non-leafy green vegetables. The intakes of these foods are calculated within COSYMA using one of two assumptions about the distribution of food between harvest and consumption. One method assumes that all food consumed is produced locally, and is used in calculating individual ingestion doses. The other method uses information on the amount of food produced in the area of interest, and calculates collective doses on the assumption that all food produced is consumed somewhere. For this study, the FARMLAND food chain model was used to calculate the uncertainty on concentrations of activity in foods. Doses from ingestion of food were calculated on the assumption that all food consumed is produced locally. B.4 Countermeasures

81
COSYMA allows the user to consider the effect of a wide range of countermeasures in reducing the exposure of the population, and gives the user considerable freedom in specifying the criteria at which the actions will be imposed or withdrawn(16). Sheltering as the only action and sheltering combined with evacuation may be implemented automatically or on the basis of dose. The distribution of iodine tablets, automatically or on the basis of dose, can also be considered. These actions are assumed to be implemented sufficiently rapidly to reduce the risks of both early and late health effects. Relocation is considered as an action to reduce doses and risks over longer time periods. It can be implemented on a dose criterion. Return from evacuation or relocation is also considered on a dose criterion. The effects of decontamination in reducing the period of relocation can be considered. If these actions are initiated on the basis of dose, the user can specify the intervention levels, organs and pathways to be considered, and the time over which the dose is to be integrated. The behaviour of the population considered in the dose criteria can also be described using location factors. Food restrictions can also be considered(17). They can be implemented or withdrawn on the basis of doses received within specified time periods or on the basis of the instantaneous concentration of radionuclides in foods. B.5 Health effects COSYMA considers both early and late health effects in the population, using methods recommended by NRPB(18,19), the US Nuclear Regulatory Commission(20) and GSF(21). The risk of early health effects is calculated using "hazard functions". The method allows for the variation of risk with the rate at which dose is accumulated over the first few days following the accident. Ten different fatal and non-fatal effects are considered by COSYMA, though not all are considered for this study. The risk of late health effects is calculated using the linear dose response relationship. COSYMA considers the risk of fatal and non-fatal cancers in ten organs, and the risk of leukaemia. It also considers the risk of hereditary effects. The method adopted in the mainframe version of COSYMA allows for the variation of risk with age at exposure(22). PC COSYMA uses a simpler method which only considers the doses and risks to adults, assuming that the risk is the product of committed dose and risk coefficient. The mainframe version of COSYMA can provide information on the numbers of cancers in the people alive at the time of the accident, and in their descendants. It also gives information on the times at which the cancers occur. For this study, the approximation used in PC COSYMA for calculating the risks of late health effects was adopted. B.6 Economic effects COSYMA can calculate the off-site economic cost of the accident, considering the costs arising from the countermeasures and the costs of health effects. The assumptions and models are described in references 23 and 24. The countermeasures for which costs are considered are movement of the population, food restrictions and decontamination. The costs arising from lost production in the area from which people are moved can be assessed in terms of the per capita

82
contribution of the relocated population to gross domestic product (GDP) or in terms of the value of the land affected. For longer periods of relocation, the lost capital value of the land and its assets may be calculated. The costs of food restrictions include contributions to GDP as well as the lost capital value and the disposal costs of the food affected. The cost arising from health effects may be calculated in terms of the treatment costs and the lost economic productivity of the affected individuals or an estimation of the cost of health effects may be obtained using a more subjective approach to the valuation of life. This study did not consider the uncertainty on economic effects. B.7 References 1 KfK and NRPB. COSYMA: A new program package for accident consequence assessment.
CEC. Brussels, EUR-13028 (1991) 2 Hill M D, Simmonds J R and Jones J A. NRPB methodology for assessing the radiological
consequences of accidental releases of radionuclides to atmosphere - MARC-1. Chilton, NRPB-R224 (1988) (London HMSO)
3 Ehrhardt J, Burkart K, Hasemann I, Matzerath C, Panitz H-J and Steinhauer C. The
program system UFOMOD for assessing the consequences of nuclear accidents. KfK-4330 (1988)
4 Jones J A, Mansfield P A , Haywood S M , Hasemann I, Steinhauer C, Ehrhardt J and
Faude D. PC COSYMA (Version 2): an accident consequence assessment package for use on a PC. EUR report 16239 (1995)
5 Panitz H-J, Päsler-Sauer J and Matzerath C. UFOMOD: Atmospheric dispersion and
deposition. KfK-4332 (1989) 6 Straka J, Geiβ H and Vogt K J. Diffusion of waste air puffs and plumes under changing
weather conditions. Contr. Atmos. Phys. 54 207-221, (1981) 7 Jones J A and Charles D. AD-MARC: The atmospheric dispersion module in the
methodology for assessing the radiological consequences of accidental releases. Chilton, NRPB-M72, (1982)
8 Mikkelsen T, Larsen S E and Thykier-Nielsen S. Description of the Riso puff model. Nuclear Technol 76 56-65 (1984)
9 Hübschmann W and Raskob W. ISOLA V: a Fortran-77 code for the calculation of the
long-term concentration distribution in the environment of nuclear installations. 10 ApSimon H M and Goddard A J H. Atmospheric transport of radioisotopes and the
assessment of population doses on a European scale. CEC Luxembourg EUR-9128 (1983) 11 Charles D, Crick M J, Fell T P and Greenhalgh J R. DOSE-MARC: The dosimetric
module in the methodology for assessing the radiological consequences of accidental releases. Chilton NRPB-M74 (1982).

83
12 Crick M J and Brown J. EXPURT: A model for evaluating exposure from radioactive
material deposited in the urban environment. Chilton NRPB-R235 (1990) 13 Jacob P, Paretzke H G, Rosenbaum H, Zankl M. Organ doses from radionuclides on the
ground. Part 1: Simple time dependencies. Health Physics 54 617-633 (1988) 14 Brown J and Simmonds J R. FARMLAND a dynamic model for the transfer of
radionuclides through terrestrial foodchains. Chilton. NRPB-R273 (1995) 15 Matthies M, Eisfeld K, Müller H, Paretzke H G, Pröhl G and Wirth G. Simulation des
Transfers von Radionukliden in landwirtschaflichen Nahrungsketten. GSF Bericht S-882 (1982)
16 Hasemann I and Ehrhardt J. COSYMA: dose models and countermeasures for external
exposure and inhalation. Karlsruhe KFK 4333, (1994) 17 Steinhauer C. COSYMA: ingestion pathways and foodbans. Karlsruhe. KfK 4334 (1992) 18 Edwards A A. Private communication (1995) 19 NRPB. Estimates of late radiation risks to the UK population. Documents of the NRPB 4
(4) 15-157 (1993) 20 Evans J S, Moeller D W and Cooper D W. Health effects models for nuclear power plant
accident consequence analysis. NUREG/CR-4214 (1985), Rev 1, (1990) 21 Paretzke H G, Stather J W and Muirhead C R. Risk factors for late somatic effects. In
Proceedings of the CEC Seminar on methods and codes for assessing the off-site consequences of nuclear accidents, Athens 1990, Luxembourg EUR 13013 (1991)
22 Ehrhardt J, Hasemann I, Matzerath-Boccaccini C, Steinhauer C and Raicevic J. COSYMA:
health effects models. Karlsruhe FZKA 5567 (1995) 23 Haywood S M, Robinson C A and Heady C. COCO-1: model for assessing the cost of
offsite consequences of accidental releases of radioactivity. Chilton NRPB-R243 (1991) 24 Faude D. COSYMA: Modelling of economic consequences. Karlsruhe, KfK Report 4336
(1992)

Directradiation
Inhalation
Rain washing materialout of plume
Direct radiation fromdeposited activity
Contamination offood and ground Shielding
Source term
Atmospheric dispersion, deposition and environmental transport
Dose calculation Potential doses to people
Expected doses to people
Health effect calculation
Number of health
Monetary consequences
Economic costs calculation Areas and number
of people affected
Counter-measures
Distribution of activity in the environment
Figure B.1 Processes modelled in COSYMA
84

APPENDIX B
Case structure document and elicitation questionnaire for the
expert panel on early emergency actions Clarification of questions Emergency guidelines distinguish between three types of emergency actions: 1. General emergency: take action immediately 2. Site area emergency: crisis team, but no immediate action, only when declared later as
a general emergency 3. Alert: only notification to authorities. For a full understanding of what is meant in this context by the emergency states, one is referred to IAEA-TECDOC-955 (relevant pages were separately handed out to the experts). The check of the emergency action status is based on observable plant conditions and off-site measurements (if available). The following steps are taken: 1. Unusual initiation of accident (at the plant) 2. Declaration of site area emergency (plant notifies responsible authority) 3. Declaration of general emergency (plant notifies responsible authority) 4. Activation of off-site emergency system (by responsible authority) 5. Assessment of situation (by responsible authority) 6. Decision to implement countermeasures (by responsible authority) 9. Mobilisation of resources (by responsible authority) 10. People take action.
85

The accident sequence is defined with the following points in time and time periods: tal tpa t=0 tae tep tpc tooa| | | | | | | +--------------------------------------------------------------------------------------------------------- Tnot Torg Tbeh Tdr |---------||---------------------------------------------||------------------||---------------------------| Explanation: Points in time tal time at which the initiating event sufficient to declare a general
emergency is observed (see Remark 2) tpa time at which the plant officials notify the responsible authority about a
general emergency t=0 time of release of radionuclides (see Remark 1) tae time at which the responsible authority notify the local emergency staff
(police and so on) to start taking countermeasures tep time at which the local emergency staff notifies people to follow up
countermeasures tpc time at which people act on countermeasures and start preparing
evacuation tooa time to go out of the area where countermeasures are active Time periods Tnot time period between tal and tpa; for this time period two situations are
possible (see Remark 2) Torg time period between tpa and tep; for this time period two situations are
possible Torg1 time period in cases of immediate general emergency Torg2 time period in cases general emergency is declared after a period of site
area emergency Tbeh time period between tep and tpc Tdr time to leave the area where countermeasures are active, i.e. the time
between tpc and tooa; this includes time to prepare and time to drive (or walk) out of the area.
Remark 1 The time of release (t=0) can be at any point on the time scale. The best
situations are there when t=0 comes after tooa. Remark 2 The time of alert (tal) is used here instead of the time of the initiating event (tie).
There is another time to shutdown (tshd) which comes prior to tal, but the time interval (tal - tshd) = Tshd is impossible to elicit.
86
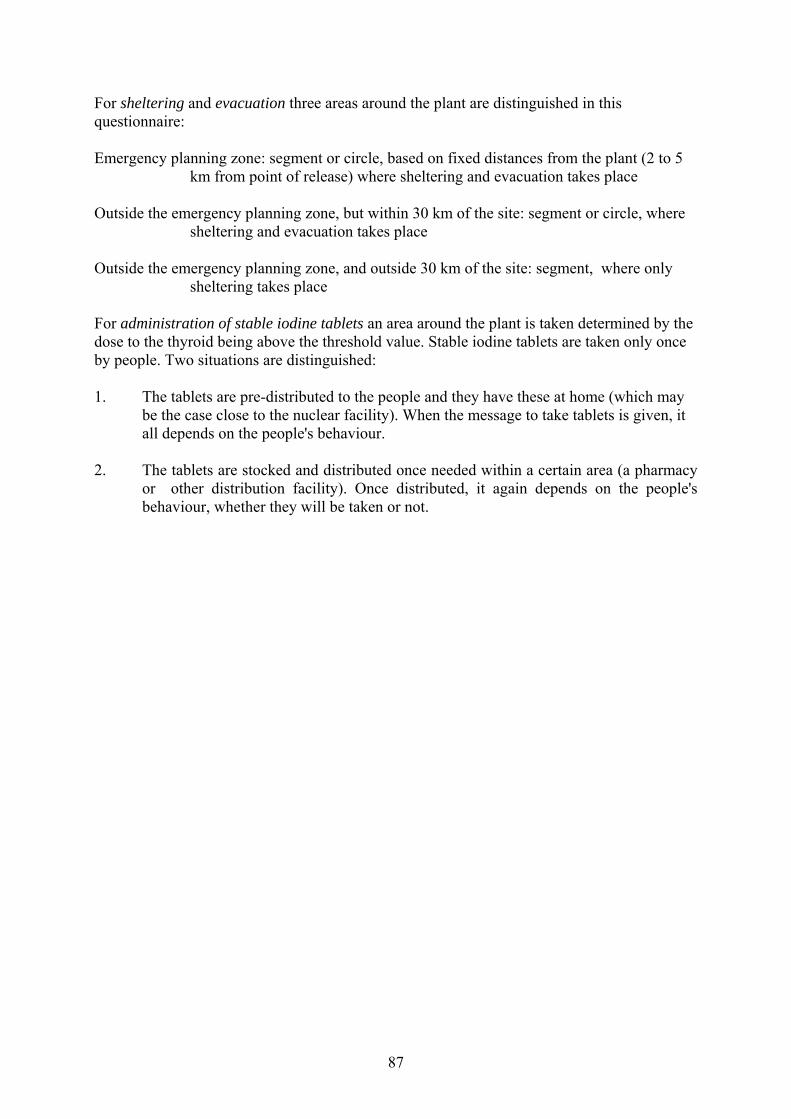
For sheltering and evacuation three areas around the plant are distinguished in this questionnaire: Emergency planning zone: segment or circle, based on fixed distances from the plant (2 to 5
km from point of release) where sheltering and evacuation takes place Outside the emergency planning zone, but within 30 km of the site: segment or circle, where
sheltering and evacuation takes place Outside the emergency planning zone, and outside 30 km of the site: segment, where only
sheltering takes place For administration of stable iodine tablets an area around the plant is taken determined by the dose to the thyroid being above the threshold value. Stable iodine tablets are taken only once by people. Two situations are distinguished: 1. The tablets are pre-distributed to the people and they have these at home (which may
be the case close to the nuclear facility). When the message to take tablets is given, it all depends on the people's behaviour.
2. The tablets are stocked and distributed once needed within a certain area (a pharmacy
or other distribution facility). Once distributed, it again depends on the people's behaviour, whether they will be taken or not.
87

Questionnaire Case A: Declaration of general emergency after the initiating event has been alerted at the plant (at tal). No distinction is made between an initiating event with an immediate declaration of general emergency and an initiating event which started off as a site area emergency. Question A1What is the time period Tnot required to notify any authority, who is responsible for taking off-site emergency actions, about a general emergency situation? Several conditions at time tal are considered. To notify means: to get hold of right person to take responsibility, until all notification formalities are fulfilled. Conditions at time tal 5 % 50 % 95 % Day time Night time Weekend During rush hours (school times, closing hour of shopping malls)
88

Case B1: Emergency services are organised and the people are notified, after an initiating event is observed , for which an immediate general emergency has been declared.
Question B1 What is the time period (Torg1) for the responsible authority to a) organise the emergency services and b) let them notify the people in the various areas. No separate assessments are asked for the time period for the responsible authority to notify the emergency services (tae - tpa) and the time period for the emergency services to notify the people in the subsequent areas (tep - tae). The questions are asked for various conditions. For the areas outside the emergency planning zone the answers should include delay for assessment of current status of the accident. These areas may include large residential areas.
For sheltering time period to organise emergency services and to notify people in the emergency planning zone to shelter under conditions at time tae
5 %
50 %
95 %
Day time Night time Weekend During rush hours (school times, closing hour of shopping malls)
time period to organise emergency services and to notify people outside the emergency planning zone within 30 km of the site to shelter under conditions at time tae
5 %
50 %
95 %
Day time Night time Weekend During rush hours (school times, closing hour of shopping malls)
89

time period to organise emergency services and to notify people outside the emergency planning zone and outside 30 km of the site to shelter under conditions at time tae
5 %
50 %
95 %
Day time Night time Weekend During rush hours (school times, closing hour of shopping malls)
For immediate evacuation without sheltering first time period to organise emergency services and to notify people in the emergency planning zone to evacuate under conditions at time tae
5 %
50 %
95 %
Day time Night time Weekend During rush hours (school times, closing hour of shopping malls)
time period to organise emergency services and to notify people outside the emergency planning zone within 30 km of the site to evacuate under conditions at time tae
5 %
50 %
95 %
Day time Night time Weekend During rush hours (school times, closing hour of shopping malls)
90

For delayed evacuation after a period of sheltering first
time period to organise emergency services and to notify people in the emergency planning zone to evacuate under conditions at time tae
5 %
50 %
95 %
Day time Night time Weekend During rush hours (school times, closing hour of shopping malls)
time period to organise emergency services and to notify people outside the emergency planning zone within 30 km of the site to evacuate under conditions at time tae
5 %
50 %
95 %
Day time Night time Weekend During rush hours (school times, closing hour of shopping malls)
91

Case B2: Emergency services are organised and the people are notified, after an initiating event is observed , for which a general emergency has been declared, after a first period of site area emergency.
Question B2What is the time period (Torg2) for the responsible authority to a) organise the emergency services and b) let them notify the people in the various areas. No separate assessments are asked for the time period for the responsible authority to notify the emergency services (tae - tpa) and the time period for the emergency services to notify the people in the subsequent areas (tep - tae). The questions are asked for various conditions. For the areas outside the emergency planning zone the answers should include delay for assessment of current status of the accident. These areas may include large residential areas.
For sheltering time period to organise emergency services and to notify people in the emergency planning zone to shelter under conditions at time tae
5 %
50 %
95 %
Day time Night time Weekend During rush hours (school times, closing hour of shopping malls)
time period to organise emergency services and to notify people outside the emergency planning zone within 30 km of the site to shelter under conditions at time tae
5 %
50 %
95 %
Day time Night time Weekend During rush hours (school times, closing hour of shopping malls)
92

time period to organise emergency services and to notify people outside the emergency planning zone and outside 30 km of the site to shelter under conditions at time tae
5 %
50 %
95 %
Day time Night time Weekend During rush hours (school times, closing hour of shopping malls)
For immediate evacuation without sheltering first time period to organise emergency services and to notify people in the emergency planning zone to evacuate under conditions at time tae
5 %
50 %
95 %
Day time Night time Weekend During rush hours (school times, closing hour of shopping malls)
time period to organise emergency services and to notify people outside the emergency planning zone within 30 km of the site to evacuate under conditions at time tae
5 %
50 %
95 %
Day time Night time Weekend During rush hours (school times, closing hour of shopping malls)
93

For delayed evacuation after a period of sheltering first
time period to organise emergency services and to notify people in the emergency planning zone to evacuate under conditions at time tae
5 %
50 %
95 %
day time night time Weekend During rush hours (school times, closing hour of shopping malls)
time period to organise emergency services and to notify people outside the emergency planning zone within 30 km of the site to evacuate under conditions at time tae
5 %
50 %
95 %
day time Night time Weekend During rush hours (school times, closing hour of shopping malls)
94

Case C: People are notified by the emergency services to shelter only within the area outside the emergency planning zone, but within the 30 km zone of the site.
Question C1 What is the percentage of people not responding? What is the percentage of people that:
5 % 50 % 95 %
stays outdoors, ignoring the notification to shelter
stays outdoors, not receiving the notification to shelter
decides to evacuate spontaneously Question C2 In cases the notification to shelter is followed by people, how much time (Tbeh) does it take for parts of the population to implement the action, in situation during daytime only. time period to implement the action to shelter (Tbeh)
5 % 50 % 95 %
for the majority of people (68 %) for the vast majority of people (95 %)
95

Question C3 People are told to shelter until further notice. What is the behaviour of the people who seek shelter?
What is the percentage of people that:
5 % 50 % 95 %
Leaves their shelters in less than the required period of 3 hours (day time period)
Leaves their shelters in less than the required period of 8 hours (mostly day time)
Leaves their shelters in less than the required period of 12 hours (starts in day time)
What is the percentage of people that:
5 % 50 % 95 %
Leaves their shelters in less than the required period of 3 hours (night time period)
Leaves their shelters in less than the required period of 8 hours (mostly night time)
Leaves their shelters in less than the required period of 24 hours
96

Case D: People are notified by the emergency services to evacuate within the area outside the emergency planning zone, but within the 30 km zone of the site.
- Question D1 What is the percentage of people not responding to the order of organised evacuation? What is the percentage of people during day time that:
5 % 50 % 95 %
Ignores the notification to evacuate Does not receive the notification to evacuate
Decides to evacuate, but does not follow the order (e.g., going the wrong direction)
What is the percentage of people at school that:
5 % 50 % 95 %
Ignores the notification to evacuate Decides to evacuate, but does not follow the order (e.g., going the wrong direction)
What is the percentage of people under severe weather conditions that:
5 % 50 % 95 %
Ignores the notification to evacuate Does not receive the notification to evacuate
Decides to evacuate, but does not follow the order (e.g., going the wrong direction)
97

Question D2 In cases the notification to evacuate is followed by people, how much time (Tbeh) does it take for parts of the population that decides for organised evacuation, to implement the action and start to evacuate in an organised way The time period considered here ends when people start to leave their homes by the approved transport arrangements, but does not include the driving time. Evacuation only takes place in the area within 30 km of the site. time period to implement the action of organised evacuation during working days (Tbeh)
5 % 50 % 95 %
for the majority of people who chose for organised evacuation (68 %)
for the vast majority of people who chose for organised evacuation (95 %)
time period to implement the action of organised evacuation during weekends and holidays (Tbeh)
5 % 50 % 95 %
for the majority of people who chose for organised evacuation (68 %)
for the vast majority of people who chose for organised evacuation (95 %)
98

Question D3 In cases the notification to evacuate is followed by people, but some people do not follow the approved method of evacuation, how much time (Tbeh) does it take for those parts of the population evacuating by themselves to do so? The time period considered here ends when people start to leave their homes by their own transport arrangements, but does not include the driving time. Evacuation only takes place in the area within 30 km of the site.
time period to implement the action to self- evacuation during working days (Tbeh)
5 % 50 % 95 %
for the majority of people that self-evacuates (68 %)
for the vast majority of people that self-evacuates (95 %)
time period to implement the action to self- evacuation during weekends and holidays (Tbeh)
5 % 50 % 95 %
for the majority of people that self-evacuates (68 %)
for the vast majority of people that self-evacuates (95 %)
99
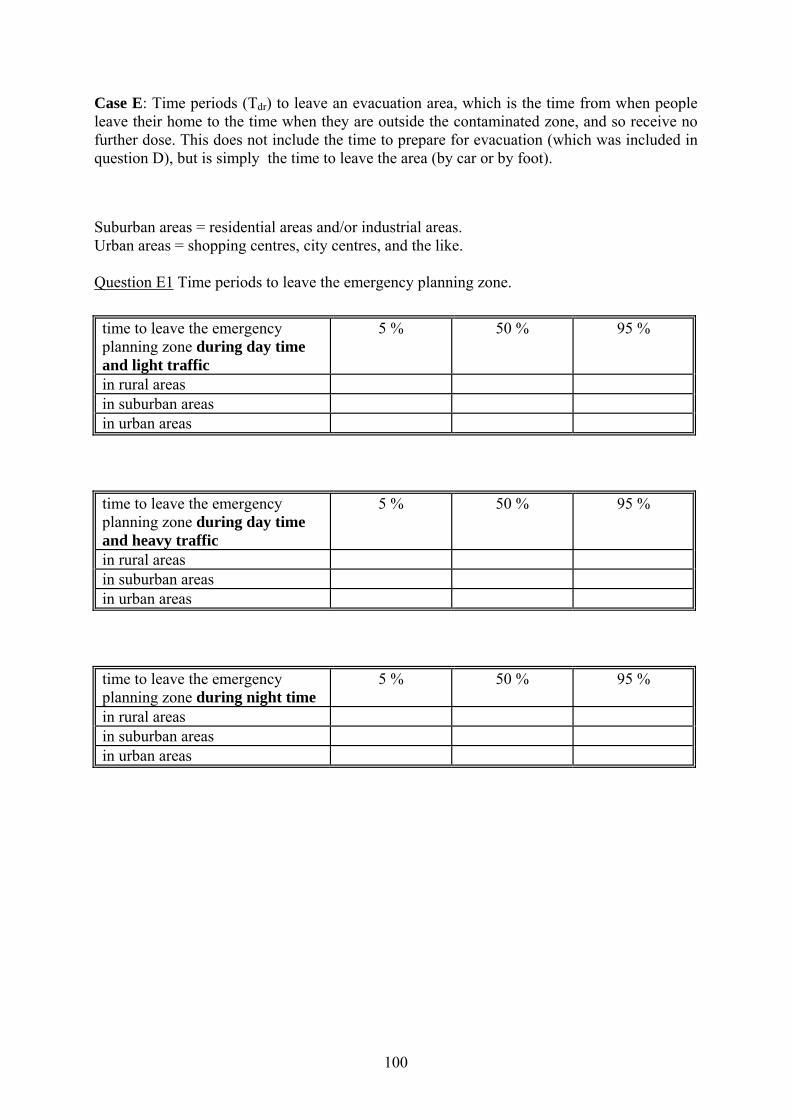
Case E: Time periods (Tdr) to leave an evacuation area, which is the time from when people leave their home to the time when they are outside the contaminated zone, and so receive no further dose. This does not include the time to prepare for evacuation (which was included in question D), but is simply the time to leave the area (by car or by foot).
Suburban areas = residential areas and/or industrial areas. Urban areas = shopping centres, city centres, and the like. Question E1 Time periods to leave the emergency planning zone.
time to leave the emergency planning zone during day time and light traffic
5 % 50 % 95 %
in rural areas in suburban areas in urban areas
time to leave the emergency planning zone during day time and heavy traffic
5 % 50 % 95 %
in rural areas in suburban areas in urban areas
time to leave the emergency planning zone during night time
5 % 50 % 95 %
in rural areas in suburban areas in urban areas
100
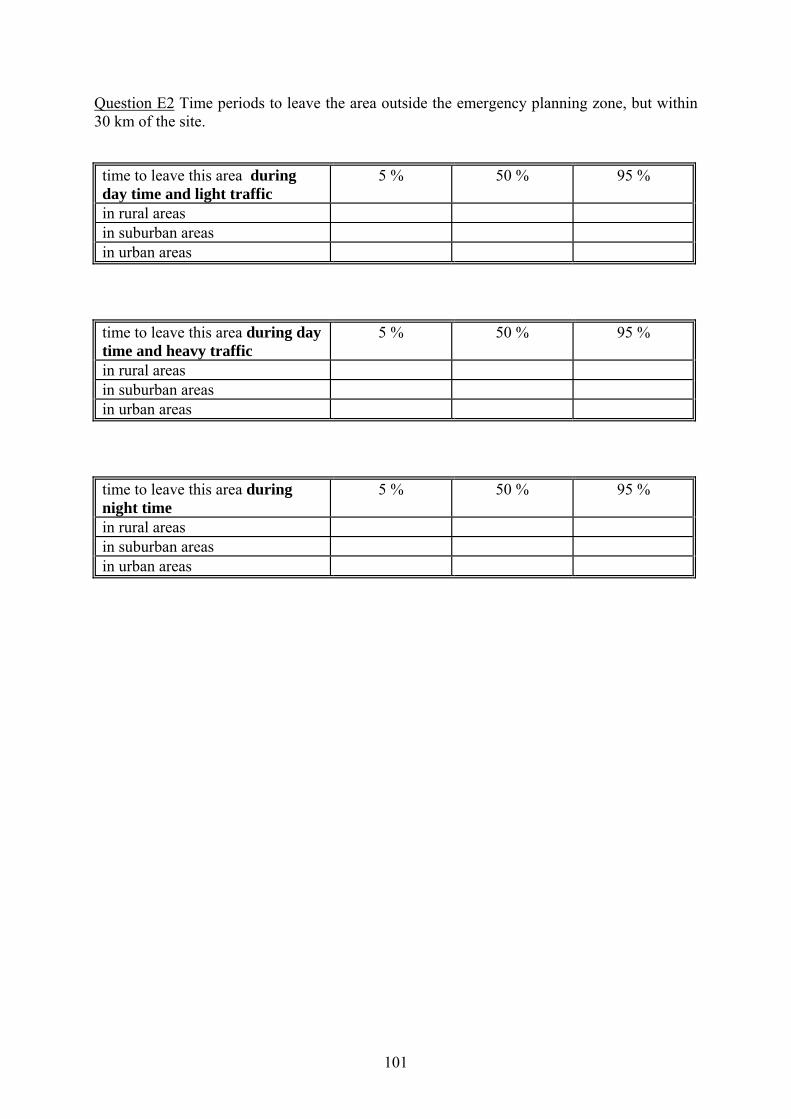
Question E2 Time periods to leave the area outside the emergency planning zone, but within 30 km of the site.
time to leave this area during day time and light traffic
5 % 50 % 95 %
in rural areas in suburban areas in urban areas
time to leave this area during day time and heavy traffic
5 % 50 % 95 %
in rural areas in suburban areas in urban areas
time to leave this area during night time
5 % 50 % 95 %
in rural areas in suburban areas in urban areas
101

Case F: Time periods for people, supposed to be taken the tablets, to take in stable iodine tablets after being notified by the emergency services (Tbeh).
Question F1 What is the percentage of people not responding?
5 % 50 % 95 % What is the percentage of people that has tablets at home (the tablets were distributed prior to the notification), that does not take the tablet?
What is the percentage of people that has to collect the tablets at a pharmacy or other distribution facility (the tablets are available consequent upon the accident), that does not take the tablet?
Question F2 In cases the notification to take in stable iodine tablets is followed by people, how much time does it take for people to take in the tablet, if they have the tablet at home (the tablets were distributed prior to the notification)? time period to take in the tablet 5 % 50 % 95 % for the majority of people that takes the tablet (68 %)
for the vast majority of people that takes the tablet (95 %)
Question F3 In cases the notification to take in stable iodine tablets is followed by people, how much time does it take for people to take in the tablet, if they have to collect the tablet at a pharmacy or other distribution facility (the tablets are available consequent upon the accident)?
time period to take in the tablet 5 % 50 % 95 % for the majority of people that takes the tablet (68 %)
for the vast majority of people that takes the tablet (95 %)
102

Dependencies
Experts are asked to state their conditional probabilities on certain questions. The questions follow a structure such that the positive definitiveness of the covariance matrix would be guaranteed. On the bases of this information and a choice of a certain type of joint distribution, a rank correlation coefficients can be determined.
In estimating the conditional probabilities the expert we ask to consider the following experiment. Conditional probabilities experiment We consider univariate uncertain quantities X and Y with nice and smooth distributions. The marginal distributions of X and Y are assumed known (or already assessed). We consider an experiment for assessing the (rank) correlation between X and Y. In every possible world, X and Y realise specific values. The (rank) correlation is a way of summarising how the realised values of X and Y appear together. If X and Y are positively (rank) correlated, then, roughly, large values of X appear together with large values of Y, and small values of X appear together with small values of Y. If X and Y are negatively correlated then the reverse holds: large values of X appear together with small values of Y, etc. Imagine now that many realisations are examined, and that the values for X and Y in each realisation are recorded on a slip of paper and the paper slips are deposited in a large urn. We will draw, say, 1000 slips of paper from this urn (without replacement). We now discard all slips for which the X value is less than the median X value. We now have roughly 500 slips of paper, since the probability of X being less than its median is (by definition) 1/2. Suppose we have exactly 500 slips left on which X is greater than its median value. We now ask: on how many of these slips will Y be greater than the median Y value? If the answer is "250", then the probability is 1/2 that Y is bigger than its median, given that X is bigger than its median. This would be the case if X and Y were independent. If the answer is "more than 250", then there is a tendency for large X's and large Y's to appear together, and this would be the case if X and Y were positively rank correlated. If the answer is "less than 250" then there is a tendency for large X's and small Y's to appear together, and this would be the case if X and Y were negatively correlated. The expert is asked to describe his/her feeling for correlation by a number N between 0 and 500. This number is substituted into the following equation An appropriate joint distribution will then be selected which • has the assessed marginal distributions • satisfies the above equation • has minimal information among all distributions satisfying the above.
103

Conditional probabilities example question The following conditional probability * Pr(time period to organise the emergency services and to notify people in the
emergency planning zone to shelter above the median | time period to notify the responsible authority Tnot above the median) = ?
should be read as follows: Given the value for the time period to notify the responsible authority Tnot is above the median value (as assessed by the expert), what would the probability be that the time period to organise the emergency services and to notify people in the emergency planning zone to shelter is above the median value.
104

Conditional probabilities questions (all questions relate to day time, unless otherwise stated) Related to case B1: General emergency immediately 1. Pr(time period to organise the emergency services and to notify people in the
emergency planning zone to shelter above the median | time period to notify the responsible authority (Tnot) above the median) = ?
2. Pr(time period to organise the emergency services and notify people to shelter outside
the emergency planning zone, but within 30 km of the site above the median | time period to organise emergency services and to notify people in the emergency planning zone to shelter above the median) = ?
3. Pr(time period to organise emergency services and to notify people in the area outside
30 km of the site to shelter above the median | time period to organise the emergency services and notify people to shelter in the area within 30 km of the site above the median) = ?
4. Pr(time period to organise emergency services and to notify people in the emergency planning zone to evacuate immediately above the median | time period to notify the responsible authority above the median) = ?
5. Pr(time period to organise the emergency services and to notify the people in the emergency planning zone to evacuate immediately above the median | time period to organise emergency services and to notify people outside the emergency planning zone, but within 30 km of the site to evacuate immediately above the median) = ?
6. Pr(time period to organise emergency services and to notify people in the emergency planning zone to evacuate after a period of sheltering above the median | time period to notify the responsible authority above the median) = ?
7. Pr(time period to organise the emergency services and to notify the people in the emergency planning zone to evacuate after a period of sheltering above the median | time period to organise emergency services and to notify people outside the emergency planning zone, but within 30 km of the site to evacuate after a period of sheltering above the median) = ?
105

Related to case B2: First a site area emergency followed by a general emergency.
Note. The questions under Related to B2 need only be answered in the case that the dependencies deviate from the values provided for the questions posed under Related to B1
8. Pr(time period to organise the emergency services and to notify people in the emergency planning zone to shelter above the median | time period to ntify the responsible authority (Tnot) above the median) = ?
9. Pr(time period to organise the emergency services and notify people to shelter outside the emergency planning zone, but within 30 km of the site above the median | time period to organise emergency services and to notify people in the emergency planning zone to shelter above the median) = ?
10. Pr(time period to organise emergency services and to notify people in the area outside 30 km of the site to shelter above the median | time period to organise the emergency services and notify people to shelter in the area within 30 km of the site above the median) = ?
11. Pr(time period to organise emergency services and to notify people in the emergency planning zone to evacuate immediately above the median | time period to notify the responsible authority above the median) = ?
12. Pr(time period to organise the emergency services and to notify the people in the emergency planning zone to evacuate immediately above the median | time period to organise emergency services and to notify people outside the emergency planning zone, but within 30 km of the site to evacuate immediately above the median) = ?
13. Pr(time period to organise emergency services and to notify people in the emergency planning zone to evacuate after a period of sheltering above the median | time period to notify the responsible authority above the median) = ?
14. Pr(time period to organise the emergency services and to notify the people in the emergency planning zone to evacuate after a period of sheltering above the median | time period to organise emergency services and to notify people outside the emergency planning zone, but within 30 km of the site to evacuate after a period of sheltering above the median) = ?
106

Related to case C: people are notified to shelter only within the area outside the emergency planning zone, but within 30 km of the site.
15. Pr(percentage of people who stays outdoors, ignoring the notification to shelter above the median | time period to organise emergency services and to notify people outside the emergency planning zone, but within 30 km of the site to evacuate immediately above the median ) = ?
16. Pr(percentage of people who stays outdoors, not receiving the notification to shelter above the median | time period to organise emergency services and to notify people outside the emergency planning zone, but within 30 km of the site to evacuate immediately above the median ) = ?
17. Pr(percentage of people who decides to evacuate spontaneously above the median | time period to organise emergency services and to notify people outside the emergency planning zone, but within 30 km of the site to evacuate immediately above the median) = ?
18. Pr(time period to implement the action to shelter [Tbeh] for the majority of people above the median | time period to organise emergency services and to notify people outside the emergency planning zone, but within 30 km of the site to evacuate immediately above the median) = ?
19. Pr(time period to implement the action to shelter [Tbeh] for the vast majority of people above the median | time period to implement the action to shelter [Tbeh] for the majority of people above the median) = ?
20. Pr(percentage of people who leaves their shelters in less than the required period of 3 hours (day time period) above the median | time period to implement the action to shelter [Tbeh] for the vast majority of people above the median) = ?
21. Pr(percentage of people who leaves their shelters in less than the required period of 8 hours (mostly day time) above the median | percentage of people who leaves their shelters in less than the required period of 3 hours (day time period) above the median) = ?
22. Pr(percentage of people who leaves their shelters in less than the required period of 12 hours (starts in day time) above the median | percentage of people who leaves their shelters in less than the required period of 8 hours (mostly day time) above the median) = ?
107

23. Pr(percentage of people who leaves their shelters in less than the required period of 8 hours (mostly night time) above the median | percentage of people who leaves their shelters in less than the required period of 3 hours (night time period) above the median) = ?
24. Pr(percentage of people who leaves their shelters in less than the required period of 124hours above the median | percentage of people who leaves their shelters in less than the required period of 8 hours (mostly night time) above the median) = ?
Related to case D: people are notified to evacuate within the area outside the emergency planning zone, but within 30 km of the site.
.
25. Pr(percentage of people who ignores the notification to evacuate above the median | time period to organise emergency services and to notify people outside the emergency planning zone, but within 30 km of the site to evacuate immediately above the median) = ?
26. Pr(percentage of people who does not receive the notification to evacuate above the median | time period to organise emergency services and to notify people outside the emergency planning zone, but within 30 km of the site to evacuate immediately above the median) = ?
27. Pr(percentage of people who decides to evacuate, but does follow the order of organised evacuation above the median | time period to organise emergency services and to notify people outside the emergency planning zone, but within 30 km of the site to evacuate immediately above the median) = ?
28. Pr(time period to implement the action of organised evacuation [Tbeh] during working days for the majority of people above the median | time period to organise emergency services and to notify people outside the emergency planning zone, but within 30 km of the site to evacuate immediately above the median) = ?
29. Pr(time period to implement the action of organised evacuation [Tbeh] during working days or the vast majority of people above the median | time period to implement the action of organised evacuation [Tbeh] during working days or the majority of people) = ?
30. Pr(time period to implement the action of organised evacuation [Tbeh] during weekends and holidays for the majority of people above the median | time period to organise emergency services and to notify people outside the emergency planning zone, but within 30 km of the site to evacuate immediately above the median) = ?
108

31. Pr(time period to implement the action of organised evacuation [Tbeh] during weekends and holidays or the vast majority of people above the median | time period to implement the action of organised evacuation [Tbeh] during weekends and holidays or the majority of people) = ?
32. Pr(time period to implement the action of organised evacuation [Tbeh] during working days for the majority of people above the median | time period to organise emergency services and to notify people outside the emergency planning zone, but within 30 km of the site to evacuate immediately above the median) = ?
33. Pr(time period to implement the action of evacuation by not following the order of organised evacuation [Tbeh] during working days or the vast majority of people above the median | time period to implement the action of organised evacuation [Tbeh] during working days or the majority of people) = ?
34. Pr(time period to implement the action of evacuation by not following the order of organised evacuation [Tbeh] during weekends and holidays for the majority of people above the median | time period to organise emergency services and to notify people outside the emergency planning zone, but within 30 km of the site to evacuate immediately above the median) = ?
35. Pr(time period to implement the action of evacuation by not following the order of organised evacuation [Tbeh] during weekends and holidays or the vast majority of people above the median | time period to implement the action of evacuation by not following the order of organised evacuation [Tbeh] during weekends and holidays or the majority of people) = ?
Related to case E: time periods to leave an evacuation area.
36. Pr(time to leave a rural emergency planning zone during daytime and light traffic above the median | time period to organise emergency services and to notify people in a rural emergency planning zone to evacuate after a period of sheltering first above the median) = ?
37. Pr(time to leave a suburban emergency planning zone during daytime and light traffic above the median | time period to organise emergency services and to notify people in a rural emergency planning zone to evacuate after a period of sheltering first above the median) = ?
38. Pr(time to leave an urban emergency planning zone during daytime and light traffic above the median | time period to organise emergency services and to notify people in a rural emergency planning zone to evacuate after a period of sheltering first above the median) = ?
109
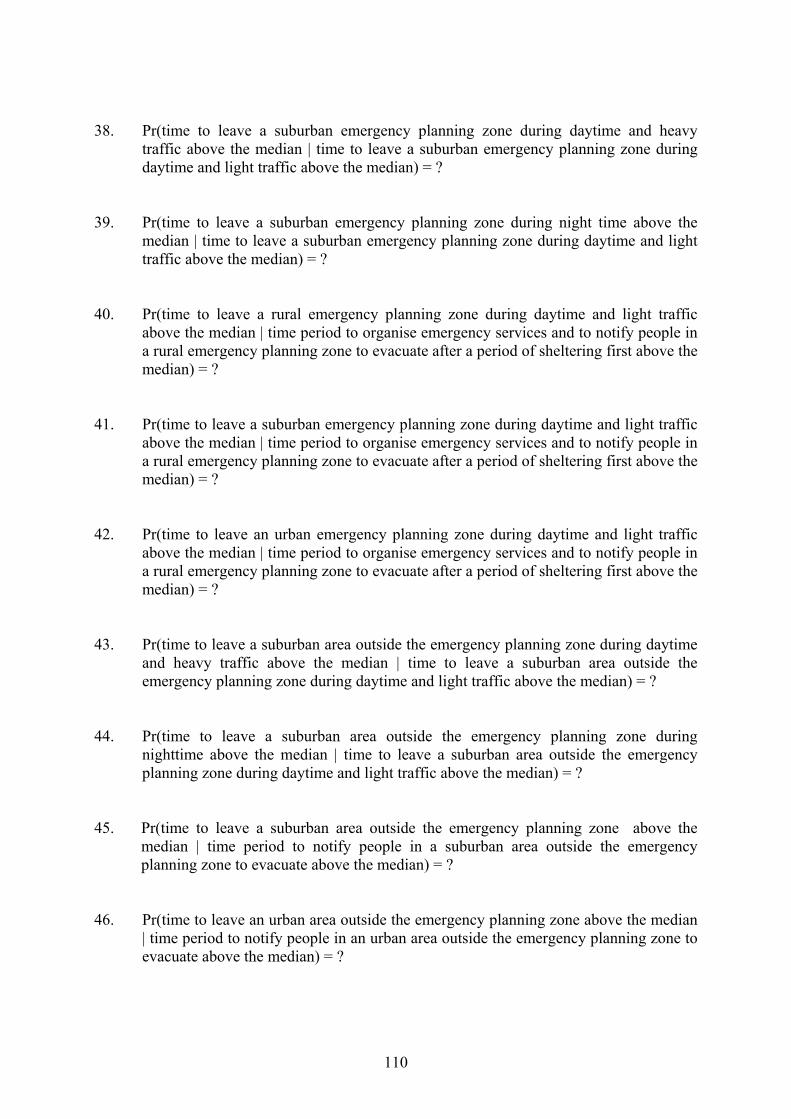
38. Pr(time to leave a suburban emergency planning zone during daytime and heavy traffic above the median | time to leave a suburban emergency planning zone during daytime and light traffic above the median) = ?
39. Pr(time to leave a suburban emergency planning zone during night time above the median | time to leave a suburban emergency planning zone during daytime and light traffic above the median) = ?
40. Pr(time to leave a rural emergency planning zone during daytime and light traffic above the median | time period to organise emergency services and to notify people in a rural emergency planning zone to evacuate after a period of sheltering first above the median) = ?
41. Pr(time to leave a suburban emergency planning zone during daytime and light traffic above the median | time period to organise emergency services and to notify people in a rural emergency planning zone to evacuate after a period of sheltering first above the median) = ?
42. Pr(time to leave an urban emergency planning zone during daytime and light traffic above the median | time period to organise emergency services and to notify people in a rural emergency planning zone to evacuate after a period of sheltering first above the median) = ?
43. Pr(time to leave a suburban area outside the emergency planning zone during daytime and heavy traffic above the median | time to leave a suburban area outside the emergency planning zone during daytime and light traffic above the median) = ?
44. Pr(time to leave a suburban area outside the emergency planning zone during nighttime above the median | time to leave a suburban area outside the emergency planning zone during daytime and light traffic above the median) = ?
45. Pr(time to leave a suburban area outside the emergency planning zone above the median | time period to notify people in a suburban area outside the emergency planning zone to evacuate above the median) = ?
46. Pr(time to leave an urban area outside the emergency planning zone above the median | time period to notify people in an urban area outside the emergency planning zone to evacuate above the median) = ?
110

47. Pr(driving time to leave rural area within 30 km of the site above the median | time to leave rural area within 30 km of the site above the median) = ?
48. Pr(driving time to leave suburban area within 30 km of the site above the median | time to leave suburban area within 30 km of the site above the median) = ?
49. Pr(driving time to leave urban area within 30 km of the site above the median | time to leave urban area within 30 km of the site above the median) = ?
50. Pr(time to leave rural area B above the median | time period to notify people in rural area B to evacuate above the median) = ?
51. Pr(time to leave suburban area B above the median | time period to notify people in suburban area B to evacuate above the median) = ?
52. Pr(time to leave urban area B above the median | time period to notify people in urban area B to evacuate above the median) = ?
53. Pr(driving time to leave rural area B above the median | time to leave rural area B above the median) = ?
54. Pr(driving time to leave suburban area B above the median | time to leave suburban area B above the median) = ?
55. Pr(driving time to leave urban area B above the median | time to leave urban area B above the median) = ?
Related to case F: stable iodine tablets.
56. Pr(percentage of people that does not take the tablet which is at home above the median | time period to notify people in area within 30 km of the site to shelter above the median) = ?
57. Pr(time period to take in the tablet which is at home, for the majority of people above the median | percentage of people that does not take the tablet which is at home above the median) = ?
58. Pr(time period to take in the tablet which is at home, for the vast majority of people above the median | time period to take in the tablet which is at home, for the majority of people above the median) = ?
111

59. Pr(percentage of people that does not take the tablet which is at a pharmacy or other distribution facility above the median | time period to notify people in area within 30 km of the site to shelter above the median) = ?
60. Pr(time period to take in the tablet which is at a pharmacy or other distribution facility, for the majority of people above the median | percentage of people that does not take the tablet which is at a pharmacy or other distribution facility above the median) = ?
61. Pr(time period to take in the tablet which is at a pharmacy or other distribution facility, for the vast majority of people above the median | time period to take in the tablet which is at a pharmacy or other distribution facility, for the majority of people above the median) = ?
112

APPENDIX C
Responses and rationales of the expert panel on early emergency actions
For the responses the codes are: A1 through to F3 refers to cases A to F and the various sub-questions sh/ie/de/ev/iod means sheltering/immediate evacuation/delayed evacuation after a period of sheltering first/evacuation/stable iodine tablets epz/<30/>30 means emergency planning zone/zone outside emergency planning zone, but within 30 km of site/zone outside 30 km of site day/nigh/wen/rush means day time/night time/weekends/rush hours not/yes (in C1) means not responding/do shelter igno/notr/spon (in C1) means ignoring the notification/not having received the notification/spontaneous evacuation (in cases people are notified to shelter) maj/vmaj means majority of people (68%)/vast majority of people (95%) day/sch/swc (in D1) means day time/at schools/under severe weather conditions igno/notr/nfor (in D1) means ignoring the notification/not having received the notification/evacuation, but following the order (in cases people are notified to evacuate) fo/nf means following the order to evacuate/not following the order to evacuate wd/wh means working days/weekends and holidays ma/vm means majority of people (68%)/vast majority of people (95%) daylt/dayht/night (in E1) means day time with light traffic/day time with heavy traffic/night time r/s/u means rural area/suburban area/urban area not/hom/dis (in F) means not responding/taking tablets at home/taking tablets at distribution facility
113

Responses Expert 1 (Murray, UK) 1 exp 1 1 A1-day time UNI 2.000E+0001 3.000E+0001 5.000E+0001 1 exp 1 2 A1-night time UNI 3.000E+0001 4.500E+0001 6.000E+0001 1 exp 1 3 A1-weekend UNI 3.000E+0001 4.500E+0001 6.000E+0001 1 exp 1 4 A1-rush hours UNI 3.000E+0001 4.500E+0001 6.000E+0001 1 exp 1 5 B1-sh-epz-day UNI 2.000E+0001 3.000E+0001 5.000E+0001 1 exp 1 6 B1-sh-epz-nigh UNI 2.000E+0001 4.000E+0001 6.000E+0001 1 exp 1 7 B1-sh-epz-wen UNI 2.000E+0001 4.000E+0001 6.000E+0001 1 exp 1 8 B1-sh-epz-rush UNI 2.000E+0001 4.000E+0001 6.000E+0001 1 exp 1 9 B1-sh-<30-day UNI 2.000E+0001 3.000E+0001 1.200E+0002 1 exp 1 10 B1-sh-<30-nigh UNI 2.000E+0001 3.600E+0002 6.000E+0002 1 exp 1 11 B1-sh-<30-wend UNI 2.000E+0001 3.600E+0002 6.000E+0002 1 exp 1 12 B1-sh-<30-rush UNI 2.000E+0001 1.200E+0002 1.800E+0002 1 exp 1 13 B1-sh->30-day UNI 2.000E+0001 3.000E+0001 1.200E+0002 1 exp 1 14 B1-sh->30-nigh UNI 2.000E+0001 3.600E+0002 6.000E+0002 1 exp 1 15 B1-sh->30-wend UNI 2.000E+0001 3.600E+0002 6.000E+0002 1 exp 1 16 B1-sh->30-rush UNI 2.000E+0001 1.200E+0002 1.800E+0002 1 exp 1 17 B1-ie-epz-day UNI 2.000E+0001 3.500E+0001 5.000E+0001 1 exp 1 18 B1-ie-epz-nigh UNI 2.000E+0001 4.500E+0001 6.000E+0001 1 exp 1 19 B1-ie-epz-wend UNI 2.000E+0001 4.500E+0001 6.000E+0001 1 exp 1 20 B1-ie-epz-rush UNI 2.000E+0001 4.500E+0001 6.000E+0001 1 exp 1 21 B1-ie-<30-day UNI 7.200E+0002 1.440E+0003 2.880E+0003 1 exp 1 22 B1-ie-<30-nigh UNI 9.000E+0002 1.440E+0003 2.880E+0003 1 exp 1 23 B1-ie-<30-wend UNI 9.000E+0002 1.440E+0003 2.880E+0003 1 exp 1 24 B1-ie-<30-rush UNI 9.000E+0002 1.440E+0003 2.880E+0003 1 exp 1 25 B1-de-epz-day UNI 2.000E+0001 4.000E+0001 6.000E+0001 1 exp 1 26 B1-de-epz-nigh UNI 2.000E+0001 5.000E+0001 7.000E+0001 1 exp 1 27 B1-de-epz-wend UNI 2.000E+0001 5.000E+0001 7.000E+0001 1 exp 1 28 B1-de-epz-rush UNI 2.000E+0001 5.000E+0001 6.000E+0001 1 exp 1 29 B1-de-<30-day UNI 2.000E+0001 4.000E+0001 1.200E+0002 1 exp 1 30 B1-de-<30-nigh UNI 2.000E+0001 5.000E+0001 1.800E+0002 1 exp 1 31 B1-de-<30-wend UNI 2.000E+0001 5.000E+0001 1.800E+0002 1 exp 1 32 B1-de-<30-rush UNI 2.000E+0001 5.000E+0001 1.200E+0002 1 exp 1 33 B2-sh-epz-day UNI 2.000E+0001 3.000E+0001 5.000E+0001 1 exp 1 34 B2-sh-epz-nigh UNI 2.000E+0001 4.000E+0001 6.000E+0001 1 exp 1 35 B2-sh-epz-wend UNI 2.000E+0001 4.000E+0001 6.000E+0001 1 exp 1 36 B2-sh-epz-rush UNI 2.000E+0001 4.000E+0001 6.000E+0001 1 exp 1 37 B2-sh-<30-day UNI 7.200E+0002 1.440E+0003 2.880E+0003 1 exp 1 38 B2-sh-<30-nigh UNI 9.000E+0002 1.440E+0003 2.880E+0003 1 exp 1 39 B2-sh-<30-wend UNI 9.000E+0002 1.440E+0003 2.880E+0003 1 exp 1 40 B2-sh-<30-rush UNI 9.000E+0002 1.440E+0003 2.880E+0003 1 exp 1 41 B2-sh->30-day UNI 7.200E+0002 1.440E+0003 4.320E+0003 1 exp 1 42 B2-sh->30-nigh UNI 9.000E+0002 1.440E+0003 4.320E+0003 1 exp 1 43 B2-sh->30-wend UNI 9.000E+0002 1.440E+0003 4.320E+0003 1 exp 1 44 B2-sh->30-rush UNI 9.000E+0002 1.440E+0003 4.320E+0003 1 exp 1 45 B2-ie-epz-day UNI 2.000E+0001 3.000E+0001 6.000E+0001 1 exp 1 46 B2-ie-epz-nigh UNI 2.000E+0001 4.500E+0001 9.000E+0001 1 exp 1 47 B2-ie-epz-wend UNI 2.000E+0001 4.500E+0001 9.000E+0001 1 exp 1 48 B2-ie-epz-rush UNI 2.000E+0001 4.500E+0001 9.000E+0001 1 exp 1 49 B2-ie-<30-day UNI 7.200E+0002 1.440E+0003 2.880E+0003 1 exp 1 50 B2-ie-<30-nigh UNI 9.000E+0002 1.440E+0003 2.880E+0003 1 exp 1 51 B2-ie-<30-wend UNI 9.000E+0002 1.440E+0003 2.880E+0003 1 exp 1 52 B2-ie-<30-rush UNI 9.000E+0002 1.440E+0003 2.880E+0003 1 exp 1 53 B2-de-epz-day UNI 2.000E+0001 3.000E+0001 6.000E+0001 1 exp 1 54 B2-de-epz-nigh UNI 2.000E+0001 3.000E+0001 9.000E+0001 1 exp 1 55 B2-de-epz-wend UNI 2.000E+0001 3.000E+0001 9.000E+0001 1 exp 1 56 B2-de-epz-rush UNI 2.000E+0001 3.000E+0001 9.000E+0001 1 exp 1 57 B2-de-<30-day UNI 1.800E+0002 7.200E+0002 1.440E+0003 1 exp 1 58 B2-de-<30-nigh UNI 3.600E+0002 1.080E+0003 2.880E+0003 1 exp 1 59 B2-de-<30-wend UNI 3.600E+0002 1.080E+0003 2.880E+0003 1 exp 1 60 B2-de-<30-rush UNI 3.600E+0002 1.080E+0003 2.880E+0003 1 exp 1 61 C1-sh-not-igno UNI 1.000E-0001 5.000E+0000 1.000E+0001 1 exp 1 62 C1-sh-not-notr UNI 5.000E+0000 3.500E+0001 6.500E+0001 1 exp 1 63 C1-sh-not-spon UNI 5.000E+0000 2.000E+0001 3.000E+0001 1 exp 1 64 C2-sh-yes-maj UNI 2.000E+0001 4.500E+0001 1.800E+0002
114

1 exp 1 65 C2-sh-yes-vmaj UNI 4.500E+0001 6.000E+0001 2.400E+0002 1 exp 1 66 C3-sh-leave<3d UNI 1.000E+0000 5.000E+0000 1.000E+0001 1 exp 1 67 C3-sh-leave<8d UNI 5.000E+0000 1.500E+0001 2.500E+0001 1 exp 1 68 C3-sh-leave<12 UNI 1.000E+0001 2.500E+0001 5.000E+0001 1 exp 1 69 C3-sh-leave<3n UNI 5.000E-0001 1.000E+0000 5.000E+0000 1 exp 1 70 C3-sh-leave<8n UNI 5.000E+0000 1.000E+0001 2.500E+0001 1 exp 1 71 C3-sh-leave<24 UNI 1.000E+0001 3.000E+0001 8.500E+0001 1 exp 1 72 D1-ev-day-igno UNI 5.000E-0001 1.000E+0000 2.000E+0000 1 exp 1 73 D1-ev-day-notr UNI 5.000E+0000 3.500E+0001 6.500E+0001 1 exp 1 74 D1-ev-day-nfor UNI 1.000E-0001 5.000E-0001 5.000E+0000 1 exp 1 75 D1-ev-sch-igno UNI 1.000E-0001 5.000E-0001 1.000E+0000 1 exp 1 76 D1-ev-sch-nfor UNI 1.000E-0001 2.500E-0001 1.000E+0000 1 exp 1 77 D1-ev-swc-igno UNI 1.000E+0000 5.000E+0000 2.500E+0001 1 exp 1 78 D1-ev-swc-notr UNI 5.000E+0000 3.500E+0001 6.500E+0001 1 exp 1 79 D1-ev-swc-nfor UNI 1.000E-0001 5.000E-0001 5.000E+0000 1 exp 1 80 D2-ev-fo-wd-ma UNI 5.000E+0000 1.500E+0001 1.200E+0002 1 exp 1 81 D2-ev-fo-wd-vm UNI 1.500E+0001 3.000E+0001 1.800E+0002 1 exp 1 82 D2-ev-fo-wh-ma UNI 5.000E+0000 1.500E+0001 1.200E+0002 1 exp 1 83 D2-ev-fo-wh-vm UNI 1.500E+0001 3.000E+0001 1.800E+0002 1 exp 1 84 D3-ev-nf-wd-ma UNI 5.000E+0000 1.500E+0001 1.200E+0002 1 exp 1 85 D3-ev-nf-wd-vm UNI 1.500E+0001 3.000E+0001 1.800E+0002 1 exp 1 86 D3-ev-nf-wh-ma UNI 5.000E+0000 1.500E+0001 1.200E+0002 1 exp 1 87 D3-ev-nf-wh-vm UNI 1.500E+0001 3.000E+0001 1.800E+0002 1 exp 1 88 E1-epz-daylt-r UNI 1.000E+0001 1.500E+0001 6.000E+0001 1 exp 1 89 E1-epz-daylt-s UNI 1.000E+0001 1.500E+0001 9.000E+0001 1 exp 1 90 E1-epz-daylt-u UNI 1.000E+0001 2.000E+0001 1.200E+0002 1 exp 1 91 E1-epz-dayht-r UNI 1.000E+0001 2.000E+0001 6.000E+0001 1 exp 1 92 E1-epz-dayht-s UNI 1.000E+0001 2.000E+0001 1.200E+0002 1 exp 1 93 E1-epz-dayht-u UNI 1.000E+0001 6.000E+0001 1.800E+0002 1 exp 1 94 E1-epz-night-r UNI 1.000E+0001 1.500E+0001 6.000E+0001 1 exp 1 95 E1-epz-night-s UNI 1.000E+0001 1.500E+0001 6.000E+0001 1 exp 1 96 E1-epz-night-u UNI 1.000E+0001 1.500E+0001 9.000E+0001 1 exp 1 97 E2-<30-daylt-r UNI 3.000E+0001 4.500E+0001 6.000E+0001 1 exp 1 98 E2-<30-daylt-s UNI 3.000E+0001 6.000E+0001 1.200E+0002 1 exp 1 99 E2-<30-daylt-u UNI 3.000E+0001 7.500E+0001 1.200E+0002 1 exp 1 100 E2-<30-dayht-r UNI 3.000E+0001 6.000E+0001 1.200E+0002 1 exp 1 101 E2-<30-dayht-s UNI 3.000E+0001 7.500E+0001 1.200E+0002 1 exp 1 102 E2-<30-dayht-u UNI 3.000E+0001 1.200E+0002 1.800E+0002 1 exp 1 103 E2-<30-night-r UNI 3.000E+0001 4.500E+0001 6.000E+0001 1 exp 1 104 E2-<30-night-s UNI 3.000E+0001 6.000E+0001 1.200E+0002 1 exp 1 105 E2-<30-night-u UNI 3.000E+0001 7.500E+0001 1.200E+0002 1 exp 1 106 F1-iod-not-hom UNI 1.000E-0001 2.000E+0000 5.000E+0000 1 exp 1 107 F1-iod-not-dis UNI 1.000E-0001 1.000E+0000 3.000E+0000 1 exp 1 108 F2-iod-hom-maj UNI 1.000E+0000 1.000E+0001 3.000E+0001 1 exp 1 109 F2-iod-hom-vma UNI 1.000E+0000 1.000E+0001 7.200E+0002 1 exp 1 110 F3-iod-dis-maj UNI 1.000E+0001 1.500E+0001 2.000E+0001 1 exp 1 111 F3-iod-dis-vma UNI 1.000E+0001 1.500E+0001 2.000E+0001
115

Rationale Expert 1 (Murray, UK) 1. Values obtained from discussions with Police Divisional Commander, specialist in Public
Health, ‘Host’ District Council Liaison Officer, and Nuclear Power Plant Operator’s representative, led by Chief Emergency Planing Officer for Cumbria.
2. Cumbria is ‘host’ to two nuclear sites – one is predominantly rural (with fewer than 100 people living within the 2 km detailed emergency planning zone determined by the UK’s Nuclear Regulator); the other lies within an urban area (with several hundred people living within the 550 m detailed emergency planning zone).
3. The concept of a 30 km zone is meaningless in the UK, in that no specific plans exist for Public Safety Countermeasures out to, or beyond that distance.
4. Times for evacuation from the urban site in Cumbria are not large since, for 550 m, most people could walk away from that zone without the need for personal vehicles or mass transit systems.
5. We do not yet have, but may soon establish an automated telephone warning system to reduce the time necessary to broadcast awareness amongst a threatened population and advice concerning the need for sheltering, evacuation, iodine tablets etc. Responses given to the questionnaire are, however, based on existing arrangements (depending largely on television, radio and person to person contact).
6. There seems little significance to an intimation of ‘site emergency’ before ‘general emergency’ in the context of public reaction time, since we here do not announce a site emergency to the news media or members of the local public.
7. The significance of ‘rush hours’ and possible differences between day time, night time and weekend response times for public reaction is not likely to be great for our rural site, but is significant for our urban site.
8. The %age of people determined to leave shelter after 3 hrs, 8 hrs and 12 hrs will be affected not only by time of day, but time of year, and behaviour for the 12 hrs period (even starting ‘in day time’) depends on exactly when the 12 hrs period starts (early day time or late night time?). That is covered by the uncertainty ranges.
9. Organised evacuation by privately owned cars, sharing free space with neighbours, is likely to be more assured than by mass transit systems which require collection arrangements and assumes that buses etc. will be available and that drivers will enter the affected area.
10. The local population, for the purposes of the study, do not include the 15,000 members of BNFL Sellafield’s workforce, or several hundred day visitors per day either in the visitors centre or actually on-site. It is planned that BNFL staff will be kept on-site behind closed gated, in shelter, until the situation becomes clear, and planned release from buildings can be arranged.
11. Iodine tablets have been pre-distributed throughout the detailed emergency planning zone (DEPZ) for both sites and are available to anyone else out to a distance of 3 x DEPZ who specially requests them.
116
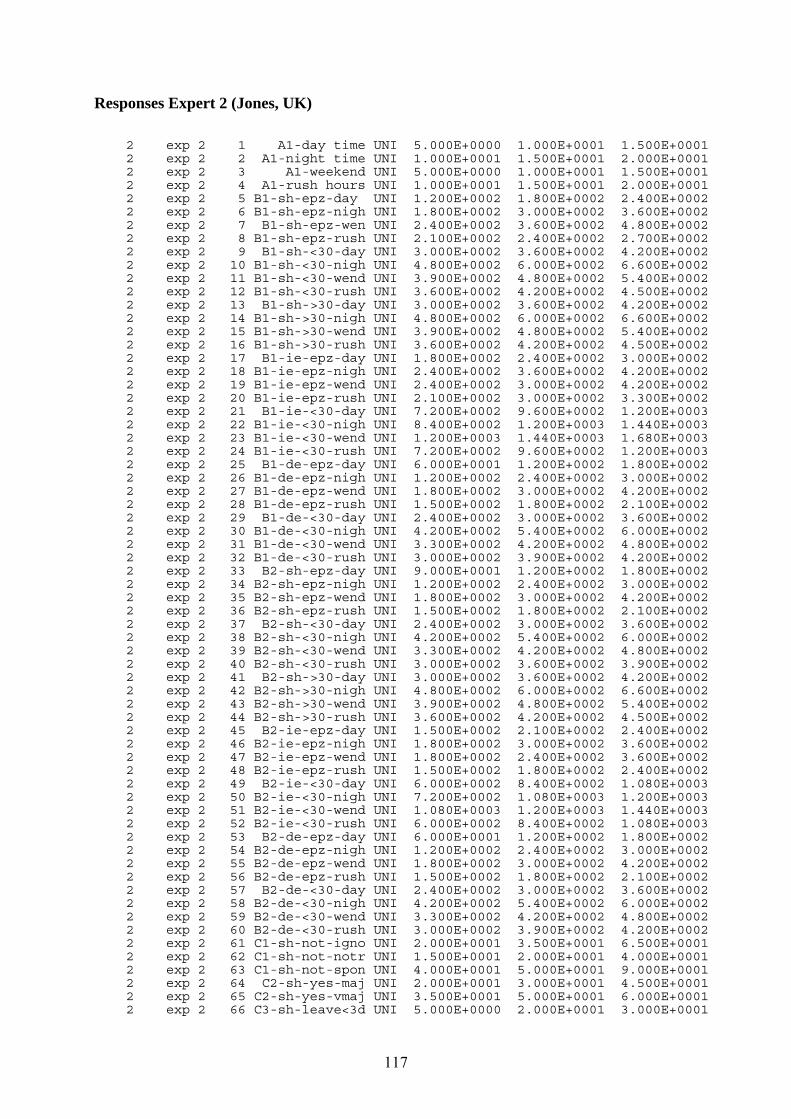
Responses Expert 2 (Jones, UK) 2 exp 2 1 A1-day time UNI 5.000E+0000 1.000E+0001 1.500E+0001 2 exp 2 2 A1-night time UNI 1.000E+0001 1.500E+0001 2.000E+0001 2 exp 2 3 A1-weekend UNI 5.000E+0000 1.000E+0001 1.500E+0001 2 exp 2 4 A1-rush hours UNI 1.000E+0001 1.500E+0001 2.000E+0001 2 exp 2 5 B1-sh-epz-day UNI 1.200E+0002 1.800E+0002 2.400E+0002 2 exp 2 6 B1-sh-epz-nigh UNI 1.800E+0002 3.000E+0002 3.600E+0002 2 exp 2 7 B1-sh-epz-wen UNI 2.400E+0002 3.600E+0002 4.800E+0002 2 exp 2 8 B1-sh-epz-rush UNI 2.100E+0002 2.400E+0002 2.700E+0002 2 exp 2 9 B1-sh-<30-day UNI 3.000E+0002 3.600E+0002 4.200E+0002 2 exp 2 10 B1-sh-<30-nigh UNI 4.800E+0002 6.000E+0002 6.600E+0002 2 exp 2 11 B1-sh-<30-wend UNI 3.900E+0002 4.800E+0002 5.400E+0002 2 exp 2 12 B1-sh-<30-rush UNI 3.600E+0002 4.200E+0002 4.500E+0002 2 exp 2 13 B1-sh->30-day UNI 3.000E+0002 3.600E+0002 4.200E+0002 2 exp 2 14 B1-sh->30-nigh UNI 4.800E+0002 6.000E+0002 6.600E+0002 2 exp 2 15 B1-sh->30-wend UNI 3.900E+0002 4.800E+0002 5.400E+0002 2 exp 2 16 B1-sh->30-rush UNI 3.600E+0002 4.200E+0002 4.500E+0002 2 exp 2 17 B1-ie-epz-day UNI 1.800E+0002 2.400E+0002 3.000E+0002 2 exp 2 18 B1-ie-epz-nigh UNI 2.400E+0002 3.600E+0002 4.200E+0002 2 exp 2 19 B1-ie-epz-wend UNI 2.400E+0002 3.000E+0002 4.200E+0002 2 exp 2 20 B1-ie-epz-rush UNI 2.100E+0002 3.000E+0002 3.300E+0002 2 exp 2 21 B1-ie-<30-day UNI 7.200E+0002 9.600E+0002 1.200E+0003 2 exp 2 22 B1-ie-<30-nigh UNI 8.400E+0002 1.200E+0003 1.440E+0003 2 exp 2 23 B1-ie-<30-wend UNI 1.200E+0003 1.440E+0003 1.680E+0003 2 exp 2 24 B1-ie-<30-rush UNI 7.200E+0002 9.600E+0002 1.200E+0003 2 exp 2 25 B1-de-epz-day UNI 6.000E+0001 1.200E+0002 1.800E+0002 2 exp 2 26 B1-de-epz-nigh UNI 1.200E+0002 2.400E+0002 3.000E+0002 2 exp 2 27 B1-de-epz-wend UNI 1.800E+0002 3.000E+0002 4.200E+0002 2 exp 2 28 B1-de-epz-rush UNI 1.500E+0002 1.800E+0002 2.100E+0002 2 exp 2 29 B1-de-<30-day UNI 2.400E+0002 3.000E+0002 3.600E+0002 2 exp 2 30 B1-de-<30-nigh UNI 4.200E+0002 5.400E+0002 6.000E+0002 2 exp 2 31 B1-de-<30-wend UNI 3.300E+0002 4.200E+0002 4.800E+0002 2 exp 2 32 B1-de-<30-rush UNI 3.000E+0002 3.900E+0002 4.200E+0002 2 exp 2 33 B2-sh-epz-day UNI 9.000E+0001 1.200E+0002 1.800E+0002 2 exp 2 34 B2-sh-epz-nigh UNI 1.200E+0002 2.400E+0002 3.000E+0002 2 exp 2 35 B2-sh-epz-wend UNI 1.800E+0002 3.000E+0002 4.200E+0002 2 exp 2 36 B2-sh-epz-rush UNI 1.500E+0002 1.800E+0002 2.100E+0002 2 exp 2 37 B2-sh-<30-day UNI 2.400E+0002 3.000E+0002 3.600E+0002 2 exp 2 38 B2-sh-<30-nigh UNI 4.200E+0002 5.400E+0002 6.000E+0002 2 exp 2 39 B2-sh-<30-wend UNI 3.300E+0002 4.200E+0002 4.800E+0002 2 exp 2 40 B2-sh-<30-rush UNI 3.000E+0002 3.600E+0002 3.900E+0002 2 exp 2 41 B2-sh->30-day UNI 3.000E+0002 3.600E+0002 4.200E+0002 2 exp 2 42 B2-sh->30-nigh UNI 4.800E+0002 6.000E+0002 6.600E+0002 2 exp 2 43 B2-sh->30-wend UNI 3.900E+0002 4.800E+0002 5.400E+0002 2 exp 2 44 B2-sh->30-rush UNI 3.600E+0002 4.200E+0002 4.500E+0002 2 exp 2 45 B2-ie-epz-day UNI 1.500E+0002 2.100E+0002 2.400E+0002 2 exp 2 46 B2-ie-epz-nigh UNI 1.800E+0002 3.000E+0002 3.600E+0002 2 exp 2 47 B2-ie-epz-wend UNI 1.800E+0002 2.400E+0002 3.600E+0002 2 exp 2 48 B2-ie-epz-rush UNI 1.500E+0002 1.800E+0002 2.400E+0002 2 exp 2 49 B2-ie-<30-day UNI 6.000E+0002 8.400E+0002 1.080E+0003 2 exp 2 50 B2-ie-<30-nigh UNI 7.200E+0002 1.080E+0003 1.200E+0003 2 exp 2 51 B2-ie-<30-wend UNI 1.080E+0003 1.200E+0003 1.440E+0003 2 exp 2 52 B2-ie-<30-rush UNI 6.000E+0002 8.400E+0002 1.080E+0003 2 exp 2 53 B2-de-epz-day UNI 6.000E+0001 1.200E+0002 1.800E+0002 2 exp 2 54 B2-de-epz-nigh UNI 1.200E+0002 2.400E+0002 3.000E+0002 2 exp 2 55 B2-de-epz-wend UNI 1.800E+0002 3.000E+0002 4.200E+0002 2 exp 2 56 B2-de-epz-rush UNI 1.500E+0002 1.800E+0002 2.100E+0002 2 exp 2 57 B2-de-<30-day UNI 2.400E+0002 3.000E+0002 3.600E+0002 2 exp 2 58 B2-de-<30-nigh UNI 4.200E+0002 5.400E+0002 6.000E+0002 2 exp 2 59 B2-de-<30-wend UNI 3.300E+0002 4.200E+0002 4.800E+0002 2 exp 2 60 B2-de-<30-rush UNI 3.000E+0002 3.900E+0002 4.200E+0002 2 exp 2 61 C1-sh-not-igno UNI 2.000E+0001 3.500E+0001 6.500E+0001 2 exp 2 62 C1-sh-not-notr UNI 1.500E+0001 2.000E+0001 4.000E+0001 2 exp 2 63 C1-sh-not-spon UNI 4.000E+0001 5.000E+0001 9.000E+0001 2 exp 2 64 C2-sh-yes-maj UNI 2.000E+0001 3.000E+0001 4.500E+0001 2 exp 2 65 C2-sh-yes-vmaj UNI 3.500E+0001 5.000E+0001 6.000E+0001 2 exp 2 66 C3-sh-leave<3d UNI 5.000E+0000 2.000E+0001 3.000E+0001
117

2 exp 2 67 C3-sh-leave<8d UNI 1.000E+0001 3.000E+0001 5.000E+0001 2 exp 2 68 C3-sh-leave<12 UNI 2.000E+0001 4.500E+0001 6.500E+0001 2 exp 2 69 C3-sh-leave<3n UNI 1.000E+0000 1.000E+0001 2.000E+0001 2 exp 2 70 C3-sh-leave<8n UNI 5.000E+0000 1.000E+0001 1.500E+0001 2 exp 2 71 C3-sh-leave<24 UNI 2.000E+0001 3.000E+0001 4.000E+0001 2 exp 2 72 D1-ev-day-igno UNI 5.000E+0000 1.000E+0001 2.000E+0001 2 exp 2 73 D1-ev-day-notr UNI 1.000E+0001 2.000E+0001 3.000E+0001 2 exp 2 74 D1-ev-day-nfor UNI 1.000E+0001 3.000E+0001 5.000E+0001 2 exp 2 75 D1-ev-sch-igno UNI 1.000E+0000 5.000E+0000 1.000E+0001 2 exp 2 76 D1-ev-sch-nfor UNI 5.000E+0000 1.000E+0001 1.500E+0001 2 exp 2 77 D1-ev-swc-igno UNI 8.000E+0000 1.200E+0001 2.200E+0001 2 exp 2 78 D1-ev-swc-notr UNI 1.200E+0001 2.200E+0001 3.500E+0001 2 exp 2 79 D1-ev-swc-nfor UNI 1.500E+0001 3.500E+0001 6.000E+0001 2 exp 2 80 D2-ev-fo-wd-ma UNI 3.500E+0001 5.000E+0001 6.000E+0001 2 exp 2 81 D2-ev-fo-wd-vm UNI 6.000E+0001 7.500E+0001 1.050E+0002 2 exp 2 82 D2-ev-fo-wh-ma UNI 3.500E+0001 5.000E+0001 6.000E+0001 2 exp 2 83 D2-ev-fo-wh-vm UNI 6.000E+0001 7.500E+0001 1.050E+0002 2 exp 2 84 D3-ev-nf-wd-ma UNI 5.000E+0000 1.500E+0001 2.000E+0001 2 exp 2 85 D3-ev-nf-wd-vm UNI 1.000E+0001 2.000E+0001 2.500E+0001 2 exp 2 86 D3-ev-nf-wh-ma UNI 5.000E+0000 1.500E+0001 2.000E+0001 2 exp 2 87 D3-ev-nf-wh-vm UNI 1.000E+0001 2.000E+0001 2.500E+0001 2 exp 2 88 E1-epz-daylt-r UNI 3.000E+0001 6.000E+0001 7.500E+0001 2 exp 2 89 E1-epz-daylt-s UNI 5.000E+0001 9.000E+0001 1.200E+0002 2 exp 2 90 E1-epz-daylt-u UNI 6.000E+0001 1.200E+0002 1.500E+0002 2 exp 2 91 E1-epz-dayht-r UNI 6.000E+0001 1.200E+0002 1.800E+0002 2 exp 2 92 E1-epz-dayht-s UNI 9.000E+0001 1.200E+0002 1.800E+0002 2 exp 2 93 E1-epz-dayht-u UNI 9.000E+0001 1.500E+0002 2.100E+0002 2 exp 2 94 E1-epz-night-r UNI 3.000E+0001 3.500E+0001 5.000E+0001 2 exp 2 95 E1-epz-night-s UNI 4.000E+0001 4.500E+0001 6.000E+0001 2 exp 2 96 E1-epz-night-u UNI 4.500E+0001 5.000E+0001 6.000E+0001 2 exp 2 97 E2-<30-daylt-r UNI 6.000E+0001 1.200E+0002 1.800E+0002 2 exp 2 98 E2-<30-daylt-s UNI 7.500E+0001 1.800E+0002 2.400E+0002 2 exp 2 99 E2-<30-daylt-u UNI 1.050E+0002 2.100E+0002 2.400E+0002 2 exp 2 100 E2-<30-dayht-r UNI 1.200E+0002 1.800E+0002 3.000E+0002 2 exp 2 101 E2-<30-dayht-s UNI 1.800E+0002 2.100E+0002 3.600E+0002 2 exp 2 102 E2-<30-dayht-u UNI 2.100E+0002 2.700E+0002 3.600E+0002 2 exp 2 103 E2-<30-night-r UNI 6.000E+0001 1.200E+0002 1.800E+0002 2 exp 2 104 E2-<30-night-s UNI 7.500E+0001 1.800E+0002 2.400E+0002 2 exp 2 105 E2-<30-night-u UNI 1.050E+0002 2.100E+0002 2.400E+0002 2 exp 2 106 F1-iod-not-hom UNI 5.000E+0000 2.000E+0001 3.500E+0001 2 exp 2 107 F1-iod-not-dis UNI 1.000E+0000 5.000E+0000 1.000E+0001 2 exp 2 108 F2-iod-hom-maj UNI 5.000E+0000 1.000E+0001 1.500E+0001 2 exp 2 109 F2-iod-hom-vma UNI 1.000E+0001 6.000E+0001 9.000E+0001 2 exp 2 110 F3-iod-dis-maj UNI 6.000E+0001 1.200E+0002 1.800E+0002 2 exp 2 111 F3-iod-dis-vma UNI 1.800E+0002 2.100E+0002 2.400E+0002
118

Rationale Expert 2 (Jones, UK) Judgements are based on Oldbury Power Station, 15 miles from Bristol – a major UK city. The station is in a “rural” location but surrounded by small developments. It is not well served by roads and is near to the M5 / M4 / M32 interchanges which is a major conduit for traffic travelling from all parts of the UK to the south-west peninsula. Consequently talk about rush hours and so on is not relevant. Also the fact that it is adjacent to such a major strategic road network node means that – in my view – congestion would soon paralyse the whole region. The judgements were based on own experiences and experiences with emergency planners. He has had discussions with other inspectors as well.
119
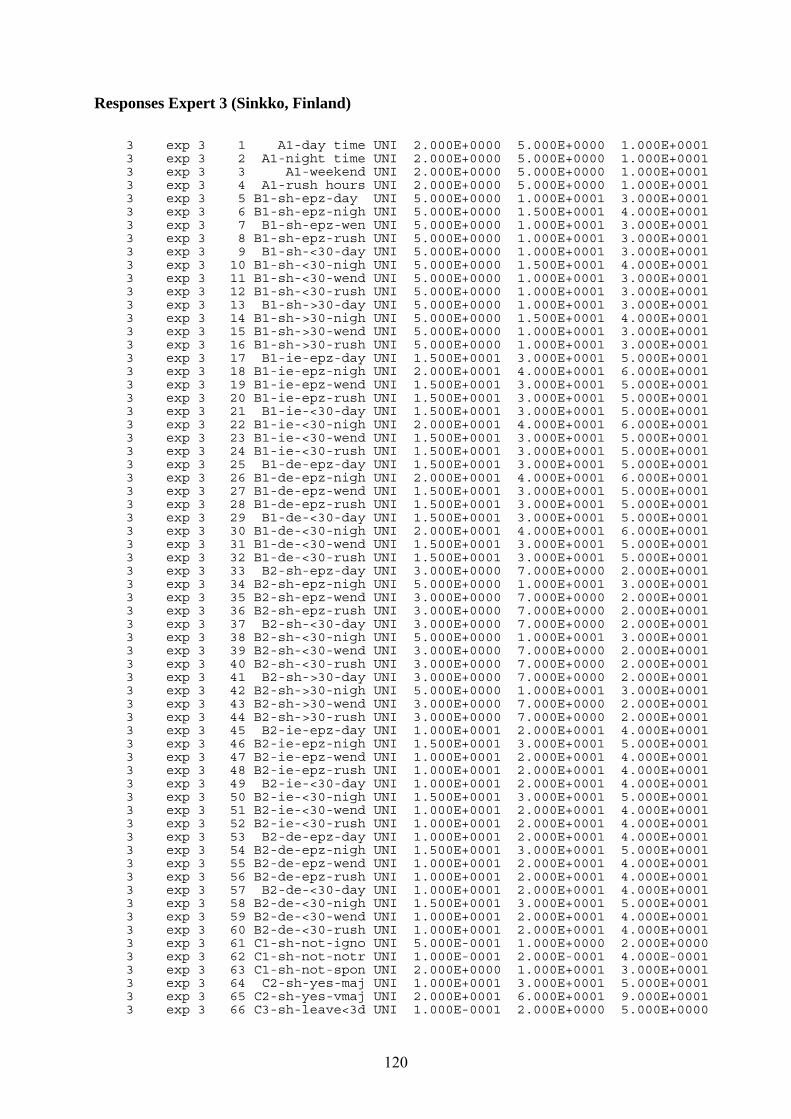
Responses Expert 3 (Sinkko, Finland) 3 exp 3 1 A1-day time UNI 2.000E+0000 5.000E+0000 1.000E+0001 3 exp 3 2 A1-night time UNI 2.000E+0000 5.000E+0000 1.000E+0001 3 exp 3 3 A1-weekend UNI 2.000E+0000 5.000E+0000 1.000E+0001 3 exp 3 4 A1-rush hours UNI 2.000E+0000 5.000E+0000 1.000E+0001 3 exp 3 5 B1-sh-epz-day UNI 5.000E+0000 1.000E+0001 3.000E+0001 3 exp 3 6 B1-sh-epz-nigh UNI 5.000E+0000 1.500E+0001 4.000E+0001 3 exp 3 7 B1-sh-epz-wen UNI 5.000E+0000 1.000E+0001 3.000E+0001 3 exp 3 8 B1-sh-epz-rush UNI 5.000E+0000 1.000E+0001 3.000E+0001 3 exp 3 9 B1-sh-<30-day UNI 5.000E+0000 1.000E+0001 3.000E+0001 3 exp 3 10 B1-sh-<30-nigh UNI 5.000E+0000 1.500E+0001 4.000E+0001 3 exp 3 11 B1-sh-<30-wend UNI 5.000E+0000 1.000E+0001 3.000E+0001 3 exp 3 12 B1-sh-<30-rush UNI 5.000E+0000 1.000E+0001 3.000E+0001 3 exp 3 13 B1-sh->30-day UNI 5.000E+0000 1.000E+0001 3.000E+0001 3 exp 3 14 B1-sh->30-nigh UNI 5.000E+0000 1.500E+0001 4.000E+0001 3 exp 3 15 B1-sh->30-wend UNI 5.000E+0000 1.000E+0001 3.000E+0001 3 exp 3 16 B1-sh->30-rush UNI 5.000E+0000 1.000E+0001 3.000E+0001 3 exp 3 17 B1-ie-epz-day UNI 1.500E+0001 3.000E+0001 5.000E+0001 3 exp 3 18 B1-ie-epz-nigh UNI 2.000E+0001 4.000E+0001 6.000E+0001 3 exp 3 19 B1-ie-epz-wend UNI 1.500E+0001 3.000E+0001 5.000E+0001 3 exp 3 20 B1-ie-epz-rush UNI 1.500E+0001 3.000E+0001 5.000E+0001 3 exp 3 21 B1-ie-<30-day UNI 1.500E+0001 3.000E+0001 5.000E+0001 3 exp 3 22 B1-ie-<30-nigh UNI 2.000E+0001 4.000E+0001 6.000E+0001 3 exp 3 23 B1-ie-<30-wend UNI 1.500E+0001 3.000E+0001 5.000E+0001 3 exp 3 24 B1-ie-<30-rush UNI 1.500E+0001 3.000E+0001 5.000E+0001 3 exp 3 25 B1-de-epz-day UNI 1.500E+0001 3.000E+0001 5.000E+0001 3 exp 3 26 B1-de-epz-nigh UNI 2.000E+0001 4.000E+0001 6.000E+0001 3 exp 3 27 B1-de-epz-wend UNI 1.500E+0001 3.000E+0001 5.000E+0001 3 exp 3 28 B1-de-epz-rush UNI 1.500E+0001 3.000E+0001 5.000E+0001 3 exp 3 29 B1-de-<30-day UNI 1.500E+0001 3.000E+0001 5.000E+0001 3 exp 3 30 B1-de-<30-nigh UNI 2.000E+0001 4.000E+0001 6.000E+0001 3 exp 3 31 B1-de-<30-wend UNI 1.500E+0001 3.000E+0001 5.000E+0001 3 exp 3 32 B1-de-<30-rush UNI 1.500E+0001 3.000E+0001 5.000E+0001 3 exp 3 33 B2-sh-epz-day UNI 3.000E+0000 7.000E+0000 2.000E+0001 3 exp 3 34 B2-sh-epz-nigh UNI 5.000E+0000 1.000E+0001 3.000E+0001 3 exp 3 35 B2-sh-epz-wend UNI 3.000E+0000 7.000E+0000 2.000E+0001 3 exp 3 36 B2-sh-epz-rush UNI 3.000E+0000 7.000E+0000 2.000E+0001 3 exp 3 37 B2-sh-<30-day UNI 3.000E+0000 7.000E+0000 2.000E+0001 3 exp 3 38 B2-sh-<30-nigh UNI 5.000E+0000 1.000E+0001 3.000E+0001 3 exp 3 39 B2-sh-<30-wend UNI 3.000E+0000 7.000E+0000 2.000E+0001 3 exp 3 40 B2-sh-<30-rush UNI 3.000E+0000 7.000E+0000 2.000E+0001 3 exp 3 41 B2-sh->30-day UNI 3.000E+0000 7.000E+0000 2.000E+0001 3 exp 3 42 B2-sh->30-nigh UNI 5.000E+0000 1.000E+0001 3.000E+0001 3 exp 3 43 B2-sh->30-wend UNI 3.000E+0000 7.000E+0000 2.000E+0001 3 exp 3 44 B2-sh->30-rush UNI 3.000E+0000 7.000E+0000 2.000E+0001 3 exp 3 45 B2-ie-epz-day UNI 1.000E+0001 2.000E+0001 4.000E+0001 3 exp 3 46 B2-ie-epz-nigh UNI 1.500E+0001 3.000E+0001 5.000E+0001 3 exp 3 47 B2-ie-epz-wend UNI 1.000E+0001 2.000E+0001 4.000E+0001 3 exp 3 48 B2-ie-epz-rush UNI 1.000E+0001 2.000E+0001 4.000E+0001 3 exp 3 49 B2-ie-<30-day UNI 1.000E+0001 2.000E+0001 4.000E+0001 3 exp 3 50 B2-ie-<30-nigh UNI 1.500E+0001 3.000E+0001 5.000E+0001 3 exp 3 51 B2-ie-<30-wend UNI 1.000E+0001 2.000E+0001 4.000E+0001 3 exp 3 52 B2-ie-<30-rush UNI 1.000E+0001 2.000E+0001 4.000E+0001 3 exp 3 53 B2-de-epz-day UNI 1.000E+0001 2.000E+0001 4.000E+0001 3 exp 3 54 B2-de-epz-nigh UNI 1.500E+0001 3.000E+0001 5.000E+0001 3 exp 3 55 B2-de-epz-wend UNI 1.000E+0001 2.000E+0001 4.000E+0001 3 exp 3 56 B2-de-epz-rush UNI 1.000E+0001 2.000E+0001 4.000E+0001 3 exp 3 57 B2-de-<30-day UNI 1.000E+0001 2.000E+0001 4.000E+0001 3 exp 3 58 B2-de-<30-nigh UNI 1.500E+0001 3.000E+0001 5.000E+0001 3 exp 3 59 B2-de-<30-wend UNI 1.000E+0001 2.000E+0001 4.000E+0001 3 exp 3 60 B2-de-<30-rush UNI 1.000E+0001 2.000E+0001 4.000E+0001 3 exp 3 61 C1-sh-not-igno UNI 5.000E-0001 1.000E+0000 2.000E+0000 3 exp 3 62 C1-sh-not-notr UNI 1.000E-0001 2.000E-0001 4.000E-0001 3 exp 3 63 C1-sh-not-spon UNI 2.000E+0000 1.000E+0001 3.000E+0001 3 exp 3 64 C2-sh-yes-maj UNI 1.000E+0001 3.000E+0001 5.000E+0001 3 exp 3 65 C2-sh-yes-vmaj UNI 2.000E+0001 6.000E+0001 9.000E+0001 3 exp 3 66 C3-sh-leave<3d UNI 1.000E-0001 2.000E+0000 5.000E+0000
120

3 exp 3 67 C3-sh-leave<8d UNI 2.000E-0001 4.000E+0000 1.000E+0001 3 exp 3 68 C3-sh-leave<12 UNI 4.000E-0001 8.000E+0000 1.500E+0001 3 exp 3 69 C3-sh-leave<3n UNI 1.000E-0001 1.000E+0000 3.000E+0000 3 exp 3 70 C3-sh-leave<8n UNI 2.000E-0001 2.000E+0000 6.000E+0000 3 exp 3 71 C3-sh-leave<24 UNI 1.000E+0000 2.000E+0001 4.000E+0001 3 exp 3 72 D1-ev-day-igno UNI 5.000E-0001 2.000E+0000 4.000E+0000 3 exp 3 73 D1-ev-day-notr UNI 1.000E+0000 5.000E+0000 1.000E+0001 3 exp 3 74 D1-ev-day-nfor UNI 1.000E+0000 5.000E+0000 1.000E+0001 3 exp 3 75 D1-ev-sch-igno UNI 1.000E-0002 1.000E-0001 5.000E-0001 3 exp 3 76 D1-ev-sch-nfor UNI 1.000E-0002 1.000E-0001 5.000E-0001 3 exp 3 77 D1-ev-swc-igno UNI 1.000E+0000 3.000E+0000 8.000E+0000 3 exp 3 78 D1-ev-swc-notr UNI 2.000E+0000 7.000E+0000 1.500E+0001 3 exp 3 79 D1-ev-swc-nfor UNI 2.000E+0000 7.000E+0000 1.500E+0001 3 exp 3 80 D2-ev-fo-wd-ma UNI 6.000E+0001 9.000E+0001 1.200E+0002 3 exp 3 81 D2-ev-fo-wd-vm UNI 1.800E+0002 2.400E+0002 3.600E+0002 3 exp 3 82 D2-ev-fo-wh-ma UNI 6.000E+0001 9.000E+0001 1.200E+0002 3 exp 3 83 D2-ev-fo-wh-vm UNI 1.800E+0002 2.400E+0002 3.600E+0002 3 exp 3 84 D3-ev-nf-wd-ma UNI 9.000E+0001 1.200E+0002 1.500E+0002 3 exp 3 85 D3-ev-nf-wd-vm UNI 2.100E+0002 2.700E+0002 3.900E+0002 3 exp 3 86 D3-ev-nf-wh-ma UNI 9.000E+0001 1.200E+0002 1.500E+0002 3 exp 3 87 D3-ev-nf-wh-vm UNI 2.100E+0002 2.700E+0002 3.900E+0002 3 exp 3 88 E1-epz-daylt-r UNI 5.000E+0000 1.000E+0001 1.500E+0001 3 exp 3 89 E1-epz-daylt-s UNI 5.000E+0000 1.000E+0001 1.500E+0001 3 exp 3 90 E1-epz-daylt-u UNI 5.000E+0000 1.000E+0001 1.500E+0001 3 exp 3 91 E1-epz-dayht-r UNI 5.000E+0000 1.000E+0001 1.500E+0001 3 exp 3 92 E1-epz-dayht-s UNI 5.000E+0000 1.000E+0001 1.500E+0001 3 exp 3 93 E1-epz-dayht-u UNI 5.000E+0000 1.000E+0001 1.500E+0001 3 exp 3 94 E1-epz-night-r UNI 5.000E+0000 1.000E+0001 1.500E+0001 3 exp 3 95 E1-epz-night-s UNI 5.000E+0000 1.000E+0001 1.500E+0001 3 exp 3 96 E1-epz-night-u UNI 5.000E+0000 1.000E+0001 1.500E+0001 3 exp 3 97 E2-<30-daylt-r UNI 1.500E+0001 2.000E+0001 4.000E+0001 3 exp 3 98 E2-<30-daylt-s UNI 1.500E+0001 2.000E+0001 4.000E+0001 3 exp 3 99 E2-<30-daylt-u UNI 1.500E+0001 2.000E+0001 4.000E+0001 3 exp 3 100 E2-<30-dayht-r UNI 1.500E+0001 2.000E+0001 4.000E+0001 3 exp 3 101 E2-<30-dayht-s UNI 1.500E+0001 2.000E+0001 4.000E+0001 3 exp 3 102 E2-<30-dayht-u UNI 1.500E+0001 2.000E+0001 4.000E+0001 3 exp 3 103 E2-<30-night-r UNI 1.500E+0001 2.000E+0001 4.000E+0001 3 exp 3 104 E2-<30-night-s UNI 1.500E+0001 2.000E+0001 4.000E+0001 3 exp 3 105 E2-<30-night-u UNI 1.500E+0001 2.000E+0001 4.000E+0001 3 exp 3 106 F1-iod-not-hom UNI 3.000E+0001 5.000E+0001 7.000E+0001 3 exp 3 107 F1-iod-not-dis UNI 1.000E-0003 1.000E-0002 1.000E-0001 3 exp 3 108 F2-iod-hom-maj UNI 2.000E+0000 5.000E+0000 1.500E+0001 3 exp 3 109 F2-iod-hom-vma UNI 1.000E+0001 2.000E+0001 3.000E+0001 3 exp 3 110 F3-iod-dis-maj UNI 3.000E+0001 6.000E+0001 1.200E+0002 3 exp 3 111 F3-iod-dis-vma UNI 6.000E+0001 1.200E+0002 1.800E+0002
121

Rationale Expert 3 (Sinkko, Finland) This rationale provides additional background information for the uncertainty assessments made in the countermeasures questionnaire dated 23 October 1998. Case A In Finland the Fire chief of the region is the person responsible for the execution of the rescue organisation in cases of a nuclear accident. The fire chief also participates exercises organised by NPPs and safety authorities once or twice a year. The official responsible person for a catastrophe is the Minister of Interior. STUK is only advising. Because the fire chief is the authority responsible for taking off-site emergency actions, there will be no difference with respect to the different event conditions mentioned under case A. Case B Finland only has two nuclear sites (at Loviisa and at Olkiluota), each with two power plants operational. In the 5km emergency planning zone only 40 people are living at each site. Organisation and notification times will be short as there are only a few persons involved doing that. The general manner of notifying the population is by sirens plus radio which operates fast. In future, there will also be an automatic shut-on systems for radios. For evacuation there is no separate signal (sirens again), and people should be warned by radio and loudspeaker cars. For that reason, times will be longer. If the estimates are that the plant transient leads to severe reactor damage, it is recommendable to carry out evacuation in the plant vicinity in an area with a ca. 5 km radius. In the same way, it is necessary to prepare for the intake of stable iodine by intensifying or supplementing emergency preparedness, if necessary. Gradual evacuation is recommendable at the latest when an accident has reached a phase where a reactor core melt is assumed to have occurred. It is advisable to carry out evacuation according to need in an area extending to a ca. 20 km distance from the facility. For delayed evacuation, times could be somewhat shorter, but this is marginal, so identical times are taken. In case B, when a general emergency situation occurs after a period of site area emergency only, all times will even be somewhat shorter. The main reason is that the population is already alerted: in Finland also in cases of site area emergency situations the sirens will be used. Case C The assessments made under question C1 (stays outdoors, ignoring the notification to shelter), are based on the ten percent of the population who is outside (this is the average for all general assessments made in Finland). It is expected that about 10 percent of that subpopulation will ignore the notification. The percentage not receiving the notification can only be small, hence 0.2 percent. The percentage of people deciding to evacuate spontaneously are the zones living close to the 5 km emergency planning zone. Others living closer to the 30 km zone, will not evacuate spontaneously but will wait and see what happens. In question C3 the percentages of people leaving their shelters too soon are assessed to be small. In most cases illness, farming work or domestic animals are the reason for leaving Case D In Finland the area is in between the 5 km and 30 km circle.
122

Under question D1, the people ignoring the notification to evacuate will in most cases be older people, because they simply do not want to leave their houses. People deciding to evacuate by not following the order, are doing some other duties first and then evacuate. For schools, it is difficult to put numbers as there will only be very few people who will act otherwise then officially indicated. In cases of severe weather conditions, evacuations will not take place and the emergency staff will do something else. The times in question D2 are difficult to assess as there is no experience available. In question D3 the method of organised evacuation is by own cars (most people) and by bus (minority). This will increase the times compared to the times assessed under question D2. Case E In Finland there are only rural areas in the emergency planning zone and there will never be heavy traffic. Case F In Finland, within the 5 km zone the iodine tablets are distributed at homes (near the Loviisa plant) or will be distributed to homes at the time of an accident (at the Olkiluota plant). For question F1: The number of persons that does not take the tablets at home will be large, as it is expected that a lot of people do not know where they keep the tablets or lost them. When they go to the pharmacy to pick up the tablets, only very few people will not take them. For question F2: at home, once prepared to take the tablets, will do so quickly. Some time may be lost by searching for the tablets. For question F3: at the pharmacy. Times may increase because of a relatively long time spent at the pharmacy (cues, shortages of tablets). Dependencies Generally speaking, no dependencies are assumed, so most questions are answered with a 50 percent probability: Pr = 0.5. In a few cases there might be dependencies, not strong. These are indicated by Pr = 0.75.
123

Responses Expert 4 (Calmtorp, Sweden) 4 exp 4 1 A1-day time UNI 1.000E+0001 3.000E+0001 1.200E+0002 4 exp 4 2 A1-night time UNI 1.000E+0001 3.000E+0001 1.200E+0002 4 exp 4 3 A1-weekend UNI 1.000E+0001 3.000E+0001 1.200E+0002 4 exp 4 4 A1-rush hours UNI 1.000E+0001 3.000E+0001 1.200E+0002 4 exp 4 5 B1-sh-epz-day UNI 6.000E+0001 9.000E+0001 1.200E+0002 4 exp 4 6 B1-sh-epz-nigh UNI 6.000E+0001 9.000E+0001 1.200E+0002 4 exp 4 7 B1-sh-epz-wen UNI 6.000E+0001 1.200E+0002 3.600E+0002 4 exp 4 8 B1-sh-epz-rush UNI 6.000E+0001 1.200E+0002 2.400E+0002 4 exp 4 9 B1-sh-<30-day UNI 3.000E+0001 6.000E+0001 1.200E+0002 4 exp 4 10 B1-sh-<30-nigh UNI 3.000E+0001 6.000E+0001 1.200E+0002 4 exp 4 11 B1-sh-<30-wend UNI 3.000E+0001 6.000E+0001 1.200E+0002 4 exp 4 12 B1-sh-<30-rush UNI 3.000E+0001 6.000E+0001 1.200E+0002 4 exp 4 13 B1-sh->30-day UNI -9.996E+0002 -9.996E+0002 -9.996E+0002 4 exp 4 14 B1-sh->30-nigh UNI -9.996E+0002 -9.996E+0002 -9.996E+0002 4 exp 4 15 B1-sh->30-wend UNI -9.996E+0002 -9.996E+0002 -9.996E+0002 4 exp 4 16 B1-sh->30-rush UNI -9.996E+0002 -9.996E+0002 -9.996E+0002 4 exp 4 17 B1-ie-epz-day UNI 6.000E+0001 9.000E+0001 1.200E+0002 4 exp 4 18 B1-ie-epz-nigh UNI 6.000E+0001 1.200E+0002 2.400E+0002 4 exp 4 19 B1-ie-epz-wend UNI 6.000E+0001 1.200E+0002 2.400E+0002 4 exp 4 20 B1-ie-epz-rush UNI 6.000E+0001 1.200E+0002 2.400E+0002 4 exp 4 21 B1-ie-<30-day UNI -9.996E+0002 -9.996E+0002 -9.996E+0002 4 exp 4 22 B1-ie-<30-nigh UNI -9.996E+0002 -9.996E+0002 -9.996E+0002 4 exp 4 23 B1-ie-<30-wend UNI -9.996E+0002 -9.996E+0002 -9.996E+0002 4 exp 4 24 B1-ie-<30-rush UNI -9.996E+0002 -9.996E+0002 -9.996E+0002 4 exp 4 25 B1-de-epz-day UNI 1.500E+0001 3.000E+0001 6.000E+0001 4 exp 4 26 B1-de-epz-nigh UNI 1.500E+0001 3.000E+0001 6.000E+0001 4 exp 4 27 B1-de-epz-wend UNI 1.500E+0001 3.000E+0001 6.000E+0001 4 exp 4 28 B1-de-epz-rush UNI 1.500E+0001 3.000E+0001 6.000E+0001 4 exp 4 29 B1-de-<30-day UNI -9.996E+0002 -9.996E+0002 -9.996E+0002 4 exp 4 30 B1-de-<30-nigh UNI -9.996E+0002 -9.996E+0002 -9.996E+0002 4 exp 4 31 B1-de-<30-wend UNI -9.996E+0002 -9.996E+0002 -9.996E+0002 4 exp 4 32 B1-de-<30-rush UNI -9.996E+0002 -9.996E+0002 -9.996E+0002 4 exp 4 33 B2-sh-epz-day UNI 1.500E+0001 3.000E+0001 6.000E+0001 4 exp 4 34 B2-sh-epz-nigh UNI 1.500E+0001 3.000E+0001 6.000E+0001 4 exp 4 35 B2-sh-epz-wend UNI 1.500E+0001 3.000E+0001 6.000E+0001 4 exp 4 36 B2-sh-epz-rush UNI -9.996E+0002 -9.996E+0002 -9.996E+0002 4 exp 4 37 B2-sh-<30-day UNI 1.500E+0001 6.000E+0001 1.200E+0002 4 exp 4 38 B2-sh-<30-nigh UNI 1.500E+0001 6.000E+0001 1.200E+0002 4 exp 4 39 B2-sh-<30-wend UNI 1.500E+0001 3.000E+0001 1.200E+0002 4 exp 4 40 B2-sh-<30-rush UNI -9.996E+0002 -9.996E+0002 -9.996E+0002 4 exp 4 41 B2-sh->30-day UNI 1.500E+0001 6.000E+0001 2.400E+0002 4 exp 4 42 B2-sh->30-nigh UNI 1.500E+0001 6.000E+0001 2.400E+0002 4 exp 4 43 B2-sh->30-wend UNI 1.500E+0001 6.000E+0001 2.400E+0002 4 exp 4 44 B2-sh->30-rush UNI 1.500E+0001 6.000E+0001 2.400E+0002 4 exp 4 45 B2-ie-epz-day UNI 1.500E+0001 3.000E+0001 6.000E+0001 4 exp 4 46 B2-ie-epz-nigh UNI 3.000E+0001 6.000E+0001 1.800E+0002 4 exp 4 47 B2-ie-epz-wend UNI 3.000E+0001 6.000E+0001 1.200E+0002 4 exp 4 48 B2-ie-epz-rush UNI -9.996E+0002 -9.996E+0002 -9.996E+0002 4 exp 4 49 B2-ie-<30-day UNI -9.996E+0002 -9.996E+0002 -9.996E+0002 4 exp 4 50 B2-ie-<30-nigh UNI -9.996E+0002 -9.996E+0002 -9.996E+0002 4 exp 4 51 B2-ie-<30-wend UNI -9.996E+0002 -9.996E+0002 -9.996E+0002 4 exp 4 52 B2-ie-<30-rush UNI -9.996E+0002 -9.996E+0002 -9.996E+0002 4 exp 4 53 B2-de-epz-day UNI 1.500E+0001 3.000E+0001 6.000E+0001 4 exp 4 54 B2-de-epz-nigh UNI 3.000E+0001 6.000E+0001 1.800E+0002 4 exp 4 55 B2-de-epz-wend UNI 3.000E+0001 6.000E+0001 1.200E+0002 4 exp 4 56 B2-de-epz-rush UNI -9.996E+0002 -9.996E+0002 -9.996E+0002 4 exp 4 57 B2-de-<30-day UNI -9.996E+0002 -9.996E+0002 -9.996E+0002 4 exp 4 58 B2-de-<30-nigh UNI -9.996E+0002 -9.996E+0002 -9.996E+0002 4 exp 4 59 B2-de-<30-wend UNI -9.996E+0002 -9.996E+0002 -9.996E+0002 4 exp 4 60 B2-de-<30-rush UNI -9.996E+0002 -9.996E+0002 -9.996E+0002 4 exp 4 61 C1-sh-not-igno UNI 2.000E+0000 5.000E+0000 1.000E+0001 4 exp 4 62 C1-sh-not-notr UNI 2.000E+0000 5.000E+0000 1.000E+0001 4 exp 4 63 C1-sh-not-spon UNI 5.000E+0000 1.000E+0001 2.000E+0001 4 exp 4 64 C2-sh-yes-maj UNI 5.000E+0000 1.000E+0001 2.000E+0001 4 exp 4 65 C2-sh-yes-vmaj UNI 1.000E+0001 2.000E+0001 6.000E+0001 4 exp 4 66 C3-sh-leave<3d UNI 5.000E+0000 1.000E+0001 1.500E+0001 4 exp 4 67 C3-sh-leave<8d UNI 1.000E+0001 1.500E+0001 2.000E+0001
124

4 exp 4 68 C3-sh-leave<12 UNI 1.000E+0001 1.500E+0001 2.000E+0001 4 exp 4 69 C3-sh-leave<3n UNI 1.000E+0001 1.500E+0001 2.000E+0001 4 exp 4 70 C3-sh-leave<8n UNI 1.000E+0001 2.000E+0001 3.000E+0001 4 exp 4 71 C3-sh-leave<24 UNI 1.000E+0001 1.500E+0001 2.000E+0001 4 exp 4 72 D1-ev-day-igno UNI 4.000E+0000 6.000E+0000 1.000E+0001 4 exp 4 73 D1-ev-day-notr UNI 1.000E+0000 2.000E+0000 4.000E+0000 4 exp 4 74 D1-ev-day-nfor UNI 3.000E+0000 5.000E+0000 1.000E+0001 4 exp 4 75 D1-ev-sch-igno UNI 1.000E+0000 2.000E+0000 5.000E+0000 4 exp 4 76 D1-ev-sch-nfor UNI 2.000E+0000 4.000E+0000 6.000E+0000 4 exp 4 77 D1-ev-swc-igno UNI -9.996E+0002 -9.996E+0002 -9.996E+0002 4 exp 4 78 D1-ev-swc-notr UNI -9.996E+0002 -9.996E+0002 -9.996E+0002 4 exp 4 79 D1-ev-swc-nfor UNI 2.000E+0000 4.000E+0000 7.000E+0000 4 exp 4 80 D2-ev-fo-wd-ma UNI 6.000E+0001 1.800E+0002 3.000E+0002 4 exp 4 81 D2-ev-fo-wd-vm UNI 2.400E+0002 3.600E+0002 4.800E+0002 4 exp 4 82 D2-ev-fo-wh-ma UNI 6.000E+0001 1.800E+0002 4.800E+0002 4 exp 4 83 D2-ev-fo-wh-vm UNI 3.600E+0002 4.800E+0002 7.200E+0002 4 exp 4 84 D3-ev-nf-wd-ma UNI -9.996E+0002 -9.996E+0002 -9.996E+0002 4 exp 4 85 D3-ev-nf-wd-vm UNI -9.996E+0002 -9.996E+0002 -9.996E+0002 4 exp 4 86 D3-ev-nf-wh-ma UNI -9.996E+0002 -9.996E+0002 -9.996E+0002 4 exp 4 87 D3-ev-nf-wh-vm UNI -9.996E+0002 -9.996E+0002 -9.996E+0002 4 exp 4 88 E1-epz-daylt-r UNI 1.500E+0001 3.000E+0001 1.800E+0002 4 exp 4 89 E1-epz-daylt-s UNI 9.000E+0000 3.000E+0001 6.000E+0001 4 exp 4 90 E1-epz-daylt-u UNI -9.996E+0002 -9.996E+0002 -9.996E+0002 4 exp 4 91 E1-epz-dayht-r UNI 1.500E+0001 3.000E+0001 1.800E+0002 4 exp 4 92 E1-epz-dayht-s UNI 1.500E+0001 3.000E+0001 6.000E+0001 4 exp 4 93 E1-epz-dayht-u UNI -9.996E+0002 -9.996E+0002 -9.996E+0002 4 exp 4 94 E1-epz-night-r UNI 1.500E+0001 3.000E+0001 1.800E+0002 4 exp 4 95 E1-epz-night-s UNI 1.500E+0001 3.000E+0001 6.000E+0001 4 exp 4 96 E1-epz-night-u UNI -9.996E+0002 -9.996E+0002 -9.996E+0002 4 exp 4 97 E2-<30-daylt-r UNI -9.996E+0002 -9.996E+0002 -9.996E+0002 4 exp 4 98 E2-<30-daylt-s UNI -9.996E+0002 -9.996E+0002 -9.996E+0002 4 exp 4 99 E2-<30-daylt-u UNI -9.996E+0002 -9.996E+0002 -9.996E+0002 4 exp 4 100 E2-<30-dayht-r UNI -9.996E+0002 -9.996E+0002 -9.996E+0002 4 exp 4 101 E2-<30-dayht-s UNI -9.996E+0002 -9.996E+0002 -9.996E+0002 4 exp 4 102 E2-<30-dayht-u UNI -9.996E+0002 -9.996E+0002 -9.996E+0002 4 exp 4 103 E2-<30-night-r UNI -9.996E+0002 -9.996E+0002 -9.996E+0002 4 exp 4 104 E2-<30-night-s UNI -9.996E+0002 -9.996E+0002 -9.996E+0002 4 exp 4 105 E2-<30-night-u UNI -9.996E+0002 -9.996E+0002 -9.996E+0002 4 exp 4 106 F1-iod-not-hom UNI 2.000E+0000 5.000E+0000 8.000E+0000 4 exp 4 107 F1-iod-not-dis UNI 5.000E+0000 2.500E+0001 7.500E+0001 4 exp 4 108 F2-iod-hom-maj UNI 5.000E+0000 1.000E+0001 3.000E+0001 4 exp 4 109 F2-iod-hom-vma UNI 5.000E+0000 1.500E+0001 4.500E+0001 4 exp 4 110 F3-iod-dis-maj UNI 1.500E+0001 3.000E+0001 4.500E+0001 4 exp 4 111 F3-iod-dis-vma UNI 3.000E+0001 4.500E+0001 9.000E+0001
125

Rationale Expert 4 (Calmtorp, Sweden) E C – P r o j e c t o n Uncertainty Analysis of Accident Consequence Codes Swedish Emergency Preparedness Comparison 1 Clarification of definitions. Alarm levels In Sweden just two alarm levels exist. Those two are
Alert and Emergency. Alert is used when there is no risk of a radioactive release within 12 hours. Emergency is used when a radioactive release within 12 hours cannot be ruled out. This means the Alert state is used to allocate and organise the resources and prepare countermeasures. If the alarm level Emergency is used without a previous Alert time of the alarm tpa and time of public notification tep is nearly the same.
Phases of an accident tie to tpa we identify as tie + tscram + tfac + tei + tad + tpa
tie = time of initiating event tpa = time of notification to authorities
tscram = time of reactor shutdown tfac = time of fulfilled alarm conditions
tei = time of emergency identification tad = time of alarm decision This means Tnot consists of several fairly well defined phases. Emergency zones In Sweden a circle of 12-15 km radius around the NPP is called the
Inner Emergency Preparedness zone. In practice it is the half of a circle as all Swedish NPPs are situated at the coast. Fixed monitors transmit their measurements to the NPP central control room. There are also seebound fixed monitors.
The surrounding zone up to 50 km from the NPP is called indication zone. In this zone fixed monitoring equipment is used. Monitoring staff work mainly inside these 50 km to localise hot spots.
With very few exceptions no one is living within the nearest 2 km.
They are alarmed by the on-site typhoons. At all four sites less than 300 people is living within a 5-km radius. A fair guess is that within the 12-km zone less than 1200-1500 people are living with
126

the exception of Barsebäck where the surroundings are more populated.
Countermeasures In principle you choose from four alternatives when it comes to
acute countermeasures: - No protective action - Sheltering - Iodine therapy - Evacuation Iodine tablets are distributed in advance as well as a radio set with
fixed frequency. In case of an Alert the typical action is to notify the public within x km to stay indoors, close windows and ventilation and to await further messages via the radio set.
Questionnaire Case A Declaration of General Emergency after the initiating event …
Question A1
Conditions at time 5% 50% 95% Daytime 10min 0,5h 2h Night time 10min 0,5h 2h Weekend 10min 0,5h 2h Rush hours 10min 0,5h 2h
Comments: Depends on when alarm conditions are fulfilled which might take hours in one scenario or minutes in an other. Engineer on duty or shift supervisor always present at the NPP decides the appropriate alarm level. In the message receiving part both regional and national authorities have inspector, engineer or officer on duty 24 hours a day.
Case B1 Emergency services organised and people notified for an
immediately declared General Emergency…. Question B1 - Period of time for the responsible authority to a) organise services
and b) let them notify people within the emergency planning zone to shelter…
127
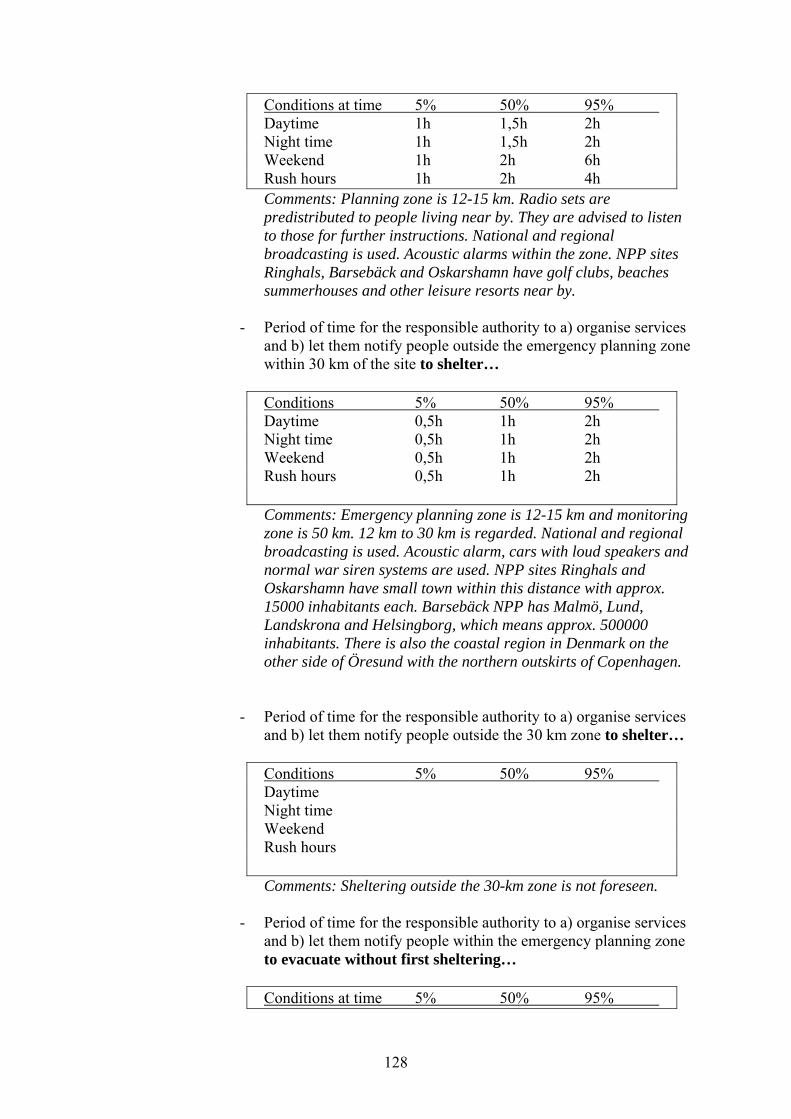
Conditions at time 5% 50% 95% Daytime 1h 1,5h 2h Night time 1h 1,5h 2h Weekend 1h 2h 6h Rush hours 1h 2h 4h
Comments: Planning zone is 12-15 km. Radio sets are predistributed to people living near by. They are advised to listen to those for further instructions. National and regional broadcasting is used. Acoustic alarms within the zone. NPP sites Ringhals, Barsebäck and Oskarshamn have golf clubs, beaches summerhouses and other leisure resorts near by.
- Period of time for the responsible authority to a) organise services
and b) let them notify people outside the emergency planning zone within 30 km of the site to shelter…
Conditions 5% 50% 95% Daytime 0,5h 1h 2h Night time 0,5h 1h 2h Weekend 0,5h 1h 2h Rush hours 0,5h 1h 2h
Comments: Emergency planning zone is 12-15 km and monitoring zone is 50 km. 12 km to 30 km is regarded. National and regional broadcasting is used. Acoustic alarm, cars with loud speakers and normal war siren systems are used. NPP sites Ringhals and Oskarshamn have small town within this distance with approx. 15000 inhabitants each. Barsebäck NPP has Malmö, Lund, Landskrona and Helsingborg, which means approx. 500000 inhabitants. There is also the coastal region in Denmark on the other side of Öresund with the northern outskirts of Copenhagen.
- Period of time for the responsible authority to a) organise services
and b) let them notify people outside the 30 km zone to shelter…
Conditions 5% 50% 95% Daytime Night time Weekend Rush hours
Comments: Sheltering outside the 30-km zone is not foreseen. - Period of time for the responsible authority to a) organise services
and b) let them notify people within the emergency planning zone to evacuate without first sheltering…
Conditions at time 5% 50% 95%
128

Daytime 1h 1,5h 2h Night time 1h 2h 4h *) Weekend 1h 2h 4h *) Rush hours 1h 2h 4h *)
Comments: Planning zone is 12-15 km. Radio sets are predistributed to people living near by. They are advised to listen to those for further instructions. National and regional broadcasting is used. Acoustic alarms within the zone. NPP sites Ringhals, Barsebäck and Oskarshamn have golf clubs, beaches summerhouses and other leisure resorts near by.
*) To allocate the resources needed takes time. - Period of time for the responsible authority to a) organise services
and b) let them notify people outside the emergency planning zone within 30 km of the site to evacuate without first sheltering…
Conditions 5% 50% 95% Daytime Night time Weekend Rush hours
Comments: Emergency planning zone is 12-15 km and monitoring zone is 50 km. 15 km to 30 km is regarded. Outside 15 km evacuation is not considered realistic.
- Period of time for the responsible authority to a) organise services
and b) let them notify people within the emergency planning zone to evacuate after a period of sheltering first …
Conditions at time 5% 50% 95% Daytime 0,25h 0,5h 1h Night time 0,25h 0,5h 1h *) Weekend 0,25h 0,5h 1h *) Rush hours 0,25h 0,5h 1h **)
Comments: Planning zone is 12-15 km. Radio sets are predistributed to people living near by. They are advised to listen to those for further instructions. National and regional broadcasting is used. Acoustic alarms within the zone.
*) After a period of sheltering first further instructions are expected though over night and weekend spontaneous evacuation will increase.
**) Is there any rush hours if sheltering is already ordered as e.g. road blocks already exist?
- Period of time for the responsible authority to a) organise services
and b) let them notify people outside the emergency planning zone within 30 km of the site to evacuate after a period of sheltering first …
129
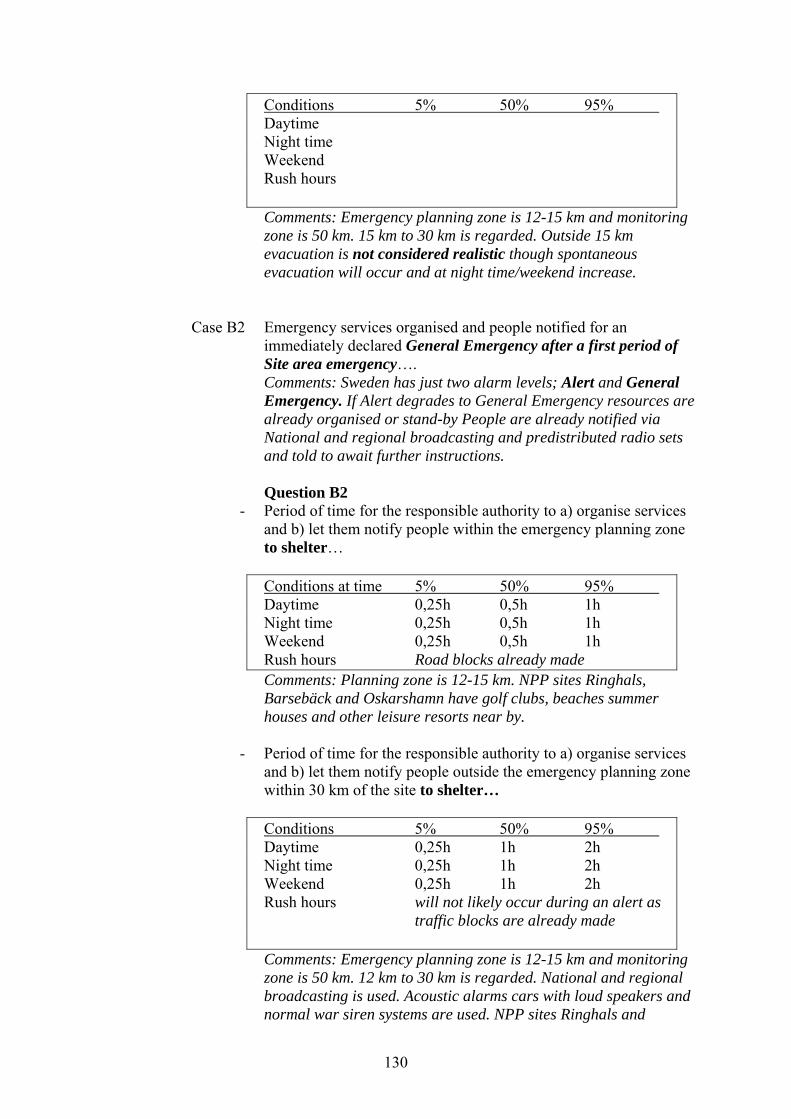
Conditions 5% 50% 95% Daytime Night time Weekend Rush hours
Comments: Emergency planning zone is 12-15 km and monitoring zone is 50 km. 15 km to 30 km is regarded. Outside 15 km evacuation is not considered realistic though spontaneous evacuation will occur and at night time/weekend increase.
Case B2 Emergency services organised and people notified for an
immediately declared General Emergency after a first period of Site area emergency….
Comments: Sweden has just two alarm levels; Alert and General Emergency. If Alert degrades to General Emergency resources are already organised or stand-by People are already notified via National and regional broadcasting and predistributed radio sets and told to await further instructions.
Question B2 - Period of time for the responsible authority to a) organise services
and b) let them notify people within the emergency planning zone to shelter…
Conditions at time 5% 50% 95% Daytime 0,25h 0,5h 1h Night time 0,25h 0,5h 1h Weekend 0,25h 0,5h 1h Rush hours Road blocks already made
Comments: Planning zone is 12-15 km. NPP sites Ringhals, Barsebäck and Oskarshamn have golf clubs, beaches summer houses and other leisure resorts near by.
- Period of time for the responsible authority to a) organise services
and b) let them notify people outside the emergency planning zone within 30 km of the site to shelter…
Conditions 5% 50% 95% Daytime 0,25h 1h 2h Night time 0,25h 1h 2h Weekend 0,25h 1h 2h Rush hours will not likely occur during an alert as
traffic blocks are already made
Comments: Emergency planning zone is 12-15 km and monitoring zone is 50 km. 12 km to 30 km is regarded. National and regional broadcasting is used. Acoustic alarms cars with loud speakers and normal war siren systems are used. NPP sites Ringhals and
130

Oskarshamn have small town within this distance with approx. 15000 inhabitants each. Barsebäck NPP has Malmö, Lund, Landskrona and Helsingborg, which mean approx. half a million inhabitants. There is also the coastal region in Denmark on the other side of Öresund with the northern outskirts of Copenhagen.
- Period of time for the responsible authority to a) organise services
and b) let them notify people outside the emergency planning zone and outside 30 km of the site to shelter…
Conditions 5% 50% 95% Daytime 0,25h 1h 4h Night time 0,25h 1h 4h Weekend 0,25h 1h 4h Rush hours 0,25h 1h 4h
Comments: National and regional broadcasting is used. Acoustic
alarms, cars with loud speakers and normal war siren systems are used
It is impossible to check whether people receive and obey the instruction or not in heavily populated areas as around Barsebäck NPP.
- Period of time for the responsible authority to a) organise services
and b) let them notify people within the emergency planning zone to immediately evacuate without first sheltering…
Conditions at time 5% 50% 95% Daytime 0,25h 0,5h 1h Night time 0,5h 1h 3h Weekend 0,5h 1h 2h Rush hours Road blocks already made
Comments: Planning zone is 12-15 km. To - Period of time for the responsible authority to a) organise services
and b) let them notify people outside the emergency planning zone within 30 km of the site to immediately evacuate without first sheltering…
Conditions 5% 50% 95% Daytime Night time Weekend Rush hours
131

Comments: Emergency planning zone is 12-15 km and monitoring zone is 50 km. Evacuation outside the emergency planning zone is not regarded realistic.
- Period of time for the responsible authority to a) organise services
and b) let them notify people within the emergency planning zone for delayed evacuation without first sheltering…
Conditions at time 5% 50% 95% Daytime 0,25h 0,5h 1h Night time 0,5h 1h 3h Weekend 0,5h 1h 2h Rush hours Road blocks already made
Comments: Planning zone is 12-15 km. - Period of time for the responsible authority to a) organise services
and b) let them notify people outside the emergency planning zone within 30 km of the site for delayed evacuation without first sheltering…
Comments: Emergency planning zone is 12-15 km and monitoring
zone is 50 km. Evacuation outside the emergency planning zone is not regarded realistic.
Case C People are notified by Emergency services to shelter only outside
the planning zone but within the 30-km zone… Question C1 - Percentage of people not responding to shelter…
Percentage of people 5% 50% 95%
Stays outdoors ignoring 2 5 10 Stays outdoors not receiving 2 5 10 Decides to evacuate spontaneously 5 10 20
Question C2 - In cases notification to shelter is followed by people how much
time does it take to implement action to shelter during day time
Time period to implement 5% 50% 95% For majority of people (68%) 5min 10min 20min For vast majority of people (95%) 10min 20min 60min
Question C3 - People are told to shelter until further notice What is the behaviour
of people
132

Percentage of people that (day time) 5% 50% 95% Leaves shelter in less than 3 hours 5 10 15 Leave shelter in less than 8 hours 10 15 20 Leave shelter in less than 12 hours 10 15 20
Percentage of people that (night time) 5% 50% 95%
Leaves shelter in less than 3 hours 10 15 20 Leave shelter in less than 8 hours 10 20 30 Leave shelter in less than 24 hours 10 15 20
Case D People are notified by Emergency services to evacuate within the
30-km zone… Comments: Emergency planning zone is 12-15 km and monitoring
zone is 50 km. Evacuation outside the emergency planning zone is not regarded realistic. THIS MEANS A FAIR GUESS TO THE FOLLOWING QUESTIONS.
Question D1 - Percentage of people not responding to order of organised
evacuation…
Percentage of people 5% 50% 95%
ignoring to evacuate 4 6 10 not receiving evacuation order 1 2 4 Decides to evacuate but not acc to order 3 5
10 (panic) - Percentage of people at school not responding to order of
organised evacuation
Percentage of people 5% 50% 95%
ignoring to evacuate 1 2 5 decides to evacuate but not acc to order 2 4 6
(panic) - Percentage of people not responding to order of organised
evacuation under bad weather conditions…
Percentage of people 5% 50% 95%
133

ignoring to evacuate *) not receiving evacuation order *) Decides to evacuate but not acc to order 2 4 7
(panic) Comments: Under severe weather conditions the authorities do not
order evacuation as it might make things worse. Question D2 Time period for people that decides for organised evacuation to
prepare (excl driving time) - Time period to implement action to evacuate during working days
Time period to implement 5% 50% 95% For majority of people (68%) 1h 3h 5h For vast majority of people (95%) 4h 6h 8h
- Time period to implement action to evacuate during weekends
and holidays
Time period to implement 5% 50% 95% For majority of people (68%) 1h 3h 8h For vast majority of people (95%) 6h 8h 12h
Question D3 Time period for people that decide for evacuation by themselves to
prepare (excl driving time) - Time period to implement action to evacuate during working days
Time period to implement 5% 50% 95% For majority of people (68%) For vast majority of people (95%)
- Time period to implement action to evacuate during weekends
and holidays
Time period to implement 5% 50% 95% For majority of people (68%) For vast majority of people (95%)
Comments: These questions are relevant to very few individuals,
which make them hard to answer. Further, people are advised to use their own transport means, which make spontaneous action hard to separate from organised action.
134

Case E People are notified by Emergency services to evacuate the emergency-planning zone. Time period to leave the zone…
Comments: Emergency planning zone is 12-15 km and monitoring
zone is 50 km. Evacuation outside the emergency planning zone is not regarded realistic.
Question E1 - Time period during day time and light traffic
to leave the zone in 5% 50% 95%
rural areas 0,25h 0,5h 3h suburban areas 0,15h 0,5h 1h urban areas no urban areas within the
zone - Time period during day time and heavy traffic
to leave the zone in 5% 50% 95%
rural areas 0,25h 0,5h 3hsuburban areas 0,25h 0,5h 1h urban areas no urban areas within the zone
- Time period during night time
to leave the zone in 5% 50% 95%
rural areas 0,25h 0,5h 3h suburban areas 0,25h 0,5h 1h urban areas no urban areas within the
zone Comments: Under severe weather conditions evacuation might take
quite a while. Weather is not considered above Question E2 Time period for people to evacuate the area outside the
emergency-planning zone but within 30 km… - Time period during day time and light traffic
to leave the zone in 5% 50% 95%
rural areas suburban areas urban areas no urban areas within the
zone
135

- Time period during day time and heavy traffic
to leave the zone in 5% 50% 95%
rural areas suburban areas urban areas no urban areas within the
zone - Time period during night time
to leave the zone in 5% 50% 95%
rural areas suburban areas urban areas no urban areas within the
zone Comments: These questions are not relevant as evacuation outside
the emergency planning zone is considered not realistic as an acute protective measure.
Case F People are notified by Emergency services to take stable iodine
tablets… Comments: Tablets are distributed in advance within the
emergency-planning zone of 12-15 km. Question F1 - What is the percentage of people not responding.
5% 50% 95% who have the tablets at home 2 5 8 who collect the tablets at pharmacy 5 25 75
Question F2 - Time period for people to take predistributed stable iodine
tablets…
Time period to implement 5% 50% 95% For majority of people (68%) 5min 10min 30min For vast majority of people (95%) 5min 15min 45min
Comments: whether tablets are predistributed at schools and work places there are no straight answer.
Question F3 - Time period for people to take collected stable iodine tablets…
136

Time period to implement 5% 50% 95% For majority of people (68%) 15min 30min 45min For vast majority of people (95%) 30min 45min 1,5h
Comments: Those who work or are temporarily in the zone are those who spontaneously evacuate. They might as easily evacuate as collecting tablets.
DEPENDENCIES Conditional probabilities Related to Case B1
No Comments
1 2 / 7 12-15 km emergency planning zone 2 irrelevant Evacuation outside 15-km zone not
realistic 3 irrelevant
4 1 / 10
5 1 / 10 12-15 km emergency planning zone 6 1 / 20 7 1 / 20
Related to Case B2
8 1 / 15 12-15 km emergency planning zone 9 1 / 10
10 irrelevant 11 1 / 20
12 1 / 20 12-15 km emergency planning zone 13 1/30
14 1 / 30 Related to Case C
15 1 / 10 12-15 km emergency planning zone 16 1 / 10 17 1 / 5 18 1 / 8
19 1 / 20 12-15 km emergency planning zone 20 1 / 20 21 1 / 10 22 1 / 5
23 1 / 5 12-15 km emergency planning zone 24 1 / 5
Related to Case D
137
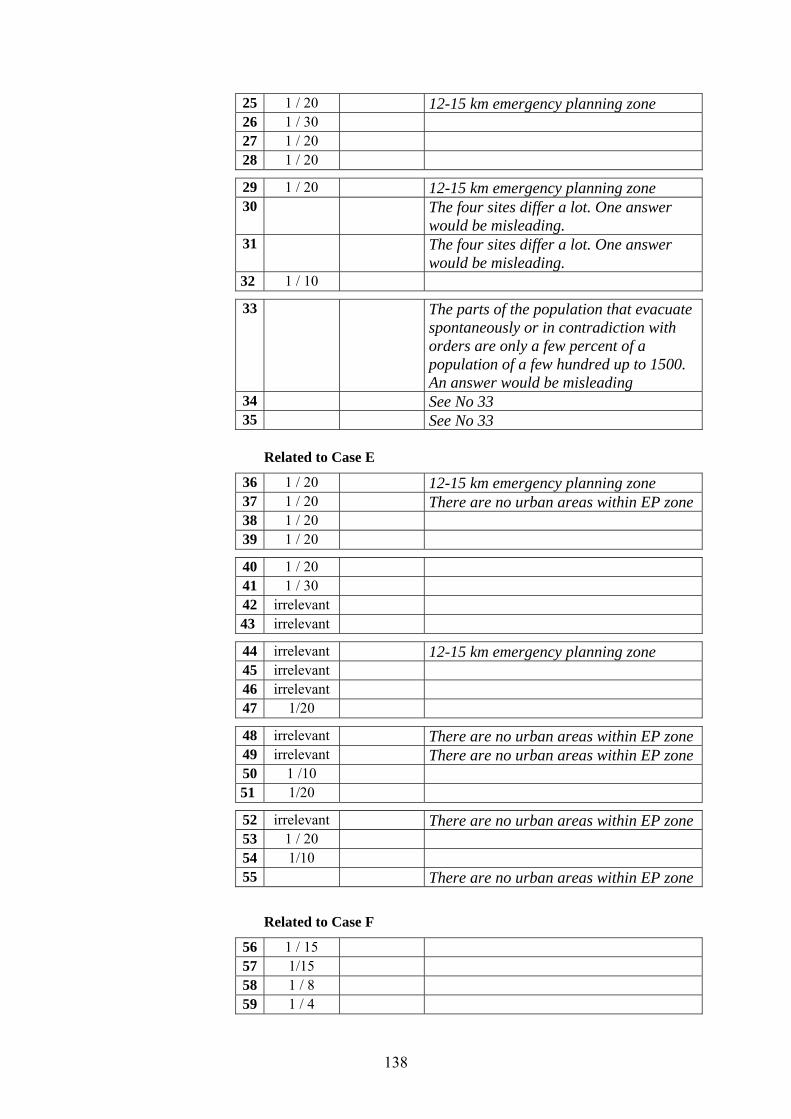
12-15 km emergency planning zone 25 1 / 20 26 1 / 30 27 1 / 20 28 1 / 20
29 1 / 20 12-15 km emergency planning zone 30 The four sites differ a lot. One answer
would be misleading. 31 The four sites differ a lot. One answer
would be misleading. 32 1 / 10
33 The parts of the population that evacuate spontaneously or in contradiction with orders are only a few percent of a population of a few hundred up to 1500. An answer would be misleading
34 See No 33 35 See No 33
Related to Case E
36 1 / 20 12-15 km emergency planning zone There are no urban areas within EP zone 37 1 / 20 38 1 / 20 39 1 / 20
40 1 / 20 41 1 / 30
42 irrelevant 43 irrelevant
44 irrelevant 12-15 km emergency planning zone 45 irrelevant 46 irrelevant 47 1/20
48 irrelevant There are no urban areas within EP zone 49 irrelevant There are no urban areas within EP zone
50 1 /10 51 1/20
52 irrelevant There are no urban areas within EP zone 53 1 / 20
54 1/10 55 There are no urban areas within EP zone
Related to Case F
56 1 / 15 57 1/15
58 1 / 8 59 1 / 4
138

12-15 km emergency planning zone 60 2 / 7 61 1 / 10
Other comments: Some of the answers might seem to be in conflict with logic. The
assessment has been done ”well distributed” in time and to recall the way of thinking from time to time has been hard. All the same the considerations to make Swedish Emergency Preparedness fit in to the model and questions are also violations of regional and site conditions. The four sites in Sweden differ quite a lot in this respect.
My field of interest is how to support decisions of acute protective measures from the NPPs and regional authority’s point of view to make room for their timely execution, that is the very early part of your time scale.
When it comes to off-site monitoring and intermediate and long term protective actions I am not the one to ask.
139

Responses Expert 5 (Bouffort, France) 5 exp 5 1 A1-day time UNI 3.000E+0001 6.000E+0001 9.000E+0001 5 exp 5 2 A1-night time UNI 6.000E+0001 7.500E+0001 9.000E+0001 5 exp 5 3 A1-weekend UNI 6.000E+0001 7.500E+0001 9.000E+0001 5 exp 5 4 A1-rush hours UNI 6.000E+0001 7.500E+0001 9.000E+0001 5 exp 5 5 B1-sh-epz-day UNI 6.000E+0001 9.000E+0001 1.200E+0002 5 exp 5 6 B1-sh-epz-nigh UNI 6.000E+0001 9.000E+0001 1.200E+0002 5 exp 5 7 B1-sh-epz-wen UNI 6.000E+0001 9.000E+0001 1.200E+0002 5 exp 5 8 B1-sh-epz-rush UNI 6.000E+0001 9.000E+0001 1.200E+0002 5 exp 5 9 B1-sh-<30-day UNI 1.800E+0002 2.400E+0002 3.000E+0002 5 exp 5 10 B1-sh-<30-nigh UNI 1.800E+0002 3.000E+0002 4.200E+0002 5 exp 5 11 B1-sh-<30-wend UNI 1.800E+0002 3.600E+0002 5.400E+0002 5 exp 5 12 B1-sh-<30-rush UNI 1.800E+0002 2.400E+0002 3.000E+0002 5 exp 5 13 B1-sh->30-day UNI -9.996E+0002 -9.996E+0002 -9.996E+0002 5 exp 5 14 B1-sh->30-nigh UNI -9.996E+0002 -9.996E+0002 -9.996E+0002 5 exp 5 15 B1-sh->30-wend UNI -9.996E+0002 -9.996E+0002 -9.996E+0002 5 exp 5 16 B1-sh->30-rush UNI -9.996E+0002 -9.996E+0002 -9.996E+0002 5 exp 5 17 B1-ie-epz-day UNI -9.996E+0002 -9.996E+0002 -9.996E+0002 5 exp 5 18 B1-ie-epz-nigh UNI -9.996E+0002 -9.996E+0002 -9.996E+0002 5 exp 5 19 B1-ie-epz-wend UNI -9.996E+0002 -9.996E+0002 -9.996E+0002 5 exp 5 20 B1-ie-epz-rush UNI -9.996E+0002 -9.996E+0002 -9.996E+0002 5 exp 5 21 B1-ie-<30-day UNI -9.996E+0002 -9.996E+0002 -9.996E+0002 5 exp 5 22 B1-ie-<30-nigh UNI -9.996E+0002 -9.996E+0002 -9.996E+0002 5 exp 5 23 B1-ie-<30-wend UNI -9.996E+0002 -9.996E+0002 -9.996E+0002 5 exp 5 24 B1-ie-<30-rush UNI -9.996E+0002 -9.996E+0002 -9.996E+0002 5 exp 5 25 B1-de-epz-day UNI 2.400E+0002 2.700E+0002 3.000E+0002 5 exp 5 26 B1-de-epz-nigh UNI 2.400E+0002 2.700E+0002 3.000E+0002 5 exp 5 27 B1-de-epz-wend UNI 2.400E+0002 2.700E+0002 3.000E+0002 5 exp 5 28 B1-de-epz-rush UNI 2.400E+0002 2.700E+0002 3.000E+0002 5 exp 5 29 B1-de-<30-day UNI -9.996E+0002 -9.996E+0002 -9.996E+0002 5 exp 5 30 B1-de-<30-nigh UNI -9.996E+0002 -9.996E+0002 -9.996E+0002 5 exp 5 31 B1-de-<30-wend UNI -9.996E+0002 -9.996E+0002 -9.996E+0002 5 exp 5 32 B1-de-<30-rush UNI -9.996E+0002 -9.996E+0002 -9.996E+0002 5 exp 5 33 B2-sh-epz-day UNI 1.500E+0001 1.800E+0001 3.000E+0001 5 exp 5 34 B2-sh-epz-nigh UNI 1.500E+0001 1.800E+0001 2.400E+0001 5 exp 5 35 B2-sh-epz-wend UNI 1.500E+0001 3.000E+0001 3.600E+0001 5 exp 5 36 B2-sh-epz-rush UNI 1.500E+0001 3.000E+0001 3.600E+0001 5 exp 5 37 B2-sh-<30-day UNI 1.200E+0002 1.500E+0002 1.800E+0002 5 exp 5 38 B2-sh-<30-nigh UNI 1.200E+0002 1.500E+0002 1.800E+0002 5 exp 5 39 B2-sh-<30-wend UNI 1.200E+0002 1.500E+0002 1.800E+0002 5 exp 5 40 B2-sh-<30-rush UNI 1.200E+0002 1.500E+0002 1.800E+0002 5 exp 5 41 B2-sh->30-day UNI 7.800E+0002 8.400E+0002 9.000E+0002 5 exp 5 42 B2-sh->30-nigh UNI 7.800E+0002 8.400E+0002 9.000E+0002 5 exp 5 43 B2-sh->30-wend UNI 7.800E+0002 8.400E+0002 9.000E+0002 5 exp 5 44 B2-sh->30-rush UNI 7.800E+0002 8.400E+0002 9.000E+0002 5 exp 5 45 B2-ie-epz-day UNI -9.996E+0002 -9.996E+0002 -9.996E+0002 5 exp 5 46 B2-ie-epz-nigh UNI -9.996E+0002 -9.996E+0002 -9.996E+0002 5 exp 5 47 B2-ie-epz-wend UNI -9.996E+0002 -9.996E+0002 -9.996E+0002 5 exp 5 48 B2-ie-epz-rush UNI -9.996E+0002 -9.996E+0002 -9.996E+0002 5 exp 5 49 B2-ie-<30-day UNI -9.996E+0002 -9.996E+0002 -9.996E+0002 5 exp 5 50 B2-ie-<30-nigh UNI -9.996E+0002 -9.996E+0002 -9.996E+0002 5 exp 5 51 B2-ie-<30-wend UNI -9.996E+0002 -9.996E+0002 -9.996E+0002 5 exp 5 52 B2-ie-<30-rush UNI -9.996E+0002 -9.996E+0002 -9.996E+0002 5 exp 5 53 B2-de-epz-day UNI 4.800E+0002 5.400E+0002 6.000E+0002 5 exp 5 54 B2-de-epz-nigh UNI 4.800E+0002 5.400E+0002 6.000E+0002 5 exp 5 55 B2-de-epz-wend UNI 4.800E+0002 5.400E+0002 6.000E+0002 5 exp 5 56 B2-de-epz-rush UNI 4.800E+0002 5.400E+0002 6.000E+0002 5 exp 5 57 B2-de-<30-day UNI -9.996E+0002 -9.996E+0002 -9.996E+0002 5 exp 5 58 B2-de-<30-nigh UNI -9.996E+0002 -9.996E+0002 -9.996E+0002 5 exp 5 59 B2-de-<30-wend UNI -9.996E+0002 -9.996E+0002 -9.996E+0002 5 exp 5 60 B2-de-<30-rush UNI -9.996E+0002 -9.996E+0002 -9.996E+0002 5 exp 5 61 C1-sh-not-igno UNI 5.000E+0000 1.000E+0001 1.500E+0001 5 exp 5 62 C1-sh-not-notr UNI 5.000E+0000 1.000E+0001 1.500E+0001 5 exp 5 63 C1-sh-not-spon UNI 1.500E+0001 2.000E+0001 3.000E+0001 5 exp 5 64 C2-sh-yes-maj UNI 3.000E+0001 6.000E+0001 9.000E+0001 5 exp 5 65 C2-sh-yes-vmaj UNI 6.000E+0001 9.000E+0001 1.200E+0002 5 exp 5 66 C3-sh-leave<3d UNI 5.000E+0000 1.000E+0001 2.000E+0001 5 exp 5 67 C3-sh-leave<8d UNI 1.500E+0001 2.000E+0001 2.500E+0001
140

5 exp 5 68 C3-sh-leave<12 UNI 4.000E+0001 4.500E+0001 5.000E+0001 5 exp 5 69 C3-sh-leave<3n UNI 2.000E+0000 3.000E+0000 4.000E+0000 5 exp 5 70 C3-sh-leave<8n UNI 1.500E+0001 2.000E+0001 2.500E+0001 5 exp 5 71 C3-sh-leave<24 UNI 4.000E+0001 4.500E+0001 5.000E+0001 5 exp 5 72 D1-ev-day-igno UNI 5.000E+0000 6.000E+0000 1.000E+0001 5 exp 5 73 D1-ev-day-notr UNI 5.000E+0000 6.000E+0000 1.000E+0001 5 exp 5 74 D1-ev-day-nfor UNI 3.000E+0001 4.000E+0001 5.000E+0001 5 exp 5 75 D1-ev-sch-igno UNI 1.000E-0002 2.000E-0002 3.000E-0002 5 exp 5 76 D1-ev-sch-nfor UNI 1.000E-0002 2.000E-0002 3.000E-0002 5 exp 5 77 D1-ev-swc-igno UNI 2.000E+0000 2.500E+0000 4.000E+0000 5 exp 5 78 D1-ev-swc-notr UNI -9.996E+0002 -9.996E+0002 -9.996E+0002 5 exp 5 79 D1-ev-swc-nfor UNI 4.000E+0000 5.000E+0000 7.000E+0000 5 exp 5 80 D2-ev-fo-wd-ma UNI 3.000E+0001 3.600E+0001 4.200E+0001 5 exp 5 81 D2-ev-fo-wd-vm UNI 3.000E+0001 3.600E+0001 4.200E+0001 5 exp 5 82 D2-ev-fo-wh-ma UNI 3.000E+0001 3.600E+0001 4.200E+0001 5 exp 5 83 D2-ev-fo-wh-vm UNI 3.000E+0001 3.600E+0001 4.200E+0001 5 exp 5 84 D3-ev-nf-wd-ma UNI 1.500E+0001 1.800E+0001 2.100E+0001 5 exp 5 85 D3-ev-nf-wd-vm UNI 3.000E+0001 3.600E+0001 4.200E+0001 5 exp 5 86 D3-ev-nf-wh-ma UNI 1.500E+0001 1.800E+0001 2.100E+0001 5 exp 5 87 D3-ev-nf-wh-vm UNI 3.000E+0001 3.600E+0001 4.200E+0001 5 exp 5 88 E1-epz-daylt-r UNI 6.000E+0000 3.000E+0001 6.000E+0001 5 exp 5 89 E1-epz-daylt-s UNI 6.000E+0000 3.000E+0001 6.000E+0001 5 exp 5 90 E1-epz-daylt-u UNI 6.000E+0000 6.000E+0001 1.200E+0002 5 exp 5 91 E1-epz-dayht-r UNI 6.000E+0000 3.000E+0001 6.000E+0001 5 exp 5 92 E1-epz-dayht-s UNI 6.000E+0001 1.200E+0002 2.400E+0002 5 exp 5 93 E1-epz-dayht-u UNI 6.000E+0001 1.800E+0002 3.000E+0002 5 exp 5 94 E1-epz-night-r UNI 6.000E+0000 3.000E+0001 6.000E+0001 5 exp 5 95 E1-epz-night-s UNI 6.000E+0000 3.000E+0001 6.000E+0001 5 exp 5 96 E1-epz-night-u UNI 6.000E+0000 6.000E+0001 1.200E+0002 5 exp 5 97 E2-<30-daylt-r UNI 6.000E+0000 3.000E+0001 6.000E+0001 5 exp 5 98 E2-<30-daylt-s UNI 6.000E+0000 6.000E+0001 1.200E+0002 5 exp 5 99 E2-<30-daylt-u UNI 6.000E+0000 1.200E+0002 2.400E+0002 5 exp 5 100 E2-<30-dayht-r UNI 6.000E+0000 3.000E+0001 6.000E+0001 5 exp 5 101 E2-<30-dayht-s UNI 6.000E+0001 2.400E+0002 3.600E+0002 5 exp 5 102 E2-<30-dayht-u UNI 6.000E+0001 2.400E+0002 3.600E+0002 5 exp 5 103 E2-<30-night-r UNI 6.000E+0000 3.000E+0001 6.000E+0001 5 exp 5 104 E2-<30-night-s UNI 6.000E+0000 6.000E+0001 1.200E+0002 5 exp 5 105 E2-<30-night-u UNI 6.000E+0000 1.200E+0002 3.600E+0002 5 exp 5 106 F1-iod-not-hom UNI 2.000E+0000 5.000E+0000 1.000E+0001 5 exp 5 107 F1-iod-not-dis UNI 2.000E+0001 5.000E+0001 6.000E+0001 5 exp 5 108 F2-iod-hom-maj UNI 6.000E+0000 1.800E+0001 3.000E+0001 5 exp 5 109 F2-iod-hom-vma UNI 3.000E+0001 6.000E+0001 9.000E+0001 5 exp 5 110 F3-iod-dis-maj UNI 4.800E+0001 6.000E+0001 9.000E+0001 5 exp 5 111 F3-iod-dis-vma UNI 4.800E+0001 6.000E+0001 9.000E+0001
141

Responses Expert 6 (Hardeman, Belgium) 6 exp 6 1 A1-day time UNI 5.000E+0000 1.000E+0001 3.000E+0001 6 exp 6 2 A1-night time UNI 1.500E+0001 2.000E+0001 4.000E+0001 6 exp 6 3 A1-weekend UNI 1.500E+0001 2.000E+0001 4.000E+0001 6 exp 6 4 A1-rush hours UNI 1.500E+0001 2.000E+0001 4.000E+0001 6 exp 6 5 B1-sh-epz-day UNI 1.000E+0001 3.000E+0001 1.200E+0002 6 exp 6 6 B1-sh-epz-nigh UNI 1.000E+0001 3.500E+0001 1.800E+0002 6 exp 6 7 B1-sh-epz-wen UNI 1.000E+0001 3.500E+0001 1.800E+0002 6 exp 6 8 B1-sh-epz-rush UNI 1.000E+0001 3.500E+0001 1.800E+0002 6 exp 6 9 B1-sh-<30-day UNI 1.000E+0001 6.000E+0001 1.800E+0002 6 exp 6 10 B1-sh-<30-nigh UNI 1.000E+0001 9.000E+0001 2.400E+0002 6 exp 6 11 B1-sh-<30-wend UNI 1.000E+0001 9.000E+0001 2.400E+0002 6 exp 6 12 B1-sh-<30-rush UNI 1.000E+0001 1.200E+0002 3.000E+0002 6 exp 6 13 B1-sh->30-day UNI 3.000E+0001 9.000E+0001 2.400E+0002 6 exp 6 14 B1-sh->30-nigh UNI 5.000E+0001 1.200E+0002 3.000E+0002 6 exp 6 15 B1-sh->30-wend UNI 5.000E+0001 1.200E+0002 3.000E+0002 6 exp 6 16 B1-sh->30-rush UNI 6.000E+0001 1.800E+0002 4.200E+0002 6 exp 6 17 B1-ie-epz-day UNI 1.000E+0001 4.000E+0001 1.500E+0002 6 exp 6 18 B1-ie-epz-nigh UNI 1.000E+0001 6.000E+0001 2.000E+0002 6 exp 6 19 B1-ie-epz-wend UNI 1.000E+0001 6.000E+0001 2.000E+0002 6 exp 6 20 B1-ie-epz-rush UNI 1.000E+0001 9.000E+0001 2.400E+0002 6 exp 6 21 B1-ie-<30-day UNI 1.000E+0000 9.000E+0001 2.400E+0002 6 exp 6 22 B1-ie-<30-nigh UNI 1.500E+0001 1.200E+0002 3.000E+0002 6 exp 6 23 B1-ie-<30-wend UNI 1.500E+0001 1.200E+0002 3.000E+0002 6 exp 6 24 B1-ie-<30-rush UNI 1.500E+0001 1.800E+0002 3.600E+0002 6 exp 6 25 B1-de-epz-day UNI 1.000E+0001 3.000E+0001 1.000E+0002 6 exp 6 26 B1-de-epz-nigh UNI 1.000E+0001 3.000E+0001 1.500E+0002 6 exp 6 27 B1-de-epz-wend UNI 1.000E+0001 3.000E+0001 1.500E+0002 6 exp 6 28 B1-de-epz-rush UNI 1.000E+0001 4.500E+0001 1.800E+0002 6 exp 6 29 B1-de-<30-day UNI 1.500E+0001 6.000E+0001 1.800E+0002 6 exp 6 30 B1-de-<30-nigh UNI 1.500E+0001 9.000E+0001 2.400E+0002 6 exp 6 31 B1-de-<30-wend UNI 1.500E+0001 9.000E+0001 2.400E+0002 6 exp 6 32 B1-de-<30-rush UNI 1.500E+0001 1.200E+0002 3.000E+0002 6 exp 6 33 B2-sh-epz-day UNI 1.000E+0001 2.000E+0001 9.000E+0001 6 exp 6 34 B2-sh-epz-nigh UNI 1.000E+0001 2.000E+0001 1.200E+0002 6 exp 6 35 B2-sh-epz-wend UNI 1.000E+0001 2.000E+0001 1.200E+0002 6 exp 6 36 B2-sh-epz-rush UNI 1.000E+0001 2.000E+0001 1.200E+0002 6 exp 6 37 B2-sh-<30-day UNI 1.000E+0001 4.000E+0001 1.200E+0002 6 exp 6 38 B2-sh-<30-nigh UNI 1.000E+0001 4.500E+0001 1.500E+0002 6 exp 6 39 B2-sh-<30-wend UNI 1.000E+0001 4.500E+0001 1.500E+0002 6 exp 6 40 B2-sh-<30-rush UNI 2.000E+0001 6.000E+0001 1.800E+0002 6 exp 6 41 B2-sh->30-day UNI 2.500E+0001 8.000E+0001 1.800E+0002 6 exp 6 42 B2-sh->30-nigh UNI 4.000E+0001 1.000E+0002 2.700E+0002 6 exp 6 43 B2-sh->30-wend UNI 4.000E+0001 1.000E+0002 2.700E+0002 6 exp 6 44 B2-sh->30-rush UNI 4.500E+0001 1.500E+0002 3.500E+0002 6 exp 6 45 B2-ie-epz-day UNI 1.000E+0001 3.000E+0001 1.000E+0002 6 exp 6 46 B2-ie-epz-nigh UNI 1.000E+0001 3.000E+0001 1.500E+0002 6 exp 6 47 B2-ie-epz-wend UNI 1.000E+0001 3.000E+0001 1.500E+0002 6 exp 6 48 B2-ie-epz-rush UNI 1.000E+0001 4.500E+0001 1.800E+0002 6 exp 6 49 B2-ie-<30-day UNI 1.500E+0001 6.000E+0001 1.800E+0002 6 exp 6 50 B2-ie-<30-nigh UNI 1.500E+0001 9.000E+0001 2.400E+0002 6 exp 6 51 B2-ie-<30-wend UNI 1.500E+0001 9.000E+0001 1.400E+0002 6 exp 6 52 B2-ie-<30-rush UNI 1.500E+0001 1.200E+0002 3.000E+0002 6 exp 6 53 B2-de-epz-day UNI 1.000E+0001 2.500E+0001 7.500E+0001 6 exp 6 54 B2-de-epz-nigh UNI 1.000E+0001 2.500E+0001 1.200E+0002 6 exp 6 55 B2-de-epz-wend UNI 1.000E+0001 2.500E+0001 1.200E+0002 6 exp 6 56 B2-de-epz-rush UNI 1.000E+0001 4.000E+0001 1.500E+0002 6 exp 6 57 B2-de-<30-day UNI 1.500E+0001 4.500E+0001 1.500E+0002 6 exp 6 58 B2-de-<30-nigh UNI 1.500E+0001 7.500E+0001 1.800E+0002 6 exp 6 59 B2-de-<30-wend UNI 1.500E+0001 7.500E+0001 1.800E+0002 6 exp 6 60 B2-de-<30-rush UNI 1.500E+0001 1.000E+0002 2.400E+0002 6 exp 6 61 C1-sh-not-igno UNI 1.000E+0000 5.000E+0000 1.000E+0001 6 exp 6 62 C1-sh-not-notr UNI 5.000E+0000 1.000E+0001 2.000E+0001 6 exp 6 63 C1-sh-not-spon UNI 5.000E+0000 2.500E+0001 5.000E+0001 6 exp 6 64 C2-sh-yes-maj UNI 1.000E+0000 5.000E+0000 1.500E+0001 6 exp 6 65 C2-sh-yes-vmaj UNI 2.000E+0000 1.000E+0001 3.000E+0001 6 exp 6 66 C3-sh-leave<3d UNI 5.000E+0000 1.000E+0001 2.000E+0001
142

6 exp 6 67 C3-sh-leave<8d UNI 1.000E+0001 2.000E+0001 5.000E+0001 6 exp 6 68 C3-sh-leave<12 UNI 2.000E+0001 5.000E+0001 8.000E+0001 6 exp 6 69 C3-sh-leave<3n UNI 1.000E+0000 5.000E+0000 1.000E+0001 6 exp 6 70 C3-sh-leave<8n UNI 3.000E+0000 1.000E+0001 2.000E+0001 6 exp 6 71 C3-sh-leave<24 UNI 2.000E+0001 6.000E+0001 9.000E+0001 6 exp 6 72 D1-ev-day-igno UNI 1.000E+0000 5.000E+0000 1.000E+0001 6 exp 6 73 D1-ev-day-notr UNI 3.000E+0000 8.000E+0000 1.500E+0001 6 exp 6 74 D1-ev-day-nfor UNI 3.000E+0000 8.000E+0000 1.500E+0001 6 exp 6 75 D1-ev-sch-igno UNI 1.000E+0000 3.000E+0000 5.000E+0000 6 exp 6 76 D1-ev-sch-nfor UNI 1.000E+0000 3.000E+0000 5.000E+0000 6 exp 6 77 D1-ev-swc-igno UNI 5.000E+0000 1.000E+0001 2.000E+0001 6 exp 6 78 D1-ev-swc-notr UNI 5.000E+0000 1.000E+0001 2.000E+0001 6 exp 6 79 D1-ev-swc-nfor UNI 5.000E+0000 1.000E+0001 2.000E+0001 6 exp 6 80 D2-ev-fo-wd-ma UNI 5.000E+0000 1.000E+0001 2.000E+0001 6 exp 6 81 D2-ev-fo-wd-vm UNI 1.500E+0001 2.500E+0001 4.500E+0001 6 exp 6 82 D2-ev-fo-wh-ma UNI 5.000E+0000 1.000E+0001 1.500E+0001 6 exp 6 83 D2-ev-fo-wh-vm UNI 1.000E+0001 2.000E+0001 6.000E+0001 6 exp 6 84 D3-ev-nf-wd-ma UNI 3.000E+0000 8.000E+0000 1.500E+0001 6 exp 6 85 D3-ev-nf-wd-vm UNI 5.000E+0000 1.500E+0001 3.000E+0001 6 exp 6 86 D3-ev-nf-wh-ma UNI 3.000E+0000 8.000E+0000 1.200E+0001 6 exp 6 87 D3-ev-nf-wh-vm UNI 5.000E+0000 1.200E+0001 2.000E+0001 6 exp 6 88 E1-epz-daylt-r UNI 5.000E+0000 1.500E+0001 3.000E+0001 6 exp 6 89 E1-epz-daylt-s UNI 1.000E+0001 3.000E+0001 6.000E+0001 6 exp 6 90 E1-epz-daylt-u UNI 1.500E+0001 6.000E+0001 1.200E+0002 6 exp 6 91 E1-epz-dayht-r UNI 1.000E+0001 2.500E+0001 4.500E+0001 6 exp 6 92 E1-epz-dayht-s UNI 2.000E+0001 6.000E+0001 9.000E+0001 6 exp 6 93 E1-epz-dayht-u UNI 3.000E+0001 1.200E+0002 1.800E+0002 6 exp 6 94 E1-epz-night-r UNI 5.000E+0000 2.000E+0001 3.500E+0001 6 exp 6 95 E1-epz-night-s UNI 1.000E+0001 4.000E+0001 7.500E+0001 6 exp 6 96 E1-epz-night-u UNI 1.500E+0001 7.500E+0001 1.500E+0002 6 exp 6 97 E2-<30-daylt-r UNI 1.500E+0001 3.000E+0001 9.000E+0001 6 exp 6 98 E2-<30-daylt-s UNI 3.000E+0001 6.000E+0001 1.800E+0002 6 exp 6 99 E2-<30-daylt-u UNI 6.000E+0001 1.200E+0002 2.400E+0002 6 exp 6 100 E2-<30-dayht-r UNI 2.000E+0001 6.000E+0001 1.800E+0002 6 exp 6 101 E2-<30-dayht-s UNI 4.000E+0001 1.200E+0002 3.600E+0002 6 exp 6 102 E2-<30-dayht-u UNI 8.000E+0001 2.400E+0002 4.800E+0002 6 exp 6 103 E2-<30-night-r UNI 2.000E+0001 4.500E+0001 1.350E+0002 6 exp 6 104 E2-<30-night-s UNI 4.000E+0001 9.000E+0001 2.400E+0002 6 exp 6 105 E2-<30-night-u UNI 6.000E+0001 1.800E+0002 3.600E+0002 6 exp 6 106 F1-iod-not-hom UNI 3.000E+0000 1.000E+0001 1.500E+0001 6 exp 6 107 F1-iod-not-dis UNI 1.000E+0001 2.500E+0001 5.000E+0001 6 exp 6 108 F2-iod-hom-maj UNI 2.000E+0000 5.000E+0000 1.000E+0001 6 exp 6 109 F2-iod-hom-vma UNI 3.000E+0000 1.000E+0001 2.000E+0001 6 exp 6 110 F3-iod-dis-maj UNI 1.500E+0001 3.000E+0001 6.000E+0001 6 exp 6 111 F3-iod-dis-vma UNI 3.000E+0001 6.000E+0001 1.200E+0002
143
Rationale Expert 6 (Hardeman, Belgium) General comments It is obvious that a lot of parameters to assess during this elicitation exercise are subject to the organisation set-up locally near the power stations, and this organisation strongly depends on site dependent factors (important ones being population density, traffic density, industrial density). However, quite a lot of data are available from exercises or analogue situations. Other factors, mainly related to the behaviour of people, are very hard to assess, as they have not been tested in reality. In order to reduce the uncertainty margins, I have decided to get in touch with the main responsible (at the governmental level) for emergency actions. His ideas are included in the text, but are strongly biased by the actual emergency organisation within our country (having other dimensions of intervention zones); however, the main ideas he mentioned remain valid (ref. 1). Case A It is clear that the dynamics of the accident strongly depends on the type of plant; the related time interval estimations for the average etc. have been considered having the actual organisation (ref. 2 - 3) in the Belgian stations in mind (PWR with double containment); a lack of containment or plants with gas coolants might have other dynamics, and I think that the faster dynamics will presumably give rise to shorter alerting periods. This has been included in the 5 - 95 % interval. Fuel fabrication plants, waste handling and storage facilities, research laboratories, military sites have not been considered. Question A1 The Tnot time interval is composed of an initial period on-site (time between observation of a serious anomaly on-site) and the decision to alert the authorities (tpa - tal), and the time needed to contact the person in charge. On-site and during day-time, a person with sufficient authority is always present; during week-ends and at night, this person is on-call; this may cause a delay of 10 min maximum. Therefore, it is assumed that a first warning by phone might take only a few minutes during daytime up to about half an hour, depending on the perceived severity of the accident and on the automatic actions taken. A confirmation by fax or equivalent, and with extra data might take about 15 min - 30 min extra, but is not included in the estimates filled in on the paper. The actions at the level of the authorities are almost immediate, as there is permanently somebody present who disposes of two redundant alerting facilities to get in touch with the main responsible. A first contact by telephone for verification purposes and direct information exchange can happen within a few minutes after reception of the notification by the site (both during day and night, and also in week-ends). Really getting the responsible to the meeting place that is foreseen by the law (ref. 2), might take several hours, especially during rushing hours), but this is not indispensable to launch actions. A larger uncertainty might exist in case of general technical failures of the communication networks at the level of the territory. This is anticipated by the installation of a direct link between the nuclear power plants and the crisis centre; certainly for the initial alerting messages, this probability should be much less than 5 %, so it doesn't influence the values added to the table. Case B1 Question B1 At first, this problem is related to the time needed to assess the situation; in case of real severity of the accident, the decisions can be made at a more local level of authority, allowing to decide to notify the population and to bring all the emergency workers in stand-by or to
144

action within a short lapse of time (typically minutes - half an hour near the site); in the case the situation is assessed to be urgent but less critical (evolving accident as specified by the site), an organisation at the level of the federal government is put to place; time for organisation, meeting, assessment of consequences,... is minimally 15-30 min during office hours, and may be up to a few hours during other time periods. For other organisations, when the decision to shelter/evacuate can be made locally under any circumstances, and eventually be decided upon on-site or automatically, the assessment times will be much shorter (max. 15 min). It is very probable that the decision to shelter will be made easier than the decision to evacuate; in the latter case, extra time for better assessment is very probable, unless it is a very serious accident but still leaving sufficient time to take actions. If a release already started, or is expected within a short lapse of time, there may be tendency to wait for further information (both consequence assessment and operational parameters) before the decision to evacuate is taken. In very industrial sites with an enormous economic activity and a potentiality of imposing secondary risks, it may be difficult to decide to evacuate immediately; if the information is not clear or incomplete, there may be tendency to ask for more information on the accident, which of course introduces delays. Operational circumstances and meteorological data will certainly also influence the time needed for the assessment of the situation to evacuate, but they should hardly influence the decision to shelter. The decision to shelter is presumably taken easier during night time, and will be automatically fulfilled by a majority of people. It is clear that the decision to take actions outside of the 30 km zone might be delayed due to its enormous impact; probability increases that bigger cities/tourist facilities/industries etc... are involved, and the degree of preparedness will very presumably be much less as compared to the closer zones. In this case, the assessment times might be much longer (considering the benefit of waiting for further information and better assessment). The notification of the population itself depends on the way of notification (siren signals, use of vehicles, messages at radio or TV-stations), but also on the population density, economic and agricultural activities, etc. Also the degree of success plays a role: notification by siren is very fast (few minutes) and necessary for main traffic roads etc., but less reliable in agricultural regions etc., while notification by vehicles is much slower, but eventually more suites in agricultural regions; direct alert of hospitals, industrial sites, ... by phone or other means of communication might also be applied, which is slower as compared to sirens, but faster as compared to warning by vehicles etc. Messages via radio, television,... can be sent out very fast during daytime, but are maybe delayed and not efficient for alerting during night-time. It is assumed that all possibilities are available and complementary within the first emergency planning zone, and within the zone up to 30 km; outside of these zones, there are not sufficient sirens, and warning by vehicles is supposed not to be practicable anywhere simultaneously (only in bigger towns). The use of sirens typically takes minutes, the use of vehicles might take hours in densely populated areas (less in agricultural and industrial regions), the transmission of messages on radio and TV typically takes minutes during daytime (time needed to verify and confirm that the message must be sent) if the messages are pre-prepared; at night, it might take up to typically half an hour. (ref. 1.)
145

In principle, there is not much difference between the notification of the population to shelter or to notify them to evacuate. Table 1 The 5% interval is taken based on a local decision to shelter, and an immediate alert via sirens, yielding sufficient response by the population; the 95 % interval is taken based on a situation yielding long assessment times at the governmental level, and warning via vehicles (sirens supposed not to be installed or not to work adequately) and the media. Table 2 Timing remains identical in case of local decision power and alerting via sirens; however chances are small that an effective siren network covers the entire zone, and extra alert via media or vehicles might be necessary. If the decision cannot be taken locally, or if extra assessment is desired before sheltering is decided upon, delays of at least 30 min are to be foreseen. Therefore, the 5% probability will not change much, but the 50% and 90 % values might be considerably higher. Table 3 The assessment period will presumably be much larger before the decision is made to take actions at such big distances; many dispersion model calculations are getting insufficiently reliable at such distances. Furthermore, the degree of preparedness will be much less in this region. An effective notification pathway may not exist. This will increase all percentile values as compared to previous tables; as the outer diameter is not specified, the 95% percentile is very difficult to assess. Table 5 The decision time within the first emergency planning zone will not differ much as compared to the sheltering condition if the power is local; if the decision to evacuate has to be taken at a higher level, it will take more time. The notification also is similar as to the situation of sheltering; however, in case of evacuation, it is highly recommended also to implement a traffic plan (limiting traffic to the evacuation zone, imposing one way traffic in certain areas etc.) and special arrangements are to be foreseen for special cases (hospitals e.g.); implementation of these may require substantial effort (if high population density, economic activities,...), but it may be assumed that this is well prepared in this first zone; in certain regions, traffic control may be automatic, or the related effort may be very limited. It is very probable that the notification of the population is delayed until the preparations/traffic arrangements are made by the emergency services; in real catastrophic situations, the announcement to evacuate might be given immediately. Therefore, the 5% value will presumably remain unaltered; the 50% and 95% values will shift up. Table 6 The situation in principle is similar to sheltering, but the implementation of a traffic plan, and the organisation for hospitals,... takes substantially longer. It may even be necessary to bring extra forces from more remote areas. Bringing people into positions around a segment of 30 km radius might easily take 30 min to 90 min, even when sufficient staff is available; outside of normal working hours or during rushing hours, this may even be worse. Much also depends on the opening angle of the sector chosen, and on the organisation locally. If the corpse of emergency workers is sufficiently large, the differences day/night etc. are much smaller; if other teams from other corpses/units,... have to be called, time scales may be very different.
146

Table 7 - 8 The situation of delayed evacuation after initial sheltering is considered to be more easy as compared to tables 5-6 above: it is easier to get in touch with people, and the traffic control is much easier. (ref. 1). Furthermore, all emergency workers will be put in stand-bye during the sheltering period. Case B2 The main distinction is that during the site emergency stage it has been possible to warn all partners involved in the emergency actions, from the highest level of decision to the emergency staff involved in traffic control. (It is assumed that the site is obliged to inform the authorities of their status of site emergency quasi-immediately). Such a situation allows to bring the emergency workers in positions allowing to start acting almost immediately if they are told to do so. This will substantially decrease the time needed to implement evacuation measures in the zones up to 30 km. However, the degree of preparedness outside of the 30 km zone will presumably not be altered much, as a site emergency presumably will not provoke important actions at large distances, and the gain in time will be limited. In the tables 1-2-3, both effects will show clearly in the 50 and 95% values. The case of immediate evacuation without prior sheltering, but with a site emergency announced earlier on is rather similar to the cases 7-8 under heading B1 from an organisational point of view. The effect of a previous evacuation after an initial site emergency is limited in case B2.
147

Case C Question C1 There are no reliable data/studies available on this subject so far; it is known (ref. 1) that people often respond better in case the consequences of an accident can be observed directly (visually, or some smell etc.); on the other hand, this increases the number of people coming specially to see the accident out of curiosity. If the effects are not easily observable (e.g. odourless gasses, but also radioactive releases), it is more difficult to convince the people to respond adequately. The number of people responding will also depend on the quality of information they get (and got previously), the confidence in the spokesman, etc. It is believed that spontaneous evacuation will be the vast contributor to people not responding given they are notified correctly. The number of people not being notified depends mainly on the way notification is performed, and this fraction presumably increases with distance. There may also be language problems causing several people not to understand the messages announced. This is certainly the case in countries with large fractions of immigrants and speaking a language that is generally speaking not well spread. The numbers will certainly also depend on the distance to the plant etc. The values put in the tables are not based scientifically, but a best guess. In industrial areas, or in areas with large collectivities, it is believed that the response will be better, as there are some responsible people acting as intermediate persons. Question C2 For local habitants and the main collectivities (hospitals, schools,...), the behaviour time will be very short; for people passing by, or in industrial plants, it may take some time before they shelter. Question C3 This parameter will strongly be influenced by the quality of information they receive, and the confidence the people have in this information. If they are just told to remain sheltered without further notice, without any further information given, or information that is hard to understand or contradictory, they will presumably not stay in their shelter for a long time. During the night time, it is believed that they will much better stay indoors, at least until dawn. It will certainly also depend on the information whether there are really releases or whether there is just the threat of releases. (in Belgium, there have never been any sheltering instructions for more than 3 hours so far (ref. 1); the emergency plan (ref. 2) officially foresees periods up to 24 h).
148

Case D Question D1 Also for questions D1, there is no real evidence available related to organised evacuation in nuclear emergency situations. Important parameters might be: way of living (agricultural, industrial); release going on or not; time of evacuation (after a long period of sheltering, most of the people will respond very presumably unless they already spontaneously evacuated); day- or night-time, weather conditions etc. Presumably, special groups like schools, hospitals,... will easily follow evacuation instructions; farmers having cattle might prefer to stay home at any price. If a traffic plan is well installed, the number of people moving into wrong directions will presumably be very limited, especially if special groups like schools are taken care of by priority. It is also believed that the probability of not being notified to evacuate will be somewhat smaller as compared to sheltering, as it includes larger traffic movements, more involvement of emergency workers etc. An important aspect hard to assess is the choice weather the evacuation is obligatory or on a voluntary basis, and its influence on the fractions not (adequately) responding. Question D2 The start of the evacuation (leaving by own car or going to collection points) can be very fast for many people involved. Exceptions might be the people having mobility problems (due to age, handicap, imprisonment, etc.); farmers not wanting to leave their cattle; people not having trust that patrols will adequately guard their house and their property during their absence. In industrial regions, there might be a group of people not being allowed to leave in order to avoid secondary health risks (typically a few percent of the staff - ref. 4, 5). Even when convinced they should evacuate, the practical start of the evacuation might be delayed. The effect of holidays and week-ends is limited for farmers, industry with batch processes etc. An advantage of the week-ends and holidays might be that family members are better grouped together (depending on living habits), except perhaps for the age groups 35-50 years (children might be away separately, making the parents to more hesitate to start their evacuation). Question D3 I believe that spontaneous evacuation will start as fast or even faster than organised evacuation, as people are clearly more convinced that an urgent evacuation is necessary. This is also the opinion of the responsible authorities (ref. 1).
149
Case E Question E1 The main distinction to be made is the distinction between rural, urban or industrial area's, the suburban case being a kind of "average" between rural and urban. In rural area's, the number of vehicles having to leave the zone is limited, and traffic jams will be small. In urban area's, the situation will be similar or even worse as compared to rushing hours. In industrial area's, traffic arrangements are presumably good, and an evacuation can take place more systematically, yielding less problems as compared to urban area's; driving times to the main traffic roads will be similar as compared to the normal situations at the end of the working day. An important factor is the effectiveness of the imposed traffic plan (that must keep traffic out of the evacuation zones and that organises one-way traffic within the zone). The practical situation of road infrastructure related to the evacuation direction might also be important: if the number of access roads is limited (e.g. evacuation must be through a few bridges/tunnels), huge problems may be expected (many power stations are situated close to big rivers). An other important factor is the information whether the release already started or will start very shortly or whether there is still sufficient time to leave for everybody. Day-night plays not an important role in the emergency planning zone as compared to light traffic during the day: most of the people are familiar with the roads, making the time loss due to travelling in the dark similar to the time loss due to the light day time traffic. In case the option is chosen to decontaminate the vehicles leaving the emergency zone immediately, important delays might occur. Question E2 The comments to be given are similar as for question E1. A perturbing effect might be that a part of the evacuees doesn't know the way any longer, causing extra delay, especially at night time. Of course, the travel distances may be much longer (depending on the opening angle of the sector chosen and on the distance to the accident site). In case the option is chosen to decontaminate the vehicles leaving the emergency zone immediately , important delays might occur.
150

Case F Question F1 Very little data are available for real cases. Much depends on the information given, and especially also on the time between the pre-distribution of the tablets and the real need to take them in: if pre-distribution just occurred (and with adequate information given), virtually anybody having them available at home will take them; after several years, this number will certainly shrink. In case the tablets have to be collected at a pharmacy or equivalent, the number of people not owing them in time will presumably be much bigger, increasing the fraction of not responding. In case they still have to look for tablets and that the threat for iodine is really important, and considering one has to leave the house anyway, this scenario may give rise to spontaneous evacuation in many cases. Question F2 The time needed to find back the tablets will strongly depend on the time between distribution and the accident. If this happened only a few month ago, the time will be very short (minutes); if a long time ago: a fraction of people will need time to find the tablets back. Question F3 In case of distribution within a distribution centre (e.g. pharmacy), much depends on the density of distribution points, the information given, the fear for other consequences etc. It may be assumed that travel distances to and from the distribution point are fairly low, and that the number of people per distribution centre is limited; however it is believed that the distribution performed this way might take hours (poor weather conditions; rush hours; several hundreds of people having to address one distribution point; urban conditions).
151

Conditional Probabilities All conditional probabilities have been expressed within the interval (0,1), a value of 0.5 meaning uncorrelated effects. Having little expertise with conditional probabilities and the impact of scaling e.g. a Pr = 0.7 as compared to 0.8, some caution has to be foreseen for using the numbers absolutely. Related to case B1: General Emergency immediately
Nr Pr(X|Y) Comment 1 0.5 Usually other parties involved into both processes 2 0.9 Large overlap in partners and processes involved (decision making and
initial implementation). 3 0.8 Priority will be given to the 30 km zone; delays there will certainly
involve delays for the outside zone process; as other emergency services may be involved, the correlation is not 1, and presumably less as compared to question 2.
4 0.5 Analogous as question 1 5 0.9 Analogous (but inversely formulated) as compared to question 2 6 0.5 Other people/processes involved; presumably uncorrelated effects 7 0.8 Similar to question 3
Related to case B2: Site area emergency followed by General emergency Correlations are presumed to be very similar as in the case B2; same comments of application unless explicitly stated
Nr Pr(X|Y) Comment 8 0.5 Confidence in this case is even bigger as compared to 1 that the value
will be very close to 0.5 9 0.9 10 0.8 11 0.5 Confidence in this case is even bigger as compared to 4 that the value
will be very close to 0.5 12 0.9 13 0.5 14 0.8
Related to case C: Sheltering in few km - 30 km zone
Nr Pr(X|Y) Comment 15 0.8 A lack of organisation will certainly have an impact on both variables;
not 100 % correlation as different parties/technical tools may play a role 16 0.9 Not receiving a notification is presumably more strongly correlated to
the emergency organisation quality as compared to the previous question
17 0.95 Presumably a very strong correlation 18 0.7 Notification to shelter is less stringently coupled to the efficiency of
emergency organisation as compared to the evacuation preparation 19 0.9 Certainly a strong correlation, but not absolute as there may be fractions
of people hard to notify/convince 20 0.7 It is believed that there is only a limited correlation via the parameter
"confidence in the authorities and information"
152

21 0.7 Relatively strong positive correlation due to "confidence"; negative correlation due to the fact that people already evacuated in 3 hours belong to the group leaving in 8 hours; therefore fairly low value
22 0.7 Analogous comment as in previous question; a somewhat lower value might also be realistic.
23 0.7 Similar effect as compared to daytime 24 0.7 Similar effect as compared to daytime
Related to case D: evacuation in few km - 30 km zone
Nr Pr(X|Y) Comment 25 0.9 Similar to question 15; a somewhat stronger correlation however due to
an increase of spontaneous evacuations (not assumed to be included in the X in this question)
26 0.9 Strong correlation between organisation in general and notification, especially at larger distances
27 0.9 Presumably a strong correlation 28 0.8 Certainly a correlation, but the start-up and decision process are time
needed for the real implementation, reducing the value for Pr 29 0.8 Certainly a correlation, but not a very strict one due to special groups
(farmers, hospitals, industry etc.) yielding fractions hard to evacuate, and due to traffic problems that may exist at various moments
30 0.8 Presumably very similar to question 28 31 0.8 Analogous as compared to 29 32 0.8 identical to question 28 33 0.6 (or read as For the vast majority...)
Presumably a small correlation: difficulties related to spontaneous evacuation or by not following the rules might be common to difficulties in implementing a planned organisation (e.g. meteorological conditions etc.)
34 0.6 Some weak correlation (e.g. meteorological conditions) 35 1.0 Pr(X|X) = 1
Related to case E: Time periods to leave an evacuation area
Nr Pr(X|Y) Comment 36 0.7 Fairly poor correlation as initial organisation prior to sheltering is not
really related to time needed for evacuation; 37 0.75 Analogous comment as 36; slightly higher conditional probability
expected 37->38
0.8 See 37
38 0.95 Poor infrastructure yielding difficulties at low traffic densities will very probably yield even more problems at high traffic densities
39 0.95 Very strong correlation expected 40 0.6 Driving times and organisation times are very poorly correlated in this
case (some influence of bad traffic plan possible) 41 0.65 Analogous as 40, but presumably somewhat more important correlation
(e.g. due to problems with communication etc.) 42 0.7 See 41 43 0.95 Similar to 38; (identical probability expected; consequences certainly
153

multiplied by order of magnitude considering surface of zone) 44 0.95 Similar to 39 45 0.6 Organisation of notification and decision making only poorly correlated
to driving time 46 0.6 Similar to 45 47 0.8 Driving time is an important part of the time needed to leave for most of
the people involved 48 0.9 See 47, but more predominant 49 0.95 See 48, but more predominant 50 0.8 Correlation with notification time becomes more apparent as the degree
of preparation might be much less in zone B (outside all zones) 51 0.8 See 50; few difference between rural and agricultural in this case 52 0.8 See 51 53 0.7 Notification and decision time more important as compared to 47,
therefore smaller correlation 54 0.75 See 53 and 48 55 0.8 See 53 and 49
Related to case F: Stable Iodine Tablets
Nr Pr(X|Y) Comment 56 0.6 Notification time to shelter is very poorly correlated to the quality of
further information; there is some correlation as common partners/infrastructure might be involved for some groups of the population
57 0.9 Strong correlation via the quality of information past with the tablet pre-distribution and the lapse of time between this distribution and the actual accident
58 0.8 Possible effects: bad communication and/or loss of tablets; the communication is common for both X and Y; the other is not
59 0.8 The correlation between the message to shelter and the message to seek for iodine tablets is more apparent than the case of question 56
60 0.8 Correlation via the fact that a difficult procedure to obtain the tablets will both increase the fraction of people not doing the effort and the time needed for those making the effort anyhow
61 0.8 The majority belongs to the vast majority, so there must be some correlation; the fact that some special groups might cause important delays makes that the correlation is not very explicit
154

Responses Expert 7 (Zuur, The Netherlands) 7 exp 7 1 A1-day time UNI 5.000E+0000 3.000E+0001 9.000E+0001 7 exp 7 2 A1-night time UNI 5.000E+0000 1.500E+0001 6.000E+0001 7 exp 7 3 A1-weekend UNI 5.000E+0000 4.500E+0001 1.200E+0002 7 exp 7 4 A1-rush hours UNI 5.000E+0000 3.000E+0001 9.000E+0001 7 exp 7 5 B1-sh-epz-day UNI 1.500E+0001 4.500E+0001 9.000E+0001 7 exp 7 6 B1-sh-epz-nigh UNI 1.500E+0001 6.000E+0001 9.000E+0001 7 exp 7 7 B1-sh-epz-wen UNI 1.500E+0001 4.500E+0001 9.000E+0001 7 exp 7 8 B1-sh-epz-rush UNI 1.500E+0001 4.500E+0001 9.000E+0001 7 exp 7 9 B1-sh-<30-day UNI 1.500E+0001 6.000E+0001 1.200E+0002 7 exp 7 10 B1-sh-<30-nigh UNI 1.500E+0001 9.000E+0001 1.500E+0002 7 exp 7 11 B1-sh-<30-wend UNI 1.500E+0001 6.000E+0001 1.200E+0002 7 exp 7 12 B1-sh-<30-rush UNI 1.500E+0001 6.000E+0001 1.200E+0002 7 exp 7 13 B1-sh->30-day UNI 3.000E+0001 1.650E+0002 2.700E+0002 7 exp 7 14 B1-sh->30-nigh UNI 3.000E+0001 2.100E+0002 3.300E+0002 7 exp 7 15 B1-sh->30-wend UNI 3.000E+0001 2.100E+0002 3.300E+0002 7 exp 7 16 B1-sh->30-rush UNI 3.000E+0001 1.650E+0002 2.700E+0002 7 exp 7 17 B1-ie-epz-day UNI 1.500E+0001 4.500E+0001 9.000E+0001 7 exp 7 18 B1-ie-epz-nigh UNI 1.500E+0001 6.000E+0001 9.000E+0001 7 exp 7 19 B1-ie-epz-wend UNI 1.500E+0001 4.500E+0001 9.000E+0001 7 exp 7 20 B1-ie-epz-rush UNI 1.500E+0001 4.500E+0001 9.000E+0001 7 exp 7 21 B1-ie-<30-day UNI 1.500E+0001 4.500E+0001 1.200E+0002 7 exp 7 22 B1-ie-<30-nigh UNI 2.000E+0001 6.000E+0001 1.500E+0002 7 exp 7 23 B1-ie-<30-wend UNI 2.000E+0001 4.500E+0001 1.200E+0002 7 exp 7 24 B1-ie-<30-rush UNI 1.500E+0001 4.500E+0001 1.200E+0002 7 exp 7 25 B1-de-epz-day UNI 1.000E+0001 2.000E+0001 6.000E+0001 7 exp 7 26 B1-de-epz-nigh UNI 1.000E+0001 2.000E+0001 6.000E+0001 7 exp 7 27 B1-de-epz-wend UNI 1.000E+0001 2.000E+0001 6.000E+0001 7 exp 7 28 B1-de-epz-rush UNI 1.000E+0001 2.000E+0001 6.000E+0001 7 exp 7 29 B1-de-<30-day UNI 1.500E+0001 3.000E+0001 1.200E+0002 7 exp 7 30 B1-de-<30-nigh UNI 1.500E+0001 3.000E+0001 1.200E+0002 7 exp 7 31 B1-de-<30-wend UNI 1.500E+0001 3.000E+0001 1.200E+0002 7 exp 7 32 B1-de-<30-rush UNI 1.500E+0001 3.000E+0001 1.200E+0002 7 exp 7 33 B2-sh-epz-day UNI 1.500E+0001 3.000E+0001 6.000E+0001 7 exp 7 34 B2-sh-epz-nigh UNI 1.500E+0001 3.000E+0001 6.000E+0001 7 exp 7 35 B2-sh-epz-wend UNI 1.500E+0001 3.000E+0001 6.000E+0001 7 exp 7 36 B2-sh-epz-rush UNI 1.500E+0001 3.000E+0001 6.000E+0001 7 exp 7 37 B2-sh-<30-day UNI 3.000E+0001 4.500E+0001 9.000E+0001 7 exp 7 38 B2-sh-<30-nigh UNI 3.000E+0001 6.000E+0001 9.000E+0001 7 exp 7 39 B2-sh-<30-wend UNI 3.000E+0001 6.000E+0001 9.000E+0001 7 exp 7 40 B2-sh-<30-rush UNI 3.000E+0001 4.500E+0001 9.000E+0001 7 exp 7 41 B2-sh->30-day UNI 3.000E+0001 6.000E+0001 1.200E+0002 7 exp 7 42 B2-sh->30-nigh UNI 4.500E+0001 9.000E+0001 1.500E+0002 7 exp 7 43 B2-sh->30-wend UNI 3.000E+0001 6.000E+0001 1.200E+0002 7 exp 7 44 B2-sh->30-rush UNI 4.500E+0001 6.000E+0001 1.200E+0002 7 exp 7 45 B2-ie-epz-day UNI 1.500E+0001 3.000E+0001 6.000E+0001 7 exp 7 46 B2-ie-epz-nigh UNI 1.500E+0001 3.000E+0001 6.000E+0001 7 exp 7 47 B2-ie-epz-wend UNI 1.500E+0001 3.000E+0001 6.000E+0001 7 exp 7 48 B2-ie-epz-rush UNI 1.500E+0001 3.000E+0001 6.000E+0001 7 exp 7 49 B2-ie-<30-day UNI 3.000E+0001 6.000E+0001 1.200E+0002 7 exp 7 50 B2-ie-<30-nigh UNI 4.500E+0001 9.000E+0001 1.500E+0002 7 exp 7 51 B2-ie-<30-wend UNI 3.000E+0001 6.000E+0001 1.200E+0002 7 exp 7 52 B2-ie-<30-rush UNI 4.500E+0001 6.000E+0001 1.200E+0002 7 exp 7 53 B2-de-epz-day UNI 1.000E+0001 2.000E+0001 6.000E+0001 7 exp 7 54 B2-de-epz-nigh UNI 1.000E+0001 2.000E+0001 6.000E+0001 7 exp 7 55 B2-de-epz-wend UNI 1.000E+0001 2.000E+0001 6.000E+0001 7 exp 7 56 B2-de-epz-rush UNI 1.000E+0001 2.000E+0001 6.000E+0001 7 exp 7 57 B2-de-<30-day UNI 1.500E+0001 3.000E+0001 1.200E+0002 7 exp 7 58 B2-de-<30-nigh UNI 1.500E+0001 3.000E+0001 1.200E+0002 7 exp 7 59 B2-de-<30-wend UNI 1.500E+0001 3.000E+0001 1.200E+0002 7 exp 7 60 B2-de-<30-rush UNI 1.500E+0001 3.000E+0001 1.200E+0002 7 exp 7 61 C1-sh-not-igno UNI 2.000E+0000 1.000E+0001 2.000E+0001 7 exp 7 62 C1-sh-not-notr UNI 1.000E+0000 1.000E+0001 3.000E+0001 7 exp 7 63 C1-sh-not-spon UNI 1.000E+0000 5.000E+0000 5.000E+0001 7 exp 7 64 C2-sh-yes-maj UNI 1.000E+0000 1.000E+0001 1.500E+0001
155

7 exp 7 65 C2-sh-yes-vmaj UNI 1.000E+0000 1.500E+0001 3.000E+0001 7 exp 7 66 C3-sh-leave<3d UNI 1.000E-0001 5.000E+0000 1.000E+0001 7 exp 7 67 C3-sh-leave<8d UNI 1.000E+0000 1.000E+0001 3.000E+0001 7 exp 7 68 C3-sh-leave<12 UNI 5.000E+0000 2.000E+0001 5.000E+0001 7 exp 7 69 C3-sh-leave<3n UNI 1.000E-0001 1.000E+0000 5.000E+0000 7 exp 7 70 C3-sh-leave<8n UNI 1.000E+0000 1.000E+0001 2.000E+0001 7 exp 7 71 C3-sh-leave<24 UNI 1.000E+0001 3.000E+0001 6.000E+0001 7 exp 7 72 D1-ev-day-igno UNI 1.000E-0001 2.000E+0000 5.000E+0000 7 exp 7 73 D1-ev-day-notr UNI 1.000E-0001 5.000E+0000 1.000E+0001 7 exp 7 74 D1-ev-day-nfor UNI 1.000E-0001 5.000E+0000 1.000E+0001 7 exp 7 75 D1-ev-sch-igno UNI 1.000E-0001 1.000E+0000 2.000E+0000 7 exp 7 76 D1-ev-sch-nfor UNI 1.000E-0001 1.000E+0000 5.000E+0000 7 exp 7 77 D1-ev-swc-igno UNI 1.000E-0001 5.000E+0000 1.000E+0001 7 exp 7 78 D1-ev-swc-notr UNI 1.000E-0001 5.000E+0000 2.000E+0001 7 exp 7 79 D1-ev-swc-nfor UNI 1.000E-0001 2.000E+0000 5.000E+0000 7 exp 7 80 D2-ev-fo-wd-ma UNI 5.000E+0000 1.000E+0001 2.000E+0001 7 exp 7 81 D2-ev-fo-wd-vm UNI 1.000E+0001 1.500E+0001 3.000E+0001 7 exp 7 82 D2-ev-fo-wh-ma UNI 5.000E+0000 1.000E+0001 2.000E+0001 7 exp 7 83 D2-ev-fo-wh-vm UNI 1.000E+0001 1.500E+0001 3.000E+0001 7 exp 7 84 D3-ev-nf-wd-ma UNI 5.000E+0000 1.000E+0001 3.000E+0001 7 exp 7 85 D3-ev-nf-wd-vm UNI 1.000E+0001 1.500E+0001 4.500E+0001 7 exp 7 86 D3-ev-nf-wh-ma UNI 5.000E+0000 1.000E+0001 3.000E+0001 7 exp 7 87 D3-ev-nf-wh-vm UNI 1.000E+0001 1.500E+0001 4.500E+0001 7 exp 7 88 E1-epz-daylt-r UNI 1.000E+0001 1.500E+0001 4.000E+0001 7 exp 7 89 E1-epz-daylt-s UNI 1.000E+0001 2.000E+0001 5.000E+0001 7 exp 7 90 E1-epz-daylt-u UNI 1.500E+0001 3.000E+0001 6.000E+0001 7 exp 7 91 E1-epz-dayht-r UNI 1.000E+0001 1.500E+0001 6.000E+0001 7 exp 7 92 E1-epz-dayht-s UNI 1.500E+0001 2.000E+0001 8.000E+0001 7 exp 7 93 E1-epz-dayht-u UNI 2.000E+0001 3.000E+0001 1.200E+0002 7 exp 7 94 E1-epz-night-r UNI 1.000E+0001 1.500E+0001 4.000E+0001 7 exp 7 95 E1-epz-night-s UNI 1.000E+0001 2.000E+0001 5.000E+0001 7 exp 7 96 E1-epz-night-u UNI 1.500E+0001 3.000E+0001 6.000E+0001 7 exp 7 97 E2-<30-daylt-r UNI 2.000E+0001 3.000E+0001 8.000E+0001 7 exp 7 98 E2-<30-daylt-s UNI 2.500E+0001 3.500E+0001 1.000E+0002 7 exp 7 99 E2-<30-daylt-u UNI 3.000E+0001 4.000E+0001 1.200E+0002 7 exp 7 100 E2-<30-dayht-r UNI 2.000E+0001 3.000E+0001 1.200E+0002 7 exp 7 101 E2-<30-dayht-s UNI 2.500E+0001 4.500E+0001 1.500E+0002 7 exp 7 102 E2-<30-dayht-u UNI 3.000E+0001 6.000E+0001 1.800E+0002 7 exp 7 103 E2-<30-night-r UNI 2.000E+0001 3.000E+0001 8.000E+0001 7 exp 7 104 E2-<30-night-s UNI 2.500E+0001 3.500E+0001 1.000E+0002 7 exp 7 105 E2-<30-night-u UNI 3.000E+0001 4.000E+0001 1.200E+0002 7 exp 7 106 F1-iod-not-hom UNI 1.000E-0001 5.000E+0000 3.000E+0001 7 exp 7 107 F1-iod-not-dis UNI 1.000E+0000 1.000E+0001 5.000E+0001 7 exp 7 108 F2-iod-hom-maj UNI 2.000E+0000 5.000E+0000 3.000E+0001 7 exp 7 109 F2-iod-hom-vma UNI 5.000E+0000 1.000E+0001 4.500E+0001 7 exp 7 110 F3-iod-dis-maj UNI 1.000E+0001 2.000E+0001 6.000E+0001 7 exp 7 111 F3-iod-dis-vma UNI 1.500E+0001 3.000E+0001 1.200E+0002
156

Rationale Expert 7 (Zuur, The Netherlands) The questionnaire is answered based on estimates and experiences in the Netherlands. A few remarks are added: Case A To notify any authority means to notify the mayor or his/her representative. During the night and in the weekends the responsible persons are sometimes not readily available. Case B To notify means to reach them or to try to reach them. Sheltering takes place in a circle of 2 to 5 km around the power plant. Within 30 km is interpreted as larger than 5 km. The 95 percentiles might be high because people could be difficult to reach. A delay of 2 to 3 hours can be reasonable. particularly at larger distances from the power plant. Nights are including restaurants and discotheques and so on. Immediate evacuation is comparable to sheltering, but it might take somewhat more time. Delayed evacuation is taken without the time for sheltering. This takes place “after the cloud” whereby there is no need to hurry (no urgency anymore). For case B2 it is assumed that people are already aware of a potential offsite problem. In most cases the times of case B2 will be similar to those for case B1. Case C Sheltering means stay inside and keep windows and doors closed. Case E Organised transport by bus means walk to the bus (say 5 minutes), get into the bus (up to 10 minutes) and drive away (up to 30 minutes).In cases people go by car, the question is how fast you get into the car and drive out of the emergency planning zone (of 2 to 5 km). At night when quite, the average speed is 70 km per hour in rural areas, 50 km per hour in suburban areas and 10 km per hour in urban areas. Urban areas mean real cities with shopping malls and so on. Case F Not taking tablets at home also includes having lost the tablets. This explains the high 95 percentile value. For distribution centres this may lead to a rush with people queuing. Dependencies There must be some dependence since the mayor is the principle decision maker in the whole process.
157

Responses Expert 8 (Robischon, Germany) 8 exp 8 1 A1-day time UNI 3.000E+0000 4.000E+0000 5.000E+0000 8 exp 8 2 A1-night time UNI 5.000E+0000 1.000E+0001 1.500E+0001 8 exp 8 3 A1-weekend UNI 5.000E+0000 1.500E+0001 3.000E+0001 8 exp 8 4 A1-rush hours UNI 5.000E+0000 1.500E+0001 3.000E+0001 8 exp 8 5 B1-sh-epz-day UNI 4.000E+0001 6.000E+0001 7.000E+0001 8 exp 8 6 B1-sh-epz-nigh UNI 8.000E+0001 9.000E+0001 1.000E+0002 8 exp 8 7 B1-sh-epz-wen UNI 8.000E+0001 9.000E+0001 1.000E+0002 8 exp 8 8 B1-sh-epz-rush UNI 1.300E+0002 1.500E+0002 1.700E+0002 8 exp 8 9 B1-sh-<30-day UNI 4.000E+0001 6.000E+0001 7.000E+0001 8 exp 8 10 B1-sh-<30-nigh UNI 8.000E+0001 9.000E+0001 1.000E+0002 8 exp 8 11 B1-sh-<30-wend UNI 8.000E+0001 9.000E+0001 1.000E+0002 8 exp 8 12 B1-sh-<30-rush UNI 1.300E+0002 1.500E+0002 1.700E+0002 8 exp 8 13 B1-sh->30-day UNI 4.000E+0001 6.000E+0001 7.000E+0001 8 exp 8 14 B1-sh->30-nigh UNI 8.000E+0001 9.000E+0001 1.000E+0002 8 exp 8 15 B1-sh->30-wend UNI 8.000E+0001 9.000E+0001 1.000E+0002 8 exp 8 16 B1-sh->30-rush UNI 1.300E+0002 1.500E+0002 1.700E+0002 8 exp 8 17 B1-ie-epz-day UNI 1.800E+0002 3.000E+0002 3.600E+0002 8 exp 8 18 B1-ie-epz-nigh UNI 3.000E+0002 4.200E+0002 5.400E+0002 8 exp 8 19 B1-ie-epz-wend UNI 3.000E+0002 4.200E+0002 5.400E+0002 8 exp 8 20 B1-ie-epz-rush UNI -9.996E+0002 -9.996E+0002 -9.996E+0002 8 exp 8 21 B1-ie-<30-day UNI -9.996E+0002 -9.996E+0002 -9.996E+0002 8 exp 8 22 B1-ie-<30-nigh UNI -9.996E+0002 -9.996E+0002 -9.996E+0002 8 exp 8 23 B1-ie-<30-wend UNI -9.996E+0002 -9.996E+0002 -9.996E+0002 8 exp 8 24 B1-ie-<30-rush UNI -9.996E+0002 -9.996E+0002 -9.996E+0002 8 exp 8 25 B1-de-epz-day UNI 3.000E+0001 6.000E+0001 9.000E+0001 8 exp 8 26 B1-de-epz-nigh UNI 3.000E+0001 6.000E+0001 9.000E+0001 8 exp 8 27 B1-de-epz-wend UNI 3.000E+0001 6.000E+0001 9.000E+0001 8 exp 8 28 B1-de-epz-rush UNI -9.996E+0002 -9.996E+0002 -9.996E+0002 8 exp 8 29 B1-de-<30-day UNI -9.996E+0002 -9.996E+0002 -9.996E+0002 8 exp 8 30 B1-de-<30-nigh UNI -9.996E+0002 -9.996E+0002 -9.996E+0002 8 exp 8 31 B1-de-<30-wend UNI -9.996E+0002 -9.996E+0002 -9.996E+0002 8 exp 8 32 B1-de-<30-rush UNI -9.996E+0002 -9.996E+0002 -9.996E+0002 8 exp 8 33 B2-sh-epz-day UNI 1.500E+0001 2.000E+0001 3.000E+0001 8 exp 8 34 B2-sh-epz-nigh UNI 1.500E+0001 2.000E+0001 3.000E+0001 8 exp 8 35 B2-sh-epz-wend UNI 1.500E+0001 2.000E+0001 3.000E+0001 8 exp 8 36 B2-sh-epz-rush UNI 1.050E+0002 1.200E+0002 1.350E+0002 8 exp 8 37 B2-sh-<30-day UNI 1.500E+0001 2.000E+0001 3.000E+0001 8 exp 8 38 B2-sh-<30-nigh UNI 1.500E+0001 2.000E+0001 3.000E+0001 8 exp 8 39 B2-sh-<30-wend UNI 1.500E+0001 2.000E+0001 3.000E+0001 8 exp 8 40 B2-sh-<30-rush UNI 1.050E+0002 1.200E+0002 1.350E+0002 8 exp 8 41 B2-sh->30-day UNI 1.500E+0001 2.000E+0001 3.000E+0001 8 exp 8 42 B2-sh->30-nigh UNI 1.500E+0001 2.000E+0001 3.000E+0001 8 exp 8 43 B2-sh->30-wend UNI 1.500E+0001 2.000E+0001 3.000E+0001 8 exp 8 44 B2-sh->30-rush UNI 1.050E+0002 1.200E+0002 1.350E+0002 8 exp 8 45 B2-ie-epz-day UNI 3.000E+0001 6.000E+0001 9.000E+0001 8 exp 8 46 B2-ie-epz-nigh UNI 3.000E+0001 6.000E+0001 9.000E+0001 8 exp 8 47 B2-ie-epz-wend UNI 3.000E+0001 6.000E+0001 9.000E+0001 8 exp 8 48 B2-ie-epz-rush UNI -9.996E+0002 -9.996E+0002 -9.996E+0002 8 exp 8 49 B2-ie-<30-day UNI -9.996E+0002 -9.996E+0002 -9.996E+0002 8 exp 8 50 B2-ie-<30-nigh UNI -9.996E+0002 -9.996E+0002 -9.996E+0002 8 exp 8 51 B2-ie-<30-wend UNI -9.996E+0002 -9.996E+0002 -9.996E+0002 8 exp 8 52 B2-ie-<30-rush UNI -9.996E+0002 -9.996E+0002 -9.996E+0002 8 exp 8 53 B2-de-epz-day UNI 3.000E+0001 6.000E+0001 9.000E+0001 8 exp 8 54 B2-de-epz-nigh UNI 3.000E+0001 6.000E+0001 9.000E+0001 8 exp 8 55 B2-de-epz-wend UNI 3.000E+0001 6.000E+0001 9.000E+0001 8 exp 8 56 B2-de-epz-rush UNI -9.996E+0002 -9.996E+0002 -9.996E+0002 8 exp 8 57 B2-de-<30-day UNI -9.996E+0002 -9.996E+0002 -9.996E+0002 8 exp 8 58 B2-de-<30-nigh UNI -9.996E+0002 -9.996E+0002 -9.996E+0002 8 exp 8 59 B2-de-<30-wend UNI -9.996E+0002 -9.996E+0002 -9.996E+0002 8 exp 8 60 B2-de-<30-rush UNI -9.996E+0002 -9.996E+0002 -9.996E+0002 8 exp 8 61 C1-sh-not-igno UNI 5.000E+0000 1.000E+0001 1.500E+0001 8 exp 8 62 C1-sh-not-notr UNI 2.000E+0000 4.000E+0000 5.000E+0000 8 exp 8 63 C1-sh-not-spon UNI 1.000E+0001 2.000E+0001 3.000E+0001 8 exp 8 64 C2-sh-yes-maj UNI 1.500E+0001 2.000E+0001 3.000E+0001
158

8 exp 8 65 C2-sh-yes-vmaj UNI 2.000E+0001 3.000E+0001 6.000E+0001 8 exp 8 66 C3-sh-leave<3d UNI 5.000E+0000 8.000E+0000 1.000E+0001 8 exp 8 67 C3-sh-leave<8d UNI 8.000E+0000 1.000E+0001 1.500E+0001 8 exp 8 68 C3-sh-leave<12 UNI 1.500E+0001 2.000E+0001 2.500E+0001 8 exp 8 69 C3-sh-leave<3n UNI 3.000E+0000 4.000E+0000 5.000E+0000 8 exp 8 70 C3-sh-leave<8n UNI 5.000E+0000 8.000E+0000 1.000E+0001 8 exp 8 71 C3-sh-leave<24 UNI 2.000E+0001 2.500E+0001 3.000E+0001 8 exp 8 72 D1-ev-day-igno UNI 5.000E+0000 1.000E+0001 1.500E+0001 8 exp 8 73 D1-ev-day-notr UNI 2.000E+0000 4.000E+0000 5.000E+0000 8 exp 8 74 D1-ev-day-nfor UNI 1.000E+0001 1.500E+0001 2.000E+0001 8 exp 8 75 D1-ev-sch-igno UNI 1.000E-0002 2.000E-0002 3.000E-0002 8 exp 8 76 D1-ev-sch-nfor UNI 5.000E+0000 8.000E+0000 1.000E+0001 8 exp 8 77 D1-ev-swc-igno UNI 5.000E+0000 1.500E+0001 2.000E+0001 8 exp 8 78 D1-ev-swc-notr UNI 2.000E+0000 4.000E+0000 5.000E+0000 8 exp 8 79 D1-ev-swc-nfor UNI 1.000E+0001 1.500E+0001 2.000E+0001 8 exp 8 80 D2-ev-fo-wd-ma UNI 3.000E+0001 6.000E+0001 9.000E+0001 8 exp 8 81 D2-ev-fo-wd-vm UNI 6.000E+0001 9.000E+0001 1.200E+0002 8 exp 8 82 D2-ev-fo-wh-ma UNI 3.000E+0001 6.000E+0001 9.000E+0001 8 exp 8 83 D2-ev-fo-wh-vm UNI 6.000E+0001 9.000E+0001 1.200E+0002 8 exp 8 84 D3-ev-nf-wd-ma UNI 3.000E+0001 6.000E+0001 9.000E+0001 8 exp 8 85 D3-ev-nf-wd-vm UNI 6.000E+0001 9.000E+0001 1.200E+0002 8 exp 8 86 D3-ev-nf-wh-ma UNI 3.000E+0001 6.000E+0001 9.000E+0001 8 exp 8 87 D3-ev-nf-wh-vm UNI 6.000E+0001 9.000E+0001 1.200E+0002 8 exp 8 88 E1-epz-daylt-r UNI -9.996E+0002 -9.996E+0002 -9.996E+0002 8 exp 8 89 E1-epz-daylt-s UNI -9.996E+0002 -9.996E+0002 -9.996E+0002 8 exp 8 90 E1-epz-daylt-u UNI -9.996E+0002 -9.996E+0002 -9.996E+0002 8 exp 8 91 E1-epz-dayht-r UNI -9.996E+0002 -9.996E+0002 -9.996E+0002 8 exp 8 92 E1-epz-dayht-s UNI -9.996E+0002 -9.996E+0002 -9.996E+0002 8 exp 8 93 E1-epz-dayht-u UNI -9.996E+0002 -9.996E+0002 -9.996E+0002 8 exp 8 94 E1-epz-night-r UNI -9.996E+0002 -9.996E+0002 -9.996E+0002 8 exp 8 95 E1-epz-night-s UNI -9.996E+0002 -9.996E+0002 -9.996E+0002 8 exp 8 96 E1-epz-night-u UNI -9.996E+0002 -9.996E+0002 -9.996E+0002 8 exp 8 97 E2-<30-daylt-r UNI -9.996E+0002 -9.996E+0002 -9.996E+0002 8 exp 8 98 E2-<30-daylt-s UNI -9.996E+0002 -9.996E+0002 -9.996E+0002 8 exp 8 99 E2-<30-daylt-u UNI -9.996E+0002 -9.996E+0002 -9.996E+0002 8 exp 8 100 E2-<30-dayht-r UNI -9.996E+0002 -9.996E+0002 -9.996E+0002 8 exp 8 101 E2-<30-dayht-s UNI -9.996E+0002 -9.996E+0002 -9.996E+0002 8 exp 8 102 E2-<30-dayht-u UNI -9.996E+0002 -9.996E+0002 -9.996E+0002 8 exp 8 103 E2-<30-night-r UNI -9.996E+0002 -9.996E+0002 -9.996E+0002 8 exp 8 104 E2-<30-night-s UNI -9.996E+0002 -9.996E+0002 -9.996E+0002 8 exp 8 105 E2-<30-night-u UNI -9.996E+0002 -9.996E+0002 -9.996E+0002 8 exp 8 106 F1-iod-not-hom UNI 8.500E+0001 9.000E+0001 9.500E+0001 8 exp 8 107 F1-iod-not-dis UNI 3.000E+0000 4.000E+0000 5.000E+0000 8 exp 8 108 F2-iod-hom-maj UNI 1.000E+0001 1.500E+0001 2.000E+0001 8 exp 8 109 F2-iod-hom-vma UNI 1.500E+0001 2.000E+0001 3.000E+0001 8 exp 8 110 F3-iod-dis-maj UNI 4.000E+0001 4.500E+0001 6.000E+0001 8 exp 8 111 F3-iod-dis-vma UNI 4.500E+0001 5.000E+0001 9.000E+0001
159

Rationale Expert 8 (Robischon, Germany) This rationale provides additional background information for the uncertainty assessments made in the countermeasures questionnaire dated 23 October 1998. Case A Case A relates to a telephone conversation between KKW (nuclear power plant) and KatS-authorities (emergency planning authorities). That takes only a few minutes. On a daily basis, a responsible person or his deputy are always available at very short notice. During the night he must be awakened by phone. In the weekend it may take a while (up to half an hour), until the responsible person or his deputy are found. With the extension of mobile phones this time span will become shorter. Rush hours do not play any role in this question (just contacts by telephone). The time for the phone calls – in which the situation must be explained to not fully experienced responsible persons – probably takes longer, instead to get them on the phone. From this moment onwards the time is taken until the crisis staff has come together, who can take further measures. For this the following time spans are required: during the day time up to 30 minutes, and during the night and in the weekends up to 60 minutes. Case B1 Ad a) For sheltering I understand that the crisis staff comes together, keeps its first discussions and draws its first conclusions (of which the duration in time depends on the competence of the chairman). This will take up to 30 minutes. They then notify the decision to “shelter” through the normal broadcasting (radio and TV) systems and the message is broadcast: duration 10 to 20 minutes. The information provided to the people outside the usual emergency planning zone does not require much longer time periods, because the message is broadcast via radio and TV. More than 30 km is not included in the emergency planning. Ad b) For immediate evacuation without sheltering first For this measure additional to the crisis staff’s decision to shelter, alarming (follows immediately after the get together of the crisis staff, according to the plans) of the emergency services (police, Red Cross, fire brigade and so on), informing the bus companies (the buses and the bus drivers must be available), informing the road services (to keep the roads free: signs, traffic light regulation), informing of hospitals, kindergartens and schools and old people’s homes, institutions for disabled persons, jails, and so on (they need to provide transport means for the personnel to assist the people), informing about hospital admittance capacities and so on is needed. The required time up to the point of informing the people to be evacuated depends strongly on the dimensions of the area to be evacuated. The evacuation of areas with villages without special institutions proceeds much faster then in cases of urban areas with high population densities and lots of infrastructure. For the questions I consider the former KatS-Plan KKW Mühlheim-Kärlich and the estimates, which we made in the earlier days for that reason – as far as I can recall now. Ad c) For delayed evacuation after a period of sheltering first In this case the time to shelter will be used for preparing the contingent evacuation. When the sheltering stops informed emergency services people, bus drivers and buses can come
160

together, such that up till the time to inform the people only a relatively short period of time is required. Case B2 In this case the population is already warned, the preparations of all situations are already in a final state – the only thing which is left over is the execution of it. For sheltering, it only takes the message via radio and TV. For delayed evacuation, it is a similar situation as evacuation after sheltering. Case C1 In the answers only very vague guesses are possible. As the results are not directly observable the attitude of the people depends very much on how of present interest the discussions on nuclear energy are going on at that moment of time. The number of people who are notified to stay indoors that will not be reached should be very small and decreases with increasing likelihood. Case C2 In this case a lot depends on the way the KatS-authorities formulate their notification. It takes much time if people start driving home first. It goes fast, if offices, shops, companies and so on keep their windows and doors closed and shut off the ventilation systems. And if public institutions take in people passing by. A lot of time is in any case required for those who first seek relatives. Case C3 In this case my assumptions are close to wild guesses and therefore the results would be scientifically non serious. Case D1 Evacuation within the area outside the emergency planning zone was not foreseen in our plan for KKW Mühlheim-Kärlich. “Organised evacuation” would have been hardly possible regarding the dimensions of the area. It would have been a tremendous improvisation. A sufficient fast and effective evacuation would have been only possible for those who could move themselves with their own cars. In schools the school head decides on what is to be done. Moreover teachers are civil servants, who are per se law-abiding. In these cases nobody will ignore the notification (responsibility lies with the school!). It is however possible that teachers are pedant and suggest apparently more secure routes. Bad weather has no influence on the information (via radio), but it has influence on the decision to execute. Case D2 Most time will be used to get families together. The second most time will be used for the decision making, which belongings one has to (or will) take with them including the time to pack things. In these cases I am not able to make a distinction between working days and weekends. The time required for getting the family together during day times, will be required for the return from leisure activities in the weekends (for instance, exchanging bathing suits against tooth brushes and family documents).
161

Case D3 This case is comparable to case D2. Case E1 For these questions it is impossible to provide generic estimates. The required time periods do not only depend on the population densities, but above all also on the traffic infrastructure and topographical circumstances. Take for instance the Koblenz-Neuwieder basin: the basin is intersected by the rivers Rhine, Mosel and Lahn. Available are three bridges across the Rhine, two bridges across the Mosel and one bridge across the Lahn. The Eifel, Hunsrück, Taunus and Westerwald surround the basin as natural barriers, which tremendously influence the traffic infrastructure and can hold up the traffic flow. The required times for an evacuation presumably differ strongly. This depends on which side of the Rhine or Mosel one is at that very moment. Case E2 In this case the same is true as stated under Case E1. Regarding only the KKW Mühlheim-Kärlich we have remarkably less densely populated areas – the topographical situation is however not different. With respect to the traffic infrastructure the motorways A61 and A3 relieve an evacuation – provided you have reached the motorways. For a better use we have foreseen in traffic measures near Cologne and Mainz, that is over 100 km north and south of Koblenz. Case F1 The stable iodine tablets which were distributed among the population will in the largest part of the KatS-case not be found back anymore. For that reason people will not take the tablets. Case F2 In this case I assume that people are at home. The time will be used to search for the tablets, possibly to read the tablets’ information, to ask questions to a docter, pharmacist or friend and to decide, and finally to swallow the tablets. Case F3 The KatS-Plan KKW Mühlheim-Kärlich foresaw the distribution of stable iodine tablets at election localities. One can imagine the situation, that a similar number of people who has time for a whole day on an election day, will now rush very likely at about the same moment to get the tablets at once. One can easily understand that there will be waiting times for the distribution of the tablets. The routes to and from the distribution centres are in any case short and do not require much time.
162

Responses Expert 9 (Weiss and Probst, Germany) 9 exp 9 1 A1-day time UNI 3.000E+0001 6.000E+0001 1.800E+0002 9 exp 9 2 A1-night time UNI 3.000E+0001 4.500E+0001 1.200E+0002 9 exp 9 3 A1-weekend UNI 3.000E+0001 9.000E+0001 1.200E+0002 9 exp 9 4 A1-rush hours UNI 3.000E+0001 6.000E+0001 1.800E+0002 9 exp 9 5 B1-sh-epz-day UNI 1.500E+0002 2.400E+0002 3.600E+0002 9 exp 9 6 B1-sh-epz-nigh UNI 1.200E+0002 1.800E+0002 2.400E+0002 9 exp 9 7 B1-sh-epz-wen UNI 1.800E+0002 3.000E+0002 3.600E+0002 9 exp 9 8 B1-sh-epz-rush UNI 1.500E+0002 2.400E+0002 3.600E+0002 9 exp 9 9 B1-sh-<30-day UNI 1.500E+0002 2.400E+0002 3.600E+0002 9 exp 9 10 B1-sh-<30-nigh UNI 1.800E+0002 3.000E+0002 3.600E+0002 9 exp 9 11 B1-sh-<30-wend UNI 1.800E+0002 3.000E+0002 3.600E+0002 9 exp 9 12 B1-sh-<30-rush UNI 1.500E+0002 2.400E+0002 3.600E+0002 9 exp 9 13 B1-sh->30-day UNI 1.500E+0002 2.400E+0002 3.600E+0002 9 exp 9 14 B1-sh->30-nigh UNI 1.800E+0002 3.000E+0002 3.600E+0002 9 exp 9 15 B1-sh->30-wend UNI 1.800E+0002 3.000E+0002 3.600E+0002 9 exp 9 16 B1-sh->30-rush UNI 1.500E+0002 2.400E+0002 3.600E+0002 9 exp 9 17 B1-ie-epz-day UNI 2.400E+0002 4.200E+0002 6.000E+0002 9 exp 9 18 B1-ie-epz-nigh UNI 3.000E+0002 5.400E+0002 7.800E+0002 9 exp 9 19 B1-ie-epz-wend UNI 3.000E+0002 5.400E+0002 7.800E+0002 9 exp 9 20 B1-ie-epz-rush UNI 2.400E+0002 4.200E+0002 6.000E+0002 9 exp 9 21 B1-ie-<30-day UNI 3.000E+0002 6.000E+0002 9.600E+0002 9 exp 9 22 B1-ie-<30-nigh UNI 4.200E+0002 7.200E+0002 1.200E+0003 9 exp 9 23 B1-ie-<30-wend UNI 4.200E+0002 7.200E+0002 1.200E+0003 9 exp 9 24 B1-ie-<30-rush UNI 3.000E+0002 6.000E+0002 9.600E+0002 9 exp 9 25 B1-de-epz-day UNI 1.500E+0002 2.400E+0002 3.600E+0002 9 exp 9 26 B1-de-epz-nigh UNI 1.200E+0002 1.800E+0002 2.400E+0002 9 exp 9 27 B1-de-epz-wend UNI 1.800E+0002 3.000E+0002 3.600E+0002 9 exp 9 28 B1-de-epz-rush UNI 1.500E+0002 2.400E+0002 3.600E+0002 9 exp 9 29 B1-de-<30-day UNI 1.500E+0002 2.400E+0002 3.600E+0002 9 exp 9 30 B1-de-<30-nigh UNI 1.200E+0002 1.800E+0002 2.400E+0002 9 exp 9 31 B1-de-<30-wend UNI 1.800E+0002 3.000E+0002 3.600E+0002 9 exp 9 32 B1-de-<30-rush UNI 1.500E+0002 2.400E+0002 3.600E+0002 9 exp 9 33 B2-sh-epz-day UNI 4.500E+0001 1.200E+0002 1.800E+0002 9 exp 9 34 B2-sh-epz-nigh UNI 4.500E+0001 1.200E+0002 1.800E+0002 9 exp 9 35 B2-sh-epz-wend UNI 4.500E+0001 1.200E+0002 1.800E+0002 9 exp 9 36 B2-sh-epz-rush UNI 4.500E+0001 1.200E+0002 1.800E+0002 9 exp 9 37 B2-sh-<30-day UNI 9.000E+0001 1.800E+0002 2.400E+0002 9 exp 9 38 B2-sh-<30-nigh UNI 9.000E+0001 1.800E+0002 2.400E+0002 9 exp 9 39 B2-sh-<30-wend UNI 9.000E+0001 1.800E+0002 2.400E+0002 9 exp 9 40 B2-sh-<30-rush UNI 9.000E+0001 1.800E+0002 2.400E+0002 9 exp 9 41 B2-sh->30-day UNI 9.000E+0001 1.800E+0002 2.400E+0002 9 exp 9 42 B2-sh->30-nigh UNI 9.000E+0001 1.800E+0002 2.400E+0002 9 exp 9 43 B2-sh->30-wend UNI 9.000E+0001 1.800E+0002 2.400E+0002 9 exp 9 44 B2-sh->30-rush UNI 9.000E+0001 1.800E+0002 2.400E+0002 9 exp 9 45 B2-ie-epz-day UNI 9.000E+0001 1.800E+0002 3.000E+0002 9 exp 9 46 B2-ie-epz-nigh UNI 9.000E+0001 1.800E+0002 3.000E+0002 9 exp 9 47 B2-ie-epz-wend UNI 9.000E+0001 1.800E+0002 3.000E+0002 9 exp 9 48 B2-ie-epz-rush UNI 9.000E+0001 1.800E+0002 3.000E+0002 9 exp 9 49 B2-ie-<30-day UNI 3.000E+0002 4.200E+0002 9.600E+0002 9 exp 9 50 B2-ie-<30-nigh UNI 4.200E+0002 6.000E+0002 1.200E+0003 9 exp 9 51 B2-ie-<30-wend UNI 4.200E+0002 6.000E+0002 1.200E+0003 9 exp 9 52 B2-ie-<30-rush UNI 3.000E+0002 4.200E+0002 9.600E+0002 9 exp 9 53 B2-de-epz-day UNI 4.500E+0001 1.200E+0002 1.800E+0002 9 exp 9 54 B2-de-epz-nigh UNI 4.500E+0001 1.200E+0002 1.800E+0002 9 exp 9 55 B2-de-epz-wend UNI 4.500E+0001 1.200E+0002 1.800E+0002 9 exp 9 56 B2-de-epz-rush UNI 4.500E+0001 1.200E+0002 1.800E+0002 9 exp 9 57 B2-de-<30-day UNI 1.800E+0002 3.000E+0002 3.600E+0002 9 exp 9 58 B2-de-<30-nigh UNI 1.800E+0002 3.000E+0002 3.600E+0002 9 exp 9 59 B2-de-<30-wend UNI 1.800E+0002 3.000E+0002 3.600E+0002 9 exp 9 60 B2-de-<30-rush UNI 1.800E+0002 3.000E+0002 3.600E+0002 9 exp 9 61 C1-sh-not-igno UNI 1.000E+0000 5.000E+0000 7.000E+0000 9 exp 9 62 C1-sh-not-notr UNI 3.000E+0000 1.500E+0001 3.000E+0001 9 exp 9 63 C1-sh-not-spon UNI 3.500E+0001 5.000E+0001 8.500E+0001 9 exp 9 64 C2-sh-yes-maj UNI 1.500E+0001 6.000E+0001 1.200E+0002
163

9 exp 9 65 C2-sh-yes-vmaj UNI 3.000E+0001 1.800E+0002 3.000E+0002 9 exp 9 66 C3-sh-leave<3d UNI 2.000E+0000 5.000E+0000 8.000E+0000 9 exp 9 67 C3-sh-leave<8d UNI 1.000E+0001 2.500E+0001 4.000E+0001 9 exp 9 68 C3-sh-leave<12 UNI 3.500E+0001 5.000E+0001 7.500E+0001 9 exp 9 69 C3-sh-leave<3n UNI 2.000E+0000 5.000E+0000 8.000E+0000 9 exp 9 70 C3-sh-leave<8n UNI 5.000E+0000 1.000E+0001 1.500E+0001 9 exp 9 71 C3-sh-leave<24 UNI 3.500E+0001 5.000E+0001 7.500E+0001 9 exp 9 72 D1-ev-day-igno UNI 1.000E+0000 3.000E+0000 5.000E+0000 9 exp 9 73 D1-ev-day-notr UNI 3.000E+0000 1.500E+0001 3.000E+0001 9 exp 9 74 D1-ev-day-nfor UNI 5.000E+0001 6.500E+0001 9.000E+0001 9 exp 9 75 D1-ev-sch-igno UNI 1.000E+0000 3.000E+0000 5.000E+0000 9 exp 9 76 D1-ev-sch-nfor UNI 5.000E+0000 1.500E+0001 3.000E+0001 9 exp 9 77 D1-ev-swc-igno UNI 1.000E+0000 3.000E+0000 5.000E+0000 9 exp 9 78 D1-ev-swc-notr UNI 3.000E+0000 1.500E+0001 3.000E+0001 9 exp 9 79 D1-ev-swc-nfor UNI 2.500E+0001 4.000E+0001 6.000E+0001 9 exp 9 80 D2-ev-fo-wd-ma UNI 9.000E+0001 1.800E+0002 3.600E+0002 9 exp 9 81 D2-ev-fo-wd-vm UNI 1.800E+0002 3.300E+0002 6.000E+0002 9 exp 9 82 D2-ev-fo-wh-ma UNI 6.000E+0001 1.200E+0002 3.000E+0002 9 exp 9 83 D2-ev-fo-wh-vm UNI 1.200E+0002 2.700E+0002 4.800E+0002 9 exp 9 84 D3-ev-nf-wd-ma UNI 1.200E+0002 2.100E+0002 3.900E+0002 9 exp 9 85 D3-ev-nf-wd-vm UNI 2.100E+0002 3.600E+0002 6.300E+0002 9 exp 9 86 D3-ev-nf-wh-ma UNI 9.000E+0001 1.500E+0002 3.000E+0002 9 exp 9 87 D3-ev-nf-wh-vm UNI 1.500E+0002 3.000E+0002 5.100E+0002 9 exp 9 88 E1-epz-daylt-r UNI 2.000E+0001 6.000E+0001 1.200E+0002 9 exp 9 89 E1-epz-daylt-s UNI -9.996E+0002 -9.996E+0002 -9.996E+0002 9 exp 9 90 E1-epz-daylt-u UNI -9.996E+0002 -9.996E+0002 -9.996E+0002 9 exp 9 91 E1-epz-dayht-r UNI 4.000E+0001 9.000E+0001 1.200E+0002 9 exp 9 92 E1-epz-dayht-s UNI -9.996E+0002 -9.996E+0002 -9.996E+0002 9 exp 9 93 E1-epz-dayht-u UNI -9.996E+0002 -9.996E+0002 -9.996E+0002 9 exp 9 94 E1-epz-night-r UNI 2.000E+0001 6.000E+0001 1.200E+0002 9 exp 9 95 E1-epz-night-s UNI -9.996E+0002 -9.996E+0002 -9.996E+0002 9 exp 9 96 E1-epz-night-u UNI -9.996E+0002 -9.996E+0002 -9.996E+0002 9 exp 9 97 E2-<30-daylt-r UNI 2.000E+0001 3.000E+0001 6.000E+0001 9 exp 9 98 E2-<30-daylt-s UNI -9.996E+0002 -9.996E+0002 -9.996E+0002 9 exp 9 99 E2-<30-daylt-u UNI -9.996E+0002 -9.996E+0002 -9.996E+0002 9 exp 9 100 E2-<30-dayht-r UNI 4.500E+0001 6.000E+0001 1.200E+0002 9 exp 9 101 E2-<30-dayht-s UNI -9.996E+0002 -9.996E+0002 -9.996E+0002 9 exp 9 102 E2-<30-dayht-u UNI -9.996E+0002 -9.996E+0002 -9.996E+0002 9 exp 9 103 E2-<30-night-r UNI 2.000E+0001 3.000E+0001 1.200E+0002 9 exp 9 104 E2-<30-night-s UNI -9.996E+0002 -9.996E+0002 -9.996E+0002 9 exp 9 105 E2-<30-night-u UNI -9.996E+0002 -9.996E+0002 -9.996E+0002 9 exp 9 106 F1-iod-not-hom UNI 2.000E-0001 1.000E+0000 2.000E+0000 9 exp 9 107 F1-iod-not-dis UNI 2.000E-0001 1.000E+0000 2.000E+0000 9 exp 9 108 F2-iod-hom-maj UNI 2.000E+0001 6.000E+0001 3.000E+0002 9 exp 9 109 F2-iod-hom-vma UNI 6.000E+0001 1.500E+0002 6.000E+0002 9 exp 9 110 F3-iod-dis-maj UNI 9.000E+0001 1.800E+0002 6.000E+0002 9 exp 9 111 F3-iod-dis-vma UNI 1.800E+0002 3.600E+0002 1.200E+0003
164

Rationale Expert 9 (Weiss and Probst, Germany) This rationale contains the conditions which determine the answers to the countermeasures questionnaire, as outlined by the County government (Regierungspräsidium) of Freiburg and the Radiation Protection Agency (Bundesamt für Strahlenschutz): The questions are answered for the German area surrounding the French nuclear power plant Fessenheim. The French nuclear power plant Fessenheim is located on the borders of the river Rhine, which is the joint border between Germany and France. There are two Pressurised Water Reactors with a thermal power of 900 Megawatt each. Both reactors are operable for about 20 years. As a result of the location of the Bourgundy Gate (Burgundische Pforte) the winds prevail from the south-west. The German area surrounding the power plant Fessenheim is mostly of a rural nature. Parallel to the Rhine runs the A 5 motorway and the north-south train connection with Switzerland. Medium sized industry, partly high-tech industry, partly also with hazardous products or raw materials, are located in the area. In the emergency planning zone for evacuations (see below) there are 6 communities located with approximately 14000 inhabitants in total. The largest residential area ever to evacuate has about 2000 inhabitants. The German region gets its electricity from the Fessenheim power plant. A hard core of anti-nuclear opponents raises quite often their voices against the Fessenheim power plant, which plant is in their eyes exceptionally sensitive to disturbances. That is the reason why also in other ways indifferent parts of the population are impressed by the statements on the Fessenheim power plant. This danger is also present in the subconscience of the population. It is however not recognisable that the population or also the communities surrounding Fessenheim take own efforts for protective measures. Based on this situation we assume that in case of an emergency situation the directions given by the authorities will be easily followed. The County government (Regierungspräsidium) of Freiburg is responsible for the emergency planning in the vicinity of the Fessenheim power plant, which means that it organises the available plans with respect to identification and estimation of the radiological situation in case of an emergency, and the realisation of countermeasures for the population (stable iodine tablets, sheltering, closing off of potentially contaminated areas, evacuations, health measures, decontamination measures and so on) and it executes the necessary planning actions. The directly contaminated areas and the communities are obliged to follow the decisions made by the County government and have to make own plans next to the emergency plans of the County government of Freiburg and have to prepare these measures. Counties at larger distances have to prepare for taking in the population, starting the emergency planning stations, starting to get families together again and so on, and to execute these measures in case of an emergency. The emergency planning concept of the County government of Freiburg is based, like everywhere in Germany, on the considerations for emergency planning in the vicinity of
165

nuclear power plants (Rahmenempfehlungen für Katastrophenschutz in der Umgebung kerntechnischer Anlagen: issued in 1989 by the Federal Ministry for the Environment, Nature Preservation and Reactor Safety). This means for the Fessenheim power plant concrete planning of the evacuation in half a circle of 8 km, and planning of other countermeasures mentioned above in half a circle of 10 km around the power plant have to be prepared. In the area between 10 and 25 km (in all cases in the questionnaire where a 30 km zone is mentioned, we have considered only a 25 km zone in the answers) only the warning of the communities, public places and civilians have to be prepared and monitoring and measuring (stationary or mobile) have to be prepared and organised. All authorities and public services of the Country Baden-Württemberg in the area of the County government of Freiburg, but also private persons and unions are obliged to support the emergency planning authorities in case of an emergency. Moreover, we can also rely on other country authorities outside the region of the County government and on federal authorities and institutions such as the federal army. The emergency planning in Baden-Württemberg is organised very effectively. Thousands of assistants are available in so-called dedicated services (fire brigade, health services, welfare services, ABC-services, technical assistance services). Their effectiveness is rated mediocre to good.This also includes ABC-groups and decontamination groups. For the identification of radioactivity in the vicinity of the Fessenheim power plant we have at our disposal 13 fixed inland installations for measuring radioactivity (gamma-dose measurements), of which the data are continuously transmitted on-line to the County government of Freiburg, as well as 12 radiation identification groups, who do the collection and transport of samples next to measurements. The first information and the following information on an accident in the Fessenheim power plant reach us as fast as the French authorities based on agreements. As much as possible bilingual forms are used. Otherwise the language problem would be difficult to circumvent in cases of an emergency. Finally, some remarks must be made: • Momentarily there is no ready siren net available within the relevant area. This will be
built. The warning of and information to the population is still to be done by local warning facilities, radio, television, internet homepage and so on.
• There are no public shelters, which entails that only horizontal evacuation is possible. • In the 10 km zone surrounding the power plant stable iodine tablets are distributed to the
communities and special institutions like schools, large companies, people of services. The problem in an emergency case as a result of that is known to us.
166

167

APPENDIX D
Short biographies of the experts on early emergency actions Thierry Bouffort, France Mr. Bouffort graduated from the Bordeaux Institute of Technology, in Safety and Hygiene, in 1973. He has had extensive and comprehensive formal training in several technical fields, and especially he has a degree as specialist in Radiological Incident Response. As a District Civil Servant Mr. Bouffort is a professional firefighter. His first posts were as Fire Officer at Orléans for 10 years. Later he became District Fire Chief in different Préfectures, namely in Guéret for 3 years and in Auxerre for more than 8 years. He is currently working in the Nuclear Emergency Support Team (MARN), within the Department of Civil Safety of the French Ministry of Interior. The MARN is in charge of upgrading national and local emergency response in view of protecting people, property and the environment, should a nuclear accident occur. Christer Calmtorp, Sweden Mr. Calmtorp graduated in mechanical engineering at TG1 in Stockholm in 1968 followed by postgraduate studies in, for instance, economics and later on three years of graphical design. His first post in the nuclear field (1978-1986) was with the Swedish Nuclear Power Training Centre (KSU), first assigned in the training department and the last four years as part of the management group. Since 1986 he works as an independent consultant in his own company (PCI Information AB). Major assigners for consultancy work are the Swedish nuclear power plants, the Swedish Nuclear Power Inspectorate, Swedish Telecom, IBM and other companies. In the past five years Mr. Calmtorp participated in several source term assessment and emergency preparedness projects, mainly with the Swedish Nuclear Power Inspectorate as assigner. Frank Hardeman, Belgium Mr. Hardeman graduated in Physics at the Catholic University of Leuven, Belgium, in 1983, and finished his Ph.D. in Physics at the same university in 1989. He also has a post-graduate in Nuclear Engineering (1993), did the highest level in safety studies at Diepenbeek Postuniversity Centre (1996) and did various courses in Radiological Protection. His first position was as scientific worker at the Interuniversity Institute for Nuclear Sciences at the University of Leuven. His current position is with the Belgian Nuclear Research Centre SCK-CEN at Mol, Belgium. Mr. Hardeman designed the on-site emergency plan of SCK-CEN, is advisor of the Belgian authorities on nuclear emergency situations, and has been in charge of the laboratory of nuclear spectrometry until the end of 1999. Since 1991 he was also teaching on radiological protection issues, and was project leader for various ongoing projects on nuclear emergency situations. At present, he is the head of the Department of Decision Strategy Research, dealing with items related to policy support and decision making in a broad sense: emergency preparedness and consequence assessment, radiological surveillance, the introduction of social sciences etc.
168

Ken L Jones, UK Mr. Jones graduated at the University of Sheffield in Urban Studies and in Business Administration in 1986 with a distinction in engineering. His first posts were with British Steel in Sheffield, after which he joined the Sheffield and Rotherham Constabulary – now South Yorkshire Police. Mr. Jones worked both in uniform and CID and was promoted to sergeant, detective chief inspector and superintendent respectively. In the meantime, he was also seconded to the Independent Commission Against Corruption in Hong Kong. In 1995 he was awarded a prestigious Fulbright Scholarship jointly funded by the UK and US governments to promote co-operation and understanding between the two countries. In January 1998 Mr. Jones joined the Avon and Somerset Constabulary as Assistant Chief Constable (ACC). He is head of Operational Support which covers a broad spectrum of roles and responsibilities. As ACC he is responsible for the execution of emergency plans in the event of disasters (like nuclear power plant accidents). He is a member of the British Institute of Directors and the Institute of Management, and is currently project director of the National Custody Project. Lindsay G Murray, UK Mr. Murray graduated in Applied Biology at the Glasgow Caledonian University in 1981 and received a postgraduate certificate in Professional Studies (Major Incident Command and Control) at Cambridge in 1989. His first posts were with Forth Valley Health Board (Central Scotland), Emergent Pathogen Research Unit (University of Witwatersrand, South Africa), Nuffield Laboratory of Comparative Medicine (Zoological Society of London, UK), Department of Veterinary Medicine (University of Bristol, UK), and the AFRC Institute for Research on Animal Diseases (Compton, UK). Since 1985 he has been employed by Cumbria County Council’s Emergency Planning Unit, now as Chief Emergency Planning Officer, during which time his team have prepared and developed off-site nuclear emergency plans for BNFL Sellafield and the nuclear submarine constructor VSEL, as well as plans for nuclear transport contingencies and overseas disasters (Cumbria remains tangibly affected by the 1986 Chernobyl disaster); these plans have been widely sought for study, particularly by nuclear host countries in Eastern Europe and Asia. He has been involved in the planning, execution and evaluation of numerous nuclear exercises in the UK and overseas. He is, in addition, Radiation Protection Advisor to Cumbria County Council’s Public Protection Committee, a Corresponding Advisor to the UK’s Local Government Association on nuclear matters, Chairman of the UK Emergency Planning Society’s Nuclear Subgroup and a member of the UK Government-led Nuclear Emergency Planning Liaison Group. Since publication, he has returned to medical research. Michael Probst, Germany Mr. Probst graduated in Law and Political sciences in Innsbruck (Austria) and Freiburg im Breisgau (Germany) in 1974. His first job was with the County Services (Landesdienst) of Baden-Württemberg and was for several years active with questions concerning building law, community law, water law, and environmental and immission protection, after which he became leader of the areas of fire protection , emergency planning and civil defence for the government (Regierungspräsidium) at Freiburg in
169

Südbaden in 1989. His task contains above all the emergency planning for the German area in the vicinity of the foreign nuclear power plants in Switzerland and France located close to the German border. Part of his emergency planning task are the development of plans, education to third parties as well as the preparation, execution and monitoring of emergency exercises in relation to the nuclear power plants. Among other things, he is member of the Working group on “Emergency planning (Notfallschutz)” of the German-Swiss and German-French committees for safety related questions of nuclear power installations. Fritz Robischon, Germany Mr. Robischon is retired Government vice president. He graduated in Law and Philosophy. He was administrative judge at a county court in the Eifel region in Germany, in scientific service of the parliament (Landtag) of Rheinland-Pfalz. He was personal advisor of the mayor of the city of Mainz. He was leader of the building department of the city of Mainz and conducted himself the Town Hall of Mainz. He switched jobs to the State Government (Staatskanzlei) in Rheinland-Pfalz with the function of Government vice president (Regierungsvizepräsident) of Koblenz, which he did for over 25 years. (Koblenz is a region with the City of Koblenz and 10 counties, in total 1.5 million inhabitants). He was head of department 1 in the region government of Koblenz, which has several specific tasks, among which fire protection and emergency planning. Therefore Mr. Robischon’s task was the organisation of the emergency planning of the nuclear power plant Mühlheim-Kärlich located at the gates of Koblenz. He developed, together with his colleagues Mann and Czepkowski a well-considered and progressive emergency plan, which was an example for plans of other nuclear power plants. He performed numerous emergency exercises. He also presented many lectures, also on Workshops with the theme “Management of crisis by public administrations” emphasising the problem of trust in authorities. Currently he lives as a small farmer in a remote forest house in the Eifel area. Kari Sinkko, Finland Mr. Sinkko graduated in Physics at the University of Helsinki in 1975. Since 1975 he is employed by the Finnish Radiation and Nuclear Safety Authority (STUK) in Helsinki, as a senior research scientist since 1985. In the period 1991-1993 he was also employed as a nuclear safety inspector. His current position is project leader at STUK. Mr. Sinkko is involved in the development of the computer-based gamma-spectrometric analysis, and in research on the radiological consequences in Finland caused by nuclear test explosions and accidental releases of radionuclides. He is also involved in research and development of protective actions for intervention situations, and in the application and development of decision support systems for radiological emergency management. He is co-ordinator of two of the programme’s within the RODOS on-line emergency management computer system project of the European Communities. Wolfgang Weiss, Germany Dr. Weiss graduated in Physics at the University of Heidelberg (Germany) in 1975. His first jobs were assistant professor at the University of Heidelberg, and researcher at the Woods Hole Oceanographic Institution (USA). Currently he is Head of the Institute for Atmospheric
170

Radioactivity of the German Federal Office for Radiation Protection in Freiburg (Germany). His fields of interest are radiation protection in emergency situations, environmental monitoring, development of models for the prediction of atmospheric transport and dose assessment, and development of information and decision support systems for emergency preparedness. Mr. Weiss’ responsibilities are the establishment and operation of the German IMIS system, and the establishment and operation of the IRIS systems in the Czech and Slovak Republics, the Russian Federation and Poland. He is member of committees of the national advisory board on radiation protection and of the German Ministries for Environment, Nature Conservation, and Reactor Safety (BMU) and for Interior (BMI). He is also consultant to the EU, IAEA and OECD/NEA in the field of emergency preparedness. Ciska Zuur, the Netherlands Ciska Zuur is a Medical doctor, specialised in social medicine. Later on, she followed the highest radiation protection courses in the Netherlands and worked for 5 years in a radiobiological institute and for the Dutch Heath Council. In December 1985 (just before the Chernobyl accident), she joined the ministry of Environment as radiation protection expert, especially co-ordinating the norms, the modelling and international aspects. She was directly involved and proposed the interventions in the Netherlands after the Chernobyl accident. Moreover she set the intervention levels in the Emergency plans as they were developed after Chernobyl. Since 1987 she is a member of the Expert Group ex Article 31 of the Euratom treaty to advise the European Commission about all aspects dealing with the protection of persons against ionising radiation and since 1993 she is a member of the ICRP (the first term in commission 3 and the second and coming third term in commission 4)
171

APPENDIX E
Aggregated results of expert responses
For the responses the codes are: A1 through to F3 refers to cases A to F and the various subquestions sh/ie/de/ev/iod means sheltering/immediate evacuation/delayed evacuation after a period of sheltering first/evacuation/stable iodine tablets epz/<30/>30 means emergency planning zone/zone outside emergency planning zone, but within 30 km of site/zone outside 30 km of site day/nigh/wen/rush means day time/night time/weekends/rush hours not/yes (in C1) means not responding/do shelter igno/notr/spon (in C1) means ignoring the notification/not having received the notification/spontaneous evacuation (in cases people are notified to shelter) maj/vmaj means majority of people (68%)/vast majority of people (95%) day/sch/swc (in D1) means day time/at schools/under severe weather conditions igno/notr/nfor (in D1) means ignoring the notification/not having received the notification/evacuation, but following the order (in cases people are notified to evacuate) fo/nf means following the order to evacuate/not following the order to evacuate wd/wh means working days/weekends and holidays ma/vm means majority of people (68%)/vast majority of people (95%) daylt/dayht/night (in E1) means day time with light traffic/day time with heavy traffic/night time r/s/u means rural area/suburban area/urban area not/hom/dis (in F) means not responding/taking tablets at home/taking tablets at distribution facility For the dependencies: The numbers in the first row correspond to the numbers of the dependencies questions in Appendix B
172

Case name : COUNTERM 11.12.00 CLASS version 3.1 Resulting solution (combined DM distribution of values assessed by experts) Bayesian updates : no. Weights : equal. DM optimisation : no. Calibration power : 1.0 Item name º Quantiles of solution Scale º 5 % º 50 % º 95 % º 1 A1-day time º 3.120936º 21.831881º 1.287E+0002º U 2 A1-night time º 3.733333º 23.894318º 1.007E+0002º U 3 A1-weekend º 3.636364º 29.497219º 1.114E+0002º U 4 A1-rush hours º 3.733333º 27.869942º 1.296E+0002º U 5 B1-sh-epz-day º 8.133971º 67.134331º 2.933E+0002º U 6 B1-sh-epz-nighº 10.512473º 83.679367º 3.218E+0002º U 7 B1-sh-epz-wen º 8.203753º 85.71106 º 4.131E+0002º U 8 B1-sh-epz-rushº 8.21605 º 93.909363º 2.995E+0002º U 9 B1-sh-<30-day º 8.13181 º 76.193466º 3.839E+0002º U 10 B1-sh-<30-nighº 10.625366º 1.252E+0002º 6.222E+0002º U 11 B1-sh-<30-wendº 8.188134º 1.119E+0002º 5.311E+0002º U 12 B1-sh-<30-rushº 8.201893º 1.416E+0002º 4.301E+0002º U 13 B1-sh->30-day º 7.685739º 89.728119º 3.926E+0002º U 14 B1-sh->30-nighº 10.259194º 1.972E+0002º 6.317E+0002º U 15 B1-sh->30-wendº 7.796448º 1.965E+0002º 5.337E+0002º U 16 B1-sh->30-rushº 7.824168º 1.595E+0002º 4.365E+0002º U 17 B1-ie-epz-day º 16.771399º 85.67395 º 5.059E+0002º U 18 B1-ie-epz-nighº 20.533882º 1.097E+0002º 6.588E+0002º U 19 B1-ie-epz-wendº 17.537796º 1.097E+0002º 6.588E+0002º U 20 B1-ie-epz-rushº 17.117069º 82.79747 º 5.167E+0002º U 21 B1-ie-<30-day º 16.481882º 3.298E+0002º 2.339E+0003º U 22 B1-ie-<30-nighº 23.237247º 4.436E+0002º 2.352E+0003º U 23 B1-ie-<30-wendº 19.303986º 4.481E+0002º 2.361E+0003º U 24 B1-ie-<30-rushº 18.03266 º 3.494E+0002º 2.340E+0003º U 25 B1-de-epz-day º 12.859384º 51.95512 º 2.993E+0002º U 26 B1-de-epz-nighº 13.050399º 57.254002º 2.877E+0002º U 27 B1-de-epz-wendº 12.958735º 56.570187º 3.589E+0002º U 28 B1-de-epz-rushº 12.939424º 54.656986º 3.054E+0002º U 29 B1-de-<30-day º 16.42898 º 76.8339 º 3.455E+0002º U 30 B1-de-<30-nighº 17.815994º 95.034302º 5.726E+0002º U 31 B1-de-<30-wendº 16.538689º 95.727448º 4.548E+0002º U 32 B1-de-<30-rushº 16.560511º 94.380287º 4.076E+0002º U 33 B2-sh-epz-day º 5.462963º 27.615343º 1.623E+0002º U 34 B2-sh-epz-nighº 7.564895º 28.611858º 2.614E+0002º U 35 B2-sh-epz-wendº 5.474227º 31.775225º 3.456E+0002º U 36 B2-sh-epz-rushº 5.346562º 46.122177º 1.941E+0002º U 37 B2-sh-<30-day º 5.803279º 91.546692º 2.067E+0003º U 38 B2-sh-<30-nighº 8.135516º 97.289299º 2.071E+0003º U 39 B2-sh-<30-wendº 5.806509º 93.271835º 2.069E+0003º U 40 B2-sh-<30-rushº 5.809665º 1.310E+0002º 2.144E+0003º U 41 B2-sh->30-day º 5.96253 º 1.266E+0002º 2.850E+0003º U 42 B2-sh->30-nighº 8.516423º 1.448E+0002º 2.858E+0003º U 43 B2-sh->30-wendº 6.001461º 1.406E+0002º 2.854E+0003º U 44 B2-sh->30-rushº 6.17952 º 1.534E+0002º 2.856E+0003º U 45 B2-ie-epz-day º 12.307153º 44.447422º 2.451E+0002º U 46 B2-ie-epz-nighº 15.420561º 56.417957º 3.276E+0002º U 47 B2-ie-epz-wendº 12.580646º 56.394814º 3.039E+0002º U 48 B2-ie-epz-rushº 12.056041º 54.666039º 2.602E+0002º U 49 B2-ie-<30-day º 13.911123º 3.114E+0002º 2.335E+0003º U 50 B2-ie-<30-nighº 19.809849º 4.327E+0002º 2.345E+0003º U 51 B2-ie-<30-wendº 13.93842 º 4.357E+0002º 2.350E+0003º U 52 B2-ie-<30-rushº 14.070353º 3.130E+0002º 2.336E+0003º U 53 B2-de-epz-day º 11.578666º 48.75211 º 5.564E+0002º U
173

54 B2-de-epz-nighº 12.820721º 60.985828º 5.573E+0002º U 55 B2-de-epz-wendº 11.780747º 61.082249º 5.580E+0002º U 56 B2-de-epz-rushº 11.462778º 66.888306º 5.669E+0002º U 57 B2-de-<30-day º 13.350994º 1.810E+0002º 1.163E+0003º U 58 B2-de-<30-nighº 17.086615º 1.924E+0002º 2.211E+0003º U 59 B2-de-<30-wendº 13.401016º 1.909E+0002º 2.208E+0003º U 60 B2-de-<30-rushº 13.397129º 2.121E+0002º 2.208E+0003º U 61 C1-sh-not-ignoº 0.694974º 6.656422º 48.544762º U 62 C1-sh-not-notrº 0.182796º 9.121773º 49.980827º U 63 C1-sh-not-sponº 2.741203º 21.210108º 77.718849º U 64 C2-sh-yes-maj º 2.68559 º 24.468239º 1.241E+0002º U 65 C2-sh-yes-vmajº 4.782275º 47.213097º 2.394E+0002º U 66 C3-sh-leave<3dº 0.843918º 7.302419º 24.864813º U 67 C3-sh-leave<8dº 2.0369 º 15.847651º 44.237808º U 68 C3-sh-leave<12º 4.695996º 28.279615º 70.964233º U 69 C3-sh-leave<3nº 0.353866º 3.629699º 18.049183º U 70 C3-sh-leave<8nº 1.232877º 10.026261º 25.842129º U 71 C3-sh-leave<24º 8.670898º 31.187185º 79.407555º U 72 D1-ev-day-ignoº 0.584854º 4.685358º 15.5341 º U 73 D1-ev-day-notrº 1.181672º 6.770718º 49.114685º U 74 D1-ev-day-nforº 0.359286º 9.833379º 75.06958 º U 75 D1-ev-sch-ignoº 0.012994º 0.993045º 7.485579º U 76 D1-ev-sch-nforº 0.016632º 3.081264º 22.109093º U 77 D1-ev-swc-ignoº 1.093677º 5.823384º 20.835535º U 78 D1-ev-swc-notrº 1.69258 º 11.316189º 52.706871º U 79 D1-ev-swc-nforº 0.336535º 6.813725º 53.378857º U 80 D2-ev-fo-wd-maº 6.142662º 50.444859º 2.868E+0002º U 81 D2-ev-fo-wd-vmº 12.901447º 80.11718 º 4.759E+0002º U 82 D2-ev-fo-wh-maº 6.135315º 50.265427º 3.379E+0002º U 83 D2-ev-fo-wh-vmº 11.929825º 80.033592º 5.845E+0002º U 84 D3-ev-nf-wd-maº 4.92172 º 20.001055º 3.003E+0002º U 85 D3-ev-nf-wd-vmº 9.378641º 38.314003º 4.968E+0002º U 86 D3-ev-nf-wh-maº 4.916299º 19.987976º 2.293E+0002º U 87 D3-ev-nf-wh-vmº 8.321039º 38.261551º 4.108E+0002º U 88 E1-epz-daylt-rº 6.058394º 25.526043º 1.265E+0002º U 89 E1-epz-daylt-sº 6.235344º 27.339407º 1.071E+0002º U 90 E1-epz-daylt-uº 6.31579 º 43.460732º 1.401E+0002º U 91 E1-epz-dayht-rº 6.677419º 31.690767º 1.598E+0002º U 92 E1-epz-dayht-sº 7.105263º 48.142906º 1.955E+0002º U 93 E1-epz-dayht-uº 6.961327º 92.507126º 2.606E+0002º U 94 E1-epz-night-rº 6.16 º 26.776659º 1.258E+0002º U 95 E1-epz-night-sº 6.331169º 28.361433º 65.922058º U 96 E1-epz-night-uº 6.3 º 43.301067º 1.274E+0002º U 97 E2-<30-daylt-rº 12.531647º 37.011688º 1.535E+0002º U 98 E2-<30-daylt-sº 15.335464º 56.369137º 2.178E+0002º U 99 E2-<30-daylt-uº 15.961869º 86.691803º 2.345E+0002º U 100 E2-<30-dayht-rº 13.623854º 52.471897º 2.499E+0002º U 101 E2-<30-dayht-sº 16.661846º 99.585861º 3.456E+0002º U 102 E2-<30-dayht-uº 16.836832º 1.452E+0002º 4.089E+0002º U 103 E2-<30-night-rº 12.857144º 39.667778º 1.561E+0002º U 104 E2-<30-night-sº 15.396953º 63.220226º 2.254E+0002º U 105 E2-<30-night-uº 15.961869º 91.035118º 3.272E+0002º U 106 F1-iod-not-homº 0.459095º 7.415235º 91.34938 º U 107 F1-iod-not-disº 0.008844º 4.772743º 58.772884º U 108 F2-iod-hom-majº 2.239502º 11.401772º 1.864E+0002º U 109 F2-iod-hom-vmaº 3.949247º 24.998558º 5.130E+0002º U 110 F3-iod-dis-majº 11.563534º 47.809029º 3.968E+0002º U 111 F3-iod-dis-vmaº 12.972973º 69.721809º 7.859E+0002º U ___________________________________________________________________________ (c) 1993 TU Delft, SoLogic.
174

ITEM EXP1 EXP2 EXP3 EXP4 EXP5 EXP6 EXP7 AVERAGE
1 0.5 0.5 0.5 0.514 0.5 0.5 0.6 0.5162 0.5 0.5 0.5 0.5 0.1 0.9 0.7 0.5293 0.5 0.7 0.5 0.5 0.8 0.6 0.64 0.5 0.2 0.5 0.55 0.5 0.6 0.4755 0.5 0.8 0.5 0.55 0.9 0.6 0.6426 0.5 0.15 0.5 0.525 0.5 0.5 0.5 0.4547 0.5 0.6 0.5 0.525 0.1 0.8 0.55 0.5118 0.5 0.1 0.5 0.54 0.5 0.5 0.6 0.4639 0.5 0.2 0.5 0.55 0.1 0.9 0.7 0.49310 0.5 0.3 0.5 0.5 0.8 0.6 0.53311 0.5 0.5 0.5 0.525 0.5 0.6 0.52112 0.5 0.6 0.5 0.525 0.9 0.6 0.60413 0.5 0.1 0.5 0.5025 0.5 0.5 0.6 0.51714 0.5 0.5 0.5 0.5025 0.1 0.8 0.55 0.49615 0.5 0.1 0.5 0.55 0.8 0.7 0.52516 0.5 0.8 0.5 0.55 0.9 0.7 0.65817 0.5 0.5 0.875 0.6 0.5 0.95 0.6 0.64618 0.5 0.4 0.5 0.5625 0.2 0.7 0.5 0.4819 0.5 0.6 0.5 0.525 0.9 0.8 0.63820 0.5 0.7 0.5 0.525 0.8 0.7 0.8 0.64621 0.5 0.8 0.5 0.55 0.5 0.7 0.8 0.62122 0.5 0.3 0.5 0.6 0.5 0.7 0.7 0.54323 0.5 0.1 0.5 0.6 0.5 0.7 0.55 0.49324 0.5 0.5 0.5 0.6 0.5 0.7 0.55 0.5525 0.5 0.3 0.125 0.525 0.9 0.4 0.45826 0.5 0.55 0.5 0.5025 0.9 0.2 0.52527 0.5 0.2 0.875 0.525 0.9 0.4 0.56728 0.5 0.4 0.5 0.525 0.8 0.6 0.55429 0.5 0.3 0.5 0.525 0.9 0.8 0.8 0.61830 0.5 0.6 0.5 0.9 0.8 0.7 0.66731 0.5 0.35 0.5 0.9 0.8 0.8 0.64232 0.5 0.6 0.5 0.55 0.8 0.8 0.7 0.63633 0.5 0.3 0.5 0.6 0.95 0.5734 0.5 0.4 0.5 0.6 0.55 0.5135 0.5 0.35 0.5 1 0.9 0.6536 0.5 0.5 0.5 0.525 0.8 0.7 0.8 0.6537 0.5 0.6 0.5 0.525 0.8 0.75 0.5 0.59638 0.5 0.2 0.5 0.525 0.8 0.95 0.5 0.56839 0.5 0.3 0.5 0.525 0.3 0.95 0.6 0.52540 0.5 0.4 0.5 0.525 0.8 0.6 0.6 0.56141 0.5 0.6 0.5 0.5025 0.9 0.65 0.7 0.62242 0.5 0.35 0.5 0.5 0.9 0.7 0.55 0.57143 0.5 0.1 0.5 0.5 0.1 0.95 0.55 0.45744 0.5 0.5 0.5 0.5 0.8 0.95 0.55 0.61445 0.5 0.6 0.5 0.5 0.1 0.6 0.95 0.53646 0.5 0.4 0.5 0.5 0.1 0.6 0.6 0.39356 0.5 0.35 0.5 0.54 0.5 0.6 0.5 0.49957 0.5 0.5 0.5 0.54 0.9 0.7 0.60758 0.5 0.5 0.875 0.5625 0.5 0.8 0.7 0.63459 0.5 0.2 0.5 0.625 0.8 0.8 0.5 0.56160 0.5 0.7 0.875 0.514 0.8 0.8 0.6 0.68461 0.5 0.5 0.875 0.55 0.9 0.8 0.7 0.689
175

176