pro-poor growth: definition, measurement and policy issues
TRANSCRIPT

Munich Personal RePEc Archive
Pro-Poor Growth: Definition,
Measurement and Policy Issues
Jmurova, Aliona
University of Salerno
21 March 2017
Online at https://mpra.ub.uni-muenchen.de/85397/
MPRA Paper No. 85397, posted 22 Mar 2018 17:23 UTC

Pro-Poor Growth: Definition, Measurement and Policy Issues
Aliona Jmurova
Department of Economics and Statistics, University of Salerno, [email protected]
Abstract
The pro-poor growth concept came up in the economic literature recently and in
the last decade a lot of researches have been dedicated to this study from many
important international institutions and organizations. However, there are still
disagreements on how we should intend the pro-poor growth and what kind of
policies shall be implemented for it. Describing theoretical and analytical aspects
of pro-poor growth, this paper represents a contribution to this literature and
tries, in the end, to emphasize policy issues to obtain pro-poor growth.
Keywords: poverty, pro-poor growth, measurement.
JEL: I32, I38, H59.
1. Introduction
Poverty is an everlasting topic which has attracted the interest of the most
important international observers, as well as ending poverty became an
international priority since it is recognized to be an essential tool for sustainable
growth. Over the past decades, the world has registered enormous economic
growth driven by globalization and rapid technological progress. This sustained
period of strong economic growth over time has allowed most of countries around
the world to lift millions of people out of extreme poverty. However, this
phenomenon has not prevented the total reduction of poverty because the benefits

of strong economic growth have not been evenly distributed and high levels of
income inequality have risen further. In fact, what is supposed to be a main cause
of poverty around the world is the inequality in the distribution of both income
and non-income factors; in this sense, it is observed that the rising inequality is
not an inevitable consequence of the growth process.
This consequence has lead the main international organizations to focus
on the following target: taking into account the links between growth, poverty and
inequality on promoting development economic in support of the most in need.
Pressing forward in this direction means implementing so called “pro-poor
growth” intended as promoting growth through lower inequality by favouring
poor individuals.
In this way, also the main two goals of Sustainable Development Agenda
(SDGs)1, build on the success of the Millennium Development Goals (MDGs) and
adopted by world leaders in United Nations (UN) in September 2015, are oriented
as following: (i) end extreme poverty globally and (ii) promote shared prosperity
in every country in a sustainable way. Following this target, the pro-poor growth
has been identified as the main ingredient, or rather the significant policy measure,
to achieve these goals and so, contribute to the significant reduction in poverty all
over the world.
However, there are still different debates about how we can define a
significant reduction in poverty and which is the way to establish about how much
successful countries are in succeeding in pro-poor growth. In addition, even the
policy implications for pro-poor growth are lees clear in this context (Klasen S.,
2001). In order to head towards these issues, the main questions are emerged: first
of all, what exactly is intended for pro-poor growth and how it can be measured?
1 The Agenda is composed by 17 Goals addressed to all countries (poor, rich and middle-income) in the aim of planet protection through the prosperity promotion. Three core elements have been emphasized in order to achieve the sustainable development: economic growth, social inclusion and environmental protection. These elements are interconnected and all are crucial for the global welfare.

At last, what kind of policies should be implemented by different countries to
achieve pro-poor growth goal?
In order to give answers to the questions, this paper provides a contribution
to the literature of pro-poor growth and it is divided as following: Section 2
provides different definitions of the concept and the linkages between poverty,
growth and inequality as the main ingredients of it; Section 3 analyses the main
measurements of pro-poor growth in the recent literature; and finally, Section 4
gives a general overview about policies issues existing for the implementation of
pro-poor growth.
2. Pro-poor growth: definition and measurement
The pro-poor growth concept has been evidenced as “the main ingredient
to achieve sustainable poverty (e.g. UN, 2000 and World Bank, 2000) or, in other
words, as growth that leads to significant reduction in poverty (OECD, 2006 and
UN, 2000)” [Lopez J. H., 2004]. The main implementation, thus, is that growth
must be to the benefit of the poor and give them more access to economic
opportunities (e.g. UN, 2000; OECD, 2001). According to this implementation,
two wide definitions (strict and general) of pro-poor growth have been emerged:
i) growth is pro-poor when is followed by decreasing in inequality (Kakwani and
Pernia, 2000); ii) growth is pro-poor when it simply reduces poverty (Ravallion,
2004).
The first, strict definition, defines pro-poor growth such as the one that
reduces inequalities in incomes. This definition has been called also as a strong
definition and leads that poverty is reduced when the rate of income growth of the
poor exceeds the rate of income growth of the non-poor. Instead, the second
definition, regarded to as a weak definition, is much more general where the pro-
poorness of growth depends on how much a chosen measure of poverty changes.
Ravallion and Chen (2003), for example, measure pro-poor growth as the mean
growth rate of income of the poor. Thus, “growth will always be pro-poor except
when the incomes of the poor are stagnant or decline leading to an increase in the
poverty measure” (Cord L., Lopez J. H., and Page J., 2003).
Both definitions, therefore, have some limitations. The first definition,
based more on rapid income growth for the poor, run the risk of ignoring economic
performance of the non-poor and overlooking their welfare. Following this
pattern, the extremal effect in a period of fast economic growth will be that the
rate of income growth of the poor will exceed the rate of income growth of the
non-poor, but this is going against the objective of maximizing the overall social
welfare. On the other hand, the second definition run the risk of losing focus on
what happens to the income and well-being of poor individuals because it focuses
only on the poverty rate and not on the inequality as well; in other words, a period
of a great economic growth will correspond to the general reduction of poverty
rate, but it won’t say how much the poor effectively will benefit from the
advantages of growth. Following similar pattern with no matter of how much the
gains of poor are growing, might be ineffective for an international target such as
Sustainable Development Goal.
A similar effect compared to this latest pattern is called “trickle-down
effect which implies a vertical flow of economic gain from the rich to the poor
through the spending and consumption of the first. This implies that the poor will
benefit of economic growth only indirectly and proportionally less than rich.
(Kakwani N. and Pernia M., 2000)2. In this trend, the policies were “pro-growth”
rather than “pro-poor” which anyway led to overall poverty reduction, but
ultimately this process of growth was accompanied by rising inequality in income.
In this context, making observation only from the weak definition point of view,
the level of poverty rate will be reduced as a result of overall economic growth;
2 For example, China’s very rapid growth and dramatic poverty reduction during the 1980s and 1990s was not pro-poor because the poor gained relatively less than the non-poor. This phenomenon was due to the increasing difference between rural and urban income, caused exactly by internal migration from rural to urban areas.

but looking at the level of inequality of incomes (strong definition), the reduction
in poverty will be weak or non-existent for such a “trickle-down” effect (Pasha H.
A., 2002). This shows how it is highly important to take into consideration
simultaneously the relationship between growth, poverty and inequality in order
to find efficient policies oriented on pro-poor growth.
2.1. Poverty, inequality and growth
The origin of “pro-poor growth” definition has been found also in the
Second Principle of Rawls’ Theory of Justice (Rawls J., 1971) which is subdivided
into other two important principles: the Fair Equality of Opportunity and the
Difference Principle. Based on these latter two principles, social and economic
inequalities have to satisfy two conditions: (1) they are to be attached to positions
and offices open to all under conditions of fair equality of opportunity; and (2),
they are to be to the greatest benefit of the least advantaged members of society
(Rawls J., 2001). While the first condition draw attention on the origins of
inequality, the second one focuses on the consequences of inequality; and it is
precisely this latter to be a useful guideline for pro-poor growth policies. The
Difference Principle is relating to a form of equality where, under certain
empirical conditions, differences in income have no effect on the work incentive
of people. However, in the foreseeable future the possibility of earning greater
income will bring forth greater productive effort and this will increase the total
wealth of the economy and, under the Difference Principle, the wealth of the least
advantaged. Moreover, following this principle, Rawls gives also a clear
justification of income inequality’s “goodness” if it generates benefits for the
whole population, and especially for the worst off. In this sense, since growth is
required to benefit especially the worst-off, “Rawlsian theory of justice relies on
the capacity of social and economic inequalities to generate growth, which is
additionally required to be of the pro-poor kind if it reduces both poverty and
inequality” (Abatemarco A., 2016).

Despite different definitions of pro-poor growth, what clearly has been
emerged is that this definition is strongly interlinked with three elements such as
growth, poverty, and inequality. Ravallion (2004), for example, focuses on the
expected change in poverty through the, so called, growth elasticity of poverty3
and how this impact is affected by inequality. His estimates suggest that
depending on the initial level of inequality (as measured for example by Gini
coefficient), countries with a more equal distribution of income experience a
greater reduction in the poverty rate for a given increase in per capita income; on
the contrary, countries with a high initial inequality of income experience a small
reduction in the poverty rate. Against this background, Ravallion (2004)
concludes that "growth will be quite a blunt instrument against poverty unless that
growth comes with falling inequality". Similar pattern has been suggested by
Bourguignon (2003) who stated that “poverty reduction in a given country and at
a given point of time is mostly determined by the rate of growth of the mean income
of the population and the change in the distribution of income”.
Furthermore, from research results conducted by Kraay (2004), the growth
in average in income4 turns out to be mostly important for poverty reduction, but
not sufficient if the growth in relative income5 is not taking into consideration as
well. For this reason, more micro-level policies related to the distributional effect
change should be implemented.
Summing up, the strongest view suggests that economic growth can be
pro-poor if its main result, reduction in poverty, is going hand in hand with
3 Growth elasticity of poverty (GEP) is the percentage reduction in poverty rates associated with a percentage change in mean (per capita) income. Generally, the elasticity is positive since the increase in per capita income tend to decrease the poverty rate. However, the GEP also depends on other variables such as, for example, the initial level of income inequality. 4 The empirical results suggest that in order to implement the growth in average incomes, some policies such as the protection of property rights, stable macroeconomic policies and openness to international trade, “should be at the heart of pro-poor growth strategies” (Kraay, 2004). 5 Relative income measures the income in relation to other members of society, weighing it against the standards of the day. It differs from absolute income, which does not take into consideration those other factors, but simply reflects the total amount of individual earnings in a given period.

decreasing in inequality and the impact of such a growth on poverty reduction will
strongly depend on the initial level of income and inequality.
Therefore, the strongest definitions of pro-poor growth prevail and
differentiate between relative and absolute pro-poor growth. The former arises
when economic growth benefits the poor proportionally more than the non-poor.
This implies that while growth reduces poverty, it improves relative inequality at
the same time because the income of the poor may increase at a faster rate than
that of the non-poor. Conversely, a measure of pro-poor growth is absolute if the
poor receive the absolute benefits of growth equal to, or more than, the absolute
benefits received by the non-poor. Under this definition, absolute inequality would
decrease during the economic growth process (Kakwani, Khandker and Son,
2004).
In the line with absolute notion of pro-poor growth, the inclusive growth
concept is concerned. This concept represents an important tool for achieving a
sustainable growth. One of the most important features of inclusive growth6 is that
it involves a multidimensional dimension of poverty or rather the non-income
dimensions of well-being, which includes health, education and especially the
productive employment, rather than unidimensional which is only confined with
income consideration. Another difference is that inclusive growth, intended in the
sense of outcomes rather than of incomes, wants growth to benefit all stripes of
society, including the poor, the near-poor, middle income groups, and even the
rich. The pro-poor growth, instead, focuses on people below the poverty line or
rather poor people (Klasen S., 2001).
6 Inclusive growth is based into two broad dimensions: benefit-sharing and participation, where the first concerns to the decreasing level of poverty and income inequality (in this sense is strictly connected with pro-poor growth concept), while the second dimension looks on how the society is involved in the process of growth in terms of employment and it is not concerned with the concept of pro-poor growth (Ramos R. A., Ranieri R., Lammens J., 2013). In this latest sense of dimension, the inclusive growth is intended as broad-based or labour-intensive growth as well.
2.2. Indices and indicators
There is a variety of measurements proposed for pro-poor growth which
strongly differ from each other depending on the definition of pro-poor growth
one is opting for.
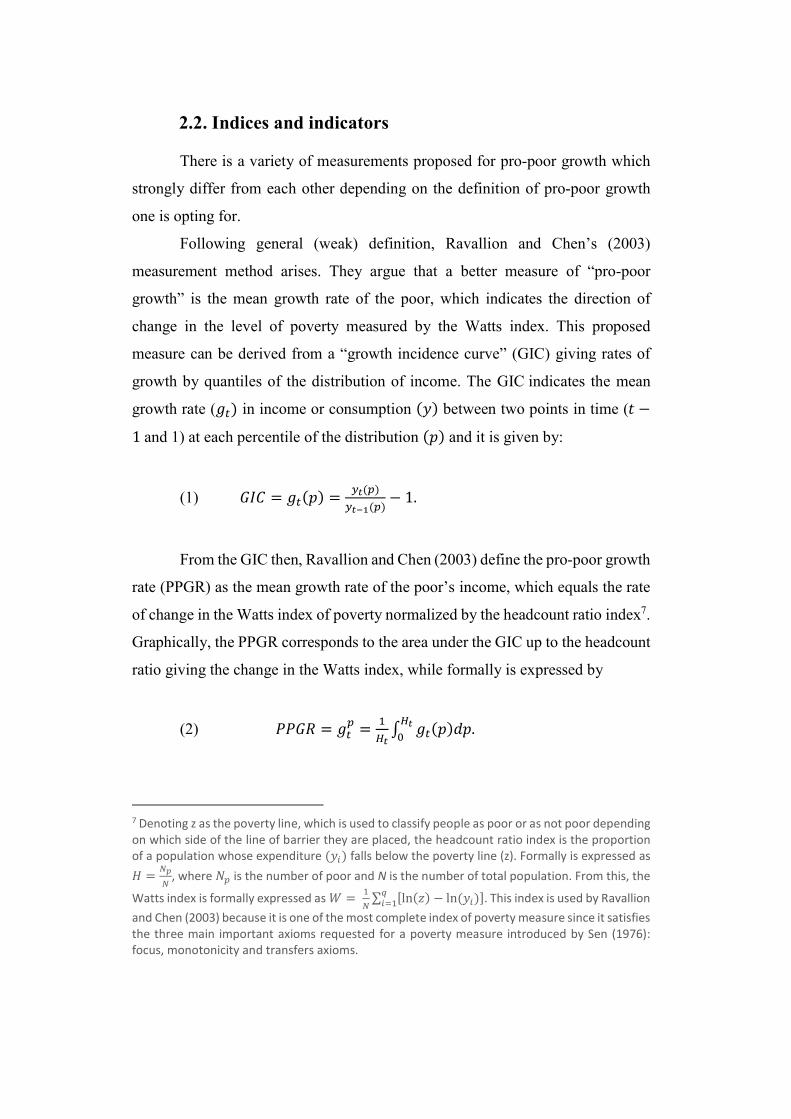
Following general (weak) definition, Ravallion and Chen’s (2003)
measurement method arises. They argue that a better measure of “pro-poor
growth” is the mean growth rate of the poor, which indicates the direction of
change in the level of poverty measured by the Watts index. This proposed
measure can be derived from a “growth incidence curve” (GIC) giving rates of
growth by quantiles of the distribution of income. The GIC indicates the mean
growth rate (𝑔 ) in income or consumption (𝑦) between two points in time (𝑡 −1 and 1) at each percentile of the distribution (𝑝) and it is given by:
(1) 𝐺𝐼𝐶 = 𝑔 (𝑝) = ( )( ) − 1.
From the GIC then, Ravallion and Chen (2003) define the pro-poor growth
rate (PPGR) as the mean growth rate of the poor’s income, which equals the rate
of change in the Watts index of poverty normalized by the headcount ratio index7.
Graphically, the PPGR corresponds to the area under the GIC up to the headcount
ratio giving the change in the Watts index, while formally is expressed by
(2) 𝑃𝑃𝐺𝑅 = 𝑔 = ∫ 𝑔 (𝑝)𝑑𝑝.
7 Denoting z as the poverty line, which is used to classify people as poor or as not poor depending on which side of the line of barrier they are placed, the headcount ratio index is the proportion of a population whose expenditure (𝑦 ) falls below the poverty line (z). Formally is expressed as 𝐻 = , where 𝑁 is the number of poor and N is the number of total population. From this, the
Watts index is formally expressed as 𝑊 = ∑ [ln(𝑧) − ln (𝑦 )]. This index is used by Ravallion and Chen (2003) because it is one of the most complete index of poverty measure since it satisfies the three main important axioms requested for a poverty measure introduced by Sen (1976): focus, monotonicity and transfers axioms.
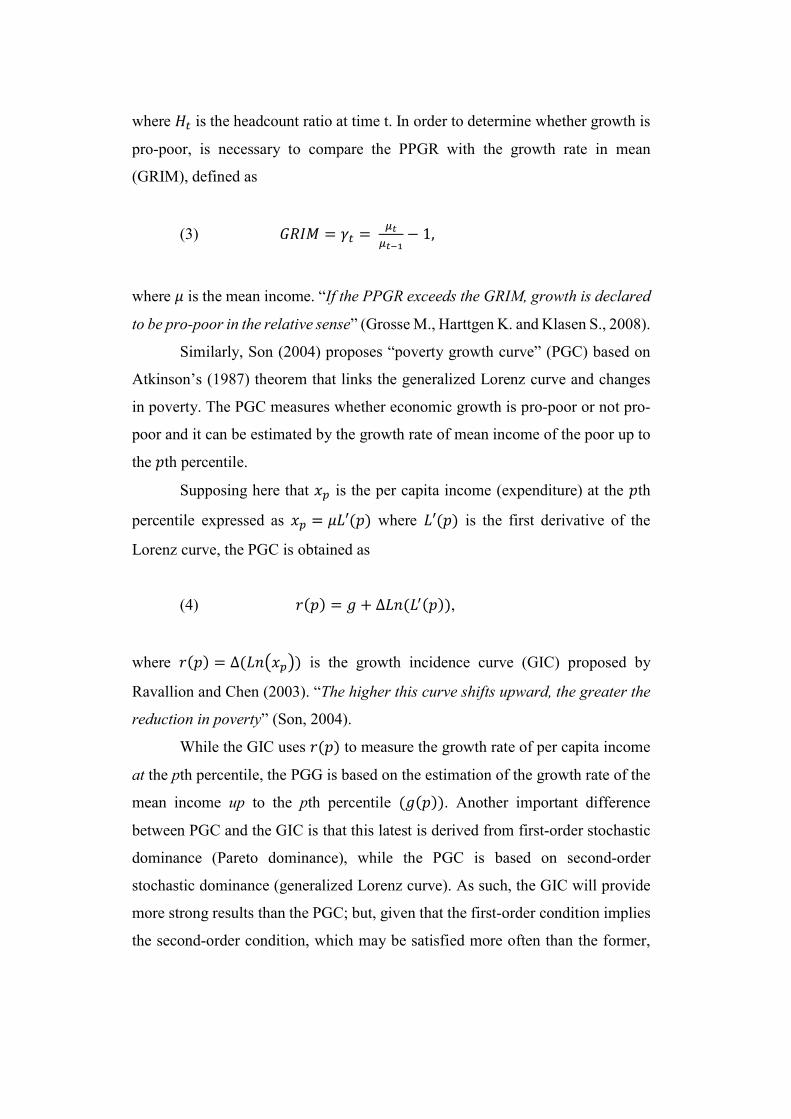
where 𝐻 is the headcount ratio at time t. In order to determine whether growth is
pro-poor, is necessary to compare the PPGR with the growth rate in mean
(GRIM), defined as
(3) 𝐺𝑅𝐼𝑀 = 𝛾 = − 1,
where 𝜇 is the mean income. “If the PPGR exceeds the GRIM, growth is declared
to be pro-poor in the relative sense” (Grosse M., Harttgen K. and Klasen S., 2008).
Similarly, Son (2004) proposes “poverty growth curve” (PGC) based on
Atkinson’s (1987) theorem that links the generalized Lorenz curve and changes
in poverty. The PGC measures whether economic growth is pro-poor or not pro-
poor and it can be estimated by the growth rate of mean income of the poor up to
the 𝑝th percentile.
Supposing here that 𝑥 is the per capita income (expenditure) at the 𝑝th
percentile expressed as 𝑥 = 𝜇𝐿′(𝑝) where 𝐿′(𝑝) is the first derivative of the
Lorenz curve, the PGC is obtained as
(4) 𝑟(𝑝) = 𝑔 + ∆𝐿𝑛(𝐿 (𝑝)),
where 𝑟(𝑝) = ∆(𝐿𝑛 𝑥 ) is the growth incidence curve (GIC) proposed by
Ravallion and Chen (2003). “The higher this curve shifts upward, the greater the
reduction in poverty” (Son, 2004).
While the GIC uses 𝑟(𝑝) to measure the growth rate of per capita income
at the pth percentile, the PGG is based on the estimation of the growth rate of the
mean income up to the pth percentile (𝑔(𝑝)). Another important difference
between PGC and the GIC is that this latest is derived from first-order stochastic
dominance (Pareto dominance), while the PGC is based on second-order
stochastic dominance (generalized Lorenz curve). As such, the GIC will provide
more strong results than the PGC; but, given that the first-order condition implies
the second-order condition, which may be satisfied more often than the former,

the PGC will provide more conclusive, even if less robust, results than GIC (Son,
2004).
The measures suggested by Son (2004), Ravallion and Chen (2003) belong
to the partial ordering approach since they define pro-poor growth just under the
dominant conditions. Thus, if the dominant conditions are not met, is not possible
to infer whether a growth process is pro-poor or not pro-poor and this represents
the main limitation of this approach. Another limitation of the partial ordering
approach consists in the fact that it does not include the information about the
degree of pro-poor growth; thus, it is not possible to verify how much one growth
process is more pro-poor than another growth process.
The other broader (strong) definition of pro-poor growth includes the
studies of McCulloch and Baulch (2000), Kakwani and Pernia (2000) and
Kakwani and Son (2008), each of which suggests that a measure of pro-poor
growth has to take into account both the poverty reduction and inequality
improvement. Since these measures can provide information about how much the
growth might be pro-poor, they are classified under the name of complete ordering
approach.
For these measures, it is therefore important to fulfil the monotonicity
axiom which implies “for the magnitude of poverty reduction to be a
monotonically increasing function of the pro-poor growth rate, since a poverty
reduction depends on both growth and the distribution of its benefits among the
poor and the non-poor” (Kakwani, Khandker and Son, 2004)8.
McCulloch and Baulch (2000) propose a measure of pro-poor growth
known as the poverty bias of growth (PBG) which pays a major attention on
reducing inequality. The PBG is derived from the negative of the inequality
component obtained from the symmetric poverty decomposition which was
suggested by Kakwani (2000) i.e,
8 A pro-poor growth measure that satisfies the monotonicity axiom provides a necessary and sufficient condition for the reduction of poverty because it will consider not only growth but also how benefits of growth are shared by individuals in society.

(5) ∆𝑃 = ∆𝑃𝜇 + ∆𝑃Ψ,
where ∆𝑃𝜇 is the change in poverty when the distribution of inequality does not
change, while ∆𝑃Ψ is the change in poverty when inequality changes in the
absence of growth.
McCulloch and Baulch (2000) propose of the poverty bias of growth
(PBG) between two periods that can be calculated as the difference between
poverty reduction with distributional neutral growth and poverty reduction which
actually occurred:
(6) 𝑃𝐵𝐺 = ∆𝑃𝜇 − ∆𝑃 = −∆𝑃Ψ.
If the PBG is positive, this indicates a pro-poor bias of growth; if it is
negative, growth has an anti-poor bias (Zaman K., Khan M. M. and Ahmad M.,
2010). However, the PBG does not always satisfy the monotonicity criterion.
“Higher values of the PBG may not imply a greater reduction in poverty because
poverty also depends on the growth effect. Thus, the PBG will only satisfy the
monotonicity criterion if it is assumed that the growth effect is constant (which is
highly unlikely)” (Kakwani, Khandker and Son, 2004).
An alternative measure proposed by Kakwani and Pernia (2000) is the pro-
poor growth index (PPGI) which measures the degree of poverty and it is derived
from the relation between total poverty reduction and poverty reduction in the case
of distribution-neutral growth. This relationship is expressed in terms of ratio of
the poverty elasticities.
Supposing the income x of an individual is a random variable with a
density function f(x), and z is the poverty line, then a general class of additively
decomposable poverty measures can be written as
(7) 𝜃 = ∫ 𝑃(𝑧, 𝑥)𝑓(𝑥)𝑑𝑥,

where 𝑃(𝑧, 𝑥) is a homogenous function of degree zero in 𝑧 and 𝑥, while 𝑓(𝑥) is
the density function of x and < 0, > 0, 𝑃(𝑧, 𝑧) = 09.
Kakwani and Son (2008) define the growth elasticity of poverty as “the
ratio of the proportional change in poverty to the proportional change in the mean
income”, which is obtained by the total differential of (7) as
(8) 𝛿 = ( ) = ∫ 𝑥(𝑝)𝑔(𝑝)𝑑𝑝,
where 𝛾 = 𝑑𝐿𝑛(𝜇) is the growth rate of mean income and 𝑔(𝑝) = 𝑑𝐿𝑛(𝑥(𝑝)) is
the growth rate of the income of people at the pth percentile. Thus, 𝛿 is the
percentage change in poverty resulting from a growth rate of 1 percent in the mean
income.
Consequently, the poverty reduction depends on two factors: i) the first is
the magnitude of the economic growth rate (the larger the growth rate, the greater
the reduction in poverty); ii) the second is the change in inequality (an increase in
inequality reduces the impact of growth on poverty reduction). These two factors
can be expressed by the decomposition of (8) as the sum of two components:
(9) 𝛿 = 𝜂 + 𝜁.
9 Foster, Greer, and Thorbecke (1984) proposed a class of poverty measures that is obtained by substituting in (7) the quation 𝑃(𝑧, 𝑥) = , where 𝛼 is the parameter of inequality aversion. For 𝛼 = 0, the headcount ratio is obtained (𝜃 = 𝐻) which gives equal weight to all poor irrespective of the intensity of their poverty. For 𝛼 = 1, each poor is weighed by his or her distance from the poverty line and this measure is called the poverty gap ratio. For 𝛼 = 2, the weight given to each poor is proportional to the square of his or her income shortfall from the poverty line and this measure is called the severity of poverty ratio.

𝜂 is the neutral relative growth elasticity of poverty derived by Kakwani (1993)
and it is always negative10, while 𝜁 shows the effect of inequality on poverty
reduction. The PPIG index then can be expressed as:
(10) 𝜑 =
The growth is pro-poor when 𝜑 is greater than 1. Otherwise, the growth is
negative or relatively pro-poor, in the sense that the growth is proportionally less
for the poor than for the non-poor. Finally, the growth is said neutral, when 𝜑 = 1
and everyone benefits of the same proportion from the growth.
Nevertheless, even though the PPIG captures the distribution of growth
benefits among the poor and nonpoor, it does not take into consideration the level
of the actual growth rate. This means, it does not satisfy the monotonicity axiom.
In response to this, Kakwani and Son (2008 ) proposed another pro-poor
growth measure called the poverty equivalent growth rate (PEGR) which includes
both the growth rate in mean income and how the benefits from growth are
distributed between the poor and the non-poor.
The PEGR is the growth rate 𝛾∗ that would result in the same proportional
change in poverty as the present growth rate 𝛾 if the growth process was not
followed by any change in relative inequality. Formally is expressed as:
(11) 𝛾∗ = 𝛾 = 𝜑𝛾.
The equation (11) implies that growth is pro-poor (anti-poor) if 𝛾∗ is
greater (less) than 𝛾. When 𝛾∗ > 𝛾, the growth is pro-poor in relative sense. If 0 < 𝛾∗ < 𝛾, the growth reduces poverty but at the same time increases inequality.
Practically, this situation results in trickle-down process where the poor receive
10 Neutral relative growth means that growth does not change the relative inequality and thus, everyone on society receive the same proportional benefits from growth.

proportionally less benefit from growth than the non-poor. What is more, the
growth can be defined as “super pro-poor” or absolute pro-poor growth if 𝛾∗ >𝛾 ∗, where 𝜂∗is the elasticity of poverty with respect to that growth which is
equally shared between every individual in society (everyone receives the same
benefits from growth).
It has been noted by Kakwani, Khandker and Son (2004) that the PEGR
can be calculated separately for the entire class of poverty measures including the
headcount ratio, poverty gap ratio, severity of poverty index, and Watts measure.
An advantage of this measure is that it takes into account both the greatness of
growth and the benefits of growth the poor receive. Moreover, the PEGR satisfies
the basic monotonicity criterion such that the proportional reduction in poverty is
a monotonically increasing function of the PEGR. To accelerate the reduction in
poverty, it is suggested that the PEGR be maximized, rather than the growth rate
alone.
3. Empirical evidences
From the pro-poor growth pattern, none consensus has been found about
how specifically it has to be defined and how it can be measured. The five
alternative measures proposed have they merits and limitations, but none of them
is recommended over the other. The broad consensus from the literature, however,
is that growth alone is not enough to guarantee the sustainable reduction of
poverty, but keeping inequality into consideration is equally important.
Nevertheless, the reduction of poverty as well as the reduction of
inequality is generally not an overriding objective of government policies. Quite
the opposite, in many countries, governments are making policies that are,
knowingly or unknowingly, in favour of the rich rather than of the poor and this
hampers the achievement of pro-poor target. Thus, the main goal now is to find

what kind of issues continue to exist behind the political action overall, taking into
consideration both developing and developed countries.
A first step towards to finding out these policies issues is to glance on how
the poverty is identified across the countries. On this matter, absolute definition
of poverty can be distinguished from relative concept. The farmer can be also
defined as “extreme poverty” and it is generally calculated by headcount index
which classify poor as those with level income or consumption per day below
US$1,90 (PPP) threshold of international poverty line11. The latter, instead,
involves a comparison of the incomes (or expenditures) of poor households with
those of the rich and it is measured by indicators such as the Gini coefficient.
Looking at poverty in absolute terms, the empirical analysis of World
Bank research shows that, while in 1981 about 44 % of population across countries
were living below the poverty line12, getting on in years this estimation has
decreased more and more until reaching levels below 10,7 % (776.6 millions) in
2013. This means that most of the countries have made a huge effort to bring
billions of people out of the poverty in extreme conditions. The first ones to put
an end to this rate were the industrialized countries which experienced a rapid and
strong economic growth in the last decades. A very rapid reduction of absolute
poverty has been experienced especially in East Asia and Pacific regions, from
60 % in 1990 to 3,5 % in 2013 (World Bank, 2016).
However, the challenge is not over yet and some countries still have to
face up with, especially Sub – Saharan Africa which had the world’s largest
headcount ratio (41.0%) and housed the largest number of the poor (389 million)
in 2013 (almost half of total global population) (World Bank, 2016). This
challenge has been taken by several important international and national
11 When the Millennium Development Goals were first published, the international poverty line was set at earning $1 a day. In 2008, the World Bank pushed the line to $1.25 in order to recognize the higher price levels in several developing countries than previously estimated. Finally, from the recent developments, this poverty line was revised again in 2015. Since then a person is recognised to be in extreme (or absolute) poverty if he or she is living on less than 1.90 international $ per day. 12 The data have used the International Poverty Line fixed at 1.90 international $ per day.

organizations, including the UN, the World Bank and the United States Federal
Government which have set a new target for a new MDG to end extreme poverty
by 2030 and this implies reducing the poverty headcount ratio from 10.7 %
globally in 2013 to 3.0 %13 in 2030.
From this point of view, it could be said that poverty reduction is towards
the end very soon. The great industrialization, expansion of the existing markets
and phenomenon of globalization have all contributed to the rising economic
growth and hence, reduction of poverty in the last decades. But looking on poverty
from relative point of view, which means looking especially on inequality rate or
namely how the benefits of growth had been shared between poor and non-poor,
the scenario is not such positive as above.
During the same decades, the growth was not properly shared among
people and this contributed to increase the level of income inequality. The new
way of thinking about poverty is in relative terms which has been defined as the
condition in which people lack the minimum amount of income needed in order
to maintain the average standard of living in the society they live. In accordance
with this definition, relative poverty is more common than absolute or extreme
poverty in developed countries and it is becoming the most useful indicator, used
by the most important international organisation such as UNDP, UNICEF, OCED
for ascertaining poverty rates in wealthy developed nations.
In other words, people in developed countries are considered poor to the
wealth of others when they cannot participate in that society because of lack of
resources, or rather because of inequality of opportunities. Whereas the relevance
to the matter of standard of living relative to deprived people in a country, the
poverty can be measured as half of the national median household income. The
main poverty line used in the OECD and the European Union is a relative poverty
measure based on "economic distance", a level of income usually set at 60% of
the median household income.
13 Another second target with equal importance is to promote shared prosperity in every country in a sustainable way. This means fostering the growth in the income or the consumption expenditure of the poorest 40 % of the population (the bottom 40) in each country.

Looking at the most developed countries together in Organization for
Economic Cooperation and Development (OECD), there is a wide gap between
poor and rich started gradually to increase from 2000s. This gap is due to the
increasing household incomes which has grown faster for the richer than for the
poorest14, causing booming in income inequality.
In 2010, the inequality of income was on average around 0.31 in OECD
countries, ranging from a low of 0.25 in Iceland and Slovenia to a high of 0.50 in
Chile. While, looking on the poverty gap rate which measures the intensity of
poverty living on average below a poverty line, around 11 % of the population
across the 34 OECD countries fell below the poverty threshold. This was differing
from the minimum, 6 % in Denmark and the Czech Republic, to 20 % and more
in Israel and Mexico (Martin J. P. and Förster M., 2014).
This means that inequality and poverty do not necessarily go hand-in-
hand, and even some countries such as Denmark, Finland, Germany, Finland have
yielded positive results on reducing poverty with poverty rate gap below the
average of OECD countries, their level of inequality increased at the same time.
The USA is a blatant example of a developed country which boasts the
highest Gross Domestic Product (GDP) in the world, but this impressive growth
was accompanied by a sharp increase in inequality in years. From 1990s till 2010,
in fact, the USA ranked fourth to have the highest (0.36) Gini coefficient of
income inequality within 34 OECD countries (at first place Chile with 0.50,
Mexico is placed at second with 0.46 and third Turkey with 0.41)15.
14 Various hypotheses have been put forward to explain the widening income gap, ranging from globalization to technological changes to demographic trends. However, one of the most common reasons given is the growing concentration of income among high-income earners. This increment was principally due to the greater inequality in wages and salaries. The rich households faring much better than both low and middle-income families in most of countries. This has often been attributed to higher shares of labour income, partly due to the development of stock options which are reported as part of wages and salaries (OECD, 2008). 15 Source: OECD Income Distribution Database (www.oecd.org/social/income-distribution-database.htm), accessed in December 2013.

To bring about pro-poor growth analysis, it is opportune to take into
consideration the poverty in relative terms rather than in absolute terms. Some
empirical researches suggest that in the last three decades the impact of pro-poor
growth on poverty in developing countries was different, depending mostly from
initial level of inequality and political reforms conducted for the poverty reduction
strategies. Following, for example, Kakwani and Pernia (2000) study about some
Asian countries using the pro-poor growth index, the results indicate that in Korea
the growth has generally been highly pro-poor. Conversely, in Thailandia the
growth was not such as pro-poor even though it has considerably reduced the level
of poverty. The main finding, however, is that growth has been more pro-poor in
the rural areas rather than in urban areas. In the same line, Ravallion and Datt
(2002), in conducting an analysis about the impact of growth on various states in
India, suggest that in urban areas the impact of pro-poor growth is more obvious
to identify. What is more, Fan et al. (2008) study suggest that in India the pro-
poor growth must be implemented by enhancing the agricultural productivity in
rural areas which represents the main survival factor for most of developing
countries including Africa, Latin America and Asia. Similar results have been
found by another study conducted by Cord L. (2007) who compared eight
developing countries16 succeeded in pro-poor growth experience. Despite
different insights for poverty reduction strategies conducted by eight countries,
some common strategies which sustained growth in favour of poor emerged:
creation of new and more accessible jobs to poor households, making agricultural
activities more productive, improving access to markets and technology,
strengthening the participation of woman in labour market and investment in
human capital especially in secondary education.
Looking instead on developed countries, the scenario of the last three
decades suggests that economic growth was accompanied by widening
inequalities in household disposable income. This means that instead of pro-poor
growth, there has been a growth that favoured rich more than poor. Some studies
16 . Bangladesh, Brazil, Ghana, India; Indonesia; Tunisia; Uganda and Vietnam.

focusing on top incomes have shown that the shares of the richest 1% in total pre-
tax incomes have increased in most OECD countries in the past three decades,
with highest concentration in English-speaking, some Nordic countries and
Southern European countries (OECD, 2014). Conversely, from another study
based on relative poverty (inequality poverty with respect to the mean) across
OECD countries analysis it appears a wide number of low- income people which
differs across countries: in Mexico and Israel around 20% of the whole population
is below the low- income threshold of 50% of median income, while only 6% in
the Czech Republic (Causa, O. et al., 2014). A way to compare how low-income
people have benefited from economic growth in the last decades is proposed by
OECD analysis based on comparison between trends in household incomes on
average and trends in GDP per capita (OECD, 2015). The results, relating to
around half of OECD countries for which data was available, show that the GDP
growth was substantially higher than household’s income growth especially for
the households at the bottom lower quintile distribution. Better distribution instead
was for the disposable incomes in the middle of distribution. The main divergence
anyway of growing gap with respect to the median incomes was particularly
pronounced in countries such as Israel, Sweden, Spain, Finland and United States.
This divergence regarding GDP growth which has been accompanied by
growing income disparities over the past three decades, has different mitigating
factors which are explained in the section bellow where some policy implications
are given as well.
4. Policy implications
Several causes have been identified behind the divergence in advanced
economies. First of all, whilst globalization and technological progress have been
the main factors to launch the rapid global economic growth, on the other hand
they affected the rising inequality among countries as well. Globalization has
driven many developed countries towards the convenience to invest more and
more directly in other countries, so-called emerging economies, such as China and
India. But this, at the same time, has provoked less export and thus, less
development and job in some important sectors such as rural and agriculture.
Technological progress, in turn, has benefited more the high-skills workers rather
than those with low-skills. Nowadays, enterprises demand for high-skills workers
is rising as well as the earnings of these latest. This provokes the growing gap
between high- and low-skilled workers earnings.
Other factors that have contributed to the greater wage inequality are
regulatory reforms and institutional changes. These, from one side, played a
positive role in increasing employment opportunities through recruiting more and
more low-paid workers and/or adopting part-time job contracts in order to
strengthen competition in the markets for goods and services and to make labour
markets more adaptable. On the other side, however, the continuing rise of low-
paid workers and contractual changes in working conditions have also contributed
to increase the income wages17 inequality (OECD, 2011). Strictly connected with
this argument is the Premium Wage which represents one of the most analysed
issues especially in labour economics. Usually, some employees receive
additional payments (e.g. pay holiday) which may jeopardise the wages between
low-paid and high-paid workers and thus, contribute to the widening wage
inequality. This issue should not be overlooked since it could be a significant
factor to influence the pro-poor growth indicators for OECD countries.
Finally, what is strongly causing this divergence in advanced economies
are the taxes and benefits structures became less effective in redistributing income.
17 The distribution of non-wage incomes has generally also become more unequal. It has been observed that the capital income inequality increased more than earnings inequality in two-thirds of OECD countries, even though the share of capital income in total household income remains modest on average at around 7% (OECD, 2011). From the same observation, the changes in family structures (smaller than before because of the one or without children) have been seen as one of the likely reason to increase earnings and income inequality. “Smaller households are less able to benefit from the savings associated with pooling resources and sharing expenditures” (OECD, 2011).

Public cash transfers, as well as income taxes and social security contributions,
are playing a major role in all OECD countries in reducing market-income18
inequality. Together, they were estimated to reduce inequality among the
working-age population (measured by the Gini coefficient) by an average of about
one-quarter across OECD countries. This redistributive effect in the late 2000s
was larger in the Nordic countries, Belgium and Germany, but well below average
in Chile, Iceland, Korea, Switzerland and the United States (OECD, 2011). The
main reasons for the decline in redistributive government capacity are found on
the benefit side: cuts to benefit levels, tightening of eligibility rules to contain
expenditures for social protection and the failure of transfers to the lowest income
groups, etc. For example, despite the USA prides itself as a land of opportunity,
the most economically disadvantaged groups in community (immigrants, low-
paid workers, pensioners, etc.) are excluded from these opportunities. This
exclusion is particularly remarkable for the most important public services:
institution and health.
Taking into consideration all the main causes that have provoked the
divergence between economic growth and rising inequality over the last decades,
it can be said that an important issue related to the policy makers from the pro-
poor growth point of view is that they run the risk to diverting attention of public
policies real role and ensure that the gains from economic growth that reach the
poor are sufficient to reduce the incidence of absolute poverty and not of the
relative poverty as well.
It seems that so far, the economic literature has just assumed that the policy
objective is to maximise the rate at which absolute poverty is reduced. From this
point of view, in fact, the positive results certainly have been achieved, but the
consideration of poverty in relative terms has been overlooked. The economic
18 Market income is identified as a pre-tax-transfer income in terms of the sum of income from market sources (such as wages and salaries, self-employed income, capital income, benefits from private pensions or insurances, and other private transfers). It differs from disposable income which determines what remains after subtracting income taxes and social security taxes and adding welfare transfers lead to post-tax-transfer income.
imbalance, gender disparities and social exclusion are still affecting even those
countries which have escaped the extreme condition of poverty. This must be
prevented with huge efforts especially now when following the recent events
around the world such as civil wars, huge migration flows and political instability,
increasing inequality and poverty are always put at risk if austerity policies are not
well balanced.
Nevertheless, all the measures proposed in the section above are focus on
the income dimension of poverty, but according to the recent studies emphasizing
on multidimensional aspects of poverty such as health, education and gender
equity are important as well (e.g. World Bank, 2000a, UN, 2000). In particular,
focusing on the role of human capital has been identified as one of the main key
factors to better understand the impact of inequality on growth, especially in
developed countries (Galor O. and Moav O., 2004).
As evidenced also from the Fair Equality of Opportunity principle of
Rawls (1975), what is important for economy is not just the distribution of
material goods and services but also the distribution of opportunities19. This latter
can be understood as equal opportunities for education, health care, etc. and which
represent as well effective rules to put out the formal discriminations such as a
person's race, ethnicity, age or gender. In fact, the Fair Equality of Opportunity
principle “requires that citizens have the same educational and economic
opportunities regardless of whether they were born rich or poor” (Abatemarco,
2016).
To sum up, in order to find a way for the policies to be oriented on pro-
poor growth, it should be firstly underlined the differences between emerging and
advanced economies. According to the country and it initial inequality level,
different policies implications should be found. From empirical evidences some
19 Rawls’ point of view about opportunity intended as a “chance of access to resources” differs from Sen’s (1983), who emphasis more on “equality of outcome” or “chance of outcome” rather than “equality of opportunity”. Thus, form Sen’s capabilities approach, a society is committed to guarantee the equalization of capabilities when it has the that ability to lead a human life with reasonable longevity, nutrition, health, and social functioning.
experiences suggest that more proactive investment in the rural areas, trough the
enhancement of the productivity in agriculture sector, is essential for sustainable
pro-poor growth in developing countries (Zorgui I. et al, 2016). Some
macroeconomics policies such as business environment transparency and inflation
control, have also been identified as good indices for the stability of a country in order to attract more domestic investment and foreign capital inflows. Last but
not least, development of the private sector including support to the small-medium
enterprises (SME) is equally important. When government policies promote the
supply and demand for products and services that people produce, this definitely
encourage the pro-poor growth. Supporting SME development in this sense is
important: since the small-medium enterprises are responsible for the most
industry activity, the government should pay more attention on how to finance
their business.
In regard to developed countries, one of the big divergence refers to the
growing gap between wages. This issue can be handled by creating better and
well-paid jobs for the low-skills workers, enhance the employment benefits for
the low-skills workers, improving the employment opportunities of those not
working, improving the general skills level through broader access to high-quality
education and sustaining young people even without high level of education to be
oriented on start-up initiatives through public financial support. Creating better
and well-paid jobs, for example, can be achieve by making more use of in work
benefits which encourage people to take up paid work and give additional income
support to low-income households. Nevertheless, having a real career prospects
and hopeless on being well paid, will encourage households to make more effort
on education of their children. This distributive aspect is assumed to impact on
growth to the extent that “the magnitude of (expected) income inequalities is said
to influence (ongoing) individual incentives to effort in education, and so (future)
productivity in the labour market” (Abatemarco A. and Stroffolini F., 2017).
Still on the subject of employment, more employment protection
legislation is needed in order to reduce the gap in the degree of protection between
temporary and regular contracts. The same legislation should be supplemented by

adequate unemployment benefits which should be at the same time not so
incentive to being long term unemployed.
Finally, reforming tax and benefit policies is the third key to promote a
better distribution of income as the most direct instruments to redistribute income.
In fact, there is a correlation between pro-poor growth and tax progressivity: a
fiscal system is called progressive (regressive) if it redistributes income favouring
the poor (rich). It has been demonstrated that developed countries such as Nordic
and Anglo-Saxon countries which have pursued a more progressive tax and
benefit policies, have been the most successful on reducing poverty and inequality
as well (OECD, 2008). While, the countries who stands out for achieving the same
goals through the tax and benefit system are Asian countries (Japan and Korea)
and also the United States. In conclusion, taxation and benefit transfers can be an
efficient policy tool for pro-poor growth because on the one side it can minimize
inequality in the income distribution in favour of poor (and so reducing relative
poverty) and on the other side, it can likely affect diverse aspects of human
behaviour thanks to which more inclusive growth can be achieved.
However, pro-poor growth looks mostly on income aspects of the poverty
rather than non-income which is important exactly in the same way or even more.
For this reason, inclusive growth should be considered as the main tool to achieve
the reduction of poverty from income and non-income way, and pro-poor growth
as the main device of income way.
From this point of view common policies implementation can be suggested
for both developing and developed countries.
First of all, investing in human capital is the most important tool ever,
focusing especially on guaranteeing the girls education. The policy challenge here
is to improve access to, and the quality of, education since the early childhood
period. Then, once the transition from school to work has been accomplished
successfully, there must be sufficient incentives for workers and employers to
invest in skills throughout the working life. This will ensure the equality of
opportunity for children from disadvantaged backgrounds. Moreover, following
the Rawlsian Difference Principle, once education opportunities are granted to the

entire population, inequalities are admitted as far as they are to the greatest benefit
of the well-off (i.e. least-advantaged). In this sense, inequality must be aimed at
pro-poor growth (Abatemarco A. and Stroffolini F., 2017).
It is also important to guarantee the equal opportunity to the public health
access. All people must to have the cleaner water to drink, more nutritious food to
eat, higher-quality air to breathe, and access to a broad range of services to
promote human health, from vaccines and doctors to public parks. Worker with
more healthy life will contribute more to the labour force and thus to the economic
growth. What is more, some countries, such as China, have registered a significant
reduction in poverty thanks to the public expensive on health.
Gender equity is another tool which besides being a human right, is
important to guarantee the equality of opportunity between men and women.
Nowadays, women are still generally underrepresented in economic and political
spheres of life. Removing these barriers for women through economic
empowerment and political participation, is essential for achieving poverty
reduction and inclusive growth promotion.
Finally, going back to the tax and transfer public policies, which was
drawn for the advanced countries, these are the most direct policies impacting to
the income distribution but at the same time they affect the non-income aspects of
population. More equal distribution of income and public transfers will ensure
more social and political stability in a country. Aggregate demand will be
increased when resources are redistributed from richer households to poor
households with a higher propensity to save. Equality in income will generate
protectionist sentiments and people will in longer support open trade and free
markets. This will also influence positively so called inter-generational income
mobility - also known as social mobility - which is one of the possible measures
of equality of opportunity (Abatemarco A., 2016)20.
20 Inter-generational differs from intra-generational mobility which “is not immediately related with equality of opportunity, but it is commonly understood to characterize more meritocratic societies, e.g. with less rigidities in the labour market” (Abatemarco A., 2016).

Such as kind of system is called progressive. Otherwise, when the public
transfers are favouring rich at the cost of poor, is called regressive. Meanwhile,
progressive public programme is always pro-poor but policy maker should take
into account both, efficiency and effectiveness on their achievement of anti-
poverty programme according to socio-demographic and socio-economic
structures of their country. Pursuing effectively these goals can help to achieve
also other objectives such as promote intergenerational social mobility and
equality of opportunity which are essential tools for promoting inclusive growth
and reducing poverty in long term.
5. Concluding Remarks
The general remarks suggest that despite the relevance of economic
growth, which has been essential for poverty reduction in absolute sense in the
last decades, it is in itself not sufficient for the alleviation of poverty in relative
sense as well.
From this view, it is important to understand that poverty doesn’t mean the
same for everyone around the world. Usually poverty is thought in absolute terms,
namely deprivation of basic needs, e.g. not having access to food, water and
shelter. However, poverty exists in developed countries as well and it should be
considered in terms of relative deprivation related to a social context and the
degree of participation in it. Obviously, a sustained period of strong economic
growth has allowed emerging economies to lift millions of people out of absolute
poverty; but, the benefits of strong economic growth have not been evenly
distributed and high levels of income inequality have risen further.

Thus, there is an evidence that income distribution and economic growth
both matter for poverty reduction and policies measures must be oriented in both
pro-poor and pro-growth spheres.
In response to the original questionings, a clear relationship between
growth, inequality and poverty is supported by existing empirical evidences. They
should never be considered separately but unlike, going hand in hand. Economic
growth is an essential tool to pursue poverty reduction but is, in itself, not
sufficient if the high levels of inequality continue to be persistent. Thus, the
economic growth should be pursued with equity and complemented by policies
that enable the poorest to fully participate in and benefit from the growth process.
Considering this latest aspect, policy makers should seek out and implement
policies and public actions that increase the benefits of growth to the poor rather
than to the rich.
However, empirical results show that developing countries which
experimented similar pro-poor growth policies have not always achieved the same
positive results. As well as developed countries, which joined the common
Organisation for Economic Cooperation and Development, have not always
achieved the similar rate of equality redistribution and social inclusion of their
citizens as the main result of economic growth. This means that each country
having different political and economic situation has to deal with specific internal
macroeconomic policies implemented by international pro-poor growth solutions.
What is clear is that policies oriented on inclusive growth are much more
than pro-poor growth: investment on education, health, gender equality and social
inclusion are the foundations for the sound economy. If the construction of these
foundations cannot be guaranteed, then the economic progress and technological
innovation will have a negative impact on the human well-being in long term.

References:
Abatemarco, A.: “Evaluating economic mobility under opportunity egalitarianism”, ECINEQ WP, No 396, (2016). Abatemarco, A.: “Doing Rawls Justice: Evidence from the PSID”, Economics Discussion Papers, No 38: 2-11, Kiel Institute for the World Economy (2016). Abatemarco, A. and Stroffolini, F.: “The economics of justice as fairness”, ECINEQ WP, No 430, (2017). Atkinson, A.: “On the measurement of poverty”, EconoPapers, Vol 55, Issue 4: 749-64 (1987). Bourguignon, F.: “The Poverty-Growth-Inequality Triangle”, The World Bank, (2003). Causa, O., S. Araujo, A. Cavaciuti, N. Ruiz and Z. Smidova: “Economic Growth from the Household Perspective: GDP and Income Distribution Developments Across OECD Countries”, OECD Economics Department Working Papers, No. 1111, OECD Publishing, Paris (2014). Cord L., Lopez J. H., and Page J.: “When I use a word…” Pro-poor growth and poverty reduction”, The World Bank, No 1, (2003). Cord, L.: “Promoting Pro-Poor Growth: Lessons from country experiences”, Poverty in Focus- International Poverty Centre, 10-12, (2007). Fan, S., Gulati, A., and Thorat, S.: “Investment, subsidies, and pro‐poor growth in rural India”, Agricultural Economics, No 39(2): 163-170, (2008). Foster, J. and Shorrocks, A.: “Poverty Ordering”, Econometrica, Vo 56, Issue 1: 173-17 (1988). Galor, O. and Moav, O.: “From Physical to Human Capital Accumulation: Inequality and the Process of Development”, Review of Economic Studies, No 71: 1001-1026 (2004). Grosse M., Harttgen K. and Klasen S.: “Measuring Pro-Poor Growth in Non-Income Dimensions”, World Development Vol. 36, No.6: 1021–1047 (2008). Kakwani, N. and Pernia, M.: “What is Pro-poor Growth?”, Asian Development Review, Vol 18: 2-5, (2000). Kakwani, N., Khandker, S. and Son, H.: “Pro-poor growth: concepts and measurement with country case studies”, UNDP - International Poverty Centre, No 1: 1-28, (2004).

Kakwani, N. and Son, H. H.: “Poverty equivalent growth rate”, Review of Income and Wealth, Series 54, No 4, (2008). Klasen, S.: http://www.economics-ejournal.org/economics/journalarticles/2012-7/references/Klasen2004. Kraay, A.: “When Is Growth Pro-Poor? Cross-Country Evidence”, MF Working Paper, WP/04/47 (2004). Lopez, J. H.: “Pro-poor growth: a review of what we know (and of what we don't)”, The World Bank (PRMPR), (2004). Martin, J. P. and Förster, M.: “Inequality in OECD countries: the facts and policies to curb it”, Insights Melbourne business and Economics, Vo 15: 5-13, (2014). McCulloch, N. and Baulch, B.: “Tracking Pro-poor Growth”, ID21 Insights No. 31, Institute of Development Studies, (2000). OECD: “Rising to the Global Challenge: Partnership for Reducing World Poverty”, 1-123 (2001). OECD: “Promoting Pro-Poor Growth: Key Policy Messages”, (2006). OECD: “Growing Unequal? Income Distribution and Poverty in OECD countries”, (2008). OECD: “Divided We Stand: Why Inequality Keeps Rising”, (2011). OECD: “An Overview of Growing Income Inequalities in OECD Countries: Main Findings”, (2011). OECD: “Top incomes and taxation in OECD countries: Was the crisis a game changer?”, (2014). OECD: “Growth and income inequality: trends and policy implications”, OECD Economics Department Policy Notes, No. 26 (2015). Pasha, H. A.: “Pro-poor policies”, UNDP website, (2002). Ramos, R. A., Ranieri, R. and Lammens J.: “Mapping Inclusive Growth”, International Policy Centre for Inclusive Growth (IPC-IG), Working Paper No 105: 1-15, (2013). Ravallion, M. and Datt, G.: “Why has economic growth been more pro-poor in some states of India than others?”, Journal of development economics, No 68(2): 381-400, (2002). Ravallion, M. and Chen., S.: “Measuring Pro-Poor Growth”, Economics Letters, No 78: 93-99 (2003). Ravallion, M.: “Pro-Poor Growth: A Primer”, Development Research Group, The World Bank, (2004). Rawls, J.: “Theory of Justice”, Massachusetts: Harvard University Press, (1971).

Rawls, J.: “Fairness to goodness”, The Philosophical Review, No 84: 536-554, (1975). Rawls, J.: “Justice as Fairness: A Restatement”, E. Kelly (ed.), Cambridge, MA: Harvard University Press (2001). Sen, A.: “Poverty: An Ordinal Approach to Measurement”, Econometrica, Vol. 44, No. 2 (1976). Sen, A.: “Poor, relatively speaking”, Oxford Economic Papers, No. 35, (1983). Son H. H.: “A note on pro-poor growth”, Economics Letters, Vol. 82, Issue 3: 307-314 (2004). United Nations: “A Better World for All”, New York, (2000). United Nations: “The Millennium Development Goals Report”, New York, (2015). Zaman K., Khan M. M. and Ahmad, M.: “Assessing the Poverty Bias of Growth in Agriculture Sector: Evidence from Pakistan”, International Journal of Trade, Economics and Finance, Vol.1, No.3: 303-308, (2010). Zorgui I, Ayed H. and Jaouadi, S.: “Assessment of the Impact of Pro-Poor Growth on Poverty in Developing Countries”, Business and Economic Research, ISSN 2162-4860, Vol. 6, No. 2, (2016). World Bank: “World Development Report”, New York: Oxford University Press, (2000). World Bank: “Poverty and Shared Prosperity 2016: Taking on Inequality”, The World Bank Group: 1-193, (2016).