pro-poor growth and policies - undp - united nations
TRANSCRIPT

Pro-Poor Growth and Policies: The Asian Experience
Hafiz A. PashaT. Palanivel

Pro-Poor Growth and Policies: The Asian Experience
Copyright © 2004, Asia-Pacific Regional Programme on theMacroeconomics of Poverty Reduction, United Nations DevelopmentProgramme.
This publication presents some of the principal findings from theUNDP’s Asia-Pacific Regional Programme on the Macroeconomicsof Poverty Reduction.
Hafiz A. Pasha is the UN Assistant Secretary General and AssistantAdministrator & Regional Director of the Bureau for Asia and thePacific, UNDP. T. Palanivel is the Programme Coordinator of theUNDP’s Asia-Pacific Regional Programme on Macroeconomics ofPoverty Reduction.
DISCLAIMERThe responsibility for opinions in this publication rests solely withits authors. Publication does not constitute an endoresment bythe United Nations Development Programme or the institutions ofthe United Nations system.
Design and Layout by the printhousePrinted by Jagadamba Press
ii

List of Figures iii
List of Tables iv
1. Introduction 1
2. Growth, Inequality and Poverty Reduction 5
3. Macroeconomic Determinants of Pro-Poor Growth 13
4. Pro-Poor Policies 24
5. Conclusion 35
Statistical Appendix 37
Annex 1 48
References 51
FIGURES
1. The Methodological Framework 4
2. Scatter Diagram: Relationship between Changes inIncidence of Poverty (%) and per Capita IncomeGrowth (%) 7
TABLE OF CONTENTS
iii

Pro-Poor Growth and Policies: The Asian Experience
iv
TABLES
1. Rates of Per Capita Income Growth andChanges in Incidence of Poverty in SampleCountries in Different Decades (%) 6
2. Relationship Between Economic Growth andPoverty (%) 8
3. Growth Elasticity of Poverty in DifferentCountries in Different Decades 9
4. Relationship between Economic Growth,Inequality and Poverty (%) 11
5. Economic Growth, Inflation and Poverty (%) 156. Economic Growth, Employment and Poverty (%) 187. Economic Growth, Agricultural Development and
Poverty (%) 208. Economic Growth, Exports and Poverty (%) 22
A-1 Incidence of Poverty in Different Years Accordingto National Poverty Line (% of population) 39
A-2 Level of Inequality in Sample Countries inDifferent Years (Gini Coefficient %) 40
A-3 Rate of Inflation in Sample Countries inDifferent Decades (%) 41
A-4 Rate of Employment Growth in SampleCountries in Different Decades (%) 42
A-5 Rate of Agricultural Growth in SampleCountries in Different Decades (%) 43
A-6 Rate of Export Growth in Sample Countriesin Different Decades (%) 44
A-7 Revenues, Expenditures and Fiscal Deficitsin Sample Countries in Different Decades (%) 45
A-8 Growth in Money Supply and Real Rate ofInterest Rates in Sample Countries inDifferent Decades (%) 46
A-9 Rate of Real Depreciation in Exchange Rateand Average Tariffs in Sample Countries (%) 47
B-1 Direction of Changes in Incidence of PovertyAccording to Different Measures 50

1.INTRODUCTION
The relationship between economic growth and the change
in the incidence of poverty is both complex and multi-dimensional.
An understanding of this relationship and its underlying
determinants is the key to the formulation of successful
poverty reduction strategies. If it can be demonstrated
that fast economic growth is always accompanied by rapid
poverty reduction, as a result of the ‘trickle-down’ effect, then
such strategies can focus, more or less, exclusively on
achieving faster growth. However, if this is not necessarily the
case, then the pursuit of growth will have to be combined with an
effort at achieving more pro-poor growth through a degree of
redistribution of assets and incomes in the economy. This would
have significant implications on the nature of anti-poverty
strategies.
A number of studies have attempted to analyze the relationship
between economic growth and poverty incidence across countries
and time periods (see Ravallion and Chen (1997), Bruno, Ravallion
and Squire (1998) and Adams (2003)). It has been estimated that,
on average, a one percentage point increase in the rate of per
capita income growth can produce up to a two percent decrease
in the proportion of people living below the poverty line, subject,
of course to the process of income change being distribution-
neutral in character. But inequality has tended to change in most
1

Pro-Poor Growth and Policies: The Asian Experience
situations and some countries have experienced limited poverty
reduction despite impressive growth performance, while others
have managed to decrease poverty significantly despite relatively
low growth.
The experience of Asian countries in this regard is mixed.
Countries of East Asia have managed an exceptionally high
average growth rate of per capita income of 6.4 percent, in the
90’s, while the corresponding growth rate for the group of South
Asian countries is 3.2 percent. The incidence of poverty has declined
sharply in the former sub-region by 6.8 percent annually,
whereas the rate of decline in South Asia has been relatively
modest at about 2.4 percent. For the region as a whole, a one
percentage point increase in the growth rate of per capita
income has translated into only a 0.9 percent decline in the
incidence of poverty. Clearly, inequality as a whole has worsened
in the region during the 90’s, and while it has been successful
in achieving high rates of economic growth, gains with regard to
poverty reduction have been limited by the absence of
pro-poor growth.
The Millennium Development Goals of the United Nations have
committed the world to reducing the incidence of poverty by half
by 2015 (in relation to the base year level of 1990). This
implies that poverty will have to fall by about three percent
per annum for the target to be achieved. If progress
during the 90’s is any guide, East Asia has already met this target;
subject to no reversals in future years, but South Asia is expected
to achieve the target of halving poverty by 2015. It needs to be
emphasized, however, that much of the breakthrough of
East Asia is due to the remarkable strides made by China in
poverty reduction. On the contrary, many countries of
East Asia have also fallen behind in terms of achieving the poverty
reduction target.
2

The decade of the 90’s has also witnessed qualitative changes in
the growth process, which could have a vital bearing on the
relationship with poverty reduction. Some countries have just
begun the transition from a highly centrally planned to a market
economy while others have reached a fairly mature stage in this
process. Many countries have started or intensified the
implementation of various structural economic reforms, sometimes
under the aegis of an IMF/World Bank structural adjustment
program or poverty reduction and growth facility (PRGF), which
have included trade liberalization, financial sector reform,
privatisation, deregulation and removal of restrictions on foreign
private investment. While these changes may have resulted in
faster economic growth it is not clear what the consequences have
been on the rate of poverty reduction. In some countries, like
Pakistan, Philippines and Sri Lanka, the process of poverty reduction
has visibly slowed down. In others, periods of political or economic
crises (like the East Asian financial crisis) have contributed to cases
of rising poverty.1
The objective of this paper is to assemble on a systematic basis
the available data on Asian countries and then analyse the
relationship between growth and poverty on a long-term basis.
Section 2 presents the trends in growth, income inequality and
poverty incidence for different countries and different periods.
These trends reveal the substantial variation in the relationship
between growth and poverty, which is then explained on the basis
of changes in the level of inequality. Section 3 studies the role of
different potential macroeconomic determinants of poverty in the
Asian context on the basis of simple statistical techniques.2 Section
4 analyses the impact of different types of policies on the proximate
determinants of poverty and highlights how different Asian
countries have operated within the policy trade-offs with respect
to poverty. Finally, Section 5 provides some concluding
observations.
Introduction
3

Pro-Poor Growth and Policies: The Asian Experience
Figure 1 highlights in schematic fashion the methodological
approach adopted in the paper. According to this framework, various
policies impact on macroeconomic determinants of poverty, with
inflation likely to cause an increase in poverty, while income and
employment growth expected to mitigate against poverty. A successful
policy is one that operates on the right side of this trade off.
4
Figure 1THE METHODOLOGICAL FRAMEWORK
POVERTY
PROXIMATE
MACROECONOMIC-I
DETERMINANTS
POLICIES
INFLATION (+)
INCOME /
SECTORAL
GROWTH (-)
EMPLOYMENT (-)
FISCAL
MONETARY /
FINANCIAL
SECTOR
TRADE /
FOREIGN
EXCHANGE
OTHERS

2.GROWTH, INEQUALITY
AND POVERTY REDUCTION
Before we quantify the relationship between growth and poverty
in different settings, we proceed to describe the data. The sample
consists of nine countries from East Asia (Cambodia, China,
Indonesia, Lao PDR, Malaysia, Mongolia, Philippines, Thailand, and
Vietnam) and five from South Asia (Bangladesh, India,
Nepal, Pakistan and Sri Lanka). These countries account for 97
percent of the population and 77 percent of the gross national
income of the whole of Asia and the Pacific. For all these countries
data is available for the 90’s, in most cases for the 80’s and in
some cases for the 70’s. Changes are measured over the decades
to remove the impact of random factors and to identify the
underlying long-term relationships. Altogether, we are able to
observe 32 ‘cases’, where a particular case relates to a particular
country over a particular decade. 14 cases are for the 90’s, 10 for
the 80’s and 8 for the 70’s.
Poverty estimates, based on national poverty lines, are used in the
analysis. (For the justification behind using national poverty estimates
rather than those based on the international poverty line of US $ 1
PPP per capita per day, see annex I). These estimates are given in
Table A-1 in the statistical appendix. Annual rates of change in the
incidence of poverty are computed by decade and presented along
with the rate of per capita income growth in Table 1. It is interesting
to note that out of the 32 cases on which data is available, there are
5
Pro-Poor Growth and Policies: The Asian Experience
only nine cases in which poverty increased. This testifies to the
success of Asian countries in reducing poverty, on average,
during the last three decades. It is, significant to note, however,
that most of the cases of increasing poverty are concentrated in the
90’s. This indicates greater variability in performance of countries
with regard to poverty reduction during the last decade.
6
Table 1RATES OF PER CAPITA INCOME GROWTH AND CHANGE IN
INCIDENCEOF POVERTY IN SAMPLE COUNTRIES INDIFFERENT DECADES (%)
Sources: (i) Rate of Per Capita Income Growth: World Bank (2003), WorldDevelopment Indicators. (ii) Rate of Poverty Incidence: from Table A-1(Statistical Appendix)
Country Rate of Rate of Rate of Rate of Rate of Rate ofPer Change Per Change in Per Change in
Capita in Capita Incidence Capita IncidenceIncome Incidence Income of Poverty Income of PovertyGrowth of Poverty Growth Growth
Cambodia - - - - 2.4 5.5
Bangladesh - - 2.2 -0.6 3.0 -2.4
China 4.4 -0.8 7.8 -9.8 9.0 -9.8
India 0.8 -1.7 3.6 -2.2 3.6 -2.8
Indonesia 5.4 -7.2 4.5 -6.1 2.9 2.1
Lao PDR - - - - 3.7 -5.1
Malaysia 5.3 -6.7 3.1 -4.2 4.6 2.9
Mongolia - - - - -1.2 13.1
Nepal - - 2.5 0.8 2.6 0.7
Pakistan 1.5 -4.1 3.5 -1.3 1.4 2.8
Philippines 3.1 -0.2 -0.6 -4.5 0.6 -1.3
Sri Lanka 2.7 -0.8 3.1 -7.1 3.9 4.8
Thailand 4.1 -4.2 6.0 0.6 3.7 -2.3
Vietnam - - - - 5.8 -6.9
1970’s 1980’s 1990’s

The strong relationship between growth and change in poverty is
demonstrated by the fact that the fastest growing country, China
(in the 80’s and 90’s), has shown the highest rate of decline in
poverty while the slowest growing country, Mongolia (in the 90’s),
has experienced the largest rate of increase in poverty. In between,
however, there appears to be much heterogeneity in the
relationship, as revealed by the scatter diagram in Figure 2. There
are countries, on the one hand, which despite showing only modest
growth or even decline in per capita income were able to bring
down poverty in particular periods. Examples of this are India (in
the 70’s) and Philippines (in the 80’s and 90’s). On the other hand,
we observe cases where countries were unable to reduce poverty
Growth, Inequality and Poverty Reduction
7
Figure 2: Scatter DiagramRELATIONSHIP BETWEEN CHANGE IN INCIDENCE OF
POVERTY (%) AND PER CAPITA INCOME GROWTH (%)
Change i
n I
nci
dence
of
Povert
y (
%)
Per Capita Income Growth (%)
20
10
0
-10
-20-2 0 2 4 6 8 10

Pro-Poor Growth and Policies: The Asian Experience
despite achieving fairly high rates of growth in per capita income.
Thailand (in the 80’s), Malaysia (in the 90’s) and Sri Lanka (in the
90’s) are examples of such a failure. However, in the latter two
cases the rise in poverty could be attributed to prevailing economic
or political crises.
In order to focus on the underlying relationship between growth
and poverty and to remove the effect of individual country
variations, we categorize the cases into two types, on the basis
of growth rate of per capita income (above or below 3.5 percent)3.
29 cases have been included in the analysis. Three cases have
been excluded because of economic or political crisis during these
periods.4 The objective is to focus on the long-term relationship
between growth and poverty in a ‘normal’ development situation.
Results of this simple analysis are presented in Table 2. It appears
that in 13 cases of fast growth, the average rate of poverty
reduction per annum was 4.9 percent, whereas in cases of relatively
slow growth there was only a marginal decline in poverty of 0.4
8
Number Average Average Averageof Cases Rate of rate of Growth
Growth in Change in ElasticityPer Capita Incidence of
Income of PovertyPoverty
Fast Growth in PerCapita Income; 13 5.1 -4.9 -0.96(> 3.5% per annum)
Slow Growth inPer Capita Income; 16 1.9 -0.4 -0.21(≤ 3.5% per annum)
Table 2RELATIONSHIP BETWEEN ECONOMIC GROWTH AND
POVERTY (%)
Sources: Calculated from Table 1

percent. Clearly, on the average, there is a well-defined relationship
between growth and poverty reduction. It appears on the basis
of this relationship that, on average, countries will have to achieve
a growth rate in per capita income of about 3.5 percent if the MDG
target of halving poverty in 25 years is to be attained.
Perhaps, the best way to capture the intensity of the relationship
between economic growth and poverty is to compute the growth
elasticity of poverty. This indicates the percentage change in the
incidence of poverty associated with a one percent increase in per
capita income. Estimates of this elasticity for the sample countries
in different decades are given in Table 3. This Table demonstrates
a wide variation in the elasticity estimates.
Country 1970’s 1980’s 1990’s
Bangladesh - -0.29 -0.81
Cambodia - - 2.31
China -0.18 -1.26 -1.09
India -2.15 -0.60 -0.77
Indonesia -1.33 -1.35 0.72
Lao PDR - - -1.37
Malaysia -1.26 -1.36 0.63
Mongolia - - n.a
Nepal - 0.33 0.27
Pakistan -2.73 -0.38 2.01
Philippines -0.07 n.a -2.25
Sri Lanka -0.30 -2.28 1.24
Thailand -1.02 0.10 -0.63
Vietnam - - -1.18
Table 3GROWTH ELASTICITY OF POVERTY IN DIFFERENT
COUNTRIES IN DIFFERENT DECADES
Sources: Calculated from Table 1
Growth, Inequality and Poverty Reduction
9

Pro-Poor Growth and Policies: The Asian Experience
Three conclusions can be drawn from Table 3. First, the elasticity
is both positive and negative. Positive elasticities are generally
observed in cases where the growth of per capita income is low
and poverty has increased. Second, the elasticity tends to be more
negative in the case of countries, which experience faster growth.
For example, when China’s growth rate soared in the 80’s and
90’s, the elasticity became substantially more negative as
compared to the 70’s. Third, the elasticity appears to be
highly unstable in the case of individual countries over time. In the
case of Sri Lanka it has varied from –0.3 in the 70’s to –2.28
in the 80’s.
It is generally recognised that the extent to which the growth
elasticity of poverty is negative is a good measure of the degree
to which the growth process has been pro-poor. The basic question
that arises then is: what determines the magnitude of this
elasticity? Before we proceed to analyse what characteristics of
growth determine the degree to which it is pro-poor, we explore
the implications of changes in the level of inequality; trends in
which are shown in Table A-2. Clearly, for a given growth rate, the
implications for the level of poverty are likely to be more favourable
if there is simultaneously a reduction in inequality such that the
income of poor rises disproportionately in relation to the increase
in average income in the economy. Alternatively, if the trickle down
effect is weak and much of the gains in income are pre-empted by
relatively well-off households, then the impact on poverty is likely
to be limited.
Table 4 focuses on four types of cases. The first category consists
of cases in which a country experienced rapid growth, but
simultaneously witnessed a rise in income inequality. There are
nine such cases, mostly in East Asia, with the notable exception of
India in the 90’s. It appears that in these cases the process of
growth was robust enough to offset any negative consequence
10

on poverty of worsening inequality since the average rate of decline
in poverty was as high as 5.6 percent. Of particular interest is
what happened at the other extreme—when not only was growth
slow but there was also a rise in inequality. Countries in this situation
experienced on average an increase in poverty of close to one
percent per annum.
It is of significance to note that some countries have managed to
reduce poverty fairly rapidly even in periods of relatively slow
growth by ensuring that whatever gains ensue from this growth
accrue relatively more to the poorer segments of the population.
This is observed in five cases. For example, despite growth in per
capita income of about three percent, Malaysia and Sri-Lanka in
the 80’s were able to reduce poverty annually by as much as four
to seven percent due to falling inequality. It is not surprising that
high growth elasticities of poverty are observed in these cases.
Growth, Inequality and Poverty Reduction
11
Number Average rate Averageof Cases of Change Growth
inncidence Elasticityof Poverty of Poverty
Fast Growth in PerCapita Income; 9 -5.6 -1.06Rising Inequality
Fast Growth in PerCapita Income; 4 -3.1 -0.65Falling Inequality
Slow Growth in PerCapita Income; 11 0.7 0.41Rising Inequality
Slow Growth inPer Capita Income; 5 -2.7 -1.13Falling Inequality
Table 4RELATIONSHIP BETWEEN ECONOMIC GROWTH,
INEQUALITY AND POVERTY (%)
Sources: Data taken from Table 1 and Table A-2 (Statistical Appendix)

Pro-Poor Growth and Policies: The Asian Experience
A striking example of success in poverty reduction, despite slow
growth (of less than two percent) and rising inequality, is that of
Pakistan during the decade of 70’s. The largest negative value of
2.77 is observed in this case among the sample growth elasticities
of poverty. This decade witnessed a rapid increase in labour
migration of workers to the Middle East leading to a large and
growing inflow of home remittances. At home, there was a vigorous
expansion of the public sector, workers were given more rights
and living standards of the poor were raised through enhanced
budgetary outlays for subsidies on basic consumer items. However,
it has been argued that the poverty reduction strategy adopted
was fiscally unsustainable.
12

In the Asian context, the previous section has demonstrated that,
although there exists a strong relationship between growth and
poverty, this relationship is highly variable in character. We
proceed now to examine the impact of different macroeconomic
variables like the rate of inflation, employment growth, sectoral
pattern of growth, etc., on the intensity of the relationship between
growth and poverty. The approach adopted is to control for the
rate of growth, and then to see the impact of variation in magnitude
of a particular macroeconomic variable on the level of poverty.
INFLATION
It has been argued that inflation affects the poor directly
through a decline in their real wages owing to the short-run
rigidity of nominal wages. Also, if there are any savings, the poor
mostly hold it in liquid form. Inflation generally reduces the real
value of such holdings. If inflation is unanticipated, the poor will
be harmed disproportionately as they have weaker bargaining
power and are generally unable to hedge against inflation. On the
contrary, since the poor are frequently indebted, the real cost of
their debt falls with inflation. If the source of inflation is higher
food prices, then this could have an ambiguous impact on
the level of poverty. On the one hand, farmers who market their
surplus food production, benefit, but on the other hand, the
landless in rural areas and the urban poor are impacted adversely.
3.MACROECONOMIC DETERMINANTS
OF PRO-POOR GROWTH
13

Pro-Poor Growth and Policies: The Asian Experience
Empirical findings on the effect of inflation on poverty, after
controlling for the rate of economic growth, are, in fact, mixed.
Agenor (2002) finds a statistically insignificant relationship between
inflation rate and change in poverty. Recently, Epaulard (2003)
also shows that a high rate inflation (above 80%) is associated
with higher elasticity of poverty rate to any economic downturn.
Datt and Ravallion (2002), using panel data on poverty from Indian
states, show that inflation matters to India’s poor and attribute
this effect primarily to adverse shocks on the real wage of unskilled
labour.
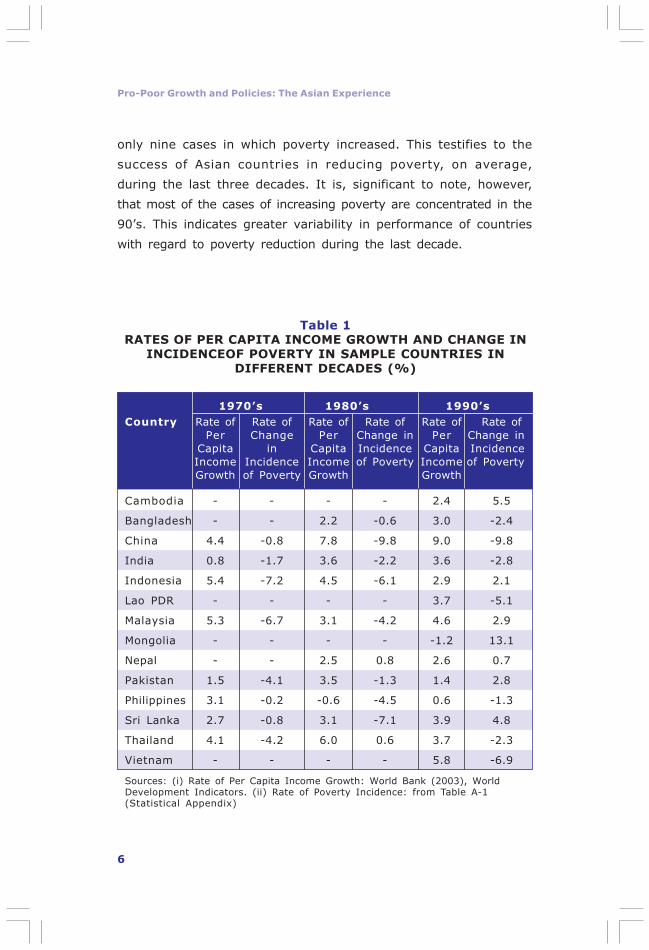
Table A-3 gives the rates of inflation in sample countries, while
Table 5 quantifies the average rate of change of poverty in different
types of cases. The first two types relate to periods of fast economic
growth, with the first type of cases also witnessing double-
digit rates of inflation and the second type having low rates
(single digit) of inflation. There are six cases of the first type and
seven of the second type. It is important to note that given this,
more or less, equal distribution, fast growth appears to be as
likely during periods of high inflation as low inflation. For example,
China achieved a per capita income growth of as high as
eight percent in the 80’s when the inflation rate approached 12
percent. Similarly, during the 70’s, the Indonesian economy
averaged a growth rate in per capita income of almost 5.5
percent in the presence of high inflation of almost 18 percent per
annum. Comparison of the average rates of decrease in the
incidence of poverty in the two types of cases reveals hardly any
difference.
We turn next to the other two types of cases, both corresponding
to situations of slow economic growth. In seven cases, slow growth
was accompanied by low inflation while in nine cases there was
high inflation. Here again, we find that once the growth effect on
poverty is controlled for, inflation does not really matter. Overall,
14
6 15.4 -5.0 -1.04
7 6.2 -4.8 -0.89
7 19.8 0.1 0.07
9 7.0 -0.7 -0.30
Table 5ECONOMIC GROWTH, INFLATION AND POVERTY (%)
Number Average Average Averageof Cases Rate of rate of Growth
Inflation Change in ElasticityIncidence of
of PovertyPoverty
Fast Growth in PerCapita Income;High Rate ofInflation (≥ 10%)
Fast Growth in PerCapita Income;Low Rate ofInflation (<10%)
Slow Growth inPer Capita Income;High Rate ofInflation
Slow Growth in PerCapita Income;Low Rate ofInflation
Sources: Calculated from Table 1 and Table A-3 (Statistical Appendix)
the direct effect on the incidence of poverty of inflation does not
appear to be significant in the Asian context, within the range of
rates of inflation experienced. This is in line with the findings of
Agenor (2002) and Epaulard (2003).
The lack of sensitivity of poverty to inflation is one of the potentially
more important findings of the paper. It highlights that the trade-
off faced by policies, fiscal or monetary, between growth and
inflation from the viewpoint of impact of poverty is not as severe
as has traditionally been thought. It appears that to the extent
expansionary policies are resorted to with the objective of
stimulating the process of growth, then any resulting inflation is
Macroeconomic Determinants of Pro-Poor Growth
15
Pro-Poor Growth and Policies: The Asian Experience
likely to be less damaging on poverty. This clearly strengthens the
case for pursuing expansionary fiscal and monetary policies at a
time when space already exists, as inflation rates are currently
low throughout the region.
EMPLOYMENT GROWTH
Employment is one of the main channels through which the link
between economic growth and poverty reduction is established.
As the level of income is the key determinant of poverty and as
productive employment is the principal source of income, expanding
gainful employment opportunities has to be a major element in
the strategy of poverty reduction. This might be called the
‘employment nexus’ between growth and poverty. Unfortunately,
the growth—employment—poverty linkage has not been
adequately recognised in the pro-poor debate.
Clearly, employment growth depends upon the growth of the
economy. However, empirically a wide variation is observed in this
relationship. The rate of employment growth is also influenced by
the sectoral composition of economic growth, the choice of
technology and the degree of effective functioning of the labour
market. If economic growth is concentrated in sectors in
which most of the poor work, then this is likely to have a positive
impact on poverty reduction. Also, if the process of trade
liberalization leads to greater openness of the economy, the net
impact on employment opportunities depends on how far
employment is gained or lost in shifting resources from the non-
tradable to the tradable sectors.
Based on the data available, we test whether employment growth
has any impact on the change in poverty, independently of the
effect of economic growth on poverty. Table A-4 gives the rate of
employment growth in sample countries. As before, we distinguish
four types of cases depending upon the rate of growth of per
16

capita income (fast or slow) and the rate of employment growth
(fast or slow). There is substantial variation in the rate of
employment growth. For example, the growth rate of the Chinese
economy was higher in the 90’s in relation to the 80’s, but while
employment grew at almost 5 percent in the latter period, it
increased by only 1 percent during the 90’s, despite faster growth.
As opposed to this, in the presence of relatively slow growth, Sri
Lanka was able to achieve almost a 4 percent growth in
employment during the 80’s.
Results of the analysis presented in Table 6 clearly demonstrate
the importance of employment growth in influencing the rate of
change in the incidence of poverty, after controlling for the effects
of economic growth on poverty. In the seven cases where both
rapid economic and employment growth was observed, the average
rate of decline was close to 5.5 percent, whereas in the six cases
where fast growth was accompanied by relatively slow employment
growth, the rate of fall in poverty was 4.2 percent. The importance
of employment growth in contributing to poverty reduction appears
to be even more pronounced in situations where the overall pace
of economic growth is slow. We observe seven cases where
employment growth in excess of 2.5 percent per annum was
achieved despite a growth in per capita income of less than 3.5
percent. Poverty declined on the average in these cases by 2
percent. As opposed to this, in the nine cases of both slow economic
and employment growth, poverty increased on an average by
almost 1 percent per annum. These results represent a strong
confirmation of the view that employment growth is a key element
in pro-poor growth.
AGRICULTURAL GROWTH
There is a substantial body of literature that argues that it is not
only the overall growth that matters for poverty reduction, but
that the pattern of growth also matters (see Ravallion (2001),
Macroeconomic Determinants of Pro-Poor Growth
17

Pro-Poor Growth and Policies: The Asian Experience
18
Datt and Ravallion (2002)). In particular, since bulk of the poverty
is rural in character, agricultural growth has a crucial role to play in
the process of poverty reduction, through both its direct effect
within the rural economy and through the spill over effects on the
urban economy. Very few countries in the world have experienced
rapid and sustained growth without agricultural growth either
preceding or accompanying it. As highlighted by the UNDP Global
Human Development Report (1997), strong agricultural growth has
been a feature of countries that have successfully reduced poverty
at different times. We test, therefore, for the direct effect of
agricultural growth after controlling for the overall rate of growth.
Table 6ECONOMIC GROWTH, EMPLOYMENT AND POVERTY (%)
Number Average Average Averageof Cases Rate of rate of Growth
Inflation Change in ElasticityIncidence of
of PovertyPoverty
Fast Growth in PerCapita Income;Rapid Employment 7 3.3 -5.4 -1.02Expansion (≥ 2.5%per annum)
Fast Growth in PerCapita Income;Slow Employment 6 1.8 -4.2 -0.84Expansion (<2.5%per annum)
Slow Growth inPer Capita Income;Rapid EmploymentExpansion
Slow Growth in PerCapita Income;Slow EmploymentExpansion
Sources: Calculated from Table 1 and Table A-4 (Statistical Appendix)
7 3.1 -2.0 -0.91
9 1.8 0.9 0.53

The hypothesis is that for the same rate of economic growth, the
impact on poverty is likely to be more pronounced the faster the
rate of agricultural growth.
Table A-5 gives the rate of agricultural growth in sample countries.
It is interesting to note that in ten cases where rapid agricultural
growth occurred along with overall rapid economic growth, poverty
fell sharply in all these cases, by almost 6 percent per annum, as
shown in Table 7. As opposed to this, in the three cases where
agriculture lagged behind other sectors in achieving rapid growth,
the performance with respect to poverty reduction was more
modest, at about 2 percent per annum. The evidence points to
the fact that progress in bringing down poverty was retarded (China
in the 70’s, India during the 80’s and 90’s and Thailand in the
90’s) due to slow progress of agriculture during these periods.
We also observe seven cases where although the overall growth
performance was relatively poor, agriculture performed strongly,
showing a growth rate in excess of 3 percent. On average, in these
cases, the rate of decline in poverty was 0.7 percent per annum.
Of particular significance is the fact that although the agricultural
sector of Pakistan has done exceptionally well during the last two
decades, it has not made a significant dent on rural poverty in the
country, and thereby on poverty overall. In a recent paper, Sohail
Malik (2003) has argued that this is due to a number of reasons,
such as the high level of inequality, the lack of non-farm
employment opportunities and a decline in the real wages of the
rural poor as mechanization has reduced labour demand. In the
nine cases of both slow economic and agricultural growth, poverty
incidence remained stagnant.
EXPORT GROWTH
The relationship between trade liberalization, as reflected
by a greater emphasis on seeking export markets, and
Macroeconomic Determinants of Pro-Poor Growth
19

Pro-Poor Growth and Policies: The Asian Experience
poverty reduction and inequality both within countries and
at the global level, has been one of the most prominent elements
of the current debate on pro-poor growth. This debate is reflected
in a study published by the WTO Secretariat in 2000 on Trade,
Income Disparity and Poverty. While there is generally a consensus
that expansion of exports can contribute to faster economic growth,
there is less clarity on the direct impact of exports on poverty,
once we control for the overall rate of growth.
20
Table 7ECONOMIC GROWTH, AGRICULTURAL DEVELOPMENT AND
POVERTY (%)
Number Average Average Averageof Cases Rate of rate of Growth
Agri- Change in Elasticitycultural Incidence ofGrowth of Poverty
Poverty
Fast Growth in PerCapita Income;Rapid Agricultural 10 4.4 -5.7 -1.04Development(≥ 3% per annum)
Fast Growth in PerCapita Income;Slow Agricultural 3 2.5 -2.0 -0.51Development(<3% per annum)
Slow Growth inPer Capita Income;Rapid AgriculturalDevelopment
Slow Growth in PerCapita Income;Slow AgriculturalDevelopment
Sources: Calculated from Table 1 and Table A-5 (Statistical Appendix)
7 3.9 -0.7 -0.26
9 2.1 -0.1 -0.08

In a comprehensive paper, Alan Winters (2000) identifies several
key linkages between trade liberalization and poverty. He highlights
the fact that trade tends to alter relative product and factor prices,
so its net effect on poverty reduction depends also on the signs of
these relative product and factor price changes. For example, if
exports are primarily of labor-intensive manufactures, then they
could bid up the relative wages of unskilled and semi-skilled labor,
thereby contributing to poverty alleviation. This appears to be the
experience of East Asia in earlier decades. However, during the
90’s, trade liberalisation seems to have led to the emergence of
urban ‘enclaves’, with beneficiaries consisting primarily of those
directly involved in export activities and the limited auxiliary service
functions that developed around these activities. For example,
information technology exports from India and exports of garments
from countries such as Bangladesh and Cambodia have remained
restricted to a few urban centers. In the case of Bangladesh and
Combodia, exports have not contributed much to value added
because of high import content. The absence of backward and
forward linkages has meant that the employment generation due
to export expansion has not been significant.
Table A-6 gives the rate of export growth in sample
countries. Here again, we distinguish among four types of
cases depending upon the rate of economic growth
(fast or slow) and rate of expansion of exports (fast or slow).
For fast growing countries, the rate of poverty reduction
appears to be mildly sensitive to export performance, as
shown in Table 8. However, a counter-intuitive result is
that among cases of slow growth, greater buoyancy of
exports can actually contribute to a lower rate of reduction
of poverty.
Nonetheless, our findings on the impact of export
performance on poverty is in line with some recent empirical
Macroeconomic Determinants of Pro-Poor Growth
21

Pro-Poor Growth and Policies: The Asian Experience
studies. For example, studies such as Agenor (2002), Ghura
et al (2002), Epaulard (2003) find that, once the effect of
overall income has been taken into account, trade openness
has no significant direct influence on poverty incidence or
on the income of the poor or on the elasticity of the poverty
with respect to growth. Overall, it appears that export
growth does not have a significant direct impact on poverty. Its
effect has to be seen primarily via its bearing on the overall rate of
economic growth. Therefore, exports cannot be said to play a
significant role in influencing the extent to which the process of growth
is pro-poor or not.
22
Table 8ECONOMIC GROWTH, EXPORTS ANDPOVERTY (%)
Number Average Average Averageof Cases Rate of rate of Growth
Export Change in ElasticityGrowth Incidence of Poverty
of Poverty
Fast Growth of PerCapita Income;Rapid Export 7 15.9 -5.2 -0.91Expansion(≥ 10% per annum)
Fast Growth in PerCapita Income;Slow Export 6 7.0 -4.5 -0.98Expansion(<10% per annum)
Slow Growth inPer Capita Income;Rapid ExportExpansion
Slow Growth in PerCapita Income;Slow ExportExpansion
Sources: Calculated from Table 1 and Table A-6 (Statistical Appendix)
7 12.9 -0.1 -0.04
9 5.8 -0.6 -0.33

Macroeconomic Determinants of Pro-Poor Growth
23
Based on the above analysis, it appears that the key
macroeconomic determinants of the degree of pro-poor growth
are employment growth and agricultural growth. Inflation, at least
up to a certain rate, does not seem to matter in negatively
impacting on poverty while the role of exports is essentially indirect
through its contribution to the overall rate of economic growth.
Altogether, a successful poverty reduction strategy will need to
focus on achieving a high and sustainable rate of economic growth,
with such growth possessing two key characteristics: high rate of
employment generation and rapid agricultural growth5. These
appear to be the key conclusions drawn from the Asian experience
vis-a-vis poverty reduction during the last three decades6.

Pro-Poor Growth and Policies: The Asian Experience
We turn now to the role of policies in influencing the magnitude of
macroeconomic determinants of growth and the extent to which it
is pro-poor. The empirical analysis in the previous section has
demonstrated that from the viewpoint of poverty reduction in Asia
the stance of policies can be oriented more towards faster economic
growth rather than lowering of inflation within the overall inflation-
growth trade-off. Apparently, poverty in the region is more sensitive
to the rise in real income than prices. This is an important finding
and indicates that in the stabilization versus growth debate, the
‘Washington Consensus’ view is at one extreme and, by and large,
countries can be more flexible in their policy posture with regard
to the adoption of more growth oriented policies.
Examination of the change in policy stance of the Asian countries
during the 90’s in relation to the 80’s yields some important
conclusions:
i) The size of the fiscal deficit (as a percentage of the GDP) has
fallen in most of the sample countries, with the exceptions of
Cambodia, Lao PDR, India and Thailand (in the second half of
the 90’s), as shown in Table A-7. However, the path to fiscal
adjustment has been achieved in different ways. Some
countries such as Bangladesh and Philippines have opted to
use part of their revenue gains to bring down their fiscal deficit
4.PRO-POOR POLICIES
24
and the remaining part to raise the level of public expenditure.
Nepal and Vietnam have managed large increases in the
revenue to GDP ratio, but have combined this with a
containment of public expenditure to achieve significant lowering
of the fiscal deficit.
There has been a visible slackening of resource mobilization
effort in a number of countries including Indonesia, Malaysia,
Pakistan and Sri Lanka. These countries have been compelled
to make major cutbacks in public expenditure in order to contain
the fiscal deficit. In the case of Pakistan and Sri Lanka, capital
expenditure as a percentage of the GDP has fallen by almost a
factor of one-half. It is likely that in such cases fiscal policy has
exerted a strong negative influence on the process of growth.
ii) Monetary policy has tended to be less expansionary in the
majority of the sample countries. In relation to the 80’s, the
rate of expansion in money supply has been lower or, more or
less, the same during the 90’s, with the exception of Malaysia,
Pakistan and Sri Lanka, as shown in Table A-8. Consequently,
real interest rates have been high, and have shown a tendency
only in recent years to fall sharply. The tightening of monetary
policy throughout the region appears to have been largely
motivated by the objective of containing inflation and the need
to avoid any balance of payment difficulties. It is, therefore not
surprising that inflation rates have been lower in the majority
of sample countries in the 90’s (see Table A-3). Two countries,
Indonesia and Pakistan, have experienced higher inflation,
arising in the latter case from the pressure exerted on the
money supply by runaway government borrowing in the
first half of the decade. In the case of Indonesia, inflation
spiralled in the aftermath of the East Asian financial crisis, as
the GDP plummeted and the exchange rate depreciated
significantly.
25
Pro-Poor Policies

Pro-Poor Growth and Policies: The Asian Experience
iii) There has been much more action during the 90’s in the area
of trade liberalisation and exchange rate policies. Import tariffs,
on average, at the end of the decade are one-sixth the level
prevailing at the beginning of the decade in Bangladesh, about
one-half in India, and one-third in Pakistan and Thailand, one-
fifth in Philippines, and so on. Simultaneously, most countries
have operated a managed floating exchange rate regime and
allowed their currency to depreciate in real terms at a faster
rate than in the 80’s with the exception of Bangladesh, China,
and Philippines, as shown in Table A-9. The objective clearly
was to stimulate exports and limit the size of any trade
deficit. Most countries did, in fact, experience an upsurge in
exports. For example, the growth rate of exports in countries
such as India, Philippines and Vietnam more than doubled. A
relative stagnation of exports was observed only in the case
of Pakistan.
What are likely to have been the implications of these policy
choices on the level of poverty in the region? South Asia, as a
whole, grew somewhat less rapidly that it did in the 80’s. East
Asia did show faster growth, but due primarily to the exceptional
growth performance of China, while other countries like
Indonesia and Thailand, which were impacted by the East Asian
financial crisis, experienced a significant decline in growth. Part
of the fall in growth rates is clearly due to a resort to
contractionary fiscal and monetary policies in pursuit of
stabilisation. Another key development was the change in
sources of growth, arising from the shift in emphasis from raising
domestic demand through fiscal and monetary stimuli towards
tapping into foreign demand, through exports, by adopting
aggressive trade and exchange rate policies.
On balance, the mix of policies does not appear to have been
pro-poor. The sacrifice of growth in pursuit of macroeconomic
26

stability, implied by a lower rate of inflation, has diminished the
impact on poverty. Export buoyancy has certainly contributed
to faster growth, thereby indirectly resulting in lowering poverty.
However, as demonstrated earlier, exports have not done much
directly to alleviate poverty, in fact, they may even have
exacerbated it. This is primarily due to the failure of exports to
stimulate faster growth of employment. Exports of manufactures
from the region grew rapidly in the 90’s and this contributed to
the fast growth of the industrial sector; employment, however
in this sector, failed to respond. A classic example of such a
failure is observed in the case of Bangladesh. Exports from
this country, mostly of manufactured goods like garments, grew
by almost 12 percent per annum in the 90’s and the industrial
sector expanded at the rate of 7 percent, but industrial
employment fell by close to 4 percent.
Given that fiscal deficits have fallen in most countries and
interest rates have shown a tendency to decline recently, while
foreign exchange reserves have generally tended to go up in
the region, there is a strong case for providing a fiscal stimulus
to achieve faster growth. Such a stimulus is unlikely to ignite
inflationary pressures at a time when inflation rates are
generally down to low single digit levels, as shown in Table A-
3. A modest enhancement in the inflation rate is unlikely to
have adverse consequences on poverty as demonstrated in
the previous section.
The fiscal stimulus should come in the form of a boast to public
investment, which has been curtailed in many countries during
the 90’s. Such public investment should be used for human
development and physical infrastructure of direct benefit to the
poor. The allegation that higher public investment could ‘crowd
out’ private investment is not borne out by the facts. In many
countries of the region buoyant private investment has gone
Pro-Poor Policies
27
Pro-Poor Growth and Policies: The Asian Experience
hand in hand with major increases in public investment.
The best examples of this complementary relationship are seen
in China and Vietnam. If anything, the evidence points to a
‘crowding in’ through the familiar multiplier effect and the
impact of profit expectations and cost reductions
associated with improved infrastructure. Countries that
have limited the investment role of the public sector such as,
Cambodia, Indonesia, Nepal, and Pakistan have
experienced an inferior investment performance by the private
sector.
Therefore, the function of fiscal policy must be one of helping
the economy achieve its potential and sustain a growth rate
via a redistribution of income at the margin in order to increase
the elasticity of poverty reduction with respect to growth. Public
investment is the key to these goals since it increases capacity,
and can be designed to do so in a way that biases income
gains to the poor.
It needs to be emphasised, however, that there are limits in
special circumstances to the use of expansionary fiscal policy,
involving deficit financing of higher public investment outlays.
If government labours under a large internal or external debt,
then such a policy may lead to an unsustainable fiscal position.
It is sometimes argued that this is the situation in Indonesia.
However, when GDP growth is significantly lower than the
potential long-run growth rate, there is definitely a case for
using fiscal policy, at least temporarily as a counter-cyclical
measure. Another argument that has been put forward is that
the use of fiscal policy should be limited in the presence of
‘governance’ failure, corruption and problems in implementation
of public sector projects. In such situations, improvements in
governance have to go hand in hand with the conduct of a
more active fiscal policy. Thailand has discovered an ingenious
28

way of increasing aggregate demand in the 90’s by adopting
an ambitious program of fiscal decentralization.
As far as monetary policy is concerned, it is necessary to
maintain a stance of this policy that sustains the recent fall in
interest rates in the region. As highlighted earlier, with
inflation rates generally down, there exists considerable space
for resorting to an expansionary monetary policy. Exchange
rate policy should aim at preventing an overvaluation of the
currency, to avoid loss of competitiveness. Currently,
many countries in the region are showing symptoms
of the ‘Dutch disease’, involving appreciation of the
currency resulting from a rapid build up of foreign exchange
reserves.
We discuss below how fiscal, monetary and other policies can jointly
be used to further the goals of faster agricultural development
and employment absorption, which have demonstrated to be key
elements of a pro-poor growth strategy.
POLICIES FOR AGRICULTURAL DEVELOPMENT
Over the past few decades, Asian agriculture has demonstrated
remarkable resilience. The spectre of population growth
outstripping agriculture’s ability to meet human needs has not
materialised. Food prices have secularly declined on a long-term
basis in the region. However, growth of agricultural output has
slowed down both in East Asia and South Asia during the 90’s as
compared to the 80’s. East Asian agriculture grew at close to five
percent in the 80’s, which has fallen to about three percent in the
90’s, whereas agriculture in South Asia rose by 3.5 percent in the
80’s and has come down to three percent in the 90’s. This has
fundamental implications for the rural poor, whose share in the
total number of poor ranges from 66 percent in Indonesia to 94
percent in Nepal.
Pro-Poor Policies
29

Pro-Poor Growth and Policies: The Asian Experience
China’s remarkable success in poverty reduction during the initial
years after the systemic land reforms in 1979 was largely because
of a sharp improvement in agriculture’s terms of trade and an
increase in public expenditure for the rural economy. Rural
communes were dismantled, land was parcelled to households on
an essentially egalitarian basis, farmers were encouraged to
abandon the previous ‘grain first’ policy and to diversify production,
and farm prices rose substantially along with a large increase in
chemical fertilizer supplies. When China shifted gears in the late
80’s to a development strategy oriented towards exports with
concentration of economic activity in the coastal region, the process
of growth became noticeably less pro-poor. Similarly, when India
experienced relatively fast agricultural growth (mainly due to the
green revolution) in the 70’s and in the first half of the 80’s, poverty
declined despite a relatively low rate of economic growth. However,
the slowdown in agricultural growth in the 90’s, despite high
economic growth, has had an adverse impact on poverty reduction.
Further, the astonishing egalitarian and poverty alleviating growth
in Indonesia during the 70’s and the 80’s was principally due to a
diversion of a high proportion of public investment towards the
rural areas, and to reforms of the domestic trade and marketing
regime, which led to an improvement of the agricultural terms of trade.
These examples reveal that if economic growth is to be favourable to
the poor, then it should have a pattern that directs resources to the
sectors in which the poor work (agriculture), areas in which they live
(relatively backward regions), factors of production which they possess
(unskilled labour) and outputs which they consume (such as food).
Policies for promoting faster agricultural development will have to
focus on the following:
i) Diversification of agriculture into labour –intensive high-value
agricultural commodities such as horticulture and livestock for
30

increased profit incentives and employment opportunities. This
may require intervention by the state initially in the process of
marketing and in providing minimum support prices to help
farmers manage the risks of moving into new economic
activities.
ii) Strengthening of the backward and forward linkages between
the agricultural sector and the off-farm sector in the rural areas
in order to create a virtuous cycle of growth of incomes and
employment. This is what happened in the countryside of China
during the 80’s and largely explains the phenomenal
employment growth during this period. Development of small
and medium–scale rural enterprises for agri processing and
provision of agricultural inputs will require greater outreach for
extension of rural credit, both farm and off-farm, by financial
institutions, specialised or otherwise.
iii) Higher priority in public sector allocations to rural development.
In fact, during the 90’s, the share of government spending on
agriculture has declined sharply throughout the region. For
example, it has fallen in Indonesia from over 16 percent in the
mid-80’s to only four percent in recent years, from 11 percent
to four percent in Sri Lanka, from 19 percent to 11 percent in
Nepal, and so on. This trend will have to be reversed. Numerous
studies have been undertaken to find out what kind of public
expenditure caters most to needs of the rural poor. It appears
that the greatest impact on agricultural productivity and poverty
comes from investment in roads, irrigation, village electrification,
and from outlays on agricultural research and development and
extension.
iv) Focus on redistribution of assets to the poor. This will also include
the possibility of progressive land reform in countries, like Nepal,
Philippines and Pakistan, where agricultural land is unevenly
Pro-Poor Policies
31

Pro-Poor Growth and Policies: The Asian Experience
distributed. In addition, rural micro-credit schemes, of the type
in Bangladesh, can endow the poor, especially women, with
some basic assets.
POLICIES FOR EMPLOYMENT GENERATION
The share of employment in agriculture is currently high in most
countries of the region. For example, at one extreme, in less
developed countries like Cambodia and Bangladesh, the share of
employment in agriculture is close to three-quarters. As opposed
to this, the share of employed in industry is relatively small (in the
range of six to 20 percent) in most countries. The data on
employment reveals that, contrary to expectations, in some
countries such as Bangladesh, India, Mongolia and Pakistan, the
industrial sector’s share in employment has declined during the
90’s. A substantial increase in employment share is observed only
in the services sector of most countries.
However, as a consequence of slow growth of formal (organised)
sector jobs in the modern industrial sector and increasing labour
supply pressure in agriculture, there has been enormous pressure
put on informal sector activities. This has translated into falling
labour productivity and income levels in the services sector.
Therefore, it is not surprising that one- half of the poor consist of
employed workers due to part-time work, low wages and frequently
hazardous working conditions. Mega cities of Asia have witnessed
an explosion of the informal sector and ‘urbanization’ of poverty is
an ongoing phenomena.
Policy makers have generally had an ambivalent attitude towards
the informal sector, recognising, on the one hand, the problems
that it poses in terms of tax evasion, illicit activities, adverse impact
on the environment, etc., and, on the other hand, accepting that it
acts as a cushion for the poor in terms of at least providing some
minimum livelihood. While regulation will need to be improved to
32

avoid some of the evils, it is clear that the informal sector will also
have to be supported through provision of better physical
infrastructure and other government facilities. Simultaneously, the
progressive and dynamic end of the informal sector consisting of
small and medium enterprises (SMEs), frequently engaged in
export, will need to be encouraged by improved access to
management and technical extension services and to credit from
the banking system.
China provides an excellent example of how a development
strategy focusing on SMEs can play an important role in growth
and employment. The experience of Bangladesh is also illustrative
in this regard. In the 90’s, Bangladesh was able to accelerate the
rate of poverty reduction mainly by employment generation in non-
tradable sectors (i.e. construction small-scale industry, services
etc.)
Within rural areas, much of the focus on employment generation
will have to be on the off-farm sector, as discussed above. Several
countries—notably Bangladesh and India—have used rural public
works programs as an effective method of providing employment
to poor workers, especially on a seasonal basis.
Beyond this, the overall policy environment will have to be one
that promotes a higher labour intensity of growth. This will include
the development of a system of incentives and institutions that
avoids undesirably high capital intensity of investment (e.g.
maintenance of an overvalued exchange rate that permits the
import of cheap machinery, the promotion of large mechanised
corporate farms instead of small holders, making intensive use of
family labour).
Reducing vulnerability due to labour market conditions could also
be useful in the context of reducing poverty among the working
Pro-Poor Policies
33

Pro-Poor Growth and Policies: The Asian Experience
poor. Legal and institutional reforms will be needed to address
the various factors contributing to vulnerability. A recent ILO study
provides strong support to the idea that minimum wage would
bring positive results in poverty alleviation. The study shows that
the minimum wage has a small disemployment effect, while
providing unskilled workers with decent living conditions (Saget
(2001)). Similarly, social protection can help workers adapt to both
cyclical and structural change. In many developing countries, social
protection systems tend to cover only workers in formal full-time
employment, leaving most of the workers with no protection.
Hence, new mechanisms to extend coverage of social security need
to be explored.
34

The Asian experience reveals a strong, though variable, relationship
between growth and poverty. For the region as a whole, the
growth elasticity of poverty is estimated at –0.9 during the 90’s as
compared to a distribution-neutral elasticity of –2. The divergence
is attributed to worsening inequality. It appears that while the
region has been successful in achieving high rates of economic
growth, gains with regard to poverty reduction have been limited
by the absence of pro-poor growth.
Analysis of the macroeconomic determinants of pro-poor growth
like the rate of inflation, employment growth and sectoral pattern
of growth leads to some important, perhaps unexpected, findings.
Once the effect of growth on poverty is controlled for, the level of
poverty does not appear to be sensitive to the rate of inflation, at
least up to the level experienced by most Asian countries. Similarly,
while greater exports indirectly impact upon poverty via faster
growth, the direct relationship with poverty seems to be limited.
The empirical evidence indicates that the key macroeconomic
determinants of the degree of pro-poor growth are the rates of
agricultural growth and employment generation.
Based on these findings, the paper recommends a set of pro-poor
policies. Given the relatively weak trade-off between inflation and
growth with regard to the impact on poverty and the fact that
5.CONCLUSIONS
35

Pro-Poor Growth and Policies: The Asian Experience
inflation rates are currently low, it is argued that countries can be
more flexible in their policy stance with regard to the adoption of
more growth-oriented as opposed to stabilization policies. In
particular, a case is made for resort to a more expansionary
counter-cyclical fiscal policy, led by higher levels of public investment,
supported by appropriate monetary and exchange rate policies.
The paper concludes with a detailed description of the policies
designed to achieve faster agricultural development and greater
employment generation.
End Notes
1 Out of the ten countries of Asia on which data is available on the incidence ofpoverty during the last two decades, the rate of poverty reduction has declined inthe 90’s in relation to the 80’s in Philippines, while there has been a reversal inthe poverty trend during the 90’s, from a reduction in the 80’s, in Indonesia,Malaysia, Pakistan and Sri Lanka. Poverty incidence has increased over bothdecades in Nepal.
2 Econometric analysis involving the use of the OLS technique has also been tried.However, due to the limited number of observations, the results appear to be verysensitive to one or two observations and cannot, therefore, be judged as beingrobust in character. For example, the inclusion of Mongolia into the datadramatically alters the nature of the results because this country experienced asharp increase in poverty in the 90’s, arising from a fall in per capita income anda very high rate of inflation. Hence, regression results have not been presentedhere, though they indicate a negative and significant relationship between growthand poverty.
3 The cut-off point used in deciding whether faster or slower growth (higher or lowerinflation, higher or lower employment growth, etc) is generally based on theaverage figure of our sample as well as on the international experience.
4 The three excluded cases are Indonesia, Malaysia, and Sri Lanka, all in the90’s—the first two because of the Asian financial crisis, and the last because ofthe serious conflict situation in the North and East of the country.
5 Looking at the two extremes we observe that in the six cases of fast growth percapita income combined with fast employment and agricultural growth, the averagerate of decline annually in the incidence of poverty was as high as seven percent.These cases are: China (80’s); Indonesia (70’s); Malaysia (70’s); Thailand(70’s); Vietnam (90’s) and Lao PDR (90’s). As opposed to this, in the eight caseswhere slow growth of per capita income was accompanied by both slow agriculturaland employment growth, poverty increased on the average at the rate of onepercent per annum.
6 In order to test whether these findings are driven mainly by China or/and India,we carried out these exercises without China as well as without both China andIndia. The results are, more or less, the same in these exercises too.
36

STATISTICAL APPENDIX

Pro-Poor Growth and Policies: The Asian Experience

Statistical Appendix
39
TA
BLE
A-1
INC
IDE
NC
E O
F P
OV
ER
TY
IN
DIF
FE
RE
NT
CO
UN
TR
IES
IN
DIF
FE
RE
NT
YE
AR
S A
CC
OR
DIN
G T
ON
AT
ION
AL P
OV
ER
TY
LIN
E (
% O
F P
OP
ULA
TIO
N)
Co
un
try
19
70
19
80
19
90
20
00
Bangla
desh
71.0
(73)
52.3
(83)
49.7
(91)
39.8
Cam
bodia
--
39.0
(94)
51.1
(99)
Chin
a33.0
31.0
(78)
9.0
3.2
India
55.6
48.4
(78)
38.9
(88)
28.6
(99)
Indonesi
a60.0
26.5
(81)
15.1
18.2
(99)
Lao P
DR
--
53.0
31.5
Mala
ysi
a18.0
9.0
6.1
(89)
8.1
(99)
Mongolia
--
17.0
(92)
35.6
(98)
Nepal
-36.2
(77)
40.0
(89)
42.0
(96)
Pakis
tan
46.5
30.7
(79)
26.1
(91)
32.6
(99)
Philip
pin
es
61.6
(71)
59.7
(85)
45.2
(91)
40.0
Sri
Lanka
37.0
(63)
30.9
(85)
19.9
(91)
25.2
(96)
Thailand
26.0
17.0
18.0
14.2
Vie
tnam
--
75.0
(88)
32.0
(02)
Note
: Fi
gure
in t
he p
are
nth
esi
s co
rresp
onds
to t
he y
ear
of
povert
y l
evel.
Sourc
e:
UN
DP (
2003b);
ES
CA
P (
2002);
ES
CA
P a
nd U
ND
P (
2003)
and W
orl
d B
ank (
2004)

Pro-Poor Growth and Policies: The Asian Experience
40
TA
BLE
A-2
LE
VE
L O
F I
NE
QU
ALIT
Y I
N S
AM
PLE
CO
UN
TR
IES
IN
DIF
FE
RE
NT
YE
AR
S (
GIN
I C
OE
FFIC
IEN
T %
)
Co
un
try
19
70
19
80
19
90
20
00
Bangla
desh
36.8
(73)
39.0
(81)
28.9
(89)
31.8
Cam
bodia
--
37.4
40.4
(97)
Chin
a27.9
32.0
34.6
40.3
(98)
India
30.4
31.5
(83)
29.7
37.8
(97)
Indonesi
a30.7
31.8
33.1
30.3
Lao P
DR
--
30.4
(92)
37.0
(97)
Mala
ysi
a51.8
51.0
(79)
48.3
(89)
49.2
(97)
Mongolia
--
37.4
44.0
(98)
Nepal
-30.1
(84)
33.4
(89)
36.7
(96)
Pakis
tan
33.0
37.3
(79)
40.7
33.0
(98)
Philip
pin
es
48.3
(71)
46.1
(85)
47.7
(91)
46.1
Sri
Lanka
31.2
42.0
30.1
34.4
(96)
Thailand
49.9
(71)
47.3
(81)
42.9
43.2
Vie
tnam
--
35.7
(92)
36.1
(98)
Note
: Fi
gure
in t
he p
are
nth
esi
s co
rresp
onds
to t
he y
ear
of
inequalit
y l
evel.
Sourc
e:
UN
DP (
2003a);
UN
DP (
2003b)
and W
orl
d B
ank (
2003)

Statistical Appendix
41
TA
BLE
A-3
RA
TE
OF I
NFLA
TIO
N I
N S
AM
PLE
CO
UN
TR
IES
IN
DIF
FE
RE
NT
DE
CA
DE
S (
%)
Co
un
try
19
70
’s1
98
0’s
19
90
’s2
00
0-2
00
2
Bangla
desh
—7.4
5.2
2.5
Cam
bodia
——
5.4
-0.7
Chin
a10.0
11.8
7.5
0.3
India
8.2
8.9
9.1
3.8
Indonesi
a17.5
8.6
14.1
7.6
Lao P
DR
——
34.1
16.4
Mala
ysi
a6.0
3.2
3.6
1.5
Mongolia
——
65.6
9.8
Nepal
—10.2
8.9
2.1
Pakis
tan
12.4
7.0
9.2
3.8
Philip
pin
es
14.9
13.7
8.6
5.2
Sri
Lanka
8.9
12.4
9.7
10.2
Thailand
10.0
4.4
4.5
1.6
Vie
tnam
——
3.7
-1.1
Sourc
es:
Worl
d B
ank (
2003)
and A
sian D
evelo
pm
ent
Bank (
2003)

Pro-Poor Growth and Policies: The Asian Experience
42
TA
BLE
A-4
RA
TE
OF E
MP
LO
YM
EN
T G
RO
WT
H I
N S
AM
PLE
CO
UN
TR
IES
IN
DIF
FE
RE
NT
DE
CA
DE
S (
%)
Co
un
try
19
70
’s1
98
0’s
19
90
’s
Bangla
desh
—2.3
1.4
Cam
bodia
——
2.8
Chin
a2.2
4.7
1.1
India
2.1
2.2
2.4
Indonesi
a2.5
3.0
1.8
Lao P
DR
——
2.9
Mala
ysi
a3.2
3.4
3.2
Mongolia
——
0.6
Nepal
—1.8
3.1
Pakis
tan
3.1
2.0
2.1
Philip
pin
es
2.9
2.9
2.1
Sri
Lanka
2.1
3.6
2.2
Thailand
3.1
3.1
0.4
Vie
tnam
——
2.9
Sourc
es:
ILO
(2003)
and v
ari
ous
ILO
em
plo
ym
ent
report
s

Statistical Appendix
43
TA
BLE
A-5
RA
TE
OF A
GR
ICU
LT
UR
AL G
RO
WT
H I
N S
AM
PLE
CO
UN
TR
IES
IN
DIF
FE
RE
NT
DE
CA
DE
S (
%)
Co
un
try
19
70
’s1
98
0’s
19
90
’s
Bangla
desh
-2.3
1.4
Cam
bodia
--
2.8
Chin
a2.2
4.7
1.1
India
2.1
2.2
2.4
Indonesi
a2.5
3.0
1.8
Lao P
DR
--
2.9
Mala
ysi
a3.2
3.4
3.2
Mongolia
--
0.6
Nepal
-1.8
3.1
Pakis
tan
3.1
2.0
2.1
Philip
pin
es
2.9
2.9
2.1
Sri
Lanka
2.1
3.6
2.2
Thailand
3.1
3.1
0.4
Vie
tnam
--
2.9
Sourc
es:
Worl
d B
ank (
2003)

Pro-Poor Growth and Policies: The Asian Experience
44
TA
BLE
A-6
RA
TE
OF E
XP
OR
T G
RO
WT
H I
N S
AM
PLE
CO
UN
TR
IES
IN
DIF
FE
RE
NT
DE
CA
DE
S (
%)
Co
un
try
19
70
’s1
98
0’s
19
90
’s
Bangla
desh
—10.4
11.7
Cam
bodia
——
22.7
Chin
a6.9
12.1
17.5
India
6.4
6.0
13.6
Indonesi
a9.5
1.4
7.7
Lao P
DR
——
15.7
Mala
ysi
a8.1
10.7
12.5
Mongolia
——
8.8
Nepal
—11.5
12.7
Pakis
tan
2.6
8.8
5.2
Philip
pin
es
10.3
4.0
8.1
Sri
Lanka
1.8
6.7
—
Thailand
9.9
14.1
10.8
Vie
tnam
——
27.4
Sourc
es:
Worl
d B
ank (
2003)

Statistical Appendix
45
TA
BLE A
-7R
EV
EN
UES
, EX
PEN
DIT
UR
E A
ND
FIS
CA
L D
EFIC
IT I
N S
AM
PLE C
OU
NTR
IES
IN
DIF
FER
EN
T D
EC
AD
ES
(%
)
Co
un
try
19
80
’s1
99
0’s
19
80
’s1
99
0's
19
80
's1
99
0's
Bangla
desh
6.4
9.1
11.4
13.1
-4.9
-4.0
Cam
bodia
4.9
7.5
7.2
12.6
-2.3
-5.1
Chin
a19.3
12.7
21.9
14.6
-2.7
-1.8
India
12.7
10.2
19.0
16.5
-6.3
-6.3
Indonesi
a17.1
16.7
19.5
17.4
-2.5
-0.7
Lao P
DR
5.3
40.4
12.0
70.3
-6.7
-29.9
Mala
ysi
a24.9
22.8
30.5
23.5
-5.6
-0.8
Mongolia
—27.5
—32.4
—-5
.0
Nepal
9.4
11.0
19.6
19.2
-10.2
-8.2
Pakis
tan
20.4
19.0
29.1
26.6
-8.7
-7.6
Philip
pin
es
14.2
17.4
16.8
19.1
-2.6
-1.7
Sri
Lanka
21.5
18.3
32.0
28.3
-10.5
-10.0
Thailand
16.5
17.0
16.0
16.9
0.5
0.0
Vie
tnam
13.7
18.2
21.9
21.6
-8.1
-3.4
Sourc
es:
Asi
an D
evelo
pm
ent
Bank (
2003)
Re
ve
nu
es
Ex
pe
nd
itu
reF
isca
l D
efi
cit

Pro-Poor Growth and Policies: The Asian Experience
46
TA
BLE
A-8
GR
OW
TH
IN
MO
NE
Y S
UP
PLY
AN
D R
EA
L I
NT
ER
ES
T R
AT
ES
IN
SA
MP
LE
CO
UN
TR
IES
IN
DIF
FE
RE
NT
DE
CA
DE
S (
%)
Co
un
try
19
80
’s1
99
0’s
19
80
’s1
99
0's
Bangla
desh
20
13
4.7
10.2
Cam
bodia
—28
—9.7
Chin
a24
25
2.5
2.5
India
17
17
7.4
6.6
Indonesi
a27
25
11.9
7.3
Lao P
DR
115
51
—1.2
Mala
ysi
a11
17
7.1
4.5
Mongolia
—53
—45.9
Nepal
20
19
4.3
5.6
Pakis
tan
13
16
4.8
5.4
Philip
pin
es
21
19
5.4
6.4
Sri
Lanka
16
18
1.3
7.8
Thailand
20
13
9.6
8.0
Vie
tnam
—31
—8.2
Sourc
es:
Worl
d B
ank
(2003)
Mo
ne
y S
up
ply
Gro
wth
Re
al
Inte
rest
Ra
te

Statistical Appendix
47
TA
BLE
A-9
RA
TE
OF R
EA
L D
EP
RE
CIA
TIO
N I
N E
XC
HA
NG
E R
AT
E A
ND
AV
ER
AG
E I
MP
OR
T T
AR
IFFS
IN
SA
MP
LE
CO
UN
TR
IES
(%
)
Co
un
try
19
80
’s1
99
0’s
19
90
20
00
Bangla
desh
1.2
-1.0
88.2
21.0
Cam
bodia
—13.6
——
Chin
a0.8
-1.0
32.5
14.3
India
-0.5
1.1
56.2
28.2
Indonesi
a3.3
13.7
13.2
5.4
Lao P
DR
10.1
1.2
—14.2
Mala
ysi
a-1
.00.6
9.9
5.8
Mongolia
—-4
7.5
——
Nepal
-0.7
0.6
17.5
16.8
Pakis
tan
1.3
0.3
46.3
14.7
Philip
pin
es
-0.4
-1.7
22.4
4.0
Sri
Lanka
-3.0
-2.9
26.9
7.2
Thailand
-2.1
0.7
33.0
9.7
Vie
tnam
—5.4
18.4
15.1
Sourc
es:
Worl
d B
ank
(2003)R
ate
of
Ex
ch
an
ge
ra
te D
ep
recia
tio
nA
ve
rag
e I
mp
ort
Ta
riff
Pro-Poor Growth and Policies: The Asian Experience
There is need for a discussion of the particular measure used to
quantify the incidence of poverty. Most studies have used data on
poverty incidence based on the poverty line of income of US $ 1 (in
purchasing power parity terms) per capita per day. Alternatively,
some studies have looked at changes in income share in the bottom
quantile of the income distribution as a proxy for changes in poverty
(for example, Romer and Gragerty (1997), Dollar and Kraay (2001),
and Ghura, Leite and Tsangarides (2002)). Both approaches have
been subjected to various forms of criticism. The former approach
has been criticised by a number of authors Bhalla (2002) and Reddy
and Pogge (2002)) on the grounds that the relative purchasing
power per dollar of the people of poor nations is not measured
accurately. The estimate of the purchasing power of the poor is
based on the measure of their ability to buy any of the goods and
services an economy has to offer. However, the poor do not
generally use services (and services in low income countries are
much cheaper in relative terms to other goods in the basket in
terms of a dollar’s purchasing power across countries). Nonetheless,
services do get included in their basket of goods, thus reflecting
an inflated purchasing power of the poor.
As opposed to this, the latter approach has been found to have
the problem that the income of the bottom 20 percent of the income
distribution cannot be assumed to fully represent the income of
ANNEX I
48

the poor. In many developing countries, 30 to 50 percent of the
population lives below the poverty line.
We have relied on estimates of the incidence of poverty based on
national poverty lines. These estimates are being used perhaps
for the first time to analyse the relationship between growth and
poverty. Given that these estimates are indigenous in character
and are mostly produced by national statistical organizations, they
are likely to be more acceptable to national governments. But the
basic problem with these estimates is their comparability across
countries. Since the national poverty lines are generally derived
as the consumption expenditure required to finance a minimum
nutritional intake (in calories) by an individual, there is a lack of
standardization as reflected by the choice of different minimum
nutritional level in different countries. However, if the analysis is
not with respect to the levels of poverty but with regard to changes
in the incidence of poverty then the problem is likely to be less
serious.
Our primary motivation for choosing poverty estimates based on
national rather that international poverty line (of $ 1 PPP per capita
per day) is that the direction of change highlighted by the two
approaches tends to be different for a number of countries,
especially during the decade of the 90’s. As can be seen from Table
B-1, out of 14 countries in the sample for the 90’s there is
divergence in trends revealed by the two approaches for five
countries, namely, Bangladesh, Cambodia, Indonesia, Malaysia and
Pakistan. Differences are particularly pronounced in the case of
the last three countries. Indonesia and Malaysia went through an
economic crisis after 1997 and the former, in particular, experienced
a severe contraction in its GDP. Poverty estimates in the immediate
aftermath of the Asian financial crisis revealed that the incidence
had increased sharply. While there has been some economic
recovery since then, it is hardly likely that poverty could have fallen
Annex I
49

Pro-Poor Growth and Policies: The Asian Experience
as sharply as indicated by estimates based on the international
poverty line. Similarly, Pakistan has experienced low growth during
the decade of the 90’s and the common perception is that poverty
has increased significantly during this period. Today, the
government of Pakistan is placing a high emphasis on reducing
poverty and unemployment. According to estimates based on the
poverty line of US $ 1 PPP per capita per day, the incidence of
poverty in Pakistan has fallen from as much as 48 percent in 1990
to 31 percent in 1996. This seems very unlikely.
50
Country According to According to According to According to International the National International the NationalPoverty Line Poverty Line Poverty Line Poverty Line
Bangladesh Increase Decrease Increase Decrease
Cambodia — — Decrease Increase
China Decrease Decrease Decrease Decrease
India Decrease Decrease Decrease Decrease
Indonesia Decrease Decrease Decrease Increase
Lao PDR — — Decrease Decrease
Malaysia Decrease Decrease Decrease Increase
Mongolia — — — Increase
Nepal Decrease Increase — Increase
Pakistan Decrease Decrease Decrease Increase
Philippines Decrease Decrease Decrease Decrease
Sri Lanka Decrease Decrease Increase Increase
Thailand Decrease Increase Decrease Decrease
Vietnam — — Decrease Decrease
TABLE B-1DIRECTION OF CHANGE IN INCIDENCE OF POVERTY
ACCORDING TO DIFFERENT MEASURES
1980's 1980's
Source: World Bank, 2003, various tables from Pasha and Palanivel, 2003

Adams, R. H. 2003. “Economic Growth, Inequality and
Poverty: Findings from a New Data Set”. World Bank
Policy Research Working Paper No. 972, World Bank,
Washington D.C.
Agénor, P. R. 2002. “Macroeconomic Adjustment and the Poor:
Analytical Issues and Cross-Country Evidence.”, World
Bank Policy Research Paper, No. 2788, World Bank,
Washington, DC.
ADB (Asian Development Bank). 2003. “Key Indicators of Developing
Asian and Pacific Countries 2003.” ADB, Manila.
Bhalla, S. 2002. “Imagine There’s No Country – Poverty, Inequality
and Growth in the Era of Globalisation.” Institute for
International Economics, Washington.
Bruno, M., M. Ravallion and L. Squire. 1998. “Equity and
Growth in Developing Countries: Old and New
Perspectives on the Policy Issues.” In Income
Distribution and High-Quality Growth. Edited by
Vito Tanzi and Ke-young Chu, Cambridge, Massachusetts:
MIT.
REFERENCES
51

Pro-Poor Growth and Policies: The Asian Experience
Datt, G. and M. Ravallion. 2002. “Why Has Economic Growth Been
More Pro-poor in Some States of India Than Others?.”
Journal of Development Economics, Vol. 68, pp. 381-400.
Dollar, D. and A. Kraay. 2001. “Growth is Good for the Poor.” World
Bank Policy Research Working Paper No. 2587,
Washington, DC.
Easterly, W. and S. Fischer. 2001. “Inflation and the Poor”. Journal
of Money, Credit and Banking, Vol. 33, pp. 160-79.
ESCAP (Economic and Social Commission for Asia and the Pacific).
2002. “Economic and Social Survey of Asia and the Pacific
2002” United Nations, New York.
———— and UNDP. 2003. “Promoting Millennium Development Goals
in Asia and the Pacific- Meeting the Challenges of Poverty
Reduction.”, United Nations, New York.
Ghura, D., C. Leite, and C. Tsangarides. 2002. “Is Growth
Enough? Macroeconomic Policy and Poverty Reduction.”
Working Paper 02/118, International Monetary Fund,
Washington, DC.
Epaulard, A. 2003. “Macroeconomic Performance and Poverty
Reduction.”, IMF Working Paper, WP/03/72, International
Monetary Fund, Washington, DC.
ILO (International Labour Office). 2003. “Global Employment
Trends.”, Geneva.
ILO, Employment Report or Annual Labour Statistics, Various report
52

Malik, J. Sohail. 2003. “Agricultural Growth and Rural Poverty in
Pakistan: A Review of the Evidence”, Asian Development
Bank
Pasha, H. A. and T. Palanivel. 2003. “Macroeconomics of Poverty
Reduction: An Analysis of the Experience in 11 Asian
Countries” Discussion Paper No. 3, UNDP Asia-Pacific
Regional Programme on Macroeconomics of Poverty
Reduction.
Ravallion, M. 2001. “Growth, Inequality and Poverty: Looking
Beyond Averages.” World Development, Vol. 29, No. 11.
pp. 1803-15.
Ravallion, M. and S. Chen. 1997. “What Can New Survey Data Tell
Us about Recent Changes in Distribution and Poverty?,”
World Bank Economic Review, 11(2): 357-82.
Reddy, S. G., and T. W. Pogge, 2002, “How Not to Count the Poor,”
(Version 3.0), mimeo, Barnard College, New York.
Roemer, M. and M. Gugerty. 1997. “Does Economic Growth Reduces
Poverty?.” CAER Discussion Paper No. 4, Cambridge,
Massachusetts.
Saget, C. 2001. “Is Minimum Wage an Effective Tool to Promote
Decent Work and Reduce Poverty? The Experience of
Selected Developing Countries” Employment Paper, 2001/
3, ILO, Geneva.
UNDP (United Nations Development Programme). 2003a. “Human
Development Report 2003.” New York: Oxford University
Press.
References
53

Pro-Poor Growth and Policies: The Asian Experience
————2003b. “Macroeconomics of Poverty Reduction: Country
Case studies in Bangladesh, Cambodia, China, Indonesia,
Mongolia, Nepal, Sri Lanka, and Vietnam”, UNDP Regional
Programme on the Macroeconomics of Poverty Reduction,
mimeo.
————1997. “Human Development Report 1997.” New York:
Oxford University Press.
Winters, A. L. 2000. “Trade and Poverty: Is There a Connection?”
in: World Trade Organization (WTO), Trade, Income Disparity
and Poverty, Geneva: WTO Special Study No. 5 (June 2000),
pp. 43-69.
World Bank. 2004. “Vietnam Development Report, 2004”,
Washington DC (forthcoming)
World Bank 2003 “World Development Indicators C-D ROM.” The
World Bank, Washington DC.
54