pro-active versus re-active player€¦ · pro-active versus re-active player? the european union,...
TRANSCRIPT

Pro-Active versus Re-Active Player? The European Union, Societal Pressures, and
Schumpeterian Trade Policies
Kerremans Bart, Adriaensen Johan
Abstract
International political economy often assumes public actors to be mere transmission belts of domestic
and international interests. Based upon the statements leading to and emanating from the Lisbon strategy
we unveil a more proactive government stance advocating a policy deliberately aiming at enhancing
economic performance through more competition. In our paper we address the reasoning behind such
an approach and in addition we aim to asses the possibility of a proactive Schumpeterian logic guiding
trade policy in European Union. Our findings suggest that there might be more behind the rhetoric.
Introduction
“Politicians respond to the incentives they face, trading off the financial and other support that
comes from heeding the interest groups’ demands against the alienation of voters that may result
from the implementation of socially costly policies.”
This quote (Grossman & Helpman, 2002: 111) provides the basis of this paper, albeit in a slightly
different way. The trade-off that we are dealing with is not one between interest group pressure on the
one hand, and possibly alienated voters on the other hand, but between interest group pressure on the
one hand, and socially beneficial policies on the other hand, and this as far as this trade-off manifests
itself in relation to the EU’s external trade policies. With “socially beneficial policies”, we refer to
policies that politicians, or for that matter, trade policy-makers, perceive to be beneficial for the
aggregate welfare of their society. Two possible policy-making models underlie this trade-off. One is the
model of a reactive public policy-maker. Such a policy-maker acts as a transmission belt of societal
pressures, in this case on trade. It is the outcome of the struggle between different societal groups on
trade that determines a policy-maker’s choices, and thus, policy decisions. This struggle may be
mediated by institutions. But at the end of the day, the policy-maker acts on the basis of societal pressure,
and thus, in reaction to that pressure.
The other model is a pro-active one. In that case, policy-makers not only act irrespective of societal
1
pressure, they also act with a certain purpose in mind. That purpose may be related to security concerns,
to the international competitive position of their country, or to any other public policy objective that
may be promoted through trade policies (either in terms of market closure or market opening). But
what matters is the pro-active nature of the policy-makers’ actions, even if this goes against the pressures
that manifest themselves in their society, or poses the risk of voter alienation in the short run.
The argument of this paper fits in such a pro-active model. It claims that the trade policy choices made
by the European Union partly reflect a Schumpeterian approach in which short-term distributional pains
are accepted for the sake of long-term aggregate competitive gains, or at least that it is difficult to reject
out of hand that such an approach matters in the setting of the EU’s external trade policies. The
hypothesis that is central in this paper is thus that the EU’s external trade policies are affected by a logic
in which the EU acts as a pro-active trade policy-maker that accepts short-term costs for the sake of
long-term competitive benefits. We do so with only a modest ambition in mind, namely to test
empirically whether EU-decisions on trade liberalization or protection are linked to the competitiveness
of industrial sectors in the way that our hypothesis suggests. What it suggests is that the EU liberalizes
trade not just in sectors that have a clear competitive advantage vis-à-vis the rest of the world, but also
that such liberalization is decided upon in case EU industrial sectors suffer from a lack of competitiveness.
In the latter case, the re-active policy-making model would be contradicted as in the context of lacking
competitiveness; one would expect the sectors concerned to resist liberalization. Moreover, we would
expect them to do so actively, as the cost of liberalization would be concentrated in such sectors.
This paper is structured as follows. In the first section, we present the arguments why we think it to be
plausible to claim that the EU is a pro-active policy-maker on trade. In the second section, we put the
resulting hypothesis within the larger debate on trade policy-making. In the third section, we present the
empirical analysis and the observations with regard to our hypothesis. We round up in the conclusion.
Consistent Schumpeterian Rhetoric as a Case for Pro-Active EU-Policy-Making on Trade
The hypothesis that pro-active behaviour is at work in the EU’s trade policy-making is based on the
observation that at least from a rhetorical point of view, Schumpeterian thinking has been prominent in
the EU’s approach to international trade policy, and to economic policy in general. Central in such
thinking is the notion of “creative destruction”, of “innovative-based” (Acemoglu et al., 2002: 2), or
rather, of competitiveness-based growth. By opening markets, domestic producers are exposed to
competitive pressures. This forces them to rationalize their production, to allocate the use of production
2

factors more efficiently, and for that purpose, to eventually shed employment. Given the latter, one may
expect opposition to arise against such an approach, at a minimum from those that will lose their jobs,
eventually also from those that employ them. The latter will happen when in a context of inter-
industrial trade patterns, market liberalization leads to a reallocation of production between economic
sectors, thereby eliminating the least competitive ones. The more specific capital and labour is in these
sectors, the stronger the incentives for the owners of the production factors will be, to organize
themselves against market opening, and to pressurize public policy-makers accordingly (cf. Hiscox,
2001; Dorussen, 2006). In case policy-makers decide to stick to market liberalization policies anyhow,
one may assume that they act on the basis of the principle that even if liberalization brings costs, such
costs need to be considered as self-inflicted wounds that heal, and that, importantly, make one stronger
afterwards. Creative destruction is indeed based on the notion that destruction, or its threat, brings with
it pressures to increase competitiveness, to replace less efficient producers by more efficient ones, and as
such, to increase aggregate societal welfare.
It is difficult to escape from this Schumpeterian reasoning in the rhetoric used by the EU, or at least not
to recognize serious traces of it. Already in the EEC Treaty, the creation of the Customs Union is
claimed to serve the competitiveness of the EC’s companies, and as such, prepare them better for global
competition (cf. article 131 TEC). This is of course not tantamount to full market opening for
competitive purposes. It is only internal market opening for purposes of helping the EU becoming more
competitive whenever it enters the global marketplace.
The Internal Market Programme of the second half of the 1980s was rooted in the same reasoning. Here
the linkage between internal liberalization and external competitiveness was more explicit. One of the
main points was indeed that through internal liberalization – this time mainly on non-tariff barriers – the
EU would arm itself for global competition, particularly with the United States and with Japan, and the
two were explicitly mentioned, at least with regard to industrial innovation, and with respect to banking
and other financial services (see COM(85) 310).
This increasing emphasis on the potential of external trade liberalization as a tool for the competitiveness
of the European economy showed itself most clearly in the “Global Europe” strategy that the
Commission presented in 2006. In that strategy, the Commission defined an internal and an external
component, where the first one targeted the export capacity of the EU, and the second the access to
foreign markets. But important in the former was the notion that external competition would stimulate
the enhancement of the internal competitiveness of the EU, thereby preparing it better for the global
3
market place. Indeed, as the Commission phrased it, the internal component of its strategy consisted of
“(…) having the right internal policies, which reflect the competitive challenge and maintain our
openness to trade and investment.” Among these internal policies, the internal market would be
prominent. But “openness” would also be part of it. And as such, the Commission phrased its
contribution to EU competitiveness as follows:
“Openness to global trade and investment increases our ability to exploit the benefits of an
effective single market. It exposes the domestic economy to creative competitive pressures,
spurring and rewarding innovation, providing access to new technologies and increasing
incentives for investment.”
There barely is a more straightforward way to link trade liberalization to a Schumpeterian logic. Critics
would claim however, that the Commission is only the Commission, and the rhetoric is just rhetoric. It
is not because the Commission uses such rhetoric that one may conclude that EU trade policies reflect
this rhetoric accurately or even comes close to this. The purpose of this paper is therefore, to see
whether there is an empirical reality behind this rhetoric, whether it has translated itself in trade
liberalization, and thus in the exposure of European industries to Schumpeterian pressures. It is not a
purpose rooted in an interest in the Schumpeterian logic as such, but rather rooted in the question to
what extent EU trade policies can be explained on the basis of pro-active or re-active policy-making
models. This brings us to the question of the debate between these two models as it has been developed
in the literature.
Transmission Belts versus Positional Competitors
Reactive Policy-Making
“The democratic state (…) derives its claim to legitimacy from a commitment to the public
interest and to distributive justice, and governments are constrained, through the mechanisms of
electoral accountability, to orient their policies toward the interests of the broad majority of its
voters. They are therefore under political pressure to protect groups in the electorate against
the losses caused by structural change, to prevent mass unemployment, to regulate labour
markets and production processes in the interest of the workers affected, and to achieve a
normatively defensible distribution of incomes. In following their own logic, therefore,
democratic governments will want to inhibit the ‘creative destruction’ associated with
4

capitalism, and they will tend to reduce the income differentials between winners and losers in
the market.”
With this statement, Scharpf (1999: 30) indicates that a contradictory relationship exists between full-
fledged creative destruction on the one hand, and the pressures to which democratic government is
exposed on the other hand. Even if one accepts that the logic of market competition generates “material
abundance for consumers, jobs for workers, and tax revenues for governments”, rather than what is
generated in aggregate terms, the distribution of what is generated matters more, at least politically. It
matters more because it defines the constraints under which democratic governments have to operate. It
is evident therefore, that a lot of attention has been paid to these constraints in the literature,
particularly when it comes to the question of trade liberalization. Nonetheless, whereas the study of
these constraints largely resulted into accounts of how governments are pushed in the direction of trade
protectionism; empirical observation suggests that rather than protection, liberalization has been the
predominant outcome.
The basis of the linkage between constraints on the one hand and trade protection on the other hand, is
provided by endogenous trade theory. As is well known, endogenous trade theory stresses the
relationship between the domestically anticipated costs and benefits of expected trade policies on the
one hand, and the trade policy choices made by trade policy-makers on the other hand. As such, it is a
theory rooted in a reactive model of trade policy-making. Government leaders are transmission belts
that largely act according to the biases that emerge as a consequence of the distribution of anticipated
costs and benefits of trade policy measures in society and the kind of politicization that this triggers (or
fails to trigger). The notion “endogenous” points then to the domestic societal and electoral factors that
generate trade policy outcomes, and to changes in such factors that engender concomitant changes in
trade policy outcomes. For an understanding of trade policy outcomes, it is then, essential to understand
the relationship between the anticipated costs and benefits of trade policies and the configuration of
political mobilization that such anticipation entails. Two dimensions are relevant here: the level of
concentration and dispersion of the anticipated effects, and the diversity in mobilization effects from
anticipated costs as compared with anticipated benefits.
The first is straightforward and is largely based on collective action theory. With increasingly
concentrated effects – be it as anticipated costs or anticipated benefits – the intensity of the preferences
with regard to the expected policies increase as well. With rising intensities comes a rising ability to
overcome collective action problems, and thus, a rising probability that the anticipated effects of a policy
5

will lead to political pressure in favour or against that policy. A decisive element here consists of the
stakes-per-capita, as Schneiberg (2005: 101) has observed. More dispersed anticipated effects result in
low per-capita-stakes, and thus in weak incentives to invest in doing something about these stakes. More
concentrated anticipated effects result in high per-capita-stakes, high potential payoffs from political
organization, and thus in strong incentives to invest in doing something about them (Schuler et al., 2002:
662). This factor may not be sufficient to push people into collective action, it is, if not a necessary, at
least a very important condition for such action. That it may not be a sufficient condition is partly due to
the problem of free riding and the related question whether groups need to provide private goods – that
is goods from the use of which non-contributors can be excluded – in order to avoid such behaviour.
What matters here however, is more the question of the probability of collective action, the distribution
of such probabilities across different groups in society, and the resulting configurations in the societal
pressures in favour or against policy proposals to which public policy-makers are exposed. On the basis
of these probabilities, the outcome is clear: collective action problems lead to a bias in favour of groups
that face high per-capita effects of proposed policies, whether as anticipated costs or anticipated benefits.
Several authors have provided some nuances to this reasoning however. Dür and De Bièvre (2007) for
instance, point at the contingency of this reasoning across the different stages of the policy-making
process. Whereas groups with larger collective action problems, and therefore lower resource
mobilization capacities may be able to collect sufficient resources for the purpose of pressurizing policy-
makers significantly (and from a comparative perspective not significantly less than groups that represent
concentrated stakes), their ability to constantly mobilize resources during the policy-making process for
that purpose is more limited. As such, no bias may exist as far as agenda-setting is concerned, it does so
whenever it comes to affecting the substance of policies.
Besides the role of concentrated versus dispersed (or diffuse) interests, a difference in mobilization
potential may also be made on the basis of the difference between anticipated costs and anticipated
benefits. Both Goldstein and Martin (2000), and Dür (2007: 460-461) have pointed at this difference.
Uncertainty is a major element here. Those that fear a loss of market share, a loss of employment, or a
loss of income as a consequence of trade liberalization are able to estimate that loss. And even if they
don’t, the perspective of losing what one has is sufficient to provide an incentive for political action,
specifically when the kind of trade barriers to be dismantled is relatively clear (cf. Kono, 2006), or the
extent to which they will be dismantled (cf. Goldstein & Martin, 2000: 607-608; 614-615). Those that
hope to enjoy the benefits of trade liberalization are in a different position however. They are not sure
about the exact benefits to expect. They don’t know how much foreign market access their government
6

will get in exchange for granting domestic market access to foreign firms. And even if they know this,
they are not sure about the exact benefits they will be able to derive from it, specifically as they will have
to compete with other firms (or similar producers from other countries) for the market opportunities
that may arise from trade liberalization. This uncertainty acts as a factor that discourages mobilization
and complicates collective action. That is why between import-competing and export-performing
industries the former are supposed to be able to pressurize trade policy-makers more strongly than the
latter. It is only under specific circumstances – whenever export industries expect to lose foreign market
shares as a consequence of the trade diversion effects of preferential trade agreements (Dür, 2007: 461-
462), or as a consequence of foreign retaliation in response to domestic protection (Goldstein & Martin,
2000: 617) – that a bias may emerge in favour of such industries rather than the import-competing ones.
Whatever the outcome in terms of biases in the capacity of different groups in society to organize
themselves for trade policy purposes, the question of impact still needs to be raised. It is indeed not
because some groups are able to overcome collective action problems more readily than other groups
can, that public policy will accurately reflect the resulting advantage they have in terms of political
visibility. Some authors have pointed at intermediating variables that may matter here. The nature of the
electoral system is often considered to be an important factor, as in PR-systems, the ability of policy-
makers to escape from geographically concentrated pressures is higher, thereby enabling them to weigh
the social cost of policies for the electorate overall – or for the electoral coalition that brought them in
office – against the costs of such policies for specific groups with a high mobilization potential (cf.
Mansfield & Busch, 1995). Likewise, the interaction between high levels of party discipline and electoral
rules engenders similar kinds of effects (McGillivray, 1997: 604; 2004: 154). Ehrlich’s work points in
the same direction, but his conclusions are situated at a more generic level: rather than party discipline
and electoral rules as such, it is the degree of institutional fragmentation (operationalized through the
number of access points in a political system) that matters (Ehrlich, 2007). In the same sense, different
geographical scales at which political institutions are organized, or their personnel elected, affect the
scale of the social cost of policies that policy-makers are able to take into account (cf. Ladewig, 2006) as
does the presence or absence of executive dominance in a political system (cf. Zimmerman, 2007: 818,
827). The latter is particularly important in the EU, as is the impact of the EU’s multi-level system on
the ability of public policy-makers to shield themselves from societal pressure (cf. Poguntke et al., 2007:
764; Olsson, 2003: 294; Grande, 1996: 328).
Whenever public policy-makers are able to shield themselves from societal pressures, as the above
suggests, the question about their preferences and intentions shows up. The most straightforward way to
7

deal with these is to point at the electoral motives that may guide their behaviour, this at least to the
extent that electoral sanctions are expected in response to the policies at stake. And for the latter,
interest group mobilization and its bias may matter again as will media responsiveness to such (biased)
mobilization (Beyers & Kerremans, 2007).
Pro-Active Policy-Making
Trade is however, an issue that may be related more or less strongly to concerns about national security,
or the position of the state in the international system overall. And in these concerns, it may be about
more than just trade in security-sensitive products (cf. Dorussen, 2006: 103). It may be about positional
competition among states (or political systems) in the international system (Zimmerman, 2007: 823-
824). In its most generic form, positional competition refers to competition among states concerned as
each of them is with its relative power position in the international system. A geo-strategic approach
would stress then, the concerns about relative security positions. The geo-economic approach would do
so for the relative position with regard to market shares, particularly in promising potential export
markets such as China and Brazil. But separating the two may be difficult as the two often interact
strongly with each other (cf. Gilpin, 1987; Kennedy, 1988; Bussmann & Oneal, 2007).
Positional competition is thus about motives for political action in relation to international trade. It
implies the idea that given strategic interests, public policy-makers are able and prepared to take trade
policy decisions that go against the preferences of mobilized groups in their society, and even against the
preferences of the electoral coalitions that brought them in office. One could say that in terms of the
analytical value of the concept for the understanding of trade policy-making, this ability and
preparedness provide the essence of the concept. From there on, different substances can be given to
these strategic interests, or to the policy decisions that may promote them. Foreign market shares are
certainly among them, and one way to get them, or to promote them, is to react to policies conducted
by third countries that may lead to trade diversion in favour of competing countries. But foreign market
shares are not just a matter of trade diversion. They are also a matter of competitiveness. Moreover,
they are increasingly a matter of competitiveness.
Competitiveness, Third-Country Market Shares, and Pro-Active Trade Policies
From the notion of positional competition, we take the conclusion that political actors may be able and
8

prepared to act against the mobilized interests in their society, and even against the preferences of the
electoral coalitions that brought them in office. We also take the conclusion that concerns about
competitiveness, and thus Schumpeterian thinking, may matter here. But the question remains why it
should matter in the case of the EU’s external trade policies. Why would EU policy-makers risk the
wrath of interest groups and voters for the sake of competitiveness? Why is it plausible to assume they
would? The answer contains two components. The first one is related to third-country market
dependence, and the second to the rise of that dependence.
It is clear that the EU, with its large internal market, provides companies with a large potential outlet
for their products. But in that market, EU companies face the growing competition from non-EU
producers, and the list of countries where these producers originate is getting longer. At the same time,
the purchasing power of a number of these third countries is growing as well, or is supposed to grow
significantly in the near future. Emerging economies like China, Brazil, Thailand, or Malaysia are cases
in mind. For EU producers, most growth potential is located in such markets; apart from the third
country markets to which they already export intensively (cf. the U.S., Canada, Australia). A significant
part of the EU’s economic growth potential is thus situated in such markets. But this is not only the case
for the EU. In these markets, EU companies face, and will increasingly face, competitors. In the U.S.
market, EU companies will have to face U.S. companies next to Chinese, Japanese, Brazilian, etc. In the
growing Chinese market it will be American, South Korean, Japanese, and Malaysian competitors. In
Brazil, it will be the competition from China, the U.S., and eventually India.
As it concerns third-country markets, the ability for the EU to influence its access to these markets is
limited. Whenever it concerns bilateral trade between two trading blocs, reciprocal negotiations in
which access concessions are exchanged, may significantly affect the opportunities of each to export to
the other. This is much less the case when it concerns the competition with producers from another
country in the market of a third country. Industrial and regulatory trade policy tools are not readily
available for improving ones competitive position vis-à-vis competitors in these markets. Preferential
trade agreements may do the job, but over time even the impact of this approach is limited as important
third country markets tend to be targeted for such agreements, not just by the EU but also by its
competitors, particularly the U.S., and increasingly China.
The alternative is therefore to become more competitive at home as envisioned in the Lisbon Strategy.
With regards to trade policy this implies unleashing the gale of creative destruction through the opening
of the domestic market. By opening its own market to international competition, the EU forces its own
companies into strategies that enhance their competitive position in the markets of third countries, both
9

directly (in terms of more optimal price/quality ratios), and indirectly (through total factor productivity
effects), and as such, increases the probability that they and their EU employees will be able to reap the
benefits of growing purchasing power in these markets.1
Third country market dependence does not only exist because profiting from growing potential export
markets is tempting and attractive. It also exists because Europe has a problem on its hands when it
comes to domestic demand, at least in the longer run. As German Chancellor Angela Merkel recently
remarked with regard to Germany (Financial Times, March 28-28, 2009, p. 1), the EU population is both
shrinking and ageing, and as such, the overall purchasing power growth perspectives in the EU are not
very promising. With rising social security costs (due to ageing), the EU economy will be forced to look
for its growth opportunities outside the EU. As such, enhancing competitiveness through Schumpeterian
trade policies may be a question the significance of which goes beyond trade policy as such.
The temptation (and necessity) of promising third-country markets and the limits of the PTA approach
provide the incentives for public policy-makers to follow a Schumpeterian course. This doesn’t refute
reactive trade policy models. It only indicates that it is plausible to take the possible operation of pro-
active Schumpeterian policy intentions in the EU’s external trade policy serious too. This implies one
important thing: that trade policy-makers are prepared to open their markets in sectors where their own
domestic companies are not yet fully ready to face global competition, exactly with the purpose of
forcing them to become so. As such, the empirical test of the Schumpeterian approach in the EU – of
which we find many traces in EU rhetoric on trade – consists of showing that the EU liberalized its trade
with the outside world in sectors where a gap existed between the (lower) level of EU competitiveness
and the (higher) level of competitiveness of a significant number of competing countries or trading blocs.
That is indeed our hypothesis.
Empirical analysis
In order to test our hypothesis, we tried to develop an approach that enables us to distinguish reactive
and proactive behavior from what can be conceived as “normal” government behavior. We consider as
normal behavior the liberalization of sectors that are competitive enough to win from such liberalization,
1 Another way to deal with third country market opportunities consists of concluding preferential trade agreements with these countries. There are problems however. First, we do not see that many PTAs that the EU has concluded or negotiated with such promising third countries. Second, the effect of such a strategy is limited as one may expect that PTAs concluded by the EU with promising export markets will trigger political mobilization in other countries – particularly the U.S. – for PTAs with these countries. Several authors have pointed at this domino effect or at its political economy (Dür, 2007).
10

and the protection of sectors that are weak in competitiveness terms. The correlation between tariff
changes and competitiveness levels would thus be negative, with higher competitiveness corresponding
with a greater reduction in tariff-rate. Reactive government behavior would result in a slightly different
outcome. In cases of high competitiveness, less trade liberalization would occur than the normal model
would suggest, as governments are confronted with an undersupply of pressure in favor of trade
liberalization and an oversupply of pressure against it. Proactive government behavior would equally lead to
a different outcome, but in a different way. Here, governments would open up sectors that suffer from
competitive weaknesses, so as to expose them to Schumpeterian dynamics.
This is summarized in Figure 1.
Figure 1: Conceptual framework
We chose as an operationalization of competitiveness the value added per labor cost.2 Ideally we would
have an indicator that measures the per unit production costs on the most disaggregate level; however as
a second best approach, our indicator is certainly sufficient (Konings, 2004).
Competitiveness is a relative concept and the threshold above which a sector is considered to be
competitive is likely to differ across sectors and across time. If we want to make more general
statements it is necessary to obtain uniform measures of competitiveness across sectors. There are two
possibilities to transform our competitiveness indicator into one that is uniform across sectors and years.
The first is to construct a distance to frontier measure in which you compare the competitiveness of a
certain country with that of the best performer in the sector at that time (cf. Acemoglu et al., 2002), the 2 Data stems from the World Bank Trade, Production and Protection database. See Nicita and Olarreaga (2007)
11

other way is to estimate the distribution function and calculate the percentage of countries that perform
worse. The latter differs with the former in that it takes into account the position of all other countries,
while the former only compares with the best performing one. As the best performing country is often
an outlier, the distribution-based indicator seemed most appropriate. 3
The distribution function most fitting for our competitiveness indicator appeared to be the lognormal
been aggregated for the European Union by using the number of employees of
igure 2: Scatter plot of competitiveness –tariff change in the European Union
distribution. 4 We calculated the necessary parameters on a yearly basis for each sector and after
imputing the competitiveness of the different countries in the cumulative distribution function, we
obtained our indicator.
Competitiveness data has
the different member states as a weight. We generated a scatter plot placing the change in tariff on the
Y-axis and the competitiveness level on the X-axis. Each dot represents a sector-year. We omitted
observations in which there was no tariff-change for graphical clarity.
F
-0.8-0.6
-0.4-0.2
00.2
0.40.6
0.8
0 0.1 0.2 0.3 0.4 0.5
Competitiveness
Tarif
f cha
nge
hat is quite striking in this graph is the relatively low level of competitiveness of the European Union.
W
On average only 23% of the world performs worse. A likely reason for this might be found in the role
that wages play in our indicator. In a number of European countries, wage setting is done on the basis of
productivity. When labor is well organized, any increase in productivity will be met with an equal
increase in wages. This low competitiveness is not as dire as it might look; proximity to the market,
3 One might argue that a rank order is better for this purpose as it does not involve an approximation through a distribution function. Using ranks however implies losing the information about the positional gap between the different countries. Moreover a rank-based indicator is heavily influenced by data availability. A country should not be considered more competitive just because data on other countries were missing for that year. 4 We tested sector by sector on log normality through the Shapiro-Wilkinson test for three-parameter log normality. From our sample only two sectors did not fit this function i.e. the petroleum industry and the tobacco sector, henceforth these were omitted from the further analyses.
12

quality premiums and heterogeneous goods, are guaranteeing that it is far from necessary to become the
most competitive region in order to survive. The flipside is however that in that case, companies will
only be able to rely on their domestic (in this case EU) market. In the longer run, a policy aimed at
targeting the domestic market only, is not sustainable. That itself may be an argument for governments
to target Schumpeterian dynamics.
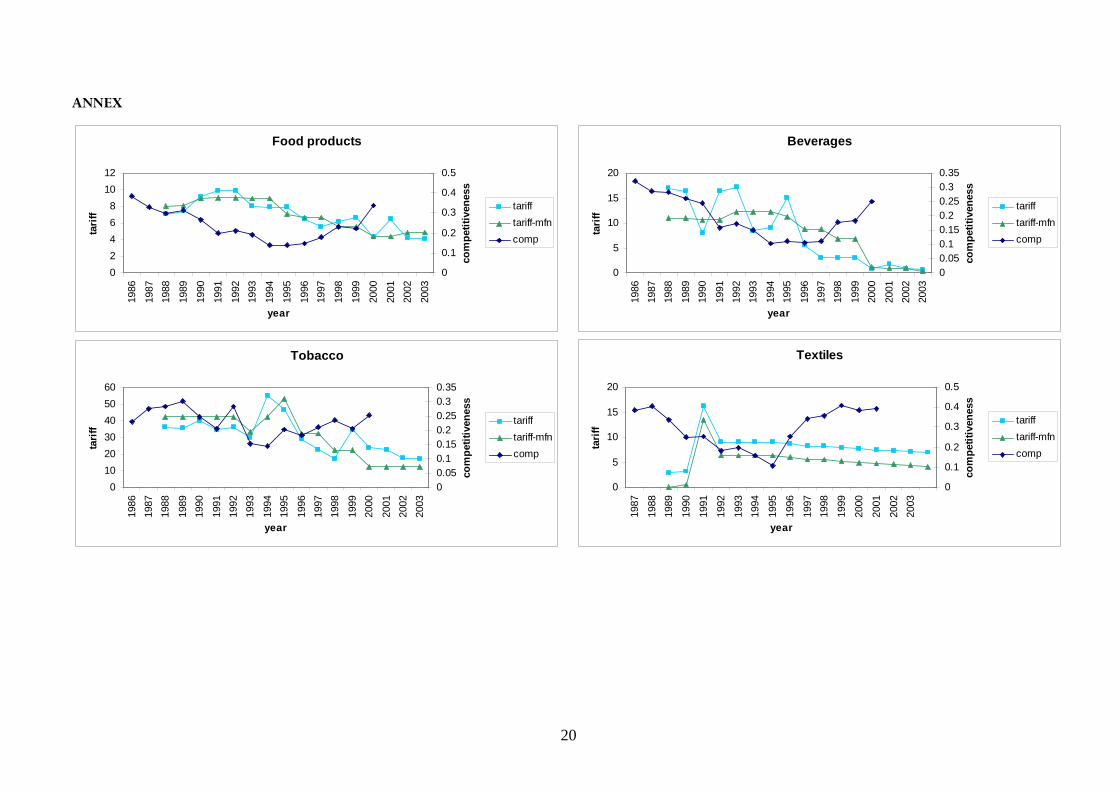
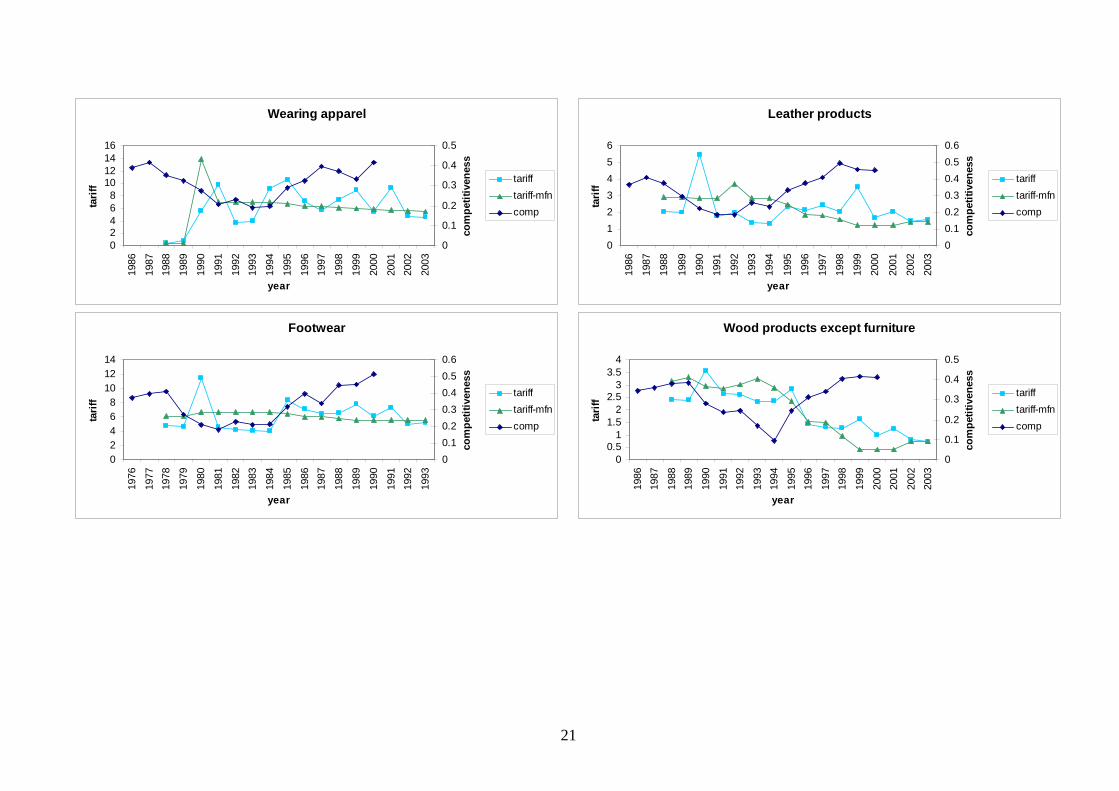
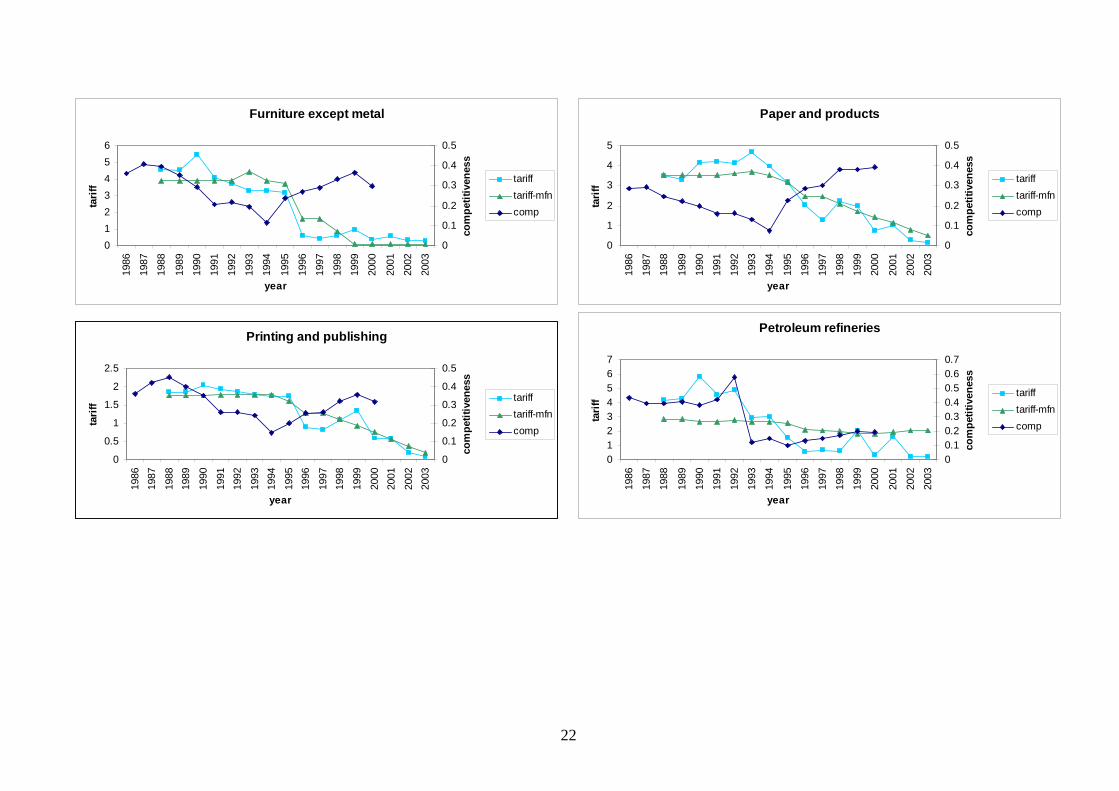
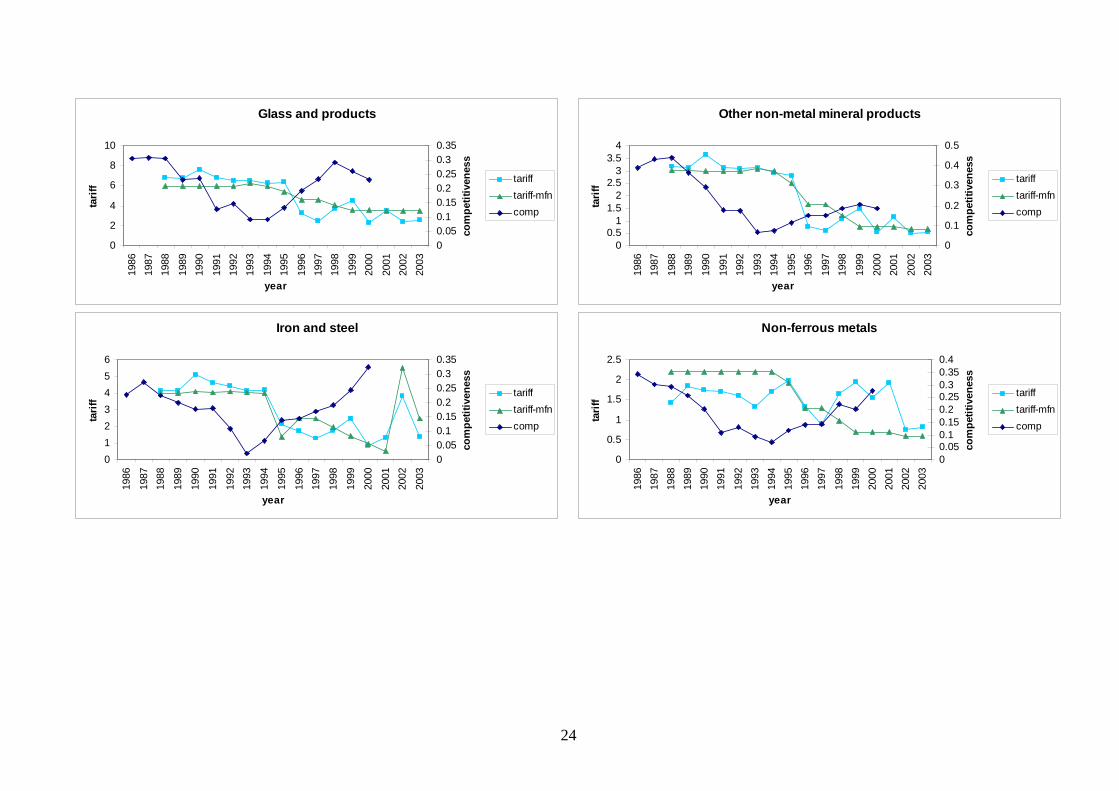
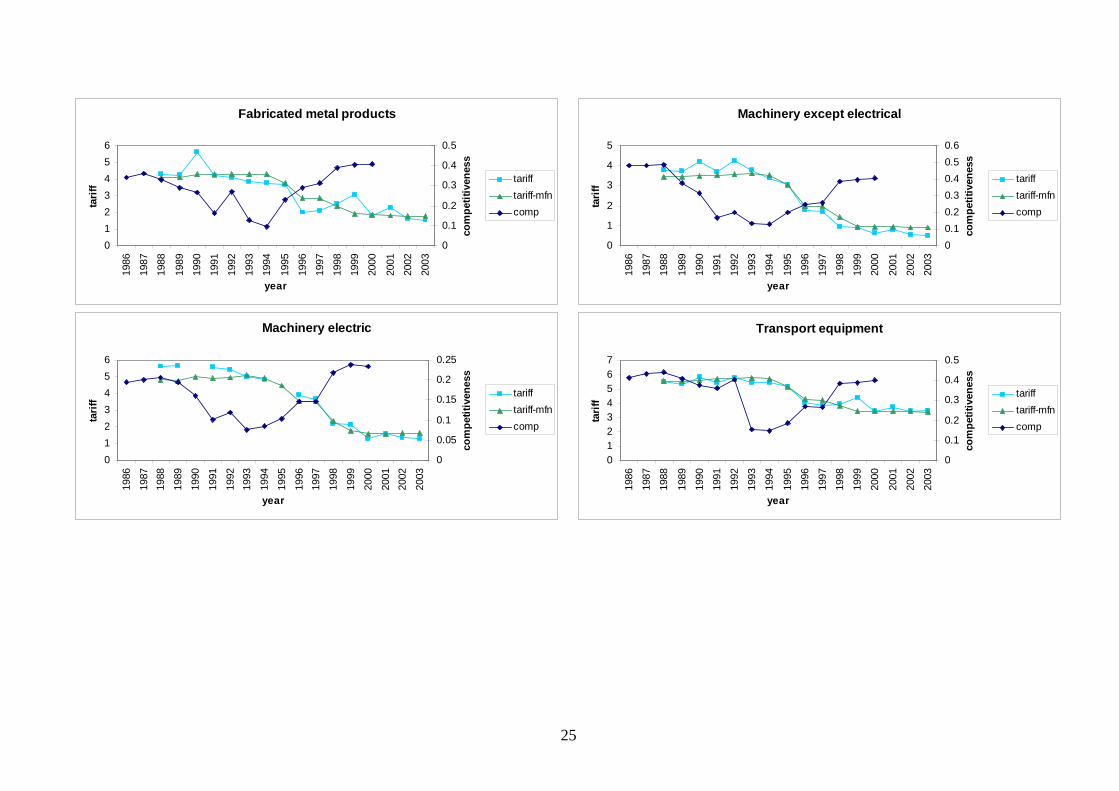
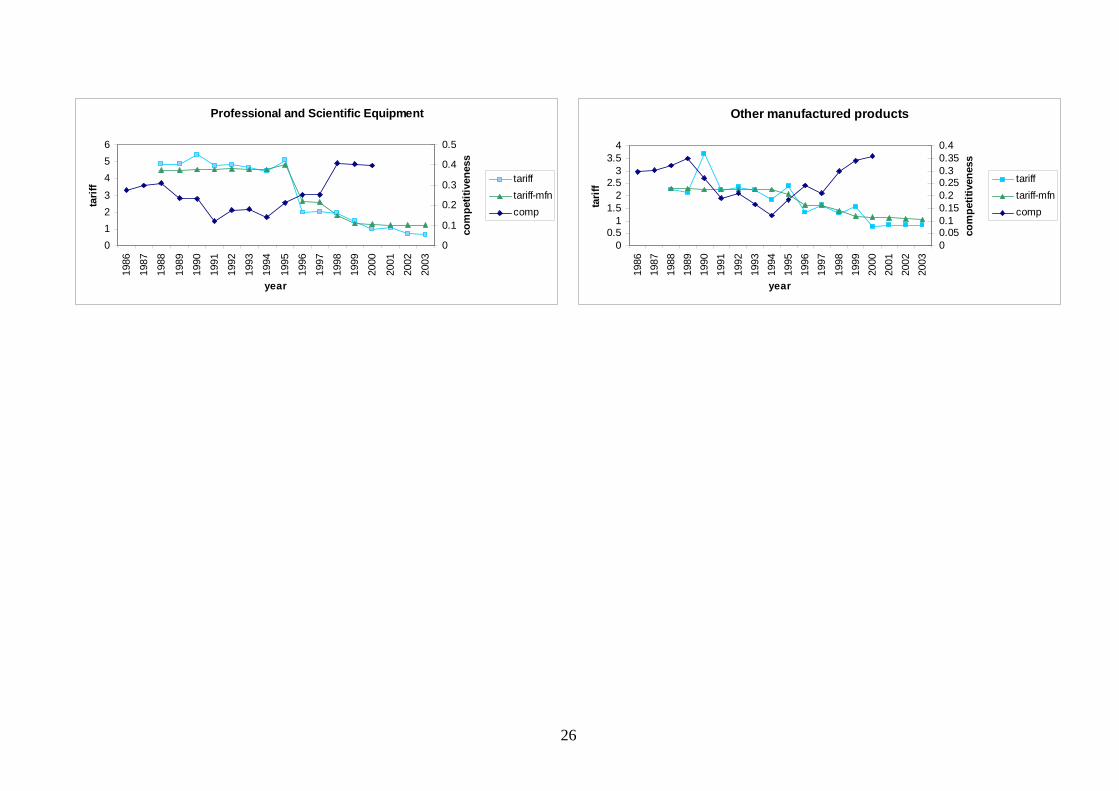
Of greater importance for our analysis is that there is no negative correlation. This urges us to
Figure 3, 4 and 5 we plotted out the evolution of our competitiveness indicator and its corresponding
lity. Periods of higher
nd competitiveness levels in the EU
reconsider the research methodology we proposed earlier. If no general rule is observed, deriving
deviations from the ‘unobserved rule’ is quite pointless. In order to make any useful statements on pro-
active trade liberalization, we need to dig a little deeper into the data.
In
tariff rate for “Non-Electrical Machinery”, “Printing and Publishing” and “Wearing Apparel” respectively.
These graphs allow us to address most observations over the different sectors.5
First some basic remarks: the competitiveness data shows traces of cyclica
competitiveness proceed periods of lower competitiveness. Tariff rates on the other hand appear to be
rather stable until 1994-1995, after which they experience a steady decline. Unsurprisingly this was not
the case for textiles and clothing.
Figure 3: Evolution of tariffs a
Machinery except electrical
0
1
2
3
4
5
1986
1987
1988
1989
1990
1991
1992
1993
1994
1995
1996
1997
1998
1999
2000
2001
2002
2003
year
tarif
f
00.10.20.30.40.50.6
com
petit
iven
ess
tarifftariff-mfncomp
At first sight the countercyclical movements of tariff rates in figure 3 and to a lesser extent in figure 4
y
suggest a sense of pro-active policy making i.e. when the sector is at its weakest, tariff rates go down.6
These countercyclical tendencies are not observed for all different sectors. Sectors that are vocall
opposing trade liberalization such as the textiles and clothing sectors show completely different
5 Graphs for the other sectors can be found in the Annex 6 These findings correspond to those observed by Hanson (1998). By analyzing the data he came to the same question but suggested a more generic answer i.e. the completion of the single market.
13
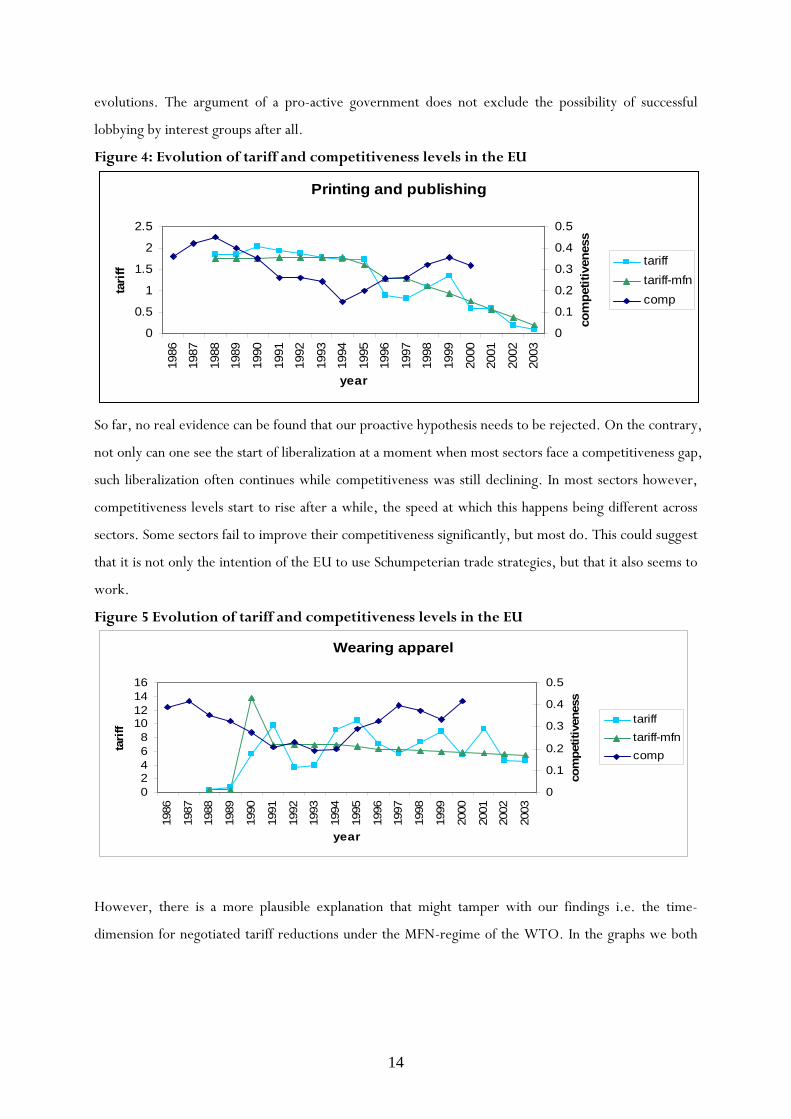
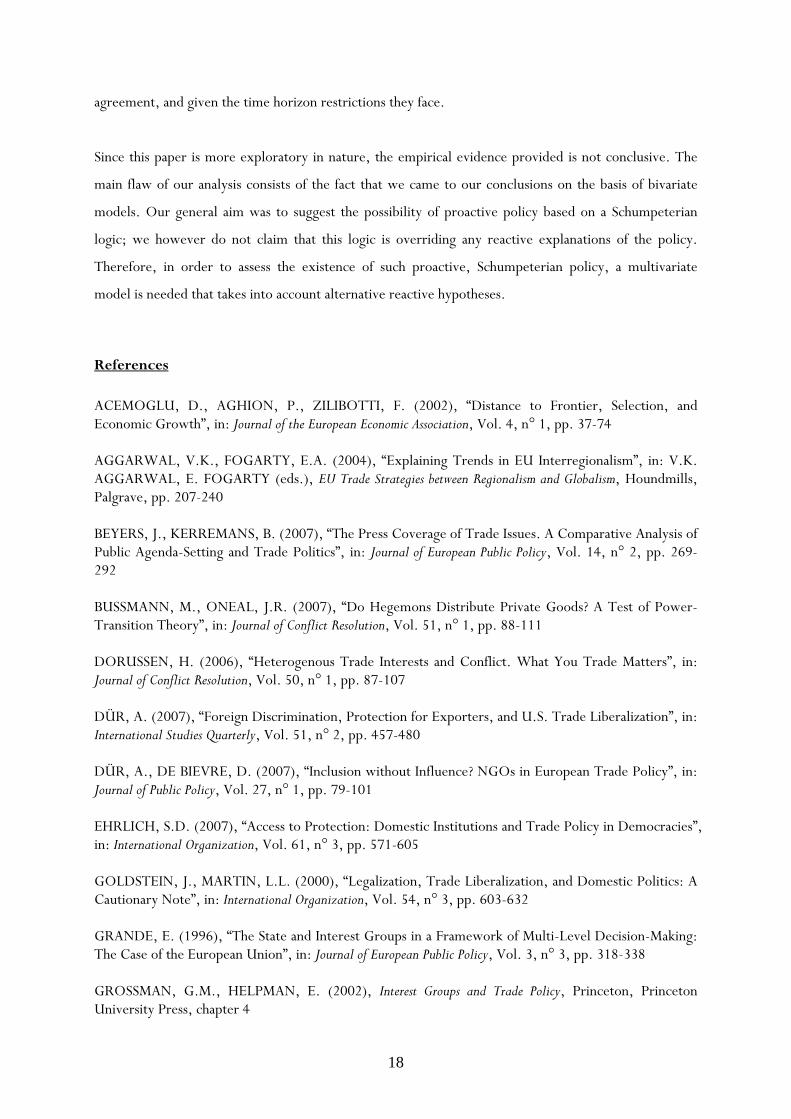
evolutions. The argument of a pro-active government does not exclude the possibility of successful
lobbying by interest groups after all.
Figure 4: Evolution of tariff and competitiveness levels in the EU
Printing and publishing
0
0.5
1
1.5
2
2.5
1986
1987
1988
1989
1990
1991
1992
1993
1994
1995
1996
1997
1998
1999
2000
2001
2002
2003
year
tari
ff
0
0.1
0.2
0.3
0.4
0.5
com
petit
iven
ess
tarifftariff-mfncomp
So far, no real evidence can be found that our proactive hypothesis needs to be rejected. On the contrary,
5 Evolution of tariff and competitiveness levels in the EU
not only can one see the start of liberalization at a moment when most sectors face a competitiveness gap,
such liberalization often continues while competitiveness was still declining. In most sectors however,
competitiveness levels start to rise after a while, the speed at which this happens being different across
sectors. Some sectors fail to improve their competitiveness significantly, but most do. This could suggest
that it is not only the intention of the EU to use Schumpeterian trade strategies, but that it also seems to
work.
Figure
Wearing apparel
02468
10121416
1986
1987
1988
1989
1990
1991
1992
1993
1994
1995
1996
1997
1998
1999
2000
2001
2002
2003
year
tarif
f
0
0.1
0.2
0.3
0.4
0.5
com
petit
iven
ess
tarifftariff-mfncomp
owever, there is a more plausible explanation that might tamper with our findings i.e. the time-H
dimension for negotiated tariff reductions under the MFN-regime of the WTO. In the graphs we both
14

depicted the evolution of import weighted average tariff rates and the average MFN tariff-rate.7 It is
clear that the trend in the overall tariff rate is strongly driven by the trend in the MFN-rate. This
requires that we look at tariff negotiations in the WTO, particularly during the Uruguay Round. At the
conclusion of the Uruguay round negotiations in November 1993 government officials agreed on a
general scheme for tariff reduction and a corresponding time-frame in which these reductions would be
applied. The implications this holds for our analyses are quite pervasive. A year to year analysis on the
basis of the raw data is clearly misleading. It would give the impression that tariff reductions were
decided from year to year and that in each year, the EU was led by Schumpeterian motives. This is not
the case. Changes in the tariff rate were mostly the result of an agreement that was concluded at one
particular point in time, and implemented gradually afterwards. The political economy of the tariff rate
reduction thus needs to be studied at the point in time were the reductions were agreed to, this in
combination with the benefits and losses that the different actors involved expected at that time. Any
inference based on contemporary economic variables on an annual basis without taking the negotiated
tariff reductions into account is likely to be fraud.
In order to assess the validity of pro-active policy making in the European Union, we should therefore
do an analysis based on the expectations that were held at the time of the negotiations in their conclusive
stage, and on the forecasts of competitiveness held by the different protagonists at that time. What we
see in the graphs depicted above is that the EU committed itself to tariff reductions at a moment that
indeed, many EU sectors were suffering from a competitiveness gap. Not only does this suggest that the
EU was acting proactively with possibly Schumpeterian motives in mind, but also that by concluding an
agreement, it put the EU and its industrial sectors on a path of trade liberalization from which later on,
it would be difficult, if not prohibitively costly, to deviate. The real test of our hypothesis consists then
of trying to assess how different societal players were looking at trade liberalization and its effects over
time at the time of the conclusive negotiations. Did they expect to be among the winners over time? Did
they expect short-term losses and long-term gains? Or did they have to act in the context of necessarily
short time horizons in which expectations of losses prevailed? If that is the case, one can really make a
case for proactive Schumpeter-inspired government policies by the EU.
Predicting future competitiveness is fraud with uncertainty, and uncertainty has political economic
consequences, as the literature suggests. While most of this research has pointed at the role of
7 The MFN-tariffs have been adjusted downwards by subtracting the average difference between weighted tariff and MFN-tariff. This has been done to emphasize the large influence MFN-tariff rates have on the average tariff rate.
15

uncertainty in the lack of pro-liberal mobilization, it could equally well be the case that protectionist
interests face exactly the same kind of uncertainty. Sectors that are competitive will therefore most
heavily mobilize if they expect future difficulties in the short-run. If we can show that in case of such
expectations, the EU still decided to liberalize by putting the EU on a path of liberalization, the case for
Schumpeterian-inspired behavior can be made stronger.
Figure 6 Relationship between competitiveness and MFN tariff changes (1992-2000)
MFN -tariff
-0.6
-0.5
-0.4
-0.3
-0.2
-0.1
00 0.1 0.2 0.3 0.4 0.5 0.6 0.7
competitiveness
chan
ge in
tarif
f
OtherMachineryTextiles & Clothing
One rudimentary way of doing so is through the scatter plot provided in figure 6. This plot tries to
depict the liberalization path8 that was created when most of the concessions were agreed to during the
Uruguay Round negotiations. For convenience we take the level of competiveness in 1992 as a forecast
for the future position. The liberalizations realized from 1992 until 2000 determine the liberalization
path. The outcome is relatively clear. On the one hand, there is no indication that the EU engaged in a
trade-off between its strong and weak sectors, in which the protection of the weak ones was traded off
against the liberalization of the strong ones. On the other hand, the scatter plot shows that all of the
sectors were exposed to trade liberalization, but that among these, a significant number of weak ones
faced substantial trade liberalization.
Clearly, even in sectors that were considered to be competitively weak at the time of the trade
negotiations, and thus at the time when paths to liberalization were defined, the EU opted relatively
consequently for market opening, and thus potentially, for an exposure of these weak sectors to
8 In order to take into account that sectors with relative low levels of protection cannot experience large absolute reductions
in tariff, we used 19922000
19922000
tarifftarifftarifftariff
+−
as our measure of tariff change.
16

Schumpeterian dynamics. This seemed especially the case for the machinery sectors. Other sectors, such
as those in textiles and clothing are more likely to follow a reactive logic. Our analysis thus far has only
been bivariate and does not take many of the alternative hypotheses into account. In order to make more
elaborate statements on the prevalence of a pro-active, Schumpeterian logic in trade policy and how it
relates to the existing reactive approach requires a more thorough analysis. Our results however point
firmly at the possibility of such logic, both in the rhetoric used by the EU as in the empirical observations
made in this paper.
Conclusions:
This paper started with the argument that despite a large focus in the literature on reactive trade policy-
making a plausible argument can be made for proactive Schumpeterian trade policies in the EU. We
located this plausibility first in the observation that in the EU rhetoric on trade, Schumpeterian
arguments have consistently been present, and sometimes even been prevalent. In addition, plausibility
can also be derived from third country market arguments and the fact that the only way for the EU to be
competitive in third country markets is to focus on the export competitiveness of its own industries,
given the competition from other countries on the markets of third countries. Given a shrinking and
ageing EU population, only such markets can provide significant growth perspectives, both in exports
and employment in the EU.
Our data, in which we linked the evolution in competitiveness per sector with the evolution of the EU’s
tariff barriers, affirms the possibility of such proactive trade liberalization. In our view there are
sufficient reasons to take the Schumpeterian argument seriously, when studying the political economy of
EU external trade policy making. Our analysis however raises a number of new questions, questions
which we could not address (fully) in this paper.
The main issue in this regard is the importance of time horizons and, concomitantly, path dependencies,
when studying the political economy of EU external trade policy-making. Tariff dismantling decisions
are taken at a limited number of points in time, and societal and political actors define their preferences,
the intensity of these preferences, and the probability that they will respond to them through political
action, on the basis of forecasts about the impact of trade liberalization. The time horizons of such
forecasts are – given accuracy problems – relatively short, whereas the commitments for tariff
dismantling are in principle permanent (indefinite), and difficult to deviate from (path dependencies).
The challenge for research is then to try to identify the preference and preference-intensities of societal
actors, based as they are on the forecasts that these actors made at the time of the negotiation of a tariff
17
agreement, and given the time horizon restrictions they face.
Since this paper is more exploratory in nature, the empirical evidence provided is not conclusive. The
main flaw of our analysis consists of the fact that we came to our conclusions on the basis of bivariate
models. Our general aim was to suggest the possibility of proactive policy based on a Schumpeterian
logic; we however do not claim that this logic is overriding any reactive explanations of the policy.
Therefore, in order to assess the existence of such proactive, Schumpeterian policy, a multivariate
model is needed that takes into account alternative reactive hypotheses.
References ACEMOGLU, D., AGHION, P., ZILIBOTTI, F. (2002), “Distance to Frontier, Selection, and Economic Growth”, in: Journal of the European Economic Association, Vol. 4, n° 1, pp. 37-74 AGGARWAL, V.K., FOGARTY, E.A. (2004), “Explaining Trends in EU Interregionalism”, in: V.K. AGGARWAL, E. FOGARTY (eds.), EU Trade Strategies between Regionalism and Globalism, Houndmills, Palgrave, pp. 207-240 BEYERS, J., KERREMANS, B. (2007), “The Press Coverage of Trade Issues. A Comparative Analysis of Public Agenda-Setting and Trade Politics”, in: Journal of European Public Policy, Vol. 14, n° 2, pp. 269-292 BUSSMANN, M., ONEAL, J.R. (2007), “Do Hegemons Distribute Private Goods? A Test of Power-Transition Theory”, in: Journal of Conflict Resolution, Vol. 51, n° 1, pp. 88-111 DORUSSEN, H. (2006), “Heterogenous Trade Interests and Conflict. What You Trade Matters”, in: Journal of Conflict Resolution, Vol. 50, n° 1, pp. 87-107 DÜR, A. (2007), “Foreign Discrimination, Protection for Exporters, and U.S. Trade Liberalization”, in: International Studies Quarterly, Vol. 51, n° 2, pp. 457-480 DÜR, A., DE BIEVRE, D. (2007), “Inclusion without Influence? NGOs in European Trade Policy”, in: Journal of Public Policy, Vol. 27, n° 1, pp. 79-101 EHRLICH, S.D. (2007), “Access to Protection: Domestic Institutions and Trade Policy in Democracies”, in: International Organization, Vol. 61, n° 3, pp. 571-605 GOLDSTEIN, J., MARTIN, L.L. (2000), “Legalization, Trade Liberalization, and Domestic Politics: A Cautionary Note”, in: International Organization, Vol. 54, n° 3, pp. 603-632 GRANDE, E. (1996), “The State and Interest Groups in a Framework of Multi-Level Decision-Making: The Case of the European Union”, in: Journal of European Public Policy, Vol. 3, n° 3, pp. 318-338 GROSSMAN, G.M., HELPMAN, E. (2002), Interest Groups and Trade Policy, Princeton, Princeton University Press, chapter 4
18

HANSEN, B.T. (1998), “What Happened to Fortress Europe?: External Trade Policy Liberalization in the European Union”, in: International Organization, Vol. 52, n°1, pp. 55-85 HISCOX, M. (2001), “Class versus Industry Cleavages: Inter-Industry Factor Mobility and the Politics of Trade”, in: International Organization, Vol. 55, n° 1, pp. 1-46 KENNEDY, P. (1988), The Rise and Fall of the Great Powers. Economic Change and Military Conflict from 1500 to 2000, London, Fontana Press KONINGS, J. (2005), “Wage Costs and Industry (Re)location in the Enlarged European Union”, in: Swedish Economic Policy Review, Vol. 12 n°1, pp.57-81 KONO, D.Y. (2006), “Optimal Obfuscation: Democracy and Trade Policy Transparency”, in: American Political Science Review, Vol. 100, n° 3, pp. 369-384 MANSFIELD, E.D., BUSCH, M.L. (1995), “The Political Economy of Nontariff Barriers: A Cross-National Analysis”, in: International Organization, Vol. 49, n° 4, pp. 723-749 McGILLIVRAY, F. (1997), “Party Discipline as a Determinant of the Endogenous Formation of Tariffs”, in: American Journal of Political Science, Vol. 41, n° 2, pp. 584-607 McGILLIVRAY, F. (2004), Privileging Industry. The Comparative Politics of Trade and Industrial Policy, Princeton, Princeton University Press NICITA, A., OLARREAGA M. (2007), “Trade, Production and Protection 1976-2004”, in: World Bank Economic Review, Vol.21, n°1 pp. 165-171 OLSSON, J. (2003), “Democracy Paradoxes in Multi-Level Governance: Theorizing on Structural Fund System Research”, in: Journal of European Public Policy, Vol. 10, n° 2, pp. 283-300 POGUNTKE, T., AYLOTT, N., LADRECH, R., LUTHER, K.R. (2007), “The Europeanisation of National Party Organisations: A Conceptual Analysis”, in: European Journal of Political Research, Vol. 46, n° 6, pp. 747-771 SCHARPF, F.W. (1999), Governing in Europe: Effective and Democratic?, Oxford, Oxford University Press SCHNEIBERG, M. (2005), “Combining New Institutionalisms: Explaining Institutional Change in American Property Insurance”, in: Sociological Forum, Vol. 20, n° 1, pp. 93-137 SCHULER, D.A., REHBIEN, K., CRAMER, R.D. (2002), “Pursuing Strategic Advantage Through Political Means: A Multivariate Approach”, in: Academy of Management Journal, Vol. 45, n° 4, pp. 659-672
19
Food products
02468
1012
1986
1987
1988
1989
1990
1991
1992
1993
1994
1995
1996
1997
1998
1999
2000
2001
2002
2003
year
tari
ff
0
0.1
0.2
0.3
0.4
0.5
com
petit
iven
ess
tarifftariff-mfncomp
Beverages
0
5
10
15
20
1986
1987
1988
1989
1990
1991
1992
1993
1994
1995
1996
1997
1998
1999
2000
2001
2002
2003
year
tari
ff
00.050.10.150.20.250.30.35
com
petit
iven
ess
tarifftariff-mfncomp
Tobacco
0102030405060
1986
1987
1988
1989
1990
1991
1992
1993
1994
1995
1996
1997
1998
1999
2000
2001
2002
2003
year
tarif
f
00.050.10.150.20.250.30.35
com
petit
iven
ess
tarifftariff-mfncomp
tariff-mfncomp
tariff
Textiles
0
5
10
15
20
1987
1988
1989
1990
1991
1992
1993
1994
1995
1996
1997
1998
1999
2000
2001
2002
2003
year
tari
ff
0
0.1
0.2
0.3
0.4
0.5
com
petit
iven
ess
20
ANNEX
Wearing apparel
02468
10121416
1986
1987
1988
1989
1990
1991
1992
1993
1994
1995
1996
1997
1998
1999
2000
2001
2002
2003
year
tarif
f
0
0.1
0.2
0.3
0.4
0.5
com
petit
iven
ess
tarifftariff-mfncomp
Leather products
0123456
1986
1987
1988
1989
1990
1991
1992
1993
1994
1995
1996
1997
1998
1999
2000
2001
2002
2003
year
tarif
f
00.10.20.30.40.50.6
com
petit
iven
ess
tarifftariff-mfncomp
Footwear
02468
101214
1976
1977
1978
1979
1980
1981
1982
1983
1984
1985
1986
1987
1988
1989
1990
1991
1992
1993
year
tarif
f
00.10.20.30.40.50.6
com
petit
iven
ess
tarifftariff-mfncomp
Wood products except furniture
00.5
11.5
22.5
33.5
4
1986
1987
1988
1989
1990
1991
1992
1993
1994
1995
1996
1997
1998
1999
2000
2001
2002
2003
year
tarif
f
0
0.1
0.2
0.3
0.4
0.5
com
petit
iven
ess
tarifftariff-mfncomp
21
Furniture except metal
0123456
1986
1987
1988
1989
1990
1991
1992
1993
1994
1995
1996
1997
1998
1999
2000
2001
2002
2003
year
tarif
f
0
0.1
0.2
0.3
0.4
0.5
com
petit
iven
ess
tarifftariff-mfncomp
Paper and products
0
1
2
3
4
5
1986
1987
1988
1989
1990
1991
1992
1993
1994
1995
1996
1997
1998
1999
2000
2001
2002
2003
year
tarif
f
0
0.1
0.2
0.3
0.4
0.5
com
petit
iven
ess
tarifftariff-mfncomp
Printing and publishing
0
0.5
1
1.5
2
2.5
1986
1987
1988
1989
1990
1991
1992
1993
1994
1995
1996
1997
1998
1999
2000
2001
2002
2003
year
tari
ff
0
0.1
0.2
0.3
0.4
0.5
com
petit
iven
ess
tarifftariff-mfncomp
Petroleum refineries
01234567
1986
1987
1988
1989
1990
1991
1992
1993
1994
1995
1996
1997
1998
1999
2000
2001
2002
2003
year
tarif
f
00.10.20.30.40.50.60.7
com
petit
iven
ess
tarifftariff-mfncomp
22

Miscelanious petroleum/coal products
0
1
2
3
4
5
1986
1987
1988
1989
1990
1991
1992
1993
1994
1995
1996
1997
1998
1999
2000
2001
2002
2003
year
tarif
f
0
0.1
0.2
0.3
0.4
0.5
com
petit
iven
ess
tarifftariff-mfncomp
Rubber products
012345678
1976
1977
1978
1979
1980
1981
1982
1983
1984
1985
1986
1987
1988
1989
1990
1991
1992
1993
year
tarif
f
00.050.10.150.20.250.30.35
com
petit
iven
ess
tarifftariff-mfncomp
Plastic products
0
2
4
6
8
10
1986
1987
1988
1989
1990
1991
1992
1993
1994
1995
1996
1997
1998
1999
2000
2001
2002
2003
year
tarif
f
00.050.10.150.20.250.3
com
petit
iven
ess
tarifftariff-mfncomp
Pottery china earthenware
0
2
4
6
8
10
1986
1987
1988
1989
1990
1991
1992
1993
1994
1995
1996
1997
1998
1999
2000
2001
2002
2003
year
tarif
f
0
0.1
0.2
0.3
0.4
0.5
com
petit
iven
ess
tarifftariff-mfncomp
23
Glass and products
0
2
4
6
8
1019
8619
8719
88
1989
1990
1991
1992
1993
1994
1995
1996
1997
1998
1999
2000
2001
2002
2003
year
tarif
f
00.050.10.150.20.250.30.35
com
petit
iven
ess
tarifftariff-mfncomp
Other non-metal mineral products
00.5
11.5
22.5
33.5
4
1986
1987
1988
1989
1990
1991
1992
1993
1994
1995
1996
1997
1998
1999
2000
2001
2002
2003
year
tarif
f
0
0.1
0.2
0.3
0.4
0.5
com
petit
iven
ess
tarifftariff-mfncomp
Iron and steel
0123456
1986
1987
1988
1989
1990
1991
1992
1993
1994
1995
1996
1997
1998
1999
2000
2001
2002
2003
year
tarif
f
00.050.10.150.20.250.30.35
com
petit
iven
ess
tarifftariff-mfncomp
Non-ferrous metals
0
0.5
1
1.5
2
2.5
1986
1987
1988
1989
1990
1991
1992
1993
1994
1995
1996
1997
1998
1999
2000
2001
2002
2003
year
tarif
f
00.050.10.150.20.250.30.350.4
com
petit
iven
ess
tarifftariff-mfncomp
24
Fabricated metal products
0123456
1986
1987
1988
1989
1990
1991
1992
1993
1994
1995
1996
1997
1998
1999
2000
2001
2002
2003
year
tarif
f
0
0.1
0.2
0.3
0.4
0.5
com
petit
iven
ess
tarifftariff-mfncomp
Machinery except electrical
0
1
2
3
4
5
1986
1987
1988
1989
1990
1991
1992
1993
1994
1995
1996
1997
1998
1999
2000
2001
2002
2003
year
tarif
f
00.10.20.30.40.50.6
com
petit
iven
ess
tarifftariff-mfncomp
Machinery electric
0123456
1986
1987
1988
1989
1990
1991
1992
1993
1994
1995
1996
1997
1998
1999
2000
2001
2002
2003
year
tari
ff
0
0.05
0.1
0.15
0.2
0.25
com
petit
iven
ess
tarifftariff-mfncomp
Transport equipment
01234567
1986
1987
1988
1989
1990
1991
1992
1993
1994
1995
1996
1997
1998
1999
2000
2001
2002
2003
year
tarif
f
0
0.1
0.2
0.3
0.4
0.5
com
petit
iven
ess
tarifftariff-mfncomp
25
Professional and Scientific Equipment
0123
456
1986
1987
1988
1989
1990
1991
1992
1993
1994
1995
1996
1997
1998
1999
2000
2001
2002
2003
year
tarif
f
0
0.1
0.2
0.3
0.4
0.5
com
petit
iven
ess
tarifftariff-mfncomp
Other manufactured products
00.5
11.5
22.5
33.5
4
1986
1987
1988
1989
1990
1991
1992
1993
1994
1995
1996
1997
1998
1999
2000
2001
2002
2003
year
tarif
f
00.050.10.150.20.250.30.350.4
com
petit
iven
ess
tarifftariff-mfncomp
26