private school, public cost - nsw teachers … private school, public cost how school funding is...
TRANSCRIPT

1
Private school, public cost How school funding is closing the wrong gaps
Introduction A poorly planned hybrid arrangement of schools has evolved in Australia. The schools have much in common, but the differences are significant. On the one hand government owned and funded schools must be available and accessible to all families, regardless of their circumstances and location. Alongside these are publicly subsidised non-government schools1 – broadly grouped as Catholic and Independent - which have no such obligation and admit students whose parents can pay a fee. Over the last two years the total recurrent funding per student available to operate non-government schools has exceeded – in some cases greatly exceeded – the funding available to similar students in government schools. Within the next four years the per-student amounts paid just by governments to operate most Catholic and Independent schools will equal or exceed the amounts provided by governments to run similar government schools. Many Catholic schools, most notably in Victoria, had overtaken government schools in the level of their public funding by 2013. If recent trends
SYNOPSIS
Recent trends in school recurrent funding strongly suggest that over forty per cent of students in Catholic schools next year will average as much, if not more, public funding than their peers in similar government schools. Two years further on an additional forty per cent will most likely join them. Half the students in Independent schools are on track to get as much, if not more, than government school students by the end of the decade. This finding emerges as one of the most significant to date from our analysis of My School data. We have previously shown that changes in school funding in recent years – increasingly favouring students who are already advantaged - has done little for student achievement and nothing for equity. Earlier this year we pointed to a $3 billion over-investment in better-off students, without any measurable gain in their achievement. Now we find that state and federal governments, within four years, will be funding the vast majority of private school students at levels higher than students in similar government schools. Concerns about funding equity should now be joined by concerns about effectiveness and efficiency in how we provide and fund schools. The apparent runaway public funding of private schools is a legacy of discredited sector-based funding which the half-hearted implementation of the Gonski recommendations hasn’t really touched - and which current school funding schemes and dreams will almost certainly worsen. While Gonski pointed to the need to close the gaps in student achievement, the only gap being closed is that between government funding of its own schools and its funding of the schools that are considered to be "private". Private schools are about to operate at a far more substantial, and previously unimaginable, public cost. In this report we illustrate how funding has changed and how familiar claims about the relative cost of schools have become obsolete and misleading. We address questions which arise about our schools: what is public, what is private, what should be the difference between them, what obligations do and should fully-funded schools have to the public which pays to run them? Such questions have to be answered if schooling is to provide access and equity combined with effectiveness and efficiency. Chris Bonnor and Bernie Shepherd

2
are a guide, within four years the majority of non-government schools will cost the public more to run than will similar government schools. This incremental, yet dramatic, shift in public funding priorities has substantial implications for governments, schools and school authorities. We explain how this situation came about and how it could, and should, reshape the debate and decisions about school funding in Australia.
Some claims about schools and funding It is essential to place our analysis in the context of longstanding beliefs about school funding. For many years debates about schools have been strongly influenced by claims that the public funding of non-government schools is good policy, especially as it represents a considerable saving to governments. According to one such claim,
“If the 1.24 million students now in private primary and secondary schools were shifted back to public schools, Australian governments would face an annual extra cost of $9bn.2
Such a potential public cost has been described as “fiscal suicide”,3 something which would create a “financial tsunami”.4 According to the Independent Schools Council of Australia (ISCA) “Public funding allocated to independent schooling represents a highly efficient and effective use of government resources”.5 Victorian Catholic schools, according to one writer, operate on 10% less resources than government schools.”6 All this is achieved in the face of a claimed injustice, especially to students in Independent schools, who “…on average receive less than half the public support of students in government schools”.7 Despite this, their schools apparently perform an even greater public service: being part-funded by fees “frees up scarce government resources to be allocated to other priorities and reduces the need for government revenue-raising.8
Different numbers Statements about school funding always reward a closer scrutiny. Claims such as those above usually refer to averaged recurrent costs in government, Catholic and Independent schools. But the costs of schooling vary according to where schools are located and who they enrol. Averages might be useful if each sector enrolled similar students, but they clearly don’t.9 All students don’t cost the same to educate: those with advantaged backgrounds and circumstances are less costly, those coming from well behind require more support. In reporting the relative costs and claimed efficiencies in each sector it is essential to compare schools that enrol similar students. Data available on the My School website now makes this possible. We also need to use consistent data. Many statements about school costs use Productivity Commission figures. , But the Commission’s expenditure figures for government schools are inflated by the inclusion of the user cost of capital. As explained in Appendix 1, this is generally considered to add around 15% to the apparent cost of Government schools. The Commission is not comparing school apples with apples in terms of actual running costs. In contrast, the finance data on the My School website uses consistent methodology across all sectors - and should be used when comparisons are made between them. A third problem is that statistics date quite quickly and, as a consequence, can become misleading - regardless of the intention of those using them. It is reasonable to expect that journalists, advocates and peak education groups should seek and use current data and, where appropriate, update their figures whenever this data is quoted. The data on My School is the most current available: just one year old – two years in the case of finance data.

3
This combination of problems has painted a misleading picture of school costs and funding, a picture that has gone largely unchallenged in the public discourse. Examples abound. The most recent information on school funding, provided by the Independent Schools Council of Australia (ISCA), claims that public recurrent funding provided to Independent schools is half the level provided to government schools. This claim refers to dated information (2011-2012), only reports averages - and is based on Productivity Commission reports. It seems that, in attempting to prove its case, the ISCA has managed to combine all three questionable approaches. Resulting misinformation is often cited well after a reasonable use-by date.10 In a 2014 document the ISCA stated that “on average it costs the taxpayer almost twice as much to educate a student at a public school as it does as a private school”. But data from My School at that time showed that Independent schools in the ICSEA11 1000-1200 range, where over 85% of them are found, were funded by governments – on average - at 75% of the cost of government schools. In some contrast, the annual schools’ report issued by the National Catholic Education Commission (NCEC) uses My School data and shows how funding has changed over time. However, such good intentions can still go astray: a 2015 report entitled Catholic Schools in Australia still uses averaged and dated data to show that students in a Catholic school receive 77% of the public funding going to students in government schools.12 My School shows that the real average figure is just over 80%. But four out of five Catholic schools are found in the ICSEA 1000-1200 range - and they receive 92% of the public funding going to students in equivalent government schools.
What the 2013 figures show So how much do governments in Australia13 pay, each year, to run government and non-government schools? Or rather, how much did it cost in 2013, the most recent year for which finance data is available on My School? In spite of their limitations, let’s start with the simple averages, since they have been used almost universally up until now. According to ACARA's figures14, in 2013 state and federal governments spent an average of around $11,865 in recurrent funding on each government school student. They spent around $9,548 per Catholic school student, 80.5% of the government student figure – and $7,791 per Independent school student, around 66% of the government student figure. On a simple gross average, government school students certainly get the most from governments, something which was painted as an injustice by the current prime minister when he was in Opposition.15 But even these averaged figures don't support the claims often made about ‘savings’. If the saving is taken to be the difference in recurrent cost to government of a child in an 'average' private school ($8,764) compared to the same child in an 'average' public school ($11,865) it amounts to a difference of around $3,101 per child. If we extend this difference across the roughly 1.25 million non-government school students, the recurrent funding amount ‘saved’ by governments by funding non-government schools in 2013 was closer to $3.9 billion than the often-claimed $9 billion. But let's set these spurious numbers aside and examine the situation more systematically. The actual amounts involved in funding students vary considerably, especially between students at the advantaged and disadvantaged ends of the spectrum. At the disadvantaged end, students in any school sector get considerable public funding, well over the $20 000 mark. This is entirely appropriate as so many of these students have high learning needs, live in remote places or both and their parents have few resources with which to assist them. At the advantaged end in 2013 government school students were usually funded below $10 000 from government sources, those in non-government schools received public funding between 50% and 85% of this amount. Given that funding levels vary so substantially and for good reasons, we need to analyse large numbers of schools enrolling similar students if we want to understand the real differences in funding by sector. Indeed, we should look at all of the schools for which usable data is available. But rather than aggregating them together, we should examine them in "educational advantage" groupings, from the lowest to the highest and make a real effort to ensure that we are comparing like with like.
4
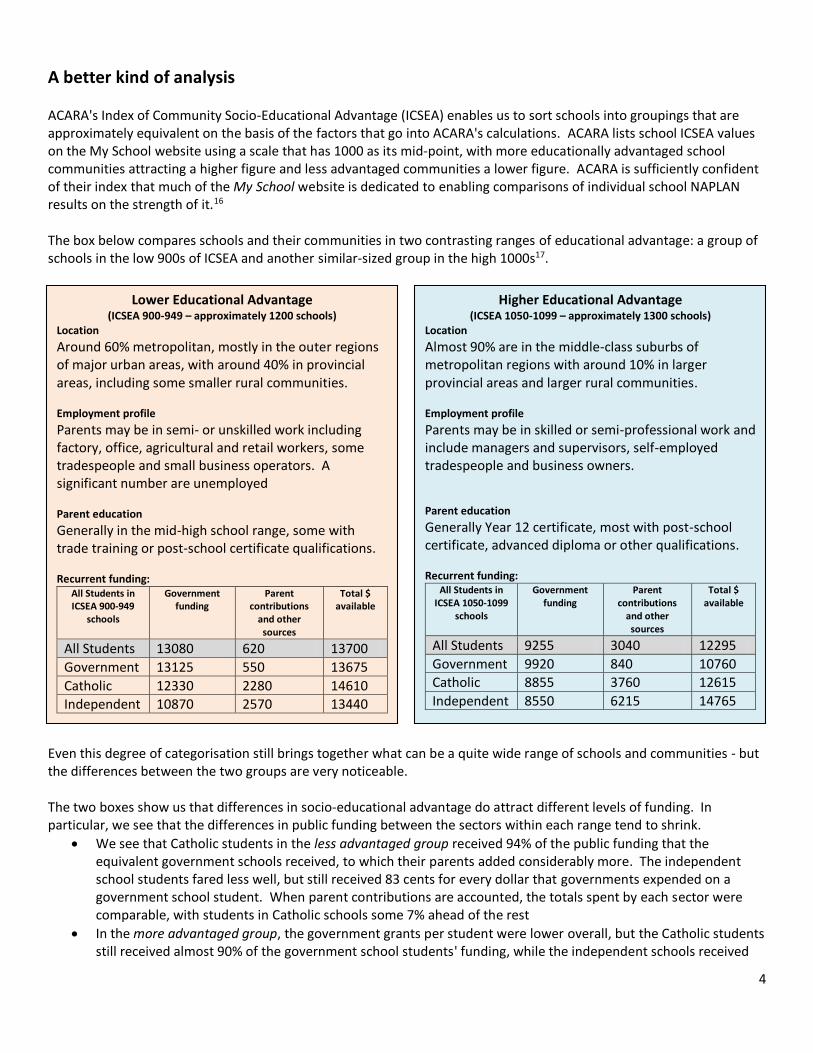
A better kind of analysis ACARA's Index of Community Socio-Educational Advantage (ICSEA) enables us to sort schools into groupings that are approximately equivalent on the basis of the factors that go into ACARA's calculations. ACARA lists school ICSEA values on the My School website using a scale that has 1000 as its mid-point, with more educationally advantaged school communities attracting a higher figure and less advantaged communities a lower figure. ACARA is sufficiently confident of their index that much of the My School website is dedicated to enabling comparisons of individual school NAPLAN results on the strength of it.16 The box below compares schools and their communities in two contrasting ranges of educational advantage: a group of schools in the low 900s of ICSEA and another similar-sized group in the high 1000s17.
Even this degree of categorisation still brings together what can be a quite wide range of schools and communities - but the differences between the two groups are very noticeable. The two boxes show us that differences in socio-educational advantage do attract different levels of funding. In particular, we see that the differences in public funding between the sectors within each range tend to shrink.
We see that Catholic students in the less advantaged group received 94% of the public funding that the equivalent government schools received, to which their parents added considerably more. The independent school students fared less well, but still received 83 cents for every dollar that governments expended on a government school student. When parent contributions are accounted, the totals spent by each sector were comparable, with students in Catholic schools some 7% ahead of the rest
In the more advantaged group, the government grants per student were lower overall, but the Catholic students still received almost 90% of the government school students' funding, while the independent schools received
Lower Educational Advantage (ICSEA 900-949 – approximately 1200 schools)
Location
Around 60% metropolitan, mostly in the outer regions of major urban areas, with around 40% in provincial areas, including some smaller rural communities. Employment profile
Parents may be in semi- or unskilled work including factory, office, agricultural and retail workers, some tradespeople and small business operators. A significant number are unemployed Parent education
Generally in the mid-high school range, some with trade training or post-school certificate qualifications. Recurrent funding:
All Students in ICSEA 900-949
schools
Government funding
Parent contributions
and other sources
Total $ available
All Students 13080 620 13700
Government 13125 550 13675
Catholic 12330 2280 14610
Independent 10870 2570 13440
Higher Educational Advantage (ICSEA 1050-1099 – approximately 1300 schools)
Location
Almost 90% are in the middle-class suburbs of metropolitan regions with around 10% in larger provincial areas and larger rural communities. Employment profile
Parents may be in skilled or semi-professional work and include managers and supervisors, self-employed tradespeople and business owners. Parent education
Generally Year 12 certificate, most with post-school certificate, advanced diploma or other qualifications. Recurrent funding:
All Students in ICSEA 1050-1099
schools
Government funding
Parent contributions
and other sources
Total $ available
All Students 9255 3040 12295
Government 9920 840 10760
Catholic 8855 3760 12615
Independent 8550 6215 14765
5
86%. Of course the parents in this case were able to more than compensate the difference and in the end their students had the benefit of 118% and 137% respectively of the total amounts spent on their government school peers.
What about the savings? With government already providing non-government schools with between 83% and 94% of the recurrent funds they give to their own schools, it is apparent that the 'savings' (or alternatively the 'costs' of taking these students into the public system) are not going to represent the huge "fiscal suicide" or "financial tsunami" that the commentators quoted above are predicting. A realistic way to calculate claimed savings is not to use gross averages, but to examine the cost differences incrementally across the advantage range, comparing the costs involved with students at similar levels of advantage. To do otherwise is to assume that the average (relatively advantaged) private school student would and should attract the same recurrent funding as the average (relatively disadvantaged) public school student. That is a fundamentally flawed approach, yet it is the basis for many of the wilder claims in this area of the school funding debate. Such an incremental calculation would look like the one given in Appendix 3. Using 2013 data and dividing the nation's schools into ten ICSEA groupings, we calculate the total difference between the government recurrent grants to private schools and the recurrent funding of ICSEA-equivalent government schools. For the record, the difference is around $2.2 billion, just 5.7% of the $38.9 billion total of government spending reported on My School for 2013. If the small size of that figure is a surprise to some, then a further surprise might be found in the fact that the difference has actually been getting smaller year by year.
2009-13 and projections
We now have five years of finance data on the My School website, enough to start identifying, not only differences between states and sectors, but trends over time. In a previous analysis we showed how increases in funding between 2009 and 2013 were favouring schools with advantaged students. In addition, there were clear sectoral differences in the distribution of government funding: between those years18 public funding (per student) increased by 12.4% to government schools, 23.5% to Catholic and 23.8% to Independent schools.19 The continued funding of schools by sector, rather than by need, as recommended by Gonski, has shifted the balance between public funding of government and non-government schools - with profound implications. This is explained in the next two graphs, but some cautions are needed. Many factors impact on the direction and distribution of funding. The history of school funding is littered with special deals and decisions made by governments, especially in response to pre-election advocacy from school peak groups, as illustrated by school funding decisions made in NSW and Victoria in 2015. There will also be increasing differences between the states (see Appendix 5) based on the extent to which they implement what has evolved out of the Gonski recommendations. Various ideas will come and go. There are current plans to review federal-state relations including in education – but suggestions to date aren’t designed to address funding equity. The reality is that there seems little other than ‘more of the same’ on the horizon. In their landmark review of school funding, Lyndsay Connors and Jim McMorrow have concluded that under current policies, schools funding will continue to be unstable, divisive and costly. Proposed per student funding of schools after 2017, they say, will in effect freeze the state of affairs in schools at that date.20

6
The goal posts are moving
The effect of progressive changes in funding can be seen most clearly if we look at the public funding of private schools as a percentage of the funding of equivalent government school students in the same year. Data for the full ICSEA range is presented below, although as the coloured background indicates, most Catholic students are in schools in a range between 950 and 1150.
This graph shows the recurrent public funding of ICSEA-grouped Catholic schools, with the amount in each year expressed as a percentage of the recurrent funding of government schools in the same year and ICSEA range (taken as 100% within each range). For example, in the ICSEA range 1000 to 1049 in 2009, public funding for each Catholic school student was 82% of public funding for each government school student. In 2013, Catholic school student public funding was 94% of government school student funding in that range. This shows clearly how the proportion of public funding has risen in all ICSEA groupings over the years. It is easy to follow the trend and judge that within the next two-three years most students in Catholic schools will reach an average 100% of government funding in several of the ICSEA groupings. Two of the groups (1000 to 1049 and 1050 to 1099) account for around 72% of Catholic school students. These students will reach that level by the funding year of 2016-17. Many individual Catholic schools already are at these levels. In another analysis we surveyed the 2013 recurrent funding of secondary schools in NSW and Victoria federal electorates to discover that 30% of Catholic schools in NSW and a substantial 60% in Victoria were already funded by governments at higher levels per student than at least one similar or more disadvantaged government school in the same electorate (See Appendix 2).

7
Independent schools also show an upward trend in public funding. Half of the students in these schools are on track to be funded at or above the level for similar students in governments by 2019-20. The direction and pace of growth is clearly evident in the graph below.
Some implications… Rapidly increasing levels of government funding have implications for all schools and raise many issues which should have been resolved years ago. Gonski’s recommendations would have achieved a sector-blind solution to the problems which are now becoming even more obvious. It was not to be, and we have to deal with the emerging consequences. Governments and school sectors will have to revisit what their schools are and do - and how they should be funded. In some ways government, Catholic and Independent schools have much in common. Their teachers and curriculum are much the same and their students jump through the same hoops. When schools enrolling similar students are compared, student results are not significantly different. This analysis now shows that they get – or will soon get - much the same public funding for their operation. The difference lies in their obligations. One sector is a fully-funded public system, obligated to be accessible and available to all students. It operates according to a raft of legislation and regulations designed to ensure that the schools meet all their public obligations. They are public schools and operate at public cost. The average ICSEA for schools in this system was around 983 in 2014. Non-government schools also operate substantially at a public cost - but in a legal and technical sense they are privately owned and operated. They enjoy complete flexibility in who they serve and how much they charge for this service. The

8
charging of fees alone ensures that non-government schools will serve a more advantaged segment of the population. The 2014 average ICSEA for Catholic schools was around 1040 and for Independent schools around 1071. Australia runs a poorly planned, hybrid system of schools, broadly comprising a fully funded public system alongside substantially public-funded, yet fee-charging ‘private’ schools. It would be difficult to come up with a better script to entrench and exacerbate socio-economic differences between schools and between communities. Other countries have avoided this problem: church schools in most OECD countries are fully funded but are obliged to operate in the same way and meet the same obligations as state-funded secular schools. Governments in those countries wanted to avoid the very problems that now face Australia. The increase in public funding for non-government schools in Australia has been gradual and unaccompanied by any review of their status within the total framework of schools. They have continued to operate under substantially different rules and obligations - on the basis that they are, or at least claim to be, private. In fairness, they have taken on greater compliance and accountability in areas such as curriculum, accreditation, workplace health and safety and child protection. But they have exemptions which still set them apart in ways that are now even more at odds with their ever-more-substantial public funding. In particular, they are not required to share the state's obligation of servicing every student in every location around Australia. Critics will be quick to point to instances of private schools in remote areas or others working with disadvantaged and disabled students and these, while laudable and in some cases heroic, are relatively few in number and far from the norm. To this can be added legal exemptions, such as those granted to religious schools under anti-discrimination laws around Australia. Media reports about statistics concerning student behaviour, suspensions and the like don’t mention non-government schools because they are not “government agencies” under Freedom of Information (FOI) legislation and don’t have to provide such information. There are many more examples, including teacher salaries, student dress and practices in student enrolment and welfare. While such differences have always existed the current and projected blow-out in the public funding of non-government schools renders such differences absurd and unsustainable. The case for a review of school obligations and operation is now compelling.
… and solutions
For as long as we can remember school funding in Australia has been driven by the claimed need to catch up with various other schools, sectors or countries. As class sizes reduce in one sector there are demands that it apply and be funded for others. As some schools parade a new technology it becomes essential for everyone. The funding of non-government schools has been oddly linked to the costs of government schools, even where the sectors enrol different students. Industrial and peak school groups cite resources applied to schools in some states as an argument for funding increases in others. When Labor announced its Gonski plans it was far too often pitched as Australia’s chance to catch up with Shanghai. So we can expect that some might argue that increased levels of non-government school funding, regardless of the source, should be automatically accompanied by increases for government schools. But Gonski clearly showed that such increases should be targeted to favour areas of greatest need, especially if we are to raise student achievement. We are clearly not doing that and in another study we have shown that the over-funding of advantaged students doesn’t deliver any measurable improvement in student outcomes.21 There is no effectiveness or efficiency in this funding, it amounts to an annual overspend of over three billion dollars. When politicians - including the current federal minister – claim that greater spending doesn’t yield results they should look carefully at where the money is going. If restrictions on public funding of schools are on any agenda for change then the question of funding from school fees and other private sources has to be there as well. What should be the role and scale of public funding when some

9
schools are funded, from all sources, at twice the level of others? The fact that much of this money comes from parents does not deflect the question. The current funding regime, quite unique to Australia, makes governments active and willing partners in arrangements which create, sustain and actually worsen a well-researched and documented inequity. Is there an argument to make public funding conditional on an appropriate ceiling being placed on combined funding from all sources, if only to ensure that our total investment in schools goes to where it provides the best returns? Apart from funding by need rather than by sector, there are other solutions which don’t focus on money. It is possible that the greatly increased public funding of non-government schools will revive demands that they be fully integrated into government systems, with all schools subject to the same obligations and rules. In the past this solution has been explored - especially in relation to Catholic schools - and dismissed as being too expensive for governments. That barrier is certainly much lower now. For a number of reasons the creation of such an integrated system in Australia would be problematic. It is highly unlikely, for entirely different reasons, that public education bodies and Catholic school authorities would entertain the idea. But that may not be the solution anyway: integration might have slowed, but certainly has not stopped, the social separation between school communities in England. It is also clear that even in integrated systems the rules can be bent, as evidenced by the re-emergence of what amounts to school fees in New Zealand Catholic schools. But attention still needs to be paid to how government and non-government schools could operate - and co-operate - in a sustainable way. One option is to shift the operation of public schools closer to that of private schools – the corollary is to have private schools operate in ways commensurate with their high level of public funding. We have seen efforts to achieve the first option but no action on the second. Public schools have received greater autonomy in their operation, although evidence of the effectiveness of greater school autonomy is at best mixed. Regardless, autonomy will always be limited by the obligation on public schools alone to provide access and comparable opportunities to every child in every location. The second option is to require non-government schools, as a condition of their public funding, to accept a wider range of obligations which reflect the extent of this funding. In its submission to the Gonski review the NSW Secondary Principals’ Council raised the idea of a charter for use of public funding. The purpose of such a charter would be to express the public purpose of government in providing public funding for education in operational terms. It would include specific reference to matters such as:
Public obligation In accepting public funding, a school would agree to act as an agent for the government in terms
of delivering its public purpose in education and agree to operate the school in a manner consistent with legislation
and regulations applying to government schools within the jurisdiction. This would include provisions related to:
Enrolment policies and practices
Curriculum delivery & assessment
Annual reporting
Employment practices
Child protection, discrimination & other social legislation
School uniforms
Discipline procedures, including suspension & expulsion
Complaints procedures
Fees Where a school provides particular resources or services above and beyond those related to the public
purpose, the school may charge fees for the provision of those resources or services, however the imposition and
level of fees will have the effect of reducing the school's entitlement to public funding.
Right of Access While non-government schools in receipt of public funding may declare and provide education
within a particular faith or ethos for their client community, they should not unreasonably restrict the access to the
school of any child, through fees or other administrative mechanisms or to those parts of their educational program
provided from public funds.

10
Some aspects of the proposed charter have already become part of practice in non-government schools, but there is considerable scope to do much more.
Conclusion When the My School website entered its second year - and its data became far more reliable - we began to investigate what it was telling us about our whole framework of schools. We have separately and jointly published22 data and accounts which confirmed significant social divisions between our schools, divisions which the OECD has reported as being greater than those found in equivalent countries.23 In the fifth and sixth years of My School we wanted to know the extent to which the data might show changes over time in such areas as student achievement, funding and equity. We especially wanted to know whether the findings of the Gonski review were confirmed by the data. Our findings, published in Gonski, My School and the Education Market24 not only confirm the warnings of the Gonski review but raised many unanswered questions. We were surprised to previously discover the high level of overspending on already advantaged students25 – but the scenario of governments funding competing schools ahead of their own is even more evidence that school funding has become dysfunctional. School funding has long been riddled with inconsistencies, opaque formulas and elusive deals, but what we are now heading into is territory that has not been charted - anywhere. It challenges the foundations of our whole framework of schools. More than that, it is a waste to continue to fund schools in ways which are ineffective and inefficient. It makes a mockery of repeated claims that governments can’t find the money needed to implement Gonski’s solutions. The problems created by inequity won’t go away without needs-based funding; we know that targeted investment in struggling schools makes a difference.26 Instead, Australia has created an uncomfortable scenario of over-funding some schools alongside demonstrable and unfulfilled need in others. We don’t have to look too far to find an answer to the age-old question “where will the money come from?” We have remained, along with most in the education community, committed to Gonski’s sector-blind solutions. We share the concerns expressed by others as some, but not all, governments seem to walk away from these solutions. It seems that policy-makers and school funders have suffered from a different form of sector-blindness: they have managed to avoid facing the mounting problems created by differentially funding the school sectors - while never acknowledging the real differences between them, and certainly never looking for solutions. Each mounting absurdity and inequity in our hybrid system of schools has posed a challenge. Will governments intervene to create improved student outcomes, greater equity, transparency and a sustainable balance between the sectors? Gonski is as close as we have ever gone to achieve this. Or will they encourage even more narratives to justify inertia and inequity – and now to justify funding ‘private’ schools at levels increasingly above their own? Chris Bonnor and Bernie Shepherd Chris Bonnor AM is a retired Australian principal, education writer and Fellow of the Centre for Policy Development. He is a previous president of the NSW Secondary Principals’ Council and author of several books including The Stupid Country and What Makes a Good School, both written with Jane Caro. Bernie Shepherd AM FACE is a retired principal with a long career in teaching and curriculum development in science and was the founding principal of the first public senior high school in NSW. He continues to be active in educational matters as a researcher, writer, consultant and mentor.

11
APPENDIX 1: The misuse of User Cost of Capital in schooling
From 1999-2000 national reporting on expenditure on public schools has included a notional cost of funds tied up in school buildings and other capital works, defined as User Cost of Capital (UCC). The principle behind the inclusion of UCC in government expenditure is that it takes into account the ‘opportunity cost’ of using the funds to provide schooling services rather than investing in other areas or in retiring debt27. The inclusion of UCC data in national reporting on schooling resources, however, is contestable. The idea that governments can realise their investment in school buildings and land in time for alternative uses is in most cases hypothetical. Amongst other problems is the fact that different conventions are now used in national reporting of public and private expenditures in non-government schools. For example, some commentators compare reported expenditures in government schools that include UCC with funding of non-government schools based on cash accounting processes that exclude UCC28. The outcome of this basic mathematical error is that the reported funding of government schools overstates the reported expenditure on government schools by almost $5 billion, or 15 per cent, compared with the comparable funding of non-government schools29. When other accrual accounting items are taken into account, the total reported spending on government schools is around $8 billion, or more than 20 per cent, higher than the cash accounting amounts that would logically be used for any comparisons with government grants for non-government schools. Funding comparisons over time and between sectors have to take into account the implications of the different accounting conventions used in national reports. Statistical advice and warnings included the Productivity Commission and the National Reports on Schooling are more often than not overlooked by commentators and analysts in their search for a preferred rationale.
APPENDIX 2: Some features of non-government school funding in NSW and Victoria: Schools with secondary enrolments and relevant data (MS 6.0) 2013 data. The following information was compiled following a visual survey of My School data
NSW Victoria
Number of Catholic schools – Average school enrolment 122 - 815 94 - 1010
Number of Independent schools - Average enrolment 225 - 689 132 - 850
Total number of non-government schools 347 226
Number of government schools - Average school enrolment 444 - 673 301 - 771
Number and % of Catholic schools receiving the same* or more government recurrent funding than a similar or lower ICSEA government school in the same electorate
36 schools 29.5%
57 schools 60.6%
Number and % of Independent schools receiving the same* or more government recurrent funding* than a similar or lower ICSEA government school# in the same electorate
11 schools 4.8%
17 schools 12.8%
Number of federal electorates 51 38
Number and % of electorates with at least one non-government school receiving more government recurrent funding than a similar or lower ICSEA government school
26 51%
25 65.8%
Number and % of electorates with three or more NG schools funded above equiv or lower ICSEA gov school
5 9.8%
12 31.6%
Notes: * includes schools with +/- $100 per student # Government schools with an ICSEA values within a range of 10 are also included

12
APPENDIX 3 Calculating the claimed saving to government of supporting non-government schools
Or
"Un-picking the Cherries" As discussed in the text, it is necessary to attempt to equate the educational needs of students before trying to compare the costs of government recurrent funding to groups of schools. Critics often claim that in doing this, researchers - ourselves included - "cherry-pick the data" to favour the case they want to make. The "case" that we want to make is one for the complete adoption of the principles of sector-blind and needs-based funding that were at the core of the Gonski Report. Nevertheless, to avoid any accusation of cherry-picking, this analysis sets out to use all of the available data. Although limited somewhat by ACARA's protocols in publishing data on My School, we have succeeded in incorporating over 98.5% of schools and around 99% of students. In order to equate educational needs, the My School website provides ACARA's Index of Community Socio-Educational Advantage (ICSEA). Not all schools have a published ICSEA. "Special" schools don't; nor do some very small schools where issues of privacy might arise. A small number of others have no ICSEA for reasons that are not disclosed. A small number do not have published 2013 funding data, either because they came into existence in 2014 or for other, unspecified reasons. Nevertheless, the My School website provides access to 2013 funding data for almost 9,300 schools, representing over 3.6 million students. That's a lot of cherries!
Schools without a published ICSEA
Our dataset had around 715 schools among the 2013 funding data that could not be grouped with the remainder due to the lack of a published ICSEA. The total of students in this category represents just 3% of all students in the national dataset, however they attract around 10% of all Federal and State/Territory government recurrent funding. The reasons for this are readily apparent when we begin to analyse the schools that fall into this category:
a. Special Schools
Over 400 of these 715 were Special schools and they represent an important, distinct category of schools, since they serve the students with the greatest educational needs30. Some 76% of the Special schools reported on the My School website with funding data are in the Government sector and their students attracted an average of $43,870 of government funding each. Students in Special Catholic schools received around $24,145 each and Special Independent school students $25,755. These figures represent 55% and 59% respectively of the Government Special school students' funding.31
b. Generalist Schools without a published ICSEA
The majority of these are small schools and are in non-metropolitan locations, many in remote areas, so their average per-student funding is on the high side compared to the remainder of the country's generalist schools. The government funding of this rather diverse mix of schools amounts to around $16,480 for Government school students; around $13,420 for Catholic students; $9,250 for Independent school students. The latter figures are 81% and 56% of government Special school students' funding in this category.
13
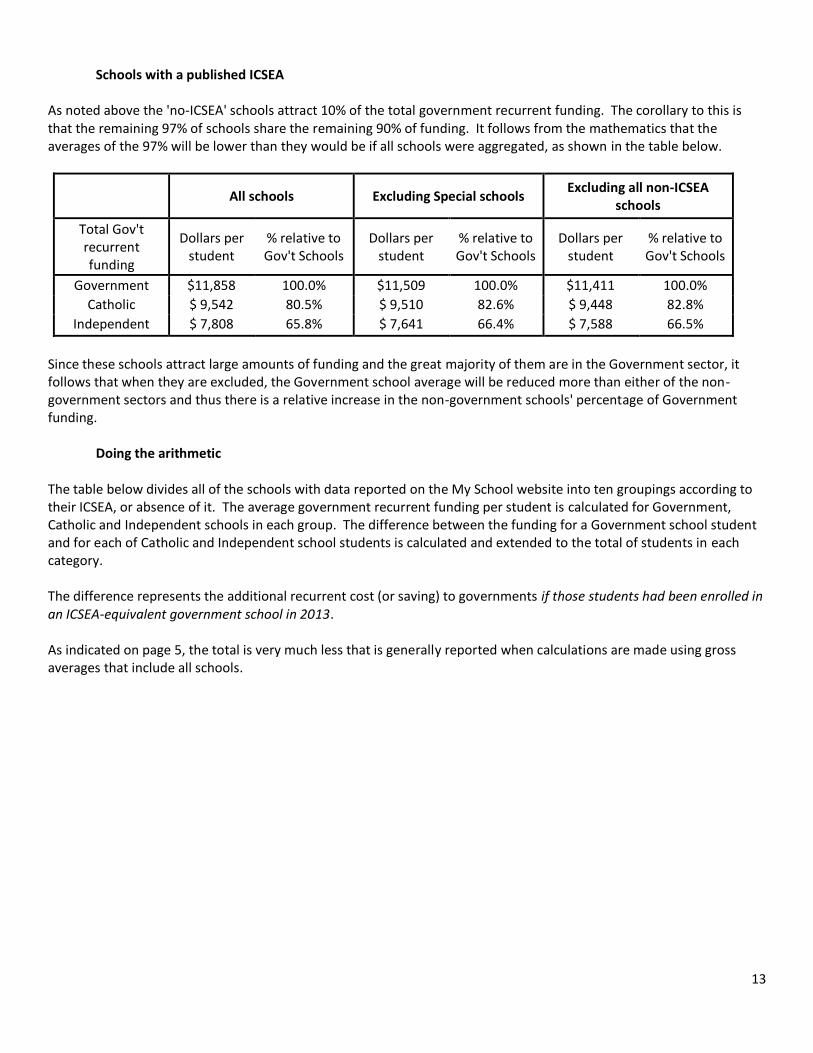
Schools with a published ICSEA As noted above the 'no-ICSEA' schools attract 10% of the total government recurrent funding. The corollary to this is that the remaining 97% of schools share the remaining 90% of funding. It follows from the mathematics that the averages of the 97% will be lower than they would be if all schools were aggregated, as shown in the table below.
All schools Excluding Special schools Excluding all non-ICSEA
schools
Total Gov't recurrent funding
Dollars per student
% relative to Gov't Schools
Dollars per student
% relative to Gov't Schools
Dollars per student
% relative to Gov't Schools
Government $11,858 100.0% $11,509 100.0% $11,411 100.0%
Catholic $ 9,542 80.5% $ 9,510 82.6% $ 9,448 82.8%
Independent $ 7,808 65.8% $ 7,641 66.4% $ 7,588 66.5%
Since these schools attract large amounts of funding and the great majority of them are in the Government sector, it follows that when they are excluded, the Government school average will be reduced more than either of the non-government sectors and thus there is a relative increase in the non-government schools' percentage of Government funding.
Doing the arithmetic The table below divides all of the schools with data reported on the My School website into ten groupings according to their ICSEA, or absence of it. The average government recurrent funding per student is calculated for Government, Catholic and Independent schools in each group. The difference between the funding for a Government school student and for each of Catholic and Independent school students is calculated and extended to the total of students in each category. The difference represents the additional recurrent cost (or saving) to governments if those students had been enrolled in an ICSEA-equivalent government school in 2013. As indicated on page 5, the total is very much less that is generally reported when calculations are made using gross averages that include all schools.

14
School Cluster
ICSEA Range
2013 State + Federal
Government funding
$/student
Percent of 2013 state +
Federal funding to
Government schools
Additional 2013
funding (saving) per student to
match Gov't schools
Additional total 2013
funding (saving) to
match Gov't schools
From to Sector Schools
1 400 599
Government 41 $23,154 100%
Catholic 0 - - 0.0 0 Independent 3 $22,193 96% $960.6 $305,458
2 600 799 Government 159 $21,668 100% Catholic 11 $26,658 123% -$4,989.6 -$4,503,127 Independent 9 $21,218 98% $450.3 $411,229
3 800 899 Government 478 $15,398 100% Catholic 21 $15,260 99% $138.5 $435,920 Independent 4 $14,098 92% $1,300.6 $282,481
4 900 949 Government 1118 $13,124 100% Catholic 50 $12,329 94% $795.2 $9,563,143 Independent 21 $10,869 83% $2,255.0 $8,843,159
5 950 999 Government 1798 $11,595 100% Catholic 218 $10,952 94% $642.9 $43,739,708 Independent 63 $11,079 96% $515.7 $10,033,906
6 1000 1049 Government 1267 $10,515 100% Catholic 631 $9,865 94% $650.6 $186,376,179 Independent 232 $9,427 90% $1,088.1 $109,484,977
7 1050 1099 Government 626 $9,919 100% Catholic 418 $8,856 89% $1,063.1 $225,738,638 Independent 235 $8,552 86% $1,366.7 $197,344,575
8 1100 1149 Government 393 $9,335 100% Catholic 178 $8,093 87% $1,241.4 $89,854,686 Independent 172 $7,280 78% $2,054.2 $276,654,844
9 1150 1299 Government 193 $9,006 100% Catholic 68 $7,233 80% $1,773.2 $52,969,657 Independent 149 $4,757 53% $4,249.2 $573,457,108
10 No ICSEA Government 492 $26,320 100% Catholic 50 $14,747 56% $11,573.0 $143,575,865 Independent 173 $12,977 49% $13,342.3 $305,719,463
Total Additional amount in
2013 dollars
Catholic schools 747,750,669
Independent schools 1,482,537,199
all non-government schools 2,230,287,868

15
APPENDIX 4: Other school costs Capital funding Most of the debate about money and schools refers to recurrent or year-by-year or recurrent funding. The amounts and distribution of capital funding are also important, but the per-student amounts involved are well below those for recurrent funding. The levels of capital expenditure fluctuated considerably between 2009 and 2013, mainly due to investment under the Building the Education Revolution (BER). Although it wasn’t a typical year, capital expenditure in 2013 averaged around $330 per government school student (almost all from government sources), compared to net recurrent income of around $12,500. Capital expenditure per Catholic school student was higher at around $600 (with a quarter publicly funded), against total recurrent funding of around $12,200. Capital expenditure per Independent school student was $1420 (with around 13% publicly funded), against total recurrent funding of $16,600. Such figures might suggest that it would be expensive for governments to pick up the balance of capital funding of non-government schools. But the nature of capital expenditure and the amounts involved cannot easily be compared across systems. Many of the building programs in non-government schools create facilities which are beyond the code requirements for similar government schools. While this might improve the visual or even functional amenity in those schools it has little if any impact on measurable student outcomes. How much public money have non-government schools received for capital - compared with amounts received by government schools? Between 2009 and 2012, capital funding provided by governments to Catholic schools amounted to 73% of the funds provided to government schools. The equivalent figure for Independent schools was 60%. If there are large amounts of publicly sourced recurrent funds going into capital these figures will be higher. Public capital funding of non-government schools in Australia needs to be considered against practice in countries such as New Zealand where church (mainly Catholic) schools became integrated into the state system from the 1970s. But only the recurrent costs of the integrated schools are fully publicly funded; the New Zealand government maintains the schools, but rarely contributes to other capital expenses. The publicly-sourced capital funding of non-government schools in Australia is certainly more generous. The upshot is that non-government schools in Australia have operational independence and a limited range of public obligations - yet are arguably more generously funded than their much more highly regulated counterparts in New Zealand. Other funding Apart from capital there are other areas of funding to consider and other costs incurred in schooling. Some of these, such as tax benefits or exemptions, are indirect and not represented in the budget/s of schools or school systems – and are certainly not included in My School data. Indirect benefits to schools can also be substantial and there is no assurance that indirect funding or funded services are distributed in any equitable manner between schools and systems. If counted, they might add to the funding of some schools far more than others. They include, but are not limited to:
The conveyance of students to and from school.
The tax deductibility of donations to schools, for example to building and library funds.
The tax benefits of charity status.
The indirect expenditure incurred by outside agencies, including philanthropy.
Exemption from local government rates
Downstream public costs, for example in health and welfare services, which may be linked to access to and adequacy of schooling.

16
APPENDIX 5: INCONSISTENCIES IN COMBINED GOVERNMENT FUNDING As is appropriate, “government funding” in this analysis refers to the combined amounts per student coming from both state and federal governments, but that points to an extremely problematic area. While the funding is combined there is almost no coordination between the governments which are dispensing the money. The result is a very complex and variable set of figures, as illustrated in this graph.
The graph shows the recurrent funding of non-government schools as a percentage of the funding of government schools in the same ICSEA range. NSW is the only state where the distribution of public funding resembles the Australian average. It would seem that those wanting to attend a well-funded non-government school are best advised to move to Victoria or choose a Catholic – but not Independent - school in Queensland. The public funding of both non-government sectors in Victoria in 2013 was well above the funding of similar government schools. It cost governments $56 million more to fund students in Victorian non-government schools - than it would have cost to fund them in similar government schools. Yet two years later, in 2015, the Labor Party in Victoria completed a pre-election deal to increase funding to Catholic schools. They either didn’t have the information available on this graph – or for some reason it didn’t matter. The graph certainly paints a complex picture across Australia and illustrates why the Gonski panel recommended that a Schools Resourcing Body be established to better coordinate funding between the levels of government. This didn't happen and the graph shows why it should still be a priority.

17
1 In the interests of brevity we use terms such as government, non-government, public and private in full awareness that, by themselves, they are less than adequate labels. 2 http://www.theaustralian.com.au/national-affairs/opinion/private-schools-arent-a-drain-on-the-system/story-e6frgd0x-1226815294630# 3 http://timhawkes.com/?p=222 4 http://www.onlineopinion.com.au/view.asp?article=17166 5 http://www.aph.gov.au/Parliamentary_Business/Committees/Senate/School_Funding/School_Funding/Submissions 6 http://www.onlineopinion.com.au/view.asp?article=17272 7 http://www.aph.gov.au/Parliamentary_Business/Committees/Senate/School_Funding/School_Funding/Submissions 8 http://www.aph.gov.au/Parliamentary_Business/Committees/Senate/School_Funding/School_Funding/Submissions 9 The average ICSEA for government schools is around 983, Catholic schools around 1040 and Independent schools around 1071 (My School 6.0). 10 http://www.aph.gov.au/Parliamentary_Business/Committees/Senate/School_Funding/School_Funding/Submissions 11 The Index of Community Socio-Educational Advantage (ICSEA). ACARA lists school ICSEA values on the My School website using a scale that has 1000 as its mid-point, with more educationally advantaged school communities attracting a higher figure and less advantaged communities a lower figure. 12 http://www.ncec.catholic.edu.au/index.php?option=com_docman&task=cat_view&gid=39&Itemid=53 13 In this analysis “public” or “government” funding refers to the combined amounts per student coming from state and federal governments 14 http://www.aph.gov.au/~/media/Committees/eet_ctte/estimates/add_1415/Education/Answers/SQ15-000118.pdf 15 http://www.smh.com.au/federal-politics/political-news/school-blue-sees-abbott-scramble-20120820-24irj.html 16 For a more complete and authoritative discussion of ICSEA, see http://www.acara.edu.au/verve/_resources/Guide_to_understanding_icsea_values.pdf 17 These analyses exclude Special schools and schools for which relevant data was not reported on My School 18 The most recent year for which funding data is available on My School 19 These are the latest figures available (My School 2015) and yet to be published in any report. 20 Lyndsay Connors and Jim McMorrow (2015) Imperatives in Schools Funding: Equity, sustainability and achievement. Australian Council for Educational Research. http://research.acer.edu.au/cgi/viewcontent.cgi?article=1024&context=aer&sei-redir=1&referer=http%3A%2F%2Fwww.bing.com%2Fsearch%3Fq%3DImperatives%2Bin%2BSchools%2BFunding%253A%2BEquity%2C%2Bsustainability%2Band%2Bachievement.%26form%3DMSSEDF%26pc%3DMSSE#search=%22Imperatives%20Schools%20Funding%3A%20Equity%2C%20sustainability%20achievement.%22 21 https://drive.google.com/file/d/0BxK25rJrOw-eckVtUDhoU0hLNjQ/view 22 For example, see Chris Bonnor, and Jane Caro, Jane What Makes a Good School and http://insidestory.org.au/student-achievement-frozen-by-inequity Most of our previous articles and papers are available at http://www.edmediawatch.com/ 23 http://www.oecd.org/pisa/pisaproducts/48852584.pdf 24 https://drive.google.com/file/d/0BxK25rJrOw-edGFOLU9sTzNXdjg/view 25 https://drive.google.com/file/d/0BxK25rJrOw-eckVtUDhoU0hLNjQ/view 26 For example:
Heckman, James 2011. The Economics of Inequality. American Educator, Spring, 31-47.
Heckman, James J. & Dimitriy V. Masterov 2007. The Productivity Argument for Investing in Young Children, Review of Agricultural Economics, 29 (3): 446–493.
27 Productivity Commission, Report on Government Services: School Education, 2014, page 4.40 28 E.g. K Donnelly, ‘Why Funding Private Schools is a Smart Idea’, Sydney Morning Herald, 4 February 2014 29 Australian Curriculum, Assessment and Reporting Authority, National Report on Schooling 2010, Statistical Appendix, Table 49 30 It is also the case that some "Generalist" schools in all sectors have units catering for students with special needs and these are accounted in the reporting of those schools. 31 While comparisons based solely on the numbers are highly problematic in this area, it seems strange that while these private students would/should benefit most from a proper application of Gonski principles, they appear to be lagging well behind their generalist school cousins at present, at least in statistical terms.