private equity and financial fragility during the crisis private equity and financial fragility...
TRANSCRIPT
1
Private Equity and Financial Fragility during the Crisis
Shai Bernstein, Josh Lerner and Filippo Mezzanotti*
Abstract
Does private equity increase financial fragility during economic crises? To investigate this issue,
we examine the financial decisions and performance of private equity-backed companies in the
United Kingdom during the 2008 financial crisis. We find that PE-backed companies experienced
a smaller decline in investment, relative to a carefully selected control group. PE-backed
companies also experienced a larger increase in debt and equity issuances, while overall leverage
remained unchanged. The effects are particularly strong for companies that were more likely to be
financially constrained and those where private equity sponsors were more likely to have resources
to help the portfolio company. The results are consistent with the hypothesis that PE sponsors relax
financing constraints during a sudden tightening of credit markets and inconsistent with the
hypothesis that private equity increase financial fragility during periods of financial turmoil.
*Stanford University and National Bureau of Economic Research (NBER); Harvard University and NBER; Northwestern
University. We thank the Harvard Business School’s Division of Research for financial support. We also thank seminar participants
at MIT and Northwestern for helpful comments. One of the authors has advised institutional investors in private equity funds,
private equity groups, and governments designing policies relevant to private equity. All errors and omissions are our own. Emails:
[email protected], [email protected], and [email protected].
2
1 Introduction
The recent global financial crisis increased the attention paid by policy makers, regulators,
and academics to the financial stability of the economy. While much attention has been devoted
to the banking system in this (Fahlenbrach, Prilmeier, and Stulz, 2012) and earlier (Bernanke and
Gertler, 1990) crises, high levels of corporate debt may also trigger financial distress during a
crisis, exacerbating cutbacks in investment and employment. The practices of the private equity
(PE) industry in particular have raised such concerns. In the three years leading up to the crisis
(between 2005 and mid-2007), global PE transaction value reached over $1.6 trillion, frequently
financed with 70 percent debt or higher (Kaplan and Stromberg, 2009). This is not a phenomenon
of the recent crisis only. Private equity markets are prone to distortions introduced by credit cycles.
As documented by Axelson, et al. (2013), periods characterized by booming financial markets also
experienced more private equity fundraising, higher transaction valuations, and critically the
greater use of leverage.
The impact of PE investment patterns on the economy during periods of financial turmoil,
however, remains relatively poorly understood. On the one hand, the cyclicality of private equity
activity may exacerbate the negative effects of shocks to the financial sector, aggravating the boom
and bust dynamic of the economy. In line with this idea, the Bank of England suggests that buyouts
should be monitored for macro-prudential reasons, because “the increased indebtedness of such
companies poses risk to the stability of the financial system” (Bank of England Quarterly Bulletin,
2013Q1). Moreover, the pressure to complete deals during boom times may lead to the selection
of lower-quality firms (Kaplan and Stein, 1993), leaving PE-backed companies more exposed to
changes in underlying economic conditions. Finally, the increased fundraising and investment
during boom periods may reduce the ability of private equity groups to effectively monitor and
3
fund their portfolio companies once economic conditions deteriorate. These concerns have led to
efforts to cap the amount of leverage used in PE transactions by the Federal Reserve Bank in the
US and the European Central Bank.
Alternatively, PE-backed companies may be resilient to downturns, and can therefore play
a stabilizing role during bad times. In particular, these companies may be better positioned to
obtain external funding when financial markets are dysfunctional. First, PE groups have strong ties
with the banking industry (Ivashina and Kovner, 2011) and may be able to use these relationships
to access credit for their firms during periods of crisis. Second, because PE groups raise funds that
are drawn down and invested over multiple years—commitments that are very rarely abrogated—
they often have “deep pockets” during downturns, which allows them to make equity investments
in their firms when accessing other sources of equity is challenging.
Motivated by these alternative considerations, this paper seeks to understand whether
private equity contributed to the fragility of the economy in the United Kingdom (UK) during the
recent financial crisis. The UK is a perfect environment to study this question. First, the UK had
the largest private equity market as a share of GDP before the crisis (Blundell-Wignall, 2007) –
with PE assets at about 11% of GDP1 - and one of the largest in absolute value. In line with these
numbers, the Bank of England estimated that before the crisis, PE-backed firms had issued more
than 10 percent of all non-financial corporate debt in the UK.2 Second, the UK provides detailed
income statement and balance sheet information for almost every active company, whether public
or private (Brav, 2009; Michaely and Roberts, 2012). Finally, the UK experienced a severe credit
market freeze during the 2008 crisis, with a dramatic decline in private sector investment and
1 This number is obtained by dividing the total fundraising between 2004 and 2008, as estimated by the European
Venture Capital Association and PEREP Analytics, by GDP in 2008 (World Bank). 2 Bank of England Quarterly Bulletin, 2013Q1
4
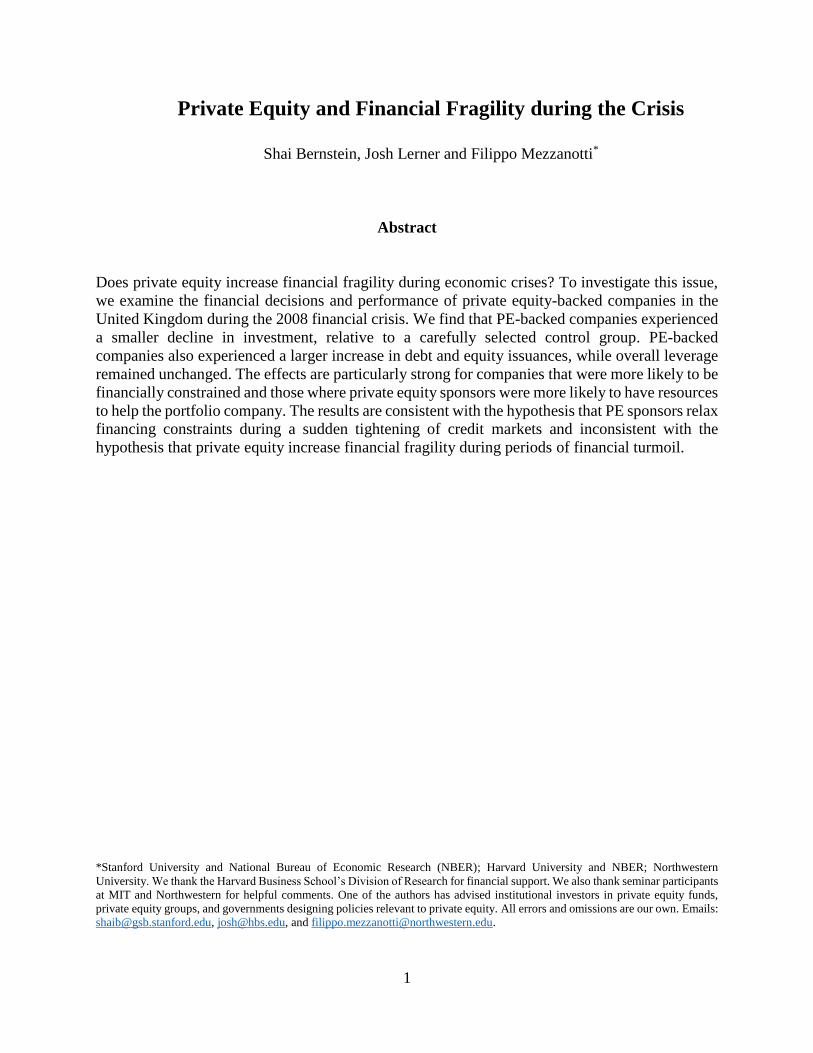
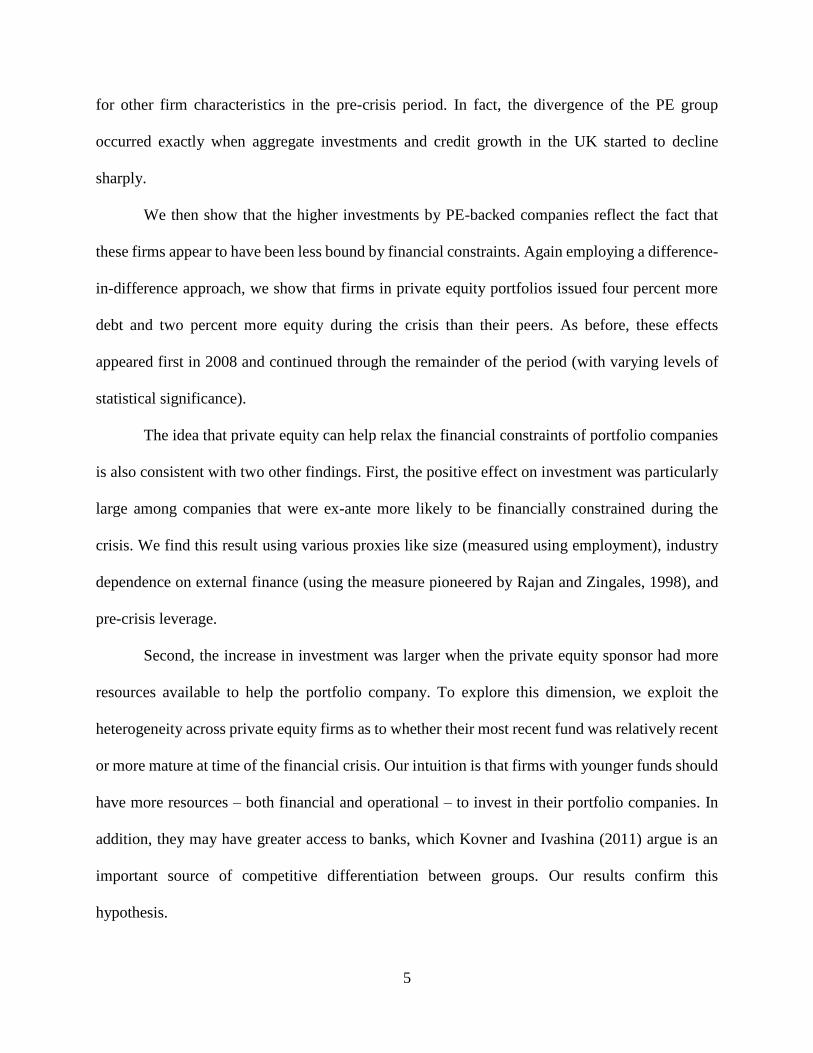
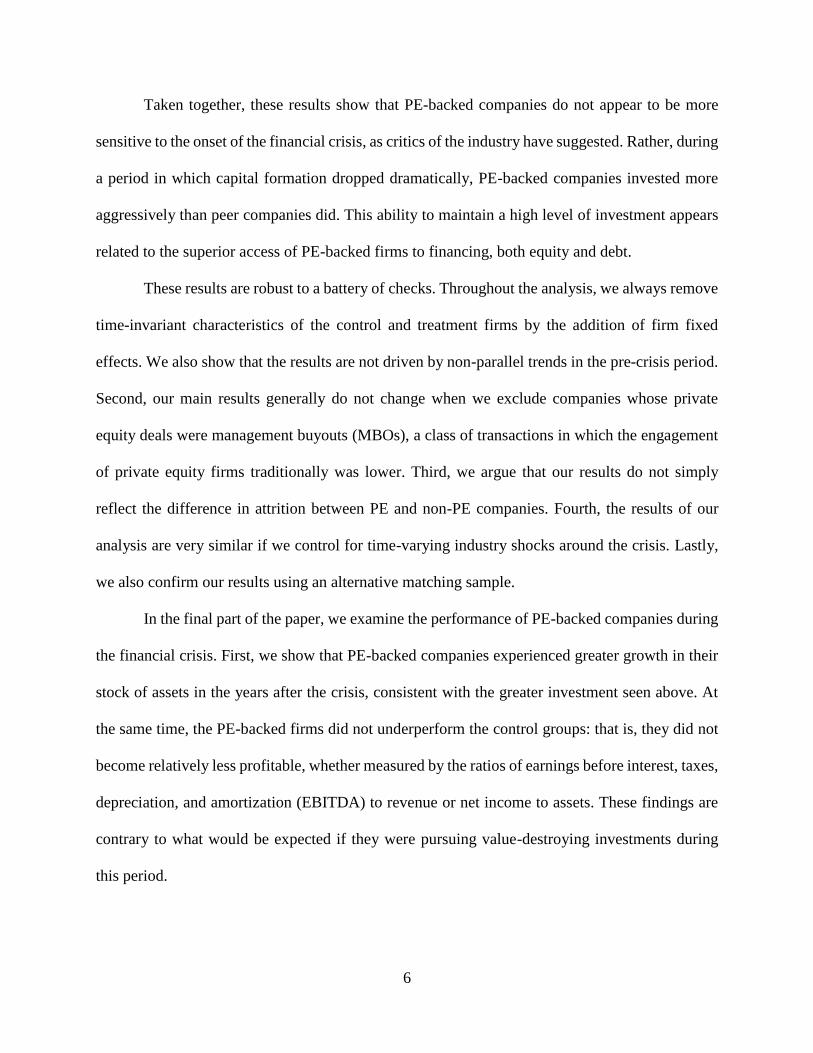
lending (Riley, Rosazza Bondibene, and Young, 2014). As illustrated in Figure 1, aggregate
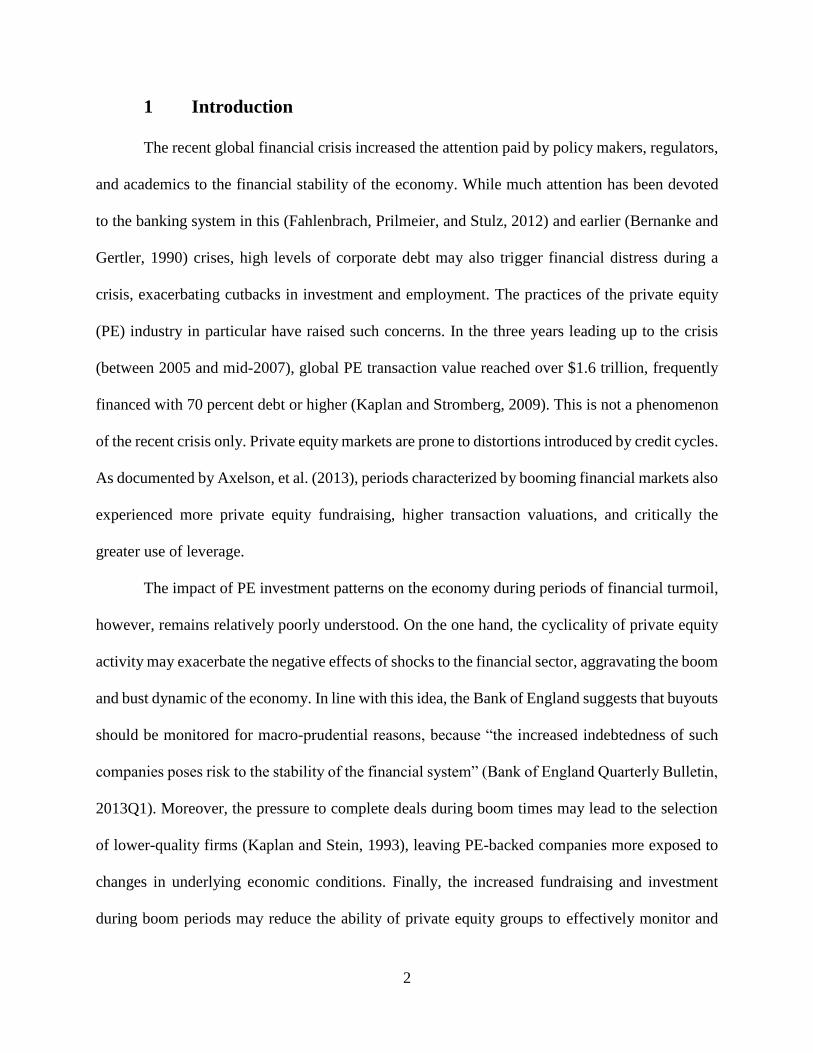
investment declined by more than 20% during 2008 in the UK, which simultaneously experienced
a sharp credit contraction (Figure 2).
To address the above questions, we study the relative evolution of PE-backed and non-PE
companies in the wake of the financial crisis. We focus on the financial decisions and performance
of these firms during this period, with an eye to understanding whether private equity exacerbates
or dampens the sensitivity of the economy to credit cycles.
Our main analysis focuses on a final sample of almost five hundred companies that were
backed by PE prior to the financial crisis. Using a difference-in-difference approach, we study how
the financial decisions and performance of the PE-backed companies were affected by the onset
of the crisis relative to a control group. The control group employs companies that were operating
in the same industry as the PE-backed firms and had similar sizes, leverage, and profitability in
2007, following the methodology of Boucly, Sraer and Thesmar (2011). The matching firms have
similar growth rates, equity and debt issuances, and investment rates as the PE-backed ones
entering into the financial crisis. Therefore, this approach allows us to focus on the heterogeneity
between our treatment and control groups that stems from their difference in organization
structure, rather than their balance sheet or investment characteristics.
We start by comparing the PE-backed firms and their peers’ behavior during the financial
crisis. We show that PE-backed firms decreased investments relatively less than non-PE
companies did during the financial crisis, with between five and six percent greater spending, an
effect that is strongly statistically significant. Looking at the timing of the effects, the two groups
did not differ significantly in the pre-crisis period, but the investment rate of the PE group
substantially diverged from the control group beginning in 2008. This result is robust to controls
5
for other firm characteristics in the pre-crisis period. In fact, the divergence of the PE group
occurred exactly when aggregate investments and credit growth in the UK started to decline
sharply.
We then show that the higher investments by PE-backed companies reflect the fact that
these firms appear to have been less bound by financial constraints. Again employing a difference-
in-difference approach, we show that firms in private equity portfolios issued four percent more
debt and two percent more equity during the crisis than their peers. As before, these effects
appeared first in 2008 and continued through the remainder of the period (with varying levels of
statistical significance).
The idea that private equity can help relax the financial constraints of portfolio companies
is also consistent with two other findings. First, the positive effect on investment was particularly
large among companies that were ex-ante more likely to be financially constrained during the
crisis. We find this result using various proxies like size (measured using employment), industry
dependence on external finance (using the measure pioneered by Rajan and Zingales, 1998), and
pre-crisis leverage.
Second, the increase in investment was larger when the private equity sponsor had more
resources available to help the portfolio company. To explore this dimension, we exploit the
heterogeneity across private equity firms as to whether their most recent fund was relatively recent
or more mature at time of the financial crisis. Our intuition is that firms with younger funds should
have more resources – both financial and operational – to invest in their portfolio companies. In
addition, they may have greater access to banks, which Kovner and Ivashina (2011) argue is an
important source of competitive differentiation between groups. Our results confirm this
hypothesis.
6
Taken together, these results show that PE-backed companies do not appear to be more
sensitive to the onset of the financial crisis, as critics of the industry have suggested. Rather, during
a period in which capital formation dropped dramatically, PE-backed companies invested more
aggressively than peer companies did. This ability to maintain a high level of investment appears
related to the superior access of PE-backed firms to financing, both equity and debt.
These results are robust to a battery of checks. Throughout the analysis, we always remove
time-invariant characteristics of the control and treatment firms by the addition of firm fixed
effects. We also show that the results are not driven by non-parallel trends in the pre-crisis period.
Second, our main results generally do not change when we exclude companies whose private
equity deals were management buyouts (MBOs), a class of transactions in which the engagement
of private equity firms traditionally was lower. Third, we argue that our results do not simply
reflect the difference in attrition between PE and non-PE companies. Fourth, the results of our
analysis are very similar if we control for time-varying industry shocks around the crisis. Lastly,
we also confirm our results using an alternative matching sample.
In the final part of the paper, we examine the performance of PE-backed companies during
the financial crisis. First, we show that PE-backed companies experienced greater growth in their
stock of assets in the years after the crisis, consistent with the greater investment seen above. At
the same time, the PE-backed firms did not underperform the control groups: that is, they did not
become relatively less profitable, whether measured by the ratios of earnings before interest, taxes,
depreciation, and amortization (EBITDA) to revenue or net income to assets. These findings are
contrary to what would be expected if they were pursuing value-destroying investments during
this period.
7
As an alternative measure of performance, we also examine the exit patterns of PE-backed
companies relative to the control group during the crisis period. We find that PE-backed companies
were not more likely to go bankrupt, but they were more likely to be sold in non-distressed M&A
transactions. Overall, these results regarding exits—while by their nature limited—are inconsistent
with the hypothesis that PE financing increases the financial fragility of the firms
This paper relates to the extensive body of work examining the behavior of financial
institutions during the financial crisis and their consequences for operating firms (e.g., Ivashina
and Scharfstein, 2010; and Ben-David and Franzoni, 2012). The conclusions, though, are more
benign here than many of the studies examining other financial institutions, including banks, rating
agencies, and hedge funds. The role of private equity groups seems more akin to those of the
Japanese banks during the 1980s documented by Hoshi, Kashyap, and Scharfstein (1990, 1991),
where better information and aligned incentives allowed bank-affiliated firms to overcome the
capital constraints that limited investments of their peers without such relationships. During the
financial crisis, the greater alignment and relatively longer time horizons of private equity
investors may have allowed firms to more successfully respond to the economic dislocations.
The paper is organized as follows. In Section 2, we present the data used in this study, as
well as the matching methodology developed to construct the control group. Section 3 then
describes the empirical approach employed in the paper. Sections 4 and 5 present the main results
on investment and performance, discussing the possible mechanisms behind our results and
presenting a large set of robustness tests. Finally, Section 6 summarizes our results and
conclusions.
8
2 Data
2.1 Sample Construction
We started our data construction by extracting from Capital IQ the sample of all UK
companies backed by private equity before the financial crisis. We identified private equity deals
in Capital IQ by searching for events such as “going private,” “leveraged buyout,” “management
buyout,” and “platform.” In so doing, we excluded “growth buyouts,” “venture capital” and
“expansion capital” investments, where investors generally buy a stake in the company using little
or no leverage. Since we were interested in studying the behavior of UK PE-backed firms around
the financial crisis, we selected only firms that (i) were headquartered in United Kingdom at the
time of the deal; (ii) had received a PE investment by the end of 2007; and (iii) did not experience
an exit by the PE group or a failure before the beginning of 2009.
We then further filtered our data, keeping only those firms that had balance sheet and
income statement information in Amadeus, a Bureau Van Dijk (BvD) data set on European
companies. Amadeus collects data from the “Companies House,” the United Kingdom official
national registrar office. As already pointed out by other authors (Brav, 2009; Michaely and
Roberts, 2012), the United Kingdom is a perfect setting for studies on private companies.
According to current regulations, every registered limited company is required to provide financial
and income information annually to the public register.
The extent of the requirement to disclose financial information in the UK, however, varies
with the size of the firm. Small3 (and some medium-sized) firms are allowed to file abbreviated
accounts. Since the amount of information small firms disclose to Companies House (and hence
3 Since 2008, a small company is defined as one meeting at least two of the following criteria: total assets less than
£3.26 million, annual turnover less than £6.5 million, and an average number of employees fewer than 50. This
group usually reports only assets, revenue and profits.
9
in the Amadeus dataset) is very limited, we excluded this group from our analysis. The reliability
of the source and its coverage of the remaining private firms is a key strength of our study. Most
of the companies in our sample consist of middle-sized private enterprises, for which similar
financial data are not available in the United States.
We supplemented Amadeus data with Orbis, another data product from BvD. While both
Amadeus and Orbis collect information from the Companies House, Amadeus generally removes
firms from the sample after a few years of inactivity. This is not the case for Orbis. Since the post-
financial crisis period has been characterized by an increase in firm exit, using only Amadeus
would have generated concerns about selection and undermined the reliability of our results.4
Therefore, we further restricted the sample to firms meeting the following criteria: (i)
matched to Amadeus; (ii) is not a small firm, as defined by the Companies House; and (iii) does
not operate in the financial (SICs 600-699), public (SICs 900-999), or utility sector ( SICs 489-
493).5 This led to an initial sample of 987 unique firms. Once we excluded those firms that did not
meet the minimum data requirements for the matching process described below, the sample was
composed of 722 firms.6
2.2 Control Group
Private equity-backed companies are clearly not a random sample of the population: for
instance, in general they are larger and more leveraged than the average firm. Therefore, the first
step in our analysis is to identify a proper control group for the set of PE-backed companies.
4 Orbis and Amadeus are essentially the same data product. The main two differences are the deletion of exited
firms, as discussed above, and the interface used to distribute the data. 5 This industry sample selection is common to the whole literature on private equity. For instance, Michaely and
Roberts (2012) apply similar filter with the same data set. 6 In particular, we require to the firms to have data on industry, return on assets, capital expenditures, asset, and
leverage in 2007.

10
Following Boucly, Sraer and Thesmar (2011), we identify a suitable control group through
a matching procedure for each PE-backed company in our sample. We identify a set of control
firms that operate in the same industry and had a similar size, leverage, and profitability in 2007.
This procedure involved two steps. First, for all private equity-backed firms in our data, we
selected every firm in the Amadeus/Orbis sample that (a) belonged to the same two-digit SIC; (b)
had a return on assets (ROA), defined as net income over total assets, within a 30% bracket around
our PE firm; (c) had assets within a 30% bracket around our PE firm; and (d) had leverage within
a 30% bracket around our PE firm. Second, when this first step identified more than five firms, we
selected the closest five, based on quadratic distance computed based on the variables. Overall,
this procedure is a more conservative version of Boucly, Sraer and Thesmar (2011), since we add
an additional variable to the matching – leverage – and use a narrower matching bandwidth.7 Using
this methodology, we were able to match 434 of the 722 firms, generating a total sample of 1,984
firms. In the robustness section, we present an alternative matching procedure that is closer to
Boucly, Sraer and Thesmar (2011), by eliminating leverage in the matching.8
For every firm in the final sample, we extracted from Amadeus/Orbis the full set of income
and financial information available for the period from 2004 to 2011. Using this data, we
constructed the measures of firm activity used throughout the paper. In particular, we proxy for
firm capital investments by looking at the change in asset plus the reported depreciation.
Furthermore, we identify equity injections into the firm by measuring the change in equity minus
the profit. Similarly, debt issuance is computed as the change in total liabilities in the year. All
7 The other difference is that we measure size in terms of assets and not employment. The reason for this choice is
that employment in Amadeus is a much less well-populated variable than assets. However, in a robustness test, we
added employment as a fourth variable in our matching procedure and show that this does not affect the results. 8 In a previous version of the paper, we have used wider matching boundaries (50% instead of 30%), which is in line
with what they do in Boucly, Sraer and Thesmar (2011). In general, these changes increase the size of our final
sample and marginally reduce the quality of our matches, but do not affect our main results.

11
these variables were normalized by total assets. Lastly, we measured firm leverage as total
liabilities over total assets. In order to limit the influence of outliers, we winsorize every ratio at
1%. The Data Appendix provides more information about the variables and the sample.
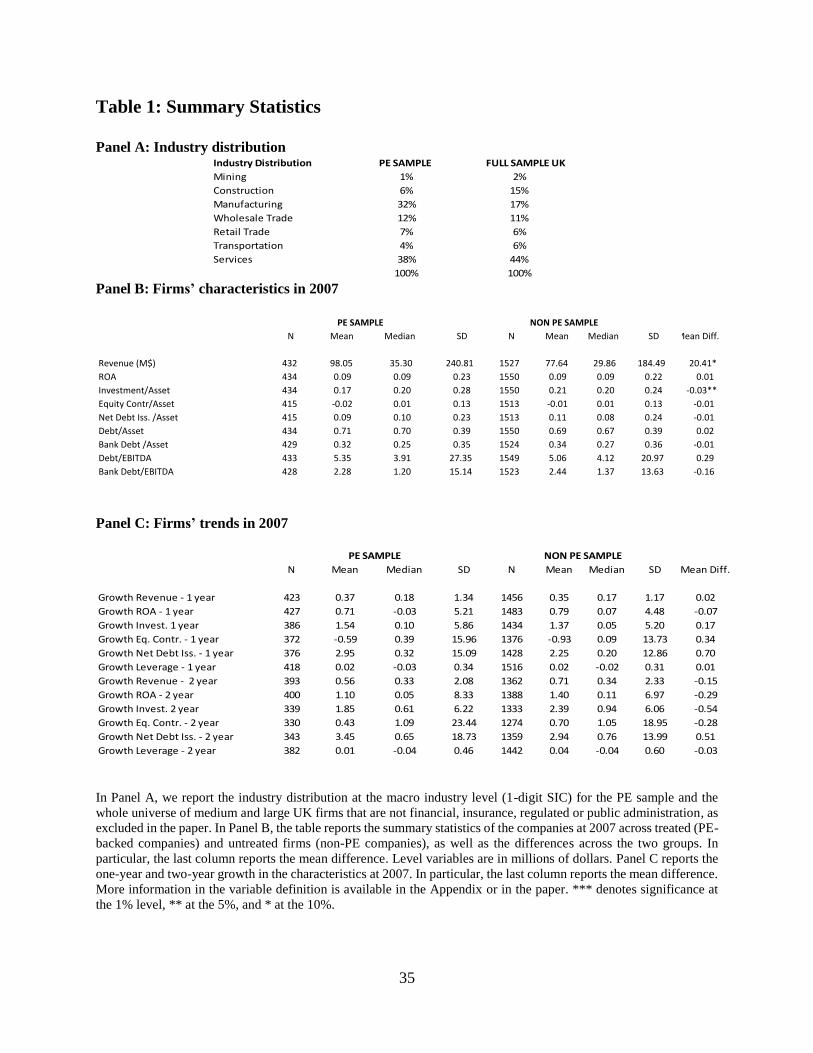
Panel A of Table 1 shows the industry distribution in the sample. We compare it with the
universe of the UK firms, after we eliminate small businesses and companies in the financial or
regulated sectors. The majority of the sample firms are in either the service (38%) or manufacturing
(32%) industries. Other important industries include Wholesale Trade, Construction, and Retail.
The sample industry distribution is relatively close to the universe of companies: the major
difference is that PE-backed firms tend to be more concentrated in manufacturing, and less
represented in the construction industry and services. These small differences in industry
distribution are not a problem for our study, since our treatment and control samples have the same
industry distribution due to the matching procedure.
In Panel B of Table 1, we compare the characteristics of firms across the treatment group
and the matched control group in 2007. The average firm in the sample is a mid-sized firm with
around $80 million in revenue. The PE-backed companies are slightly larger than the control
group, a difference is statistically significant at the 10% level. Across the two groups, firms have
very similar ROA, leverage, investment, and equity and debt issuance. These differences are
insignificant, with the sole exception of investment. More importantly, all these differences are
small in economic magnitude.
While some of these results are not surprising and simply reflect the quality of our matching
procedure, others are more interesting. In particular, this matching suggests that differences in
investment and funding across the treated and control groups mostly disappear when we compare
firms with similar sizes, leverage ratios, and profitability within the same industry.

12
This analysis suggests that the observable characteristics of the treatment and control
groups are relatively close entering into the financial crisis. Important for our diff-in-diff analysis
is the assumption of pre-crisis parallel trends. We turn to explore whether this assumption holds
based on observables, in Panel C. In particular, we compare the one and two-year growth rate
ending in 2007 for the main firm characteristics considered so far. We find that differences in
growth rates between the two groups are never significantly different from zero. In other words,
pre-crisis growth rates across the two groups do not appear to be different.
Overall, these analyses are reassuring. The PE-backed firms were similar in 2007 to the
control group. In principle, this is not a necessary condition for our identification – which instead
hinges on the presence of parallel trends between the two groups – but it allows us to exclude the
possibility that differences in behavior around the crisis may be due to differences in other
observable characteristics. Later in the paper, we further show that our results are stable when we
augment our model with a set of controls for firm characteristics in 2007, which should absorb any
residual differences in observables across the two groups.
Similarly, the two groups present very similar growth paths before the crisis. These results
eliminate the possibility that the PE-backed firms were just outperforming the control group before
the crisis. Our estimates are consistent with the assumption of parallel trends between treated and
control groups during the pre-crisis period, the main identification assumption in our difference-
in-difference design. A more formal and direct test of the parallel trend assumption will be
discussed in Section 4.

13
2.3 Other Data
We supplement the data from Amadeus/Orbis to identify potential acquisitions and
bankruptcies during the crisis. We start by constructing two different variables that identify
whether a firm went out of business. In particular, we generate a dummy “Out of Business,” which
is equal to one if the firms’ information went missing in Amadeus/Orbis by 2011, suggesting that
the firm no longer exists.9 On its own, the interpretation of this variable is unclear, since a firm
can exit from the company registry for many different reasons.
We thus further refine this measure by generating a dummy – “Bad Exit” – that identifies
companies that went out of business unambiguously because of distress. We generate this variable
using the firm status history, available through Orbis. The data provider collects information from
the Companies House and assigns to each firm a status, such as active, dissolved, dormant, or in
liquidation, which may change over time. We define a company status as a “bad exit” if (a) the
firm was not active by 2011 and (b) before disappearing from the data, its status implied that the
firm was in liquidation or in insolvency proceedings.
Similarly, we use Capital IQ to identify potential profitable exits by looking at firms
involved in M&A transactions from 2008 onwards. Since M&A transactions may also arise
because of distress, we provide an alternative measure by excluding companies that were involved
in M&A but were also identified in the same period as in distress, as discussed above. Therefore,
we identify non-distressed M&A activity.
Lastly, we also collect information on the history of the PE investors in each sample firm.
When available, we collect the list of investors for the firm’s last PE financing using Capital IQ.
9 In particular, we look at the total assets to see when a firm completely exits the data. Information on total assets is
always required by UK reporting rules, and therefore when this field disappears from the data, the firm did not
provide any information.
14
We then manually search the private equity investors in ThomsonOne and Capital IQ and collect
information about their fundraising history. In particular, we identify the year before the crisis in
which the PE group had the first closing on its last fund. If multiple PE groups are identified as
investors, we look to the most recent fund raised across all the groups. As we discuss later in the
paper, we use this measure to proxy the availability of resources at PE investor level.
3 Empirical Strategy
To understand how the crisis affected the financial and investment policies of PE-backed
companies, we developed a difference-in-difference design where we compare these companies to
a control group of non-PE companies around the financial crisis. We estimate this model using a
panel data set from 2004 to 2011, a symmetric window around the 2008 shock.10
The choice of 2008 as the first year of the crisis is in line with a large body of empirical
evidence on the crisis (e.g., Duchin, Ozabas and Sensoy, 2010; Kahle and Stulz, 2013), as well as
official statistics on UK provided by the Bank of England. As we show in Figure 1, aggregate
investment in UK declined by more than 20% between the beginning of 2008 and mid-2009. At
the same time, growth in credit experienced a sharp contraction starting on the first quarter of 2008
(Figure 2).11 We estimate the following equation:
𝑦𝑖𝑡 = 𝛼𝑡 + 𝛼𝑖 + 𝛽1(𝑃𝐸 𝑓𝑖𝑟𝑚𝑖 ∗ 𝐶𝑟𝑖𝑠𝑖𝑠) + 𝜃𝑋𝑖𝑡 + 𝜀𝑖𝑡
where 𝑦𝑖𝑡 is an outcome of firm i at time t, Crisis is a dummy for the period from 2008 to 2011,
(𝛼𝑖,𝛼𝑡) are a set of firm and time fixed effects, and 𝑃𝐸 𝑓𝑖𝑟𝑚𝑖 is a dummy for the firms that are
backed by PE investors. We augment our specification with a set of time-varying firm covariates
10 For consistency, both PE-backed companies and each corresponding control group enter in the sample at the same
time, which is 2004 or the year of the last PE deal if after 2004. 11 See the various editions of the Bank of England “Trends in Lending” publication for summaries of evidence, in
particular “Trends in Lending - April 2009” (2009).
15
𝑋𝑖𝑡. To avoid endogeneity issues with controls (Angrist and Pischke, 2008; Gormley and Matsa,
2014), these variables are measured in 2007, right before the post-period window, and then
interacted with the crisis dummy to allow them to have a differential impact before and after the
shock.12 We cluster standard errors at the firm level (Bertrand, Duflo and Mullainathan, 2004).
The inclusion of firm fixed effects removes time-invariant differences between treatment
and control firms. However, the causal interpretation of the results crucially depends on the parallel
trend assumption. In particular, we need to assume that PE-backed companies would have
experienced the same change in behavior as non PE-backed companies in the absence of the
financial crisis.13 The parallel trend assumption is intrinsically untestable, since we cannot observe
the true counterfactual in the absence of the shock. However, we can strengthen the interpretation
of our analysis by providing evidence consistent with this assumption, exploring pre-shock trends.
First, it is important to recognize that our treatment and control groups are very similar, at
least in terms of observable characteristics. By construction, both groups have the same industry
distribution. Furthermore, as we discussed before, size, profitability, investment, and leverage are
similar across these groups. Even more importantly for the parallel trend assumption, the PE and
non-PE companies have similar growth rates in the years leading up to the crisis.
Pushing this argument one step forward, we can also formally examine the time-varying
behavior of the treatment effects for the main outcomes in our analysis. With this test, we can rule
out the possibility that a positive (or negative) effect for PE-backed firms merely reflects the higher
(or lower) growth rate of this group of firms before the crisis. In particular, we can estimate:
𝑦𝑖𝑡 = 𝛼𝑡 + 𝛼𝑖 + 𝛽𝑡(𝑃𝐸 𝑓𝑖𝑟𝑚𝑖) + 𝜃𝑋𝑖𝑡 + 𝜀𝑖𝑡
12 When constructing the controls, to minimize the loss of observations because of some idiosyncratic missing
values in 2007, we use the 2006 value if the 2007 one is missing. 13 For instance, it would be problematic if treated firms differed from untreated firms along some characteristics that
would be affected by the financial shock independently from their status as a PE-backed company.

16
where we estimate a different 𝛽𝑡 for every year between 2004 and 2011, using the last year before
the crisis, 2007, as the reference year. If our parameter 𝛽𝑡 in the standard equation is correctly
capturing the causal effect of the crisis on private equity firms – rather than a differential trend
between the two groups – then we expect the effect of private equity to appear only after the onset
of the crisis. In the next section, we will show that our main results are not caused by a lack of
parallel trends across the two groups.
We take two extra steps to strengthen the analysis further. First, we augment our
specifications with controls that capture the heterogeneity across firms in important balance sheet
characteristics before the crisis. In particular, we control for firm size (log of revenue), growth of
revenue, normalized cash flow (cash flow over assets), profitability (ROA), and leverage. These
controls enable us to rule out the possibility that our results are driven by the presence of some
unbalanced observable characteristics across treatment and control groups before 2008.
Second, as a robustness test for our main results, we add a full set of time-varying industry
fixed effects, which can account for changes in industry demand and other industry considerations
around the financial crisis. In particular, we interact two-digit industry fixed effects with the post
dummy. This test and other robustness are discussed at length later in the paper.
4 Investment and Funding
4.1 Main Results
We start by examining whether the investments of companies backed by PE investors by
2007 were more or less affected by the financial crisis. While overall investments dropped
significantly in United Kingdom during the crisis period, it is important to understand whether PE
played any role in exacerbating the effects of this negative financial shock (Figure 1).

17
We start our analysis by studying the change in investment policies in PE- and non PE-
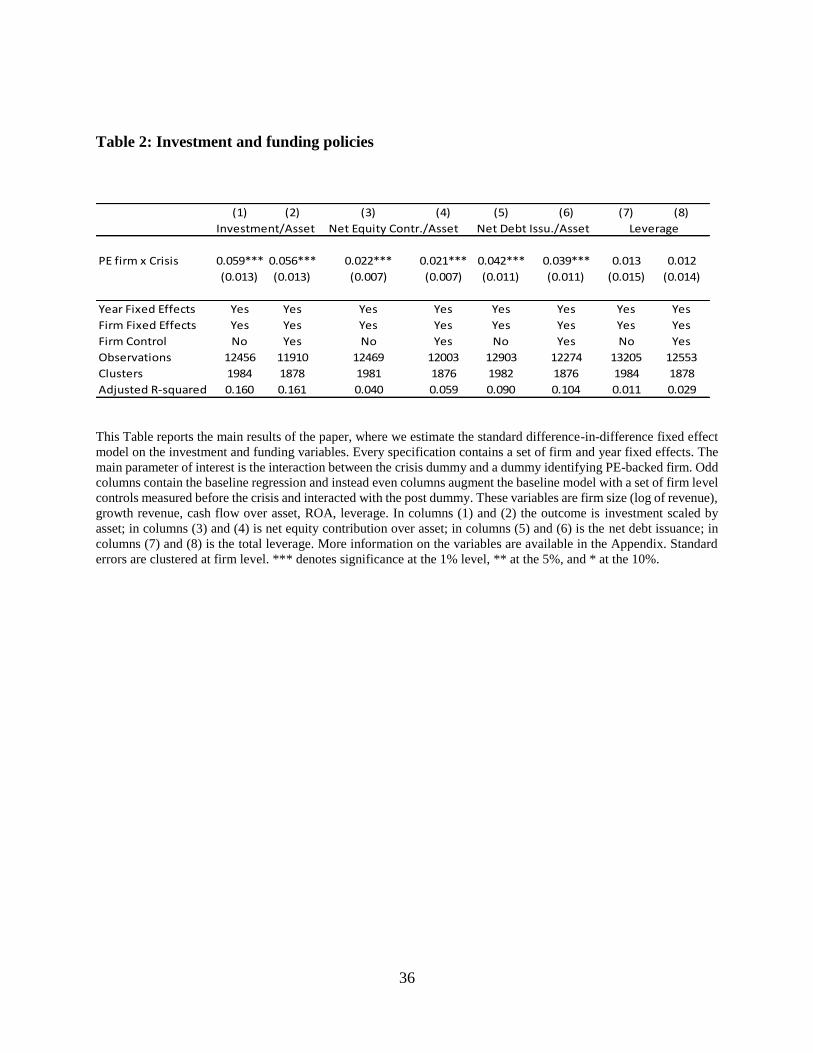
backed firms. In Table 2, we find that PE-backed companies decreased investments less than non-
PE companies around the financial crisis. This effect is not only statistically significant, but also
large in economic magnitude. In terms of assets, the PE firms saw their investments increase
almost 6% relative to the non-PE companies in the post-crisis period. In column (2), we find that
the results are unchanged – both in terms of size and precision – when we add the standard set of
firm-level controls, which account for observable heterogeneity between PE and non-PE firms
before the onset of the crisis.
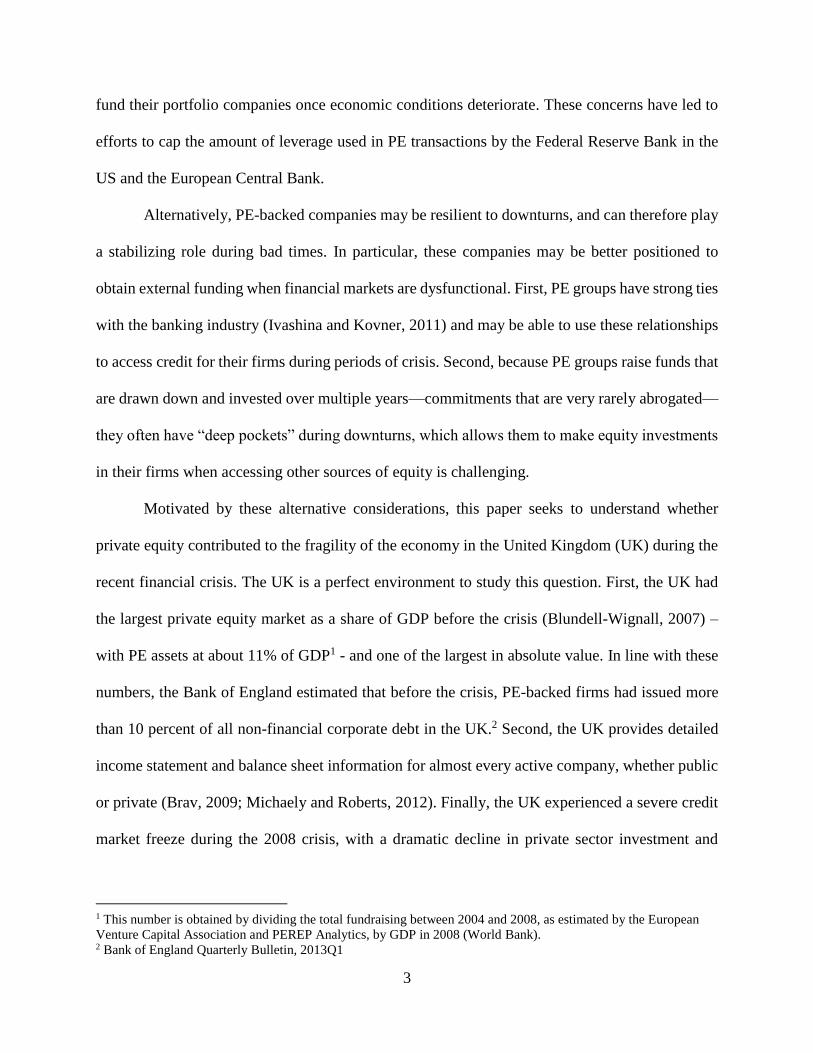
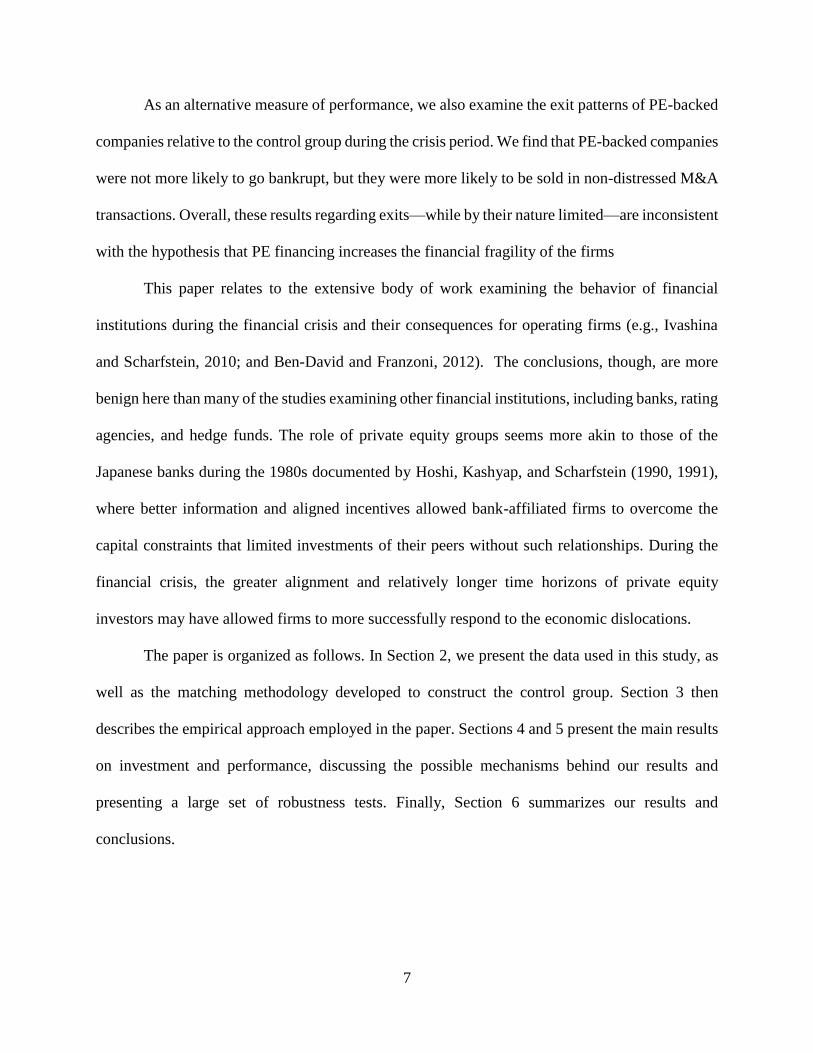
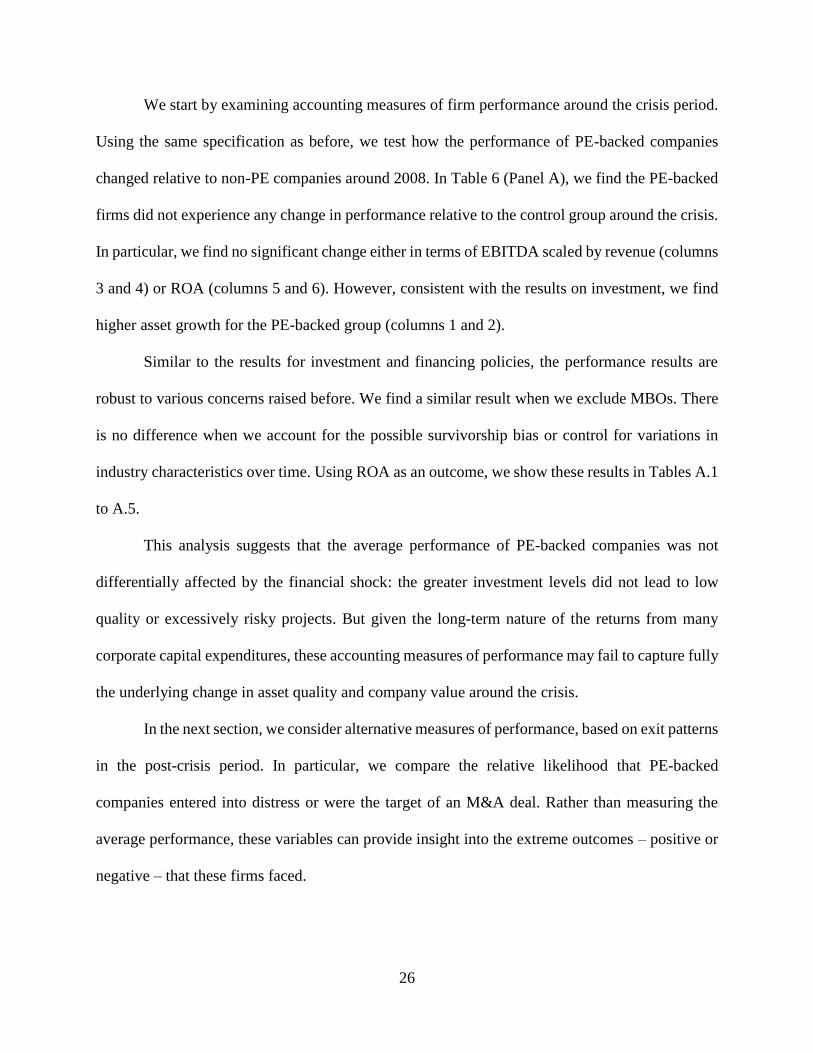
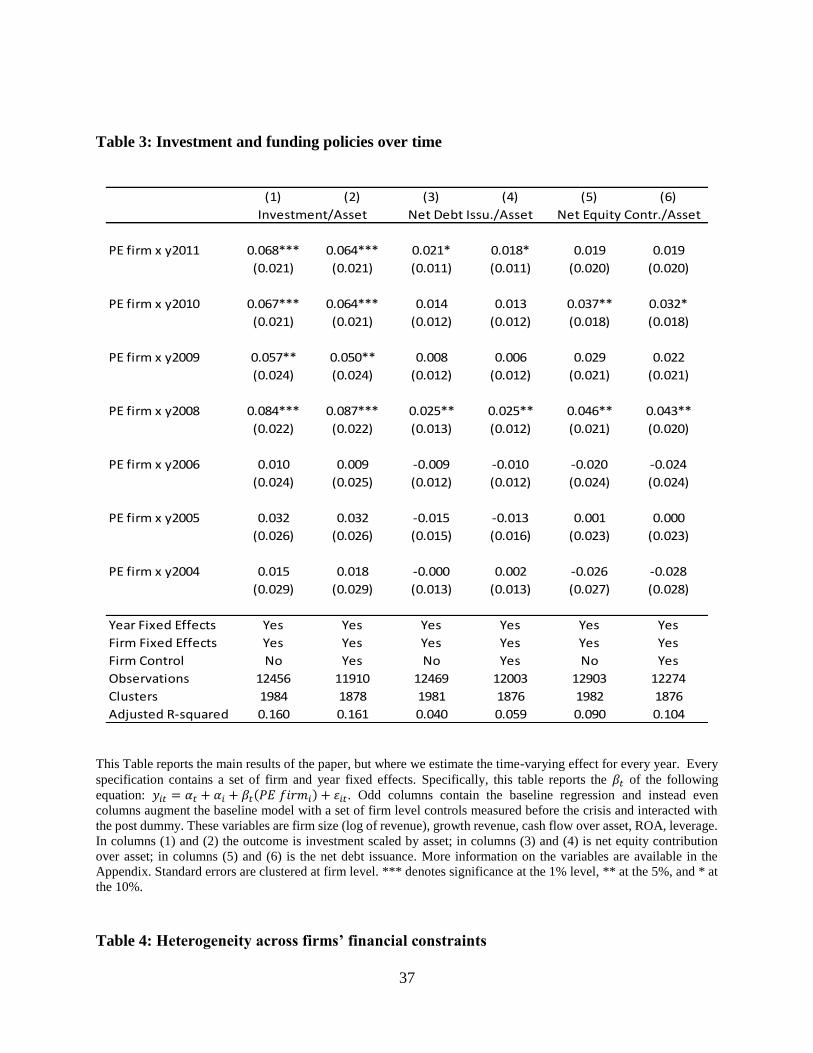
In Figure 3, we show that this result is not driven by non-parallel trends in the investment
behavior of companies before the crisis. PE-backed companies did not behave differently from
control companies in the years before the financial crisis. They did change their investment
behavior, however, as the financial crisis hit. Most of the shift happened in the first year of the
crisis, 2008. After this shock, the positive effect on investment did not disappear and stayed
roughly at the same level in the coming years. The same conclusion follows from column (1) of
Table 3, where we also show that the addition of firm controls does not alter our conclusions
(column 2). Note that the timing when the investment by PE-backed firms substantially diverged
from the control group coincided with the sharp decline in aggregate investments and credit in the
UK, as illustrated in Figures 1 and 2.
Overall, this result suggests that companies financed by private equity were more resilient
in the face of the financial crisis than a similar set of non-PE companies, therefore contradicting
the claim that PE firms increased financial fragility. The next step is to understand the mechanism
behind this result. One hypothesis is that private equity firms help their portfolio companies to
maintain high investment levels by relaxing their financial constraints, particularly during periods
18
of financial upheaval. This can happen in two ways. First, private equity firms have fund
commitments that are rarely abrogated and may therefore be in a better position to inject equity
into the companies if access to financial markets is barred. Second, private equity firms have strong
ties with banks (Ivashina and Kovner, 2011) and should therefore find it easier to access credit
markets during periods of turmoil. We find evidence that is generally consistent with both these
channels in Table 2.
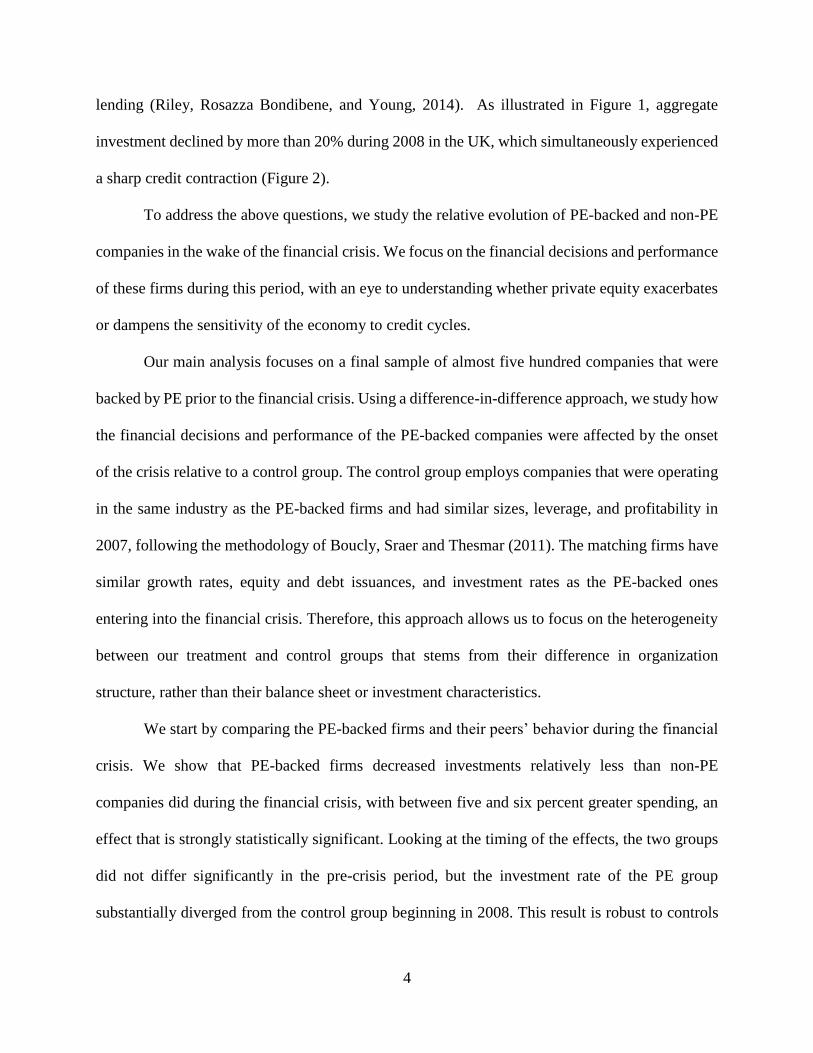
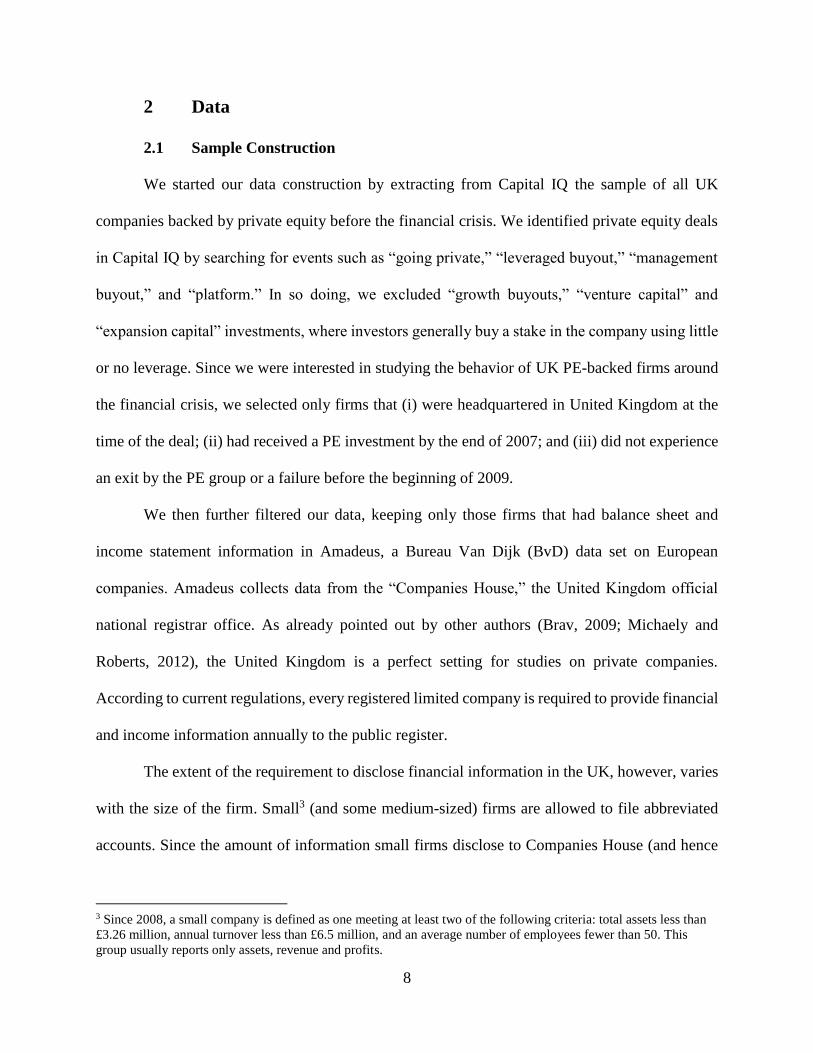
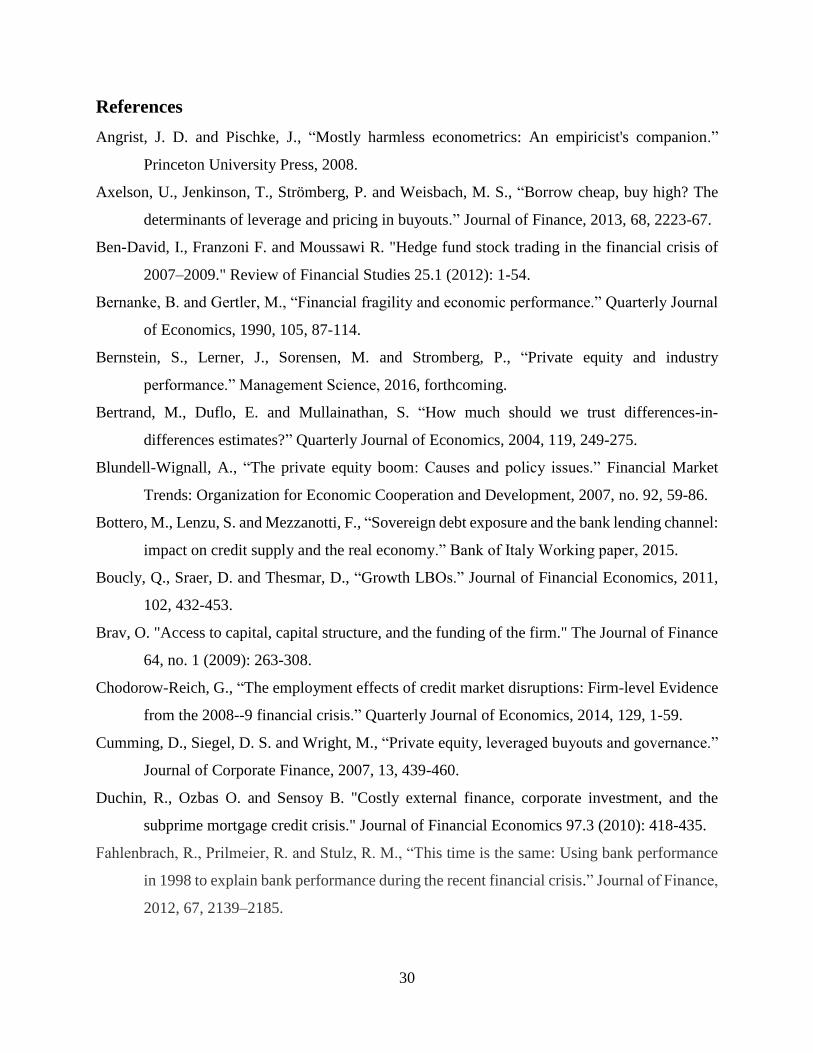
First, net equity contributions increased more for PE-backed firms than for the control
group around the crisis (Table 2, columns 3 and 4).14 In terms of assets, equity contributions during
the financial crisis were 2% higher for PE-backed companies relative to non-PE firms. This
suggests that PE funds were willing to support the operations of their portfolio companies by
injecting equity into the firms. Similar to investment, this effect was not driven by non-parallel
trends before the crisis and this divergence in financial policy appeared in 2008 (Figure 4).
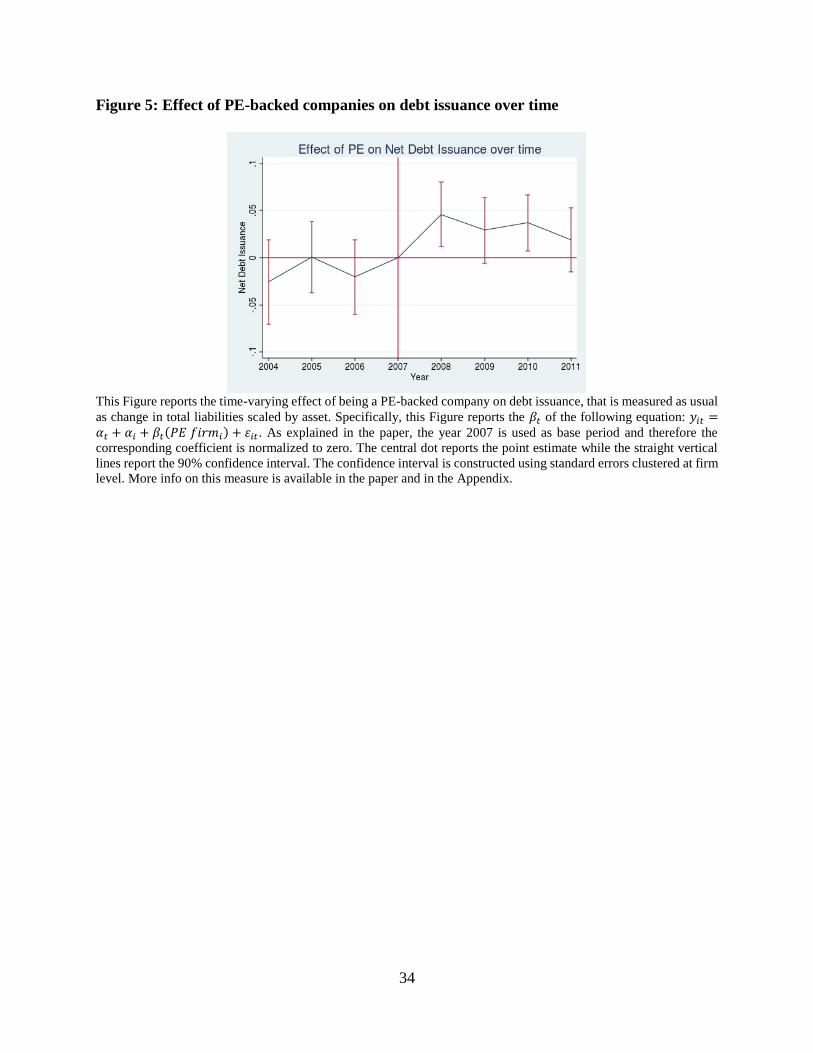
At the same time, PE-backed firms also experienced a relative increase in debt issuance
(Table 2, columns 5 and 6).15 While on average debt issuance declined during the financial crisis,
for PE-backed firms, this decline was 4% smaller. The result is similar when adding controls. Nor
was it driven by non-parallel trends in debt financing around the time of the crisis, as shown in
Figure 5. Again, the relative increase in debt issuance took place in 2008, exactly when lending
conditions and aggregate investment started to decline in the UK. While overall debt issuance was
greater, PE companies did not materially increase their leverage, as is evident from columns 7 and
8 in Table 2. The PE coefficient in this regression is positive, but it is non-significant and small in
magnitude. This null result reflects the joint increase in equity and debt.
14 Notice that we define equity contribution by looking at the changes in equity that are not explained by profit (see
Data Appendix). Therefore, we cannot distinguish whether positive effects are due to raising more capital or paying
out fewer dividends. 15 As discussed in Appendix, this is measured as the change in total debt, scaled by assets.
19
These analyses suggest that private equity companies alleviated the financing constraints
of portfolio companies during the financial crisis, allowing them to invest more when credit
markets were frozen and economic uncertainty high. In particular, private equity firms appear to
have taken advantage of their fund structure and bank relationships to provide both equity and debt
financing to their portfolio companies.
4.2 Robustness
In this section, we examine a set of robustness analyses. First, we drop management
buyouts from our main sample. Eliminating MBOs leads to a substantial drop in total observations,
since these firms constitute about 25% of deals. At least historically in the UK, MBOs were
characterized by lower engagement of private equity firms. If their inclusion completely drove the
results, the interpretation and generalization of the analysis might be more difficult. As we show
in Table A.1 in the Appendix, this is not the case. In columns (1) and (2), we find that the effect
on investment when MBOs are dropped is even larger than the effect in our baseline model.
Similarly, we confirm in the smaller sample the expansion in equity contribution and debt issuance,
and the relative stability in the leverage ratio. Therefore, the exclusion of MBOs does not affect
our results.
Second, we show that our results are robust to concerns related to attrition. As usual with
panel data, the endogenous exit of firms from the data may bias results. Exit may be particularly
problematic if PE-backed companies may be more likely to enter into distress or be targeted by
M&A transactions. Therefore, it is important to understand whether our results are driven by
differences in survivorship across the treatment and control groups.

20
To start, it is important to notice that this concern is unlikely to drive our results given the
timing of the effects. As we noted when discussing the construction (Section 2.1), our sample of
PE firms is conditional on not going out of business before the beginning of 2009. In addition, we
found in Table 3 that the shift in investment and financing policies occurred in 2008 – the first
year of the financial crisis – when by construction no firms went out of business. We can also
illustrate this pattern more directly by estimating our standard model using data from 2007 and
2008 only (Table A.2). In other words, much of the shift in corporate policy happened soon after
the inception of the crisis.
Second, we show that results are similar when we exclude firms that exit before the end of
the sample. In particular, in Table A.3, we take a conservative approach and drop every firm where
either the PE-backed company or one firm in its control group exited the database before 2011.16
This approach leads to a drop of almost 15% of our observations. Even with this reduced sample,
we replicate our main results. Private equity appears to experience a lower decline in investments
(columns 1 and 2) and a relative increase in equity (columns 3 and 4) and debt issuance (columns
5 and 6). At the same time, the leverage ratio stays constant (columns 7 and 8).
Third, we show that our results are robust to changes in industry dynamics. One concern is
that PE-backed firms may be more or less sensitive than the control group to changes in demand
that are contemporaneous to the shock. In principle, this should not be a problem, because the
treatment and control groups are matched across industries. Nonetheless, we augment our analysis
with a full set of (two-digit) industry fixed effects interacted with the crisis dummy. This set of
fixed effects can control non-parametrically for changes in demand and other industry
characteristics. As we show in Table A.4, despite the large number of fixed effects that the model
16 For every PE-backed firm, there are up to five matched control firms. There are 310 companies that exit before
2011, which corresponds to 245 groups of companies that are dropped.

21
introduces, the main results are unchanged. The estimates are still close in magnitude and statistical
power to the one presented before.
Lastly, we confirm that our results are not driven by the specific matching sample used.
We repeat the main analyses using an alternative sample that is constructed matching only on size,
ROA, and industry, therefore allowing the two groups to have different leverage ratios in the pre-
crisis period. Apart from using a different set of matching variables, the methodology is the same
as the one used in our main results. This approach has two main advantages. First, this matching
is closer to the approach of Boucly, Sraer and Thesmar (2011). Second, using fewer matching
variables allow us to match a larger number of observations. In Table A.5, we confirm our main
results with this alternative sample. In columns (1) and (2), we still find that PE-backed companies
experienced a smaller decline in investment during the crisis. The effect is still highly statistically
significant, but slightly smaller in magnitude. Similarly, we confirm the results about equity
(columns 3 and 4) and debt (columns 5 and 6) financing. The only difference with our main results
is a positive increase in the relative leverage ratio for PE-backed companies (columns 7 and 8),
but the effect is small in size and only of borderline significance.
4.3 Firm Heterogeneity: Investment and Financial Constraint
The decline in investment by PE-backed firms during the crisis was significantly smaller
than that of non-PE companies. This divergence appeared in the first year of the financial crisis
and did not revert over the next few years. In particular, PE sponsors helped their portfolio
companies by injecting more equity and facilitating access to credit markets. Overall, these results
are consistent with the idea that private equity can play an important role during financial turmoil
by relaxing the financial constraints faced by their portfolio companies. In this section, we provide
22
more evidence consistent with this hypothesis by studying the heterogeneity of the results,
focusing on financially constrained firms.
We identify heterogeneity in the likelihood of being financially constrained in various
ways. First, we study how the effect of PE backing on investment differs between large and small
firms (Table 4, Panel A). Consistent with the idea that small companies are more likely to be
financially constrained, small businesses have been shown to be more sensitive to credit market
shocks (Petersen and Rajan, 1994; Chodorow-Reich, 2014; Bottero, Lenzu and Mezzanotti, 2015).
In our sample, we identify large firms by looking at the top quartile of employment at 2007, the
last year in our pre-shock period. Using this measure, we show in columns (1) and (2) that the
positive effect on investment was stronger for small companies. Carefully comparing the
magnitude of the interactions, we find that that the PE effect was essentially zero for firms in the
top size quartile, while it was economically significant for smaller firms.
Second, we find similar results when we look across companies that operate in industries
that are differentially dependent on external finance, identified using the standard Rajan-Zingales
(RZ) index (Rajan and Zingales, 1998). In particular, we define more financially dependent firms
as companies operating in two-digit SIC industries characterized with an above-median share of
capital expenditure that is externally financed.17 In principle, firms that were more dependent on
external finance should have been more affected by the financial crisis. Therefore, if private equity
provides some relief to financial stresses, companies in industries characterized by larger RZ
indices should have benefited more. Consistent with this idea, in columns (3) and (4) of Panel A
of Table 4, we show that the positive effect of being backed by private equity was even larger for
17 In line with the literature, this measure is computed using data from US corporations between 1980 and 2008,
available through Compustat. In particular, for each two-digit SIC industry, we measure the RZ index as the median
of CAPEX minus cash flows from operation, scaled by CAPEX.
23
firms in more financially dependent industries: the effect of PE-backing was almost three times
larger.
Third, we find similar results when comparing firms that were more or less leveraged
entering into the crisis. In general, firms with higher leverage are characterized by less financial
flexibility. Therefore, they face more risks when markets seize up and should suffer more during
a financial crisis. Comparing companies based on their 2007 leverage levels, we find that higher
pre-crisis leverage predicted lower investment post-crisis. But among firms in the top quartile of
leverage, PE-backed companies increased investments particularly more than their non-PE
counterparts (columns 5 and 6, Table 4, Panel A). The presence of a PE investor counter-balanced
the negative effect on investments of high leverage.18
Similarly, the positive effect of PE on debt issuance was magnified for firms that are more
likely to be financially constrained (Table 4, Panel B). This is true when looking across size
(columns 1 and 2), and dependence on external finance (columns 3 and 4). However, when sorting
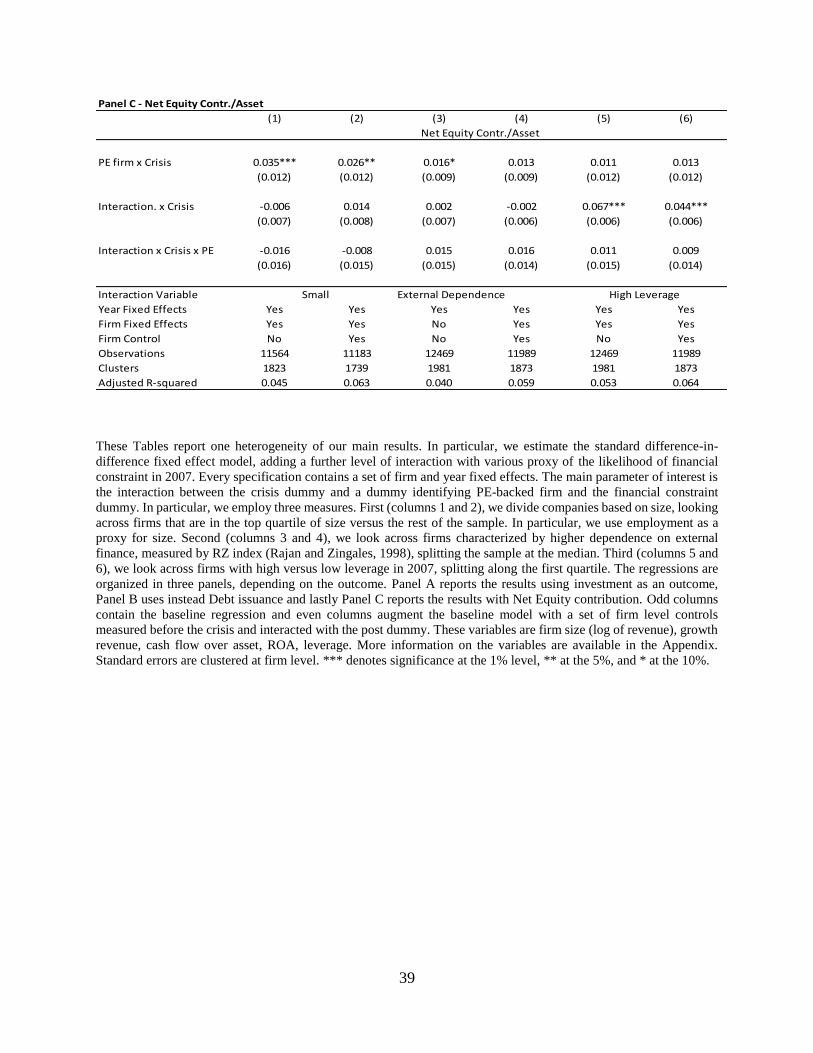
by leverage (columns 5 and 6), the result was positive but not statistically significant. For equity,
the coefficients were generally in the expected direction but never statistically significant (Table
4, Panel C).
These results show that the positive effect of private equity on investments was even
stronger when looking at companies that were ex-ante more likely to be financially constrained.
Differences in funding strategies in response to the financial crisis —particularly with regard to
debt--seems to explain this result.
18 Clearly, leverage at 2007 is endogenous to many firm characteristics, in particular debt capacity. If anything, firms
that expect to respond more successfully to a negative credit shock should ex-ante employ more debt. Therefore, it is
reasonable to think that our results are actually characterized by a downward bias.

24
4.4 Fund Heterogeneity: Investment and Financial Constraints
To further explore the underlying channel for the investment results, we examine how our
effects differ across PE funds of differing maturities. If private equity relaxes the financial stress
faced by companies, PE firms that raised the last fund closer to the inception of the financial crisis
should have been better positioned to help their portfolio companies. Private equity groups
typically raise funds every three to five years, based on when their last fund has been largely
exhausted. Firms with recently raised funds should have more resources to help portfolio firms.
In order to examine this issue, we used Capital IQ and ThomsonOne to identify the PE
investors in each PE-backed firm. We then identify the year in which these investors raised their
last fund before the financial crisis. If we are able to identify more than one investor, we use the
most recent fund across the groups. As we discussed above, this information is not available for
every company. Thus, the sample is smaller than the previous analyses
Furthermore, since variation at investor level is only available for the PE-backed firms, this
analysis differs from the rest of the paper in two aspects. First, it only uses the sample of PE-
backed firms. Second, since most of the movement in both investment and funding happened right
at the beginning of the crisis, we only employ data from 2007-2008 to increase the precision of
our analysis.19 We expected the effects on investments to be stronger when looking at PE firms
that had raised funds more recently before the financial crisis.
In line with this hypothesis, in Table 5 we find a larger increase in investment when PE
investors had raised a fund more recently, suggesting that the availability of resources is an
important explanation of our results. We look at this effect both with a continuous measure – the
year in which the last fund was raised, which is reported in columns (1) and (2) – and a dummy,
19 Results using the full period are very similar. The only difference is that we find slightly noisier results for equity
contributions. The rest is essentially unchanged.
25
where instead we compare companies whose investors raised any fund in the previous ten years to
the rest of the population (columns 3 and 4). The effects are consistent across the two measures,
albeit more precisely estimated with the dummy specification. In terms of magnitude, we find that
companies whose investors raised at least one fund in the previous ten years increased investment
about 25% more than the other group.
Furthermore, we find similar patterns for both equity and debt issuance. In particular,
equity injections increased much more for companies where the investors raised a fund more
recently (Table 5, columns 5-8). The effects are both economically and statistically significant and
are consistent across the two sorting variables. The same patterns hold for debt issuance,
suggesting that better-resourced PE investors also positively affected companies’ ability to raise
debt.
Overall, in this section we show that PE-backed companies during the financial crisis
decreased investments relatively less than the control group. Their ability to maintain high growth
levels was related to the superior ability of PE to access funding during a time of financial turmoil.
5 Performance Analysis
5.1 Change in Performance
The next step is to understand to what extent greater investment increased the long-term
prospects of PE-backed companies. In this section, we examine this question by looking at various
measures of company performance. Were the investment by PE-backed firms imprudent or
wasteful, we would expect that these decisions would have had detrimental effects on their
performance.
26
We start by examining accounting measures of firm performance around the crisis period.
Using the same specification as before, we test how the performance of PE-backed companies
changed relative to non-PE companies around 2008. In Table 6 (Panel A), we find the PE-backed
firms did not experience any change in performance relative to the control group around the crisis.
In particular, we find no significant change either in terms of EBITDA scaled by revenue (columns
3 and 4) or ROA (columns 5 and 6). However, consistent with the results on investment, we find
higher asset growth for the PE-backed group (columns 1 and 2).
Similar to the results for investment and financing policies, the performance results are
robust to various concerns raised before. We find a similar result when we exclude MBOs. There
is no difference when we account for the possible survivorship bias or control for variations in
industry characteristics over time. Using ROA as an outcome, we show these results in Tables A.1
to A.5.
This analysis suggests that the average performance of PE-backed companies was not
differentially affected by the financial shock: the greater investment levels did not lead to low
quality or excessively risky projects. But given the long-term nature of the returns from many
corporate capital expenditures, these accounting measures of performance may fail to capture fully
the underlying change in asset quality and company value around the crisis.
In the next section, we consider alternative measures of performance, based on exit patterns
in the post-crisis period. In particular, we compare the relative likelihood that PE-backed
companies entered into distress or were the target of an M&A deal. Rather than measuring the
average performance, these variables can provide insight into the extreme outcomes – positive or
negative – that these firms faced.

27
5.2 Exit Analysis
Even assuming that the financial crisis did not induce any differential effect on average
firm performance, PE-backed companies may still have outperformed or underperformed the
control group when looking at the extreme outcomes of the distribution. For instance, extensive
investments may not have affected profitability in the short run, but may have increased the
company’s probability of becoming the target of an acquisition. Similarly, it may have boosted the
likelihood of negative tail events, like distress and bankruptcy. In this section, we study how PE
funding affected the probability of both entering into distress and experiencing a profitable exit in
the post-crisis period.
As we discussed in the Data section, we identify “bad exits” by looking at companies that
exited from the Amadeus/Orbis data after signs of financial distress in the previous years. We
identify “potentially profitable exits” focusing on company sales through M&A transactions
without prior company distress.
Thus, we examine how post-crisis exit patterns differed across PE-backed and non-PE
companies. The variation under study is only cross-sectional: therefore, the difference-in-
difference design is not suitable for these tests. To make PE and non-PE-related companies
comparable in the cross-section, we control for industry fixed effects and firm characteristics. Even
with these adjustments, a causal interpretation of these results requires much stronger assumptions
than the previous set of results. In particular, we estimate the following equation:
𝐸𝑥𝑖𝑡𝑖 = 𝛼𝑖𝑛𝑑(𝑖) + 𝛽(𝑃𝐸 𝑓𝑖𝑟𝑚𝑖) + 𝛾𝑋𝑖𝑃𝑅𝐸 + 𝜀𝑖𝑡
where 𝐸𝑥𝑖𝑡𝑖 is a firm-level dummy that identifies the type of exit activity (“bad” or “potentially
profitable”), 𝑃𝐸 𝑓𝑖𝑟𝑚𝑖 is a dummy variable identifying PE-backed companies, 𝛼𝑖𝑛𝑑(𝑖) are
industry-level fixed effects at two digit SIC level, and 𝑋𝑖𝑃𝑅𝐸 are the firm-level characteristics

28
measured before the crisis (2007). Since in this case the outcome is only cross-sectional and
discrete, we estimate this model using a conditional logit model. To facilitate interpretation, all the
results are presented as marginal effects at the mean.
In Panel B of Table 6, we show the main results of this section. We find that PE-backed
firms were more likely to experience a potentially profitable exit (columns 1 and 4). The results
were similar with and without controls, but the magnitude was usually smaller with controls. The
most conservative estimates suggest that PE-backed firms were about 30% more likely to be
acquired in the post-crisis period.
At the same time, PE-backed firms did not appear to be more likely to go out of business
(columns 5-8). In particular, we show that PE-backed firms were not more likely to enter into
distress or to go out of business in the post-crisis period. The results are not only not significant,
but also small in magnitude: across the whole set of coefficients, PE-backed companies were only
between 3 to 9% more likely to go out of business.
Overall, in the post-crisis period, PE-backed companies were more likely to be targeted in
a potentially profitable M&A transaction, but were not more likely to go out of business. Despite
the limitations of the cross-sectional analysis, the results are inconsistent with the hypothesis that
PE financing increases the financial fragility of the firms.
6 Conclusion and Discussion
In this paper, we have studied how PE-backed companies responded to the turmoil caused
by the 2008 financial crisis. In particular, we have examined how companies backed by private
equity firms reacted in terms of investment, financing, and performance. One of the main
objectives of this analysis was to explore whether PE-backed firms increased fragility during the

29
financial crisis, as recently articulated by the Bank of England and others. Furthermore, this
analysis can improve our understanding of the connection between economic cycles and financial
intermediaries more generally.
PE-backed companies decreased investments relatively less than the control group during
the financial crisis. This result can be explained by the ability of PE-backed companies to utilize
the financial and reputational capital of their private equity sponsors to raise equity and debt
funding when markets seized up. Furthermore, we find that the positive investment effects of
private equity were particularly large in companies more likely to be financially constrained at the
time of the crisis. Lastly, we also see stronger investment effects when the private equity sponsor
was more likely to have the resources – both financial and operational – to invest in their portfolio
companies.
Overall, the results are consistent with the ability of PE sponsors to relax financing
constraints during a sudden tightening of capital markets and inconsistent with the hypothesis that
private equity increase financial fragility during periods of financial turmoil.
30
References
Angrist, J. D. and Pischke, J., “Mostly harmless econometrics: An empiricist's companion.”
Princeton University Press, 2008.
Axelson, U., Jenkinson, T., Strömberg, P. and Weisbach, M. S., “Borrow cheap, buy high? The
determinants of leverage and pricing in buyouts.” Journal of Finance, 2013, 68, 2223-67.
Ben-David, I., Franzoni F. and Moussawi R. "Hedge fund stock trading in the financial crisis of
2007–2009." Review of Financial Studies 25.1 (2012): 1-54.
Bernanke, B. and Gertler, M., “Financial fragility and economic performance.” Quarterly Journal
of Economics, 1990, 105, 87-114.
Bernstein, S., Lerner, J., Sorensen, M. and Stromberg, P., “Private equity and industry
performance.” Management Science, 2016, forthcoming.
Bertrand, M., Duflo, E. and Mullainathan, S. “How much should we trust differences-in-
differences estimates?” Quarterly Journal of Economics, 2004, 119, 249-275.
Blundell-Wignall, A., “The private equity boom: Causes and policy issues.” Financial Market
Trends: Organization for Economic Cooperation and Development, 2007, no. 92, 59-86.
Bottero, M., Lenzu, S. and Mezzanotti, F., “Sovereign debt exposure and the bank lending channel:
impact on credit supply and the real economy.” Bank of Italy Working paper, 2015.
Boucly, Q., Sraer, D. and Thesmar, D., “Growth LBOs.” Journal of Financial Economics, 2011,
102, 432-453.
Brav, O. "Access to capital, capital structure, and the funding of the firm." The Journal of Finance
64, no. 1 (2009): 263-308.
Chodorow-Reich, G., “The employment effects of credit market disruptions: Firm-level Evidence
from the 2008--9 financial crisis.” Quarterly Journal of Economics, 2014, 129, 1-59.
Cumming, D., Siegel, D. S. and Wright, M., “Private equity, leveraged buyouts and governance.”
Journal of Corporate Finance, 2007, 13, 439-460.
Duchin, R., Ozbas O. and Sensoy B. "Costly external finance, corporate investment, and the
subprime mortgage credit crisis." Journal of Financial Economics 97.3 (2010): 418-435.
Fahlenbrach, R., Prilmeier, R. and Stulz, R. M., “This time is the same: Using bank performance
in 1998 to explain bank performance during the recent financial crisis.” Journal of Finance,
2012, 67, 2139–2185.
31
Gormley, T. A. and Matsa, D. A., “Common errors: How to (and not to) control for unobserved
heterogeneity.” Review of Financial Studies, 2014, 27, 617-661.
Harris, R., Siegel, D. S. and Wright, M., “Assessing the impact of management buyouts on
economic efficiency: Plant-level evidence from the United Kingdom.” Review of
Economics and Statistics, 2005, 87, 148-153.
Hoshi, T., Kashyap, A. and Scharfstein, D., “The role of banks in reducing the costs of financial
distress in Japan.” Journal of Financial Economics, 1990, 27, 67–88.
Hoshi, T., Kashyap, A. and Scharfstein, D., “Corporate structure, liquidity, and investment:
Evidence from Japanese industrial groups.” Quarterly Journal of Economics, 1991, 106,
33-60.
Hotchkiss, E., Smith, D. C. and Strömberg, P., “Private equity and the resolution of financial
distress.” working paper, 2015.
Ivashina, V. and Kovner, A. “The private equity advantage: Leveraged buyout firms and
relationship banking.” Review of Financial Studies, 2011, 24, 2462-2498.
Ivashina, V. and Scharfstein D. "Bank lending during the financial crisis of 2008." Journal of
Financial economics 97.3 (2010): 319-338.
Kahle, K. M., and Stulz R. "Access to capital, investment, and the financial crisis." Journal of
Financial Economics 110, no. 2 (2013): 280-299.
Kaplan, S. N. and Stein, J. C., “The evolution of buyout pricing and financial structure in the
1980s.” Quarterly Journal of Economics, 1993, 108, 313-357.
Kaplan, S. N. and Stromberg, P., “Leveraged buyouts and private equity.” Journal of Economic
Perspectives, 2009, 23, 121-46.
Michaely, R. and Roberts, M. "Corporate dividend policies: Lessons from private firms." Review
of Financial Studies 25.3 (2012): 711-746.
Petersen, M. A. and Rajan, R. G., “The benefits of lending relationships: Evidence from small
business data.” Journal of Finance, 1994, 49, 3-37.
Rajan, R. G. and Zingales, L., “Financial dependence and growth.” American Economic Review,
1998, 88, 559-586.
Riley, R., Rosazza Bondibene, C. and Young, G. “The financial crisis, bank lending and UK
productivity: Sectoral and firm-level evidence.” National Institute Economic Review,
2014, no. 228, R17-R34.

32
Figure 1: Investment in United Kingdom around the financial crisis
This figure shows the measure of quarterly business investment chained volume (seasonally adjusted) in UK. Currency
values are at 2013. The measure does not include expenditure on dwellings, land and existing buildings and costs of
ownership transfer of non-produced assets. The data comes from the official UK statistics. Information on data can be
found at the website of the “Office of National Statistics”
(https://www.ons.gov.uk/economy/grossdomesticproductgdp/bulletins/businessinvestment/quarter3julytosept2016re
visedresults).
Figure 2: Lending growth in UK around the financial crisis
This figure shows the growth rate in the stock of lending by UK monetary financial institutions to private non-financial
corporations (PNCF) or non-financial businesses. The stock of lending is the total amount of outstanding net lending.
Series included are PNFC M4Lx (seasonally adjusted), sterling loans to PNFCs (seasonally adjusted), all currency
loans to PNFCs (seasonally adjusted), all currency loans to non-financial businesses (non seasonally adjusted). PNFC
M4Lx is the lending to PNFCs, which includes loans, securities, reverse repos, overdrafts, and commercial paper. The
other three measures each includes loans, reverse repos and overdrafts. The data comes from the official statistics of
the Bank of England and they are reported in the report “Trends in Lending (2014).” The data is available at
http://www.bankofengland.co.uk/publications/Pages/other/monetary/trendsinlending2014.aspx .
33
Figure 3: Effect of PE-backed companies on investment over time
This Figure reports the time-varying effect of being a PE-backed company on investment, that is measured as usual
as change in asset plus depreciation, scaled by asset. Specifically, this Figure reports the 𝛽𝑡 of the following equation:-𝑦𝑖𝑡 = 𝛼𝑡 + 𝛼𝑖 + 𝛽𝑡(𝑃𝐸 𝑓𝑖𝑟𝑚𝑖) + 𝜀𝑖𝑡. As explained in the paper, the year 2007 is used as base period and therefore the
corresponding coefficient is normalized to zero. The central dot reports the point estimate while the straight vertical
lines report the 90% confidence interval. The confidence interval is constructed using standard errors clustered at firm
level. More info on this measure is available in the paper and in the Appendix.
Figure 4: Effect of PE-backed companies on equity contribution over time
This Figure reports the time-varying effect of being a PE-backed company on equity contribution, that is measured as
usual as difference in equity, netting out the profit and scaled by asset. Specifically, this Figure reports the 𝛽𝑡 of the
following equation:𝑦𝑖𝑡 = 𝛼𝑡 + 𝛼𝑖 + 𝛽𝑡(𝑃𝐸 𝑓𝑖𝑟𝑚𝑖) + 𝜀𝑖𝑡. As explained in the paper, the year 2007 is used as base
period and therefore the corresponding coefficient is normalized to zero. The central dot reports the point estimate
while the straight vertical lines report the 90% confidence interval. The confidence interval is constructed using
standard errors clustered at firm level. More info on this measure is available in the paper and in the Appendix.
34
Figure 5: Effect of PE-backed companies on debt issuance over time
This Figure reports the time-varying effect of being a PE-backed company on debt issuance, that is measured as usual
as change in total liabilities scaled by asset. Specifically, this Figure reports the 𝛽𝑡 of the following equation: 𝑦𝑖𝑡 =𝛼𝑡 + 𝛼𝑖 + 𝛽𝑡(𝑃𝐸 𝑓𝑖𝑟𝑚𝑖) + 𝜀𝑖𝑡. As explained in the paper, the year 2007 is used as base period and therefore the
corresponding coefficient is normalized to zero. The central dot reports the point estimate while the straight vertical
lines report the 90% confidence interval. The confidence interval is constructed using standard errors clustered at firm
level. More info on this measure is available in the paper and in the Appendix.
35
Table 1: Summary Statistics
Panel A: Industry distribution
Industry Distribution PE SAMPLE FULL SAMPLE UK
Mining 1% 2%
Construction 6% 15%
Manufacturing 32% 17%
Wholesale Trade 12% 11%
Retail Trade 7% 6%
Transportation 4% 6%
Services 38% 44%
100% 100% Panel B: Firms’ characteristics in 2007
N Mean Median SD N Mean Median SD MeanDiff.
Revenue(M$) 432 98.05 35.30 240.81 1527 77.64 29.86 184.49 20.41*
ROA 434 0.09 0.09 0.23 1550 0.09 0.09 0.22 0.01
Investment/Asset 434 0.17 0.20 0.28 1550 0.21 0.20 0.24 -0.03**
EquityContr/Asset 415 -0.02 0.01 0.13 1513 -0.01 0.01 0.13 -0.01
NetDebtIss./Asset 415 0.09 0.10 0.23 1513 0.11 0.08 0.24 -0.01
Debt/Asset 434 0.71 0.70 0.39 1550 0.69 0.67 0.39 0.02
BankDebt/Asset 429 0.32 0.25 0.35 1524 0.34 0.27 0.36 -0.01
Debt/EBITDA 433 5.35 3.91 27.35 1549 5.06 4.12 20.97 0.29
BankDebt/EBITDA 428 2.28 1.20 15.14 1523 2.44 1.37 13.63 -0.16
PESAMPLE NONPESAMPLE
Panel C: Firms’ trends in 2007
N Mean Median SD N Mean Median SD Mean Diff.
Growth Revenue - 1 year 423 0.37 0.18 1.34 1456 0.35 0.17 1.17 0.02
Growth ROA - 1 year 427 0.71 -0.03 5.21 1483 0.79 0.07 4.48 -0.07
Growth Invest. 1 year 386 1.54 0.10 5.86 1434 1.37 0.05 5.20 0.17
Growth Eq. Contr. - 1 year 372 -0.59 0.39 15.96 1376 -0.93 0.09 13.73 0.34
Growth Net Debt Iss. - 1 year 376 2.95 0.32 15.09 1428 2.25 0.20 12.86 0.70
Growth Leverage - 1 year 418 0.02 -0.03 0.34 1516 0.02 -0.02 0.31 0.01
Growth Revenue - 2 year 393 0.56 0.33 2.08 1362 0.71 0.34 2.33 -0.15
Growth ROA - 2 year 400 1.10 0.05 8.33 1388 1.40 0.11 6.97 -0.29
Growth Invest. 2 year 339 1.85 0.61 6.22 1333 2.39 0.94 6.06 -0.54
Growth Eq. Contr. - 2 year 330 0.43 1.09 23.44 1274 0.70 1.05 18.95 -0.28
Growth Net Debt Iss. - 2 year 343 3.45 0.65 18.73 1359 2.94 0.76 13.99 0.51
Growth Leverage - 2 year 382 0.01 -0.04 0.46 1442 0.04 -0.04 0.60 -0.03
PE SAMPLE NON PE SAMPLE
In Panel A, we report the industry distribution at the macro industry level (1-digit SIC) for the PE sample and the
whole universe of medium and large UK firms that are not financial, insurance, regulated or public administration, as
excluded in the paper. In Panel B, the table reports the summary statistics of the companies at 2007 across treated (PE-
backed companies) and untreated firms (non-PE companies), as well as the differences across the two groups. In
particular, the last column reports the mean difference. Level variables are in millions of dollars. Panel C reports the
one-year and two-year growth in the characteristics at 2007. In particular, the last column reports the mean difference.
More information in the variable definition is available in the Appendix or in the paper. *** denotes significance at
the 1% level, ** at the 5%, and * at the 10%.
36
Table 2: Investment and funding policies
(1) (2) (3) (4) (5) (6) (7) (8)
PE firm x Crisis 0.059*** 0.056*** 0.022*** 0.021*** 0.042*** 0.039*** 0.013 0.012
(0.013) (0.013) (0.007) (0.007) (0.011) (0.011) (0.015) (0.014)
Year Fixed Effects Yes Yes Yes Yes Yes Yes Yes Yes
Firm Fixed Effects Yes Yes Yes Yes Yes Yes Yes Yes
Firm Control No Yes No Yes No Yes No Yes
Observations 12456 11910 12469 12003 12903 12274 13205 12553
Clusters 1984 1878 1981 1876 1982 1876 1984 1878
Adjusted R-squared 0.160 0.161 0.040 0.059 0.090 0.104 0.011 0.029
LeverageInvestment/Asset Net Debt Issu./AssetNet Equity Contr./Asset
This Table reports the main results of the paper, where we estimate the standard difference-in-difference fixed effect
model on the investment and funding variables. Every specification contains a set of firm and year fixed effects. The
main parameter of interest is the interaction between the crisis dummy and a dummy identifying PE-backed firm. Odd
columns contain the baseline regression and instead even columns augment the baseline model with a set of firm level
controls measured before the crisis and interacted with the post dummy. These variables are firm size (log of revenue),
growth revenue, cash flow over asset, ROA, leverage. In columns (1) and (2) the outcome is investment scaled by
asset; in columns (3) and (4) is net equity contribution over asset; in columns (5) and (6) is the net debt issuance; in
columns (7) and (8) is the total leverage. More information on the variables are available in the Appendix. Standard
errors are clustered at firm level. *** denotes significance at the 1% level, ** at the 5%, and * at the 10%.
37
Table 3: Investment and funding policies over time
(1) (2) (3) (4) (5) (6)
PE firm x y2011 0.068*** 0.064*** 0.021* 0.018* 0.019 0.019
(0.021) (0.021) (0.011) (0.011) (0.020) (0.020)
PE firm x y2010 0.067*** 0.064*** 0.014 0.013 0.037** 0.032*
(0.021) (0.021) (0.012) (0.012) (0.018) (0.018)
PE firm x y2009 0.057** 0.050** 0.008 0.006 0.029 0.022
(0.024) (0.024) (0.012) (0.012) (0.021) (0.021)
PE firm x y2008 0.084*** 0.087*** 0.025** 0.025** 0.046** 0.043**
(0.022) (0.022) (0.013) (0.012) (0.021) (0.020)
PE firm x y2006 0.010 0.009 -0.009 -0.010 -0.020 -0.024
(0.024) (0.025) (0.012) (0.012) (0.024) (0.024)
PE firm x y2005 0.032 0.032 -0.015 -0.013 0.001 0.000
(0.026) (0.026) (0.015) (0.016) (0.023) (0.023)
PE firm x y2004 0.015 0.018 -0.000 0.002 -0.026 -0.028
(0.029) (0.029) (0.013) (0.013) (0.027) (0.028)
Year Fixed Effects Yes Yes Yes Yes Yes Yes
Firm Fixed Effects Yes Yes Yes Yes Yes Yes
Firm Control No Yes No Yes No Yes
Observations 12456 11910 12469 12003 12903 12274
Clusters 1984 1878 1981 1876 1982 1876
Adjusted R-squared 0.160 0.161 0.040 0.059 0.090 0.104
Investment/Asset Net Debt Issu./Asset Net Equity Contr./Asset
This Table reports the main results of the paper, but where we estimate the time-varying effect for every year. Every
specification contains a set of firm and year fixed effects. Specifically, this table reports the 𝛽𝑡 of the following
equation: 𝑦𝑖𝑡 = 𝛼𝑡 + 𝛼𝑖 + 𝛽𝑡(𝑃𝐸 𝑓𝑖𝑟𝑚𝑖) + 𝜀𝑖𝑡. Odd columns contain the baseline regression and instead even
columns augment the baseline model with a set of firm level controls measured before the crisis and interacted with
the post dummy. These variables are firm size (log of revenue), growth revenue, cash flow over asset, ROA, leverage.
In columns (1) and (2) the outcome is investment scaled by asset; in columns (3) and (4) is net equity contribution
over asset; in columns (5) and (6) is the net debt issuance. More information on the variables are available in the
Appendix. Standard errors are clustered at firm level. *** denotes significance at the 1% level, ** at the 5%, and * at
the 10%.
Table 4: Heterogeneity across firms’ financial constraints

38
Panel A - Investment / Asset
(1) (2) (3) (4) (5) (6)
PE firm x Crisis 0.014 0.011 0.030** 0.023 0.023 0.023
(0.020) (0.020) (0.014) (0.014) (0.017) (0.018)
Interaction. x Crisis -0.025* -0.016 -0.047*** -0.041*** -0.055*** -0.038***
(0.013) (0.015) (0.012) (0.012) (0.012) (0.014)
Interaction x Crisis x PE 0.053** 0.051** 0.067** 0.077*** 0.072*** 0.064***
(0.026) (0.026) (0.027) (0.026) (0.025) (0.025)
Interaction Variable High External Dependence
Year Fixed Effects Yes Yes Yes Yes Yes Yes
Firm Fixed Effects Yes Yes No Yes Yes Yes
Firm Control No Yes No Yes No Yes
Observations 11539 11105 12456 11910 12456 11910
Clusters 1824 1742 1984 1878 1984 1878
Adjusted R-squared 0.160 0.162 0.161 0.162 0.162 0.162
Investment/Asset
Small High Leverage
Panel B - New Debt Issuances / Assets
(1) (2) (3) (4) (5) (6)
PE firm x Crisis -0.004 0.003 0.014 0.012 0.036*** 0.033**
(0.019) (0.019) (0.013) (0.012) (0.013) (0.013)
Interaction. x Crisis -0.015 -0.030** -0.049*** -0.035*** -0.152*** -0.096***
(0.014) (0.014) (0.012) (0.011) (0.011) (0.013)
Interaction x Crisis x PE 0.055** 0.046* 0.062*** 0.062*** 0.028 0.023
(0.024) (0.024) (0.024) (0.024) (0.021) (0.021)
Interaction Variable High External Dependence
Year Fixed Effects Yes Yes Yes Yes Yes Yes
Firm Fixed Effects Yes Yes No Yes Yes Yes
Firm Control No Yes No Yes No Yes
Observations 11891 11400 12903 12274 12903 12274
Clusters 1823 1741 1982 1876 1982 1876
Adjusted R-squared 0.089 0.101 0.091 0.105 0.105 0.109
Net Debt Issu./Asset
Small High Leverage
39
Panel C - Net Equity Contr./Asset
(1) (2) (3) (4) (5) (6)
PE firm x Crisis 0.035*** 0.026** 0.016* 0.013 0.011 0.013
(0.012) (0.012) (0.009) (0.009) (0.012) (0.012)
Interaction. x Crisis -0.006 0.014 0.002 -0.002 0.067*** 0.044***
(0.007) (0.008) (0.007) (0.006) (0.006) (0.006)
Interaction x Crisis x PE -0.016 -0.008 0.015 0.016 0.011 0.009
(0.016) (0.015) (0.015) (0.014) (0.015) (0.014)
Interaction Variable High External Dependence
Year Fixed Effects Yes Yes Yes Yes Yes Yes
Firm Fixed Effects Yes Yes No Yes Yes Yes
Firm Control No Yes No Yes No Yes
Observations 11564 11183 12469 11989 12469 11989
Clusters 1823 1739 1981 1873 1981 1873
Adjusted R-squared 0.045 0.063 0.040 0.059 0.053 0.064
Small High Leverage
Net Equity Contr./Asset
These Tables report one heterogeneity of our main results. In particular, we estimate the standard difference-in-
difference fixed effect model, adding a further level of interaction with various proxy of the likelihood of financial
constraint in 2007. Every specification contains a set of firm and year fixed effects. The main parameter of interest is
the interaction between the crisis dummy and a dummy identifying PE-backed firm and the financial constraint
dummy. In particular, we employ three measures. First (columns 1 and 2), we divide companies based on size, looking
across firms that are in the top quartile of size versus the rest of the sample. In particular, we use employment as a
proxy for size. Second (columns 3 and 4), we look across firms characterized by higher dependence on external
finance, measured by RZ index (Rajan and Zingales, 1998), splitting the sample at the median. Third (columns 5 and
6), we look across firms with high versus low leverage in 2007, splitting along the first quartile. The regressions are
organized in three panels, depending on the outcome. Panel A reports the results using investment as an outcome,
Panel B uses instead Debt issuance and lastly Panel C reports the results with Net Equity contribution. Odd columns
contain the baseline regression and even columns augment the baseline model with a set of firm level controls
measured before the crisis and interacted with the post dummy. These variables are firm size (log of revenue), growth
revenue, cash flow over asset, ROA, leverage. More information on the variables are available in the Appendix.
Standard errors are clustered at firm level. *** denotes significance at the 1% level, ** at the 5%, and * at the 10%.
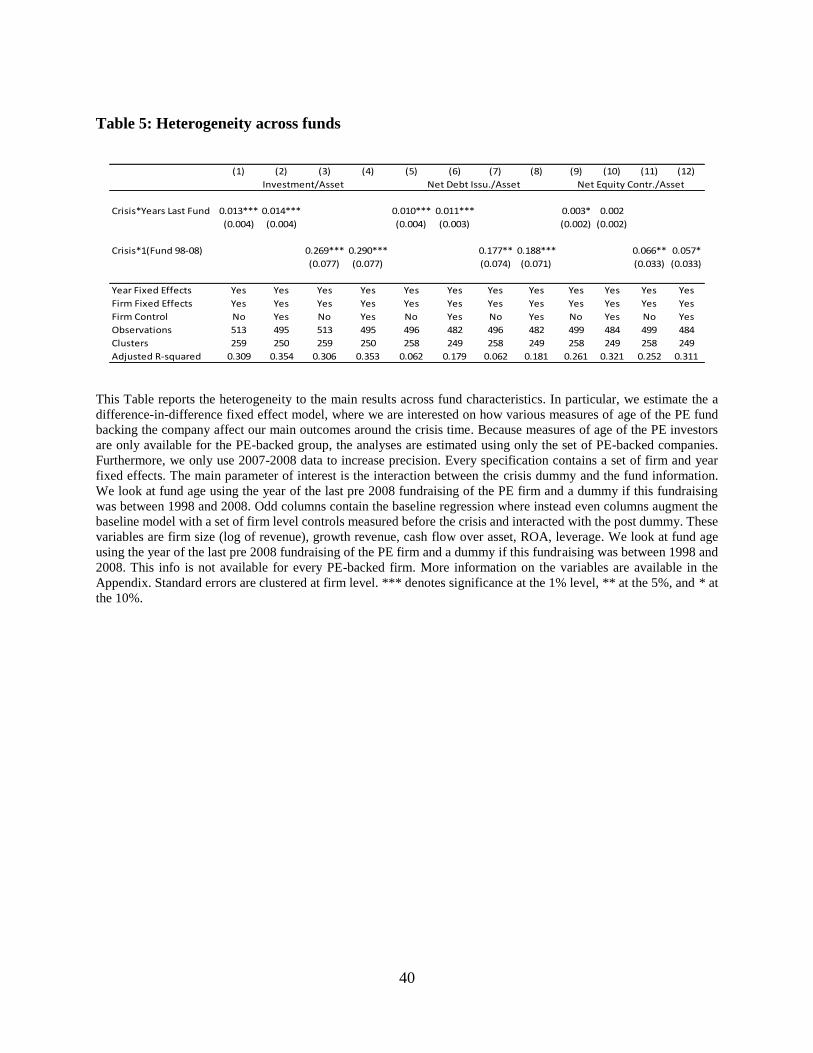
40
Table 5: Heterogeneity across funds
(1) (2) (3) (4) (5) (6) (7) (8) (9) (10) (11) (12)
Crisis*Years Last Fund 0.013*** 0.014*** 0.010*** 0.011*** 0.003* 0.002
(0.004) (0.004) (0.004) (0.003) (0.002) (0.002)
Crisis*1(Fund 98-08) 0.269*** 0.290*** 0.177** 0.188*** 0.066** 0.057*
(0.077) (0.077) (0.074) (0.071) (0.033) (0.033)
Year Fixed Effects Yes Yes Yes Yes Yes Yes Yes Yes Yes Yes Yes Yes
Firm Fixed Effects Yes Yes Yes Yes Yes Yes Yes Yes Yes Yes Yes Yes
Firm Control No Yes No Yes No Yes No Yes No Yes No Yes
Observations 513 495 513 495 496 482 496 482 499 484 499 484
Clusters 259 250 259 250 258 249 258 249 258 249 258 249
Adjusted R-squared 0.309 0.354 0.306 0.353 0.062 0.179 0.062 0.181 0.261 0.321 0.252 0.311
Investment/Asset Net Debt Issu./Asset Net Equity Contr./Asset
This Table reports the heterogeneity to the main results across fund characteristics. In particular, we estimate the a
difference-in-difference fixed effect model, where we are interested on how various measures of age of the PE fund
backing the company affect our main outcomes around the crisis time. Because measures of age of the PE investors
are only available for the PE-backed group, the analyses are estimated using only the set of PE-backed companies.
Furthermore, we only use 2007-2008 data to increase precision. Every specification contains a set of firm and year
fixed effects. The main parameter of interest is the interaction between the crisis dummy and the fund information.
We look at fund age using the year of the last pre 2008 fundraising of the PE firm and a dummy if this fundraising
was between 1998 and 2008. Odd columns contain the baseline regression where instead even columns augment the
baseline model with a set of firm level controls measured before the crisis and interacted with the post dummy. These
variables are firm size (log of revenue), growth revenue, cash flow over asset, ROA, leverage. We look at fund age
using the year of the last pre 2008 fundraising of the PE firm and a dummy if this fundraising was between 1998 and
2008. This info is not available for every PE-backed firm. More information on the variables are available in the
Appendix. Standard errors are clustered at firm level. *** denotes significance at the 1% level, ** at the 5%, and * at
the 10%.
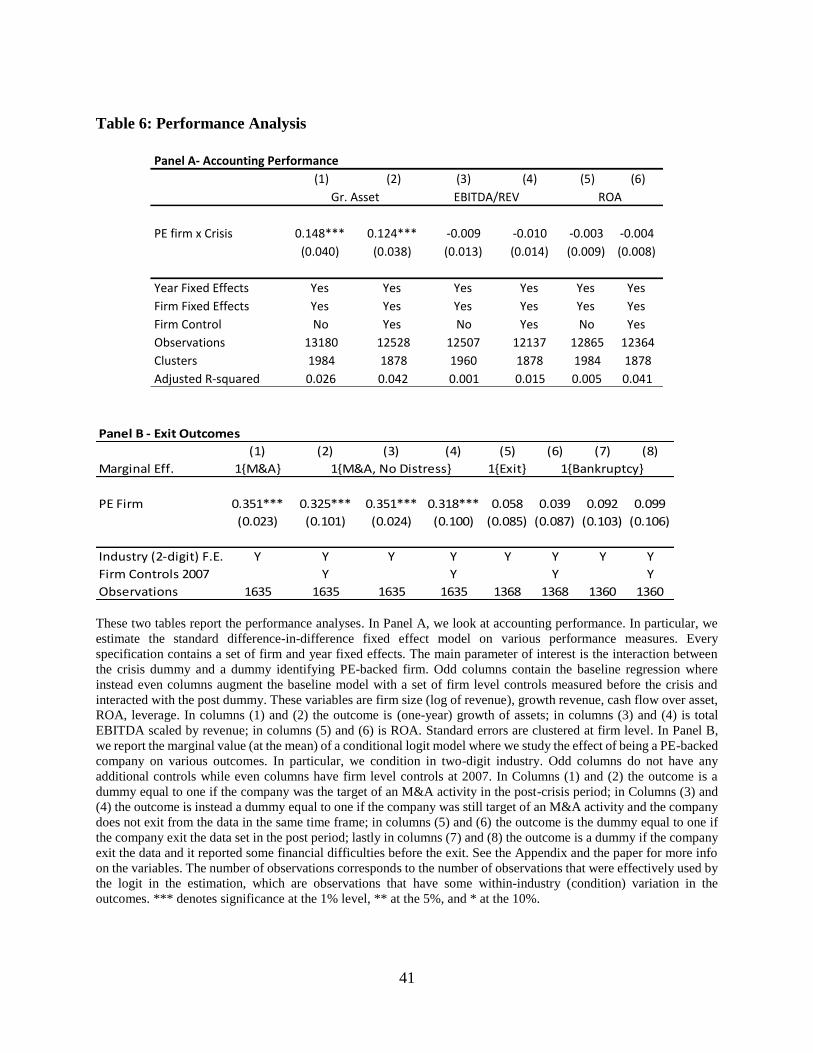
41
Table 6: Performance Analysis
STANDARDPERFORMANCE
PanelA-AccountingPerformance
(1) (2) (3) (4) (5) (6)
PEfirmxCrisis 0.148*** 0.124*** -0.009 -0.010 -0.003 -0.004
(0.040) (0.038) (0.013) (0.014) (0.009) (0.008)
YearFixedEffects Yes Yes Yes Yes Yes Yes
FirmFixedEffects Yes Yes Yes Yes Yes Yes
FirmControl No Yes No Yes No Yes
Observations 13180 12528 12507 12137 12865 12364
Clusters 1984 1878 1960 1878 1984 1878
AdjustedR-squared 0.026 0.042 0.001 0.015 0.005 0.041
ROAGr.Asset EBITDA/REV
Panel B - Exit Outcomes
(1) (2) (3) (4) (5) (6) (7) (8)
Marginal Eff. 1{M&A} 1{M&A, No Distress} 1{Exit} 1{Bankruptcy}
PE Firm 0.351*** 0.325*** 0.351*** 0.318*** 0.058 0.039 0.092 0.099
(0.023) (0.101) (0.024) (0.100) (0.085) (0.087) (0.103) (0.106)
Industry (2-digit) F.E. Y Y Y Y Y Y Y Y
Firm Controls 2007 Y Y Y Y
Observations 1635 1635 1635 1635 1368 1368 1360 1360
These two tables report the performance analyses. In Panel A, we look at accounting performance. In particular, we
estimate the standard difference-in-difference fixed effect model on various performance measures. Every
specification contains a set of firm and year fixed effects. The main parameter of interest is the interaction between
the crisis dummy and a dummy identifying PE-backed firm. Odd columns contain the baseline regression where
instead even columns augment the baseline model with a set of firm level controls measured before the crisis and
interacted with the post dummy. These variables are firm size (log of revenue), growth revenue, cash flow over asset,
ROA, leverage. In columns (1) and (2) the outcome is (one-year) growth of assets; in columns (3) and (4) is total
EBITDA scaled by revenue; in columns (5) and (6) is ROA. Standard errors are clustered at firm level. In Panel B,
we report the marginal value (at the mean) of a conditional logit model where we study the effect of being a PE-backed
company on various outcomes. In particular, we condition in two-digit industry. Odd columns do not have any
additional controls while even columns have firm level controls at 2007. In Columns (1) and (2) the outcome is a
dummy equal to one if the company was the target of an M&A activity in the post-crisis period; in Columns (3) and
(4) the outcome is instead a dummy equal to one if the company was still target of an M&A activity and the company
does not exit from the data in the same time frame; in columns (5) and (6) the outcome is the dummy equal to one if
the company exit the data set in the post period; lastly in columns (7) and (8) the outcome is a dummy if the company
exit the data and it reported some financial difficulties before the exit. See the Appendix and the paper for more info
on the variables. The number of observations corresponds to the number of observations that were effectively used by
the logit in the estimation, which are observations that have some within-industry (condition) variation in the
outcomes. *** denotes significance at the 1% level, ** at the 5%, and * at the 10%.
42
Appendix
A.1 Data and variable construction
All the data in the paper comes from Amadeus/Orbis produced by Bureau Van Dijk. To
minimize the chances that data errors could drive our results, we winsorize at 1% every ratio and
growth variates used in the analysis. The winsorization over the full sample of Amadeus/Orbis,
companies, in order to benchmark the ratios to the whole population distribution. All variables in
level are in millions of dollars.
The main variables we used in the analysis are the following: (a) Investment/Asset, where
investment is constructed as the change in asset over the last year, plus the depreciation; (b) (Net)
Equity contribution/Asset, where the equity contribution is measured as the difference in total
equity (shareholder value) over the last year, minus the profit; (c) (Net) Debt Issuance/Asset, where
the debt issuance is constructed as the overall change in debt; (d) Leverage, which is simply total
debt (short and long-term) scaled by asset; (e) ROA: net income over total assets; (f)
EBITDA/Asset, where EBITDA represent the earnings before interests, tax and depreciation.
In the paper, we also use different methodologies to determine companies that are more or
less likely to be financial constrained as the financial crisis unfolds. First, we use size by looking
at the top quartile of revenue at 2007, in the sample of the analyzed firms. Second, we identify
firms that are at the top quartile of leverage at 2007. Third, we identify companies operating in
industries more dependent on external finance. The index is constructed using Compustat in the
following way. Using the whole set of consolidated reports in Compustat between 1980 and 2007,
we construct a score for every two digit SIC code which is median of CAPEX minus operating
cash flow, scaled by CAPEX.
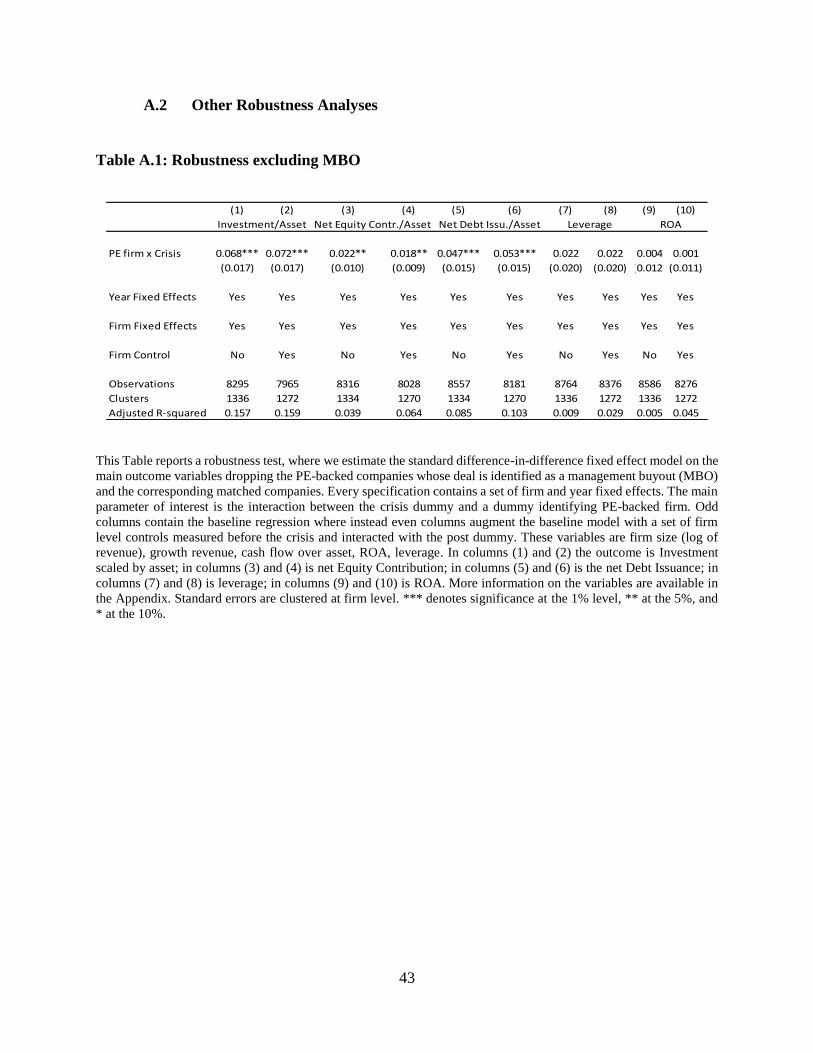
43
A.2 Other Robustness Analyses
Table A.1: Robustness excluding MBO
(1) (2) (3) (4) (5) (6) (7) (8) (9) (10)
PE firm x Crisis 0.068*** 0.072*** 0.022** 0.018** 0.047*** 0.053*** 0.022 0.022 0.004 0.001
(0.017) (0.017) (0.010) (0.009) (0.015) (0.015) (0.020) (0.020) (0.012) (0.011)
Year Fixed Effects Yes Yes Yes Yes Yes Yes Yes Yes Yes Yes
Firm Fixed Effects Yes Yes Yes Yes Yes Yes Yes Yes Yes Yes
Firm Control No Yes No Yes No Yes No Yes No Yes
Observations 8295 7965 8316 8028 8557 8181 8764 8376 8586 8276
Clusters 1336 1272 1334 1270 1334 1270 1336 1272 1336 1272
Adjusted R-squared 0.157 0.159 0.039 0.064 0.085 0.103 0.009 0.029 0.005 0.045
ROAInvestment/Asset Net Debt Issu./AssetNet Equity Contr./Asset Leverage
This Table reports a robustness test, where we estimate the standard difference-in-difference fixed effect model on the
main outcome variables dropping the PE-backed companies whose deal is identified as a management buyout (MBO)
and the corresponding matched companies. Every specification contains a set of firm and year fixed effects. The main
parameter of interest is the interaction between the crisis dummy and a dummy identifying PE-backed firm. Odd
columns contain the baseline regression where instead even columns augment the baseline model with a set of firm
level controls measured before the crisis and interacted with the post dummy. These variables are firm size (log of
revenue), growth revenue, cash flow over asset, ROA, leverage. In columns (1) and (2) the outcome is Investment
scaled by asset; in columns (3) and (4) is net Equity Contribution; in columns (5) and (6) is the net Debt Issuance; in
columns (7) and (8) is leverage; in columns (9) and (10) is ROA. More information on the variables are available in
the Appendix. Standard errors are clustered at firm level. *** denotes significance at the 1% level, ** at the 5%, and
* at the 10%.
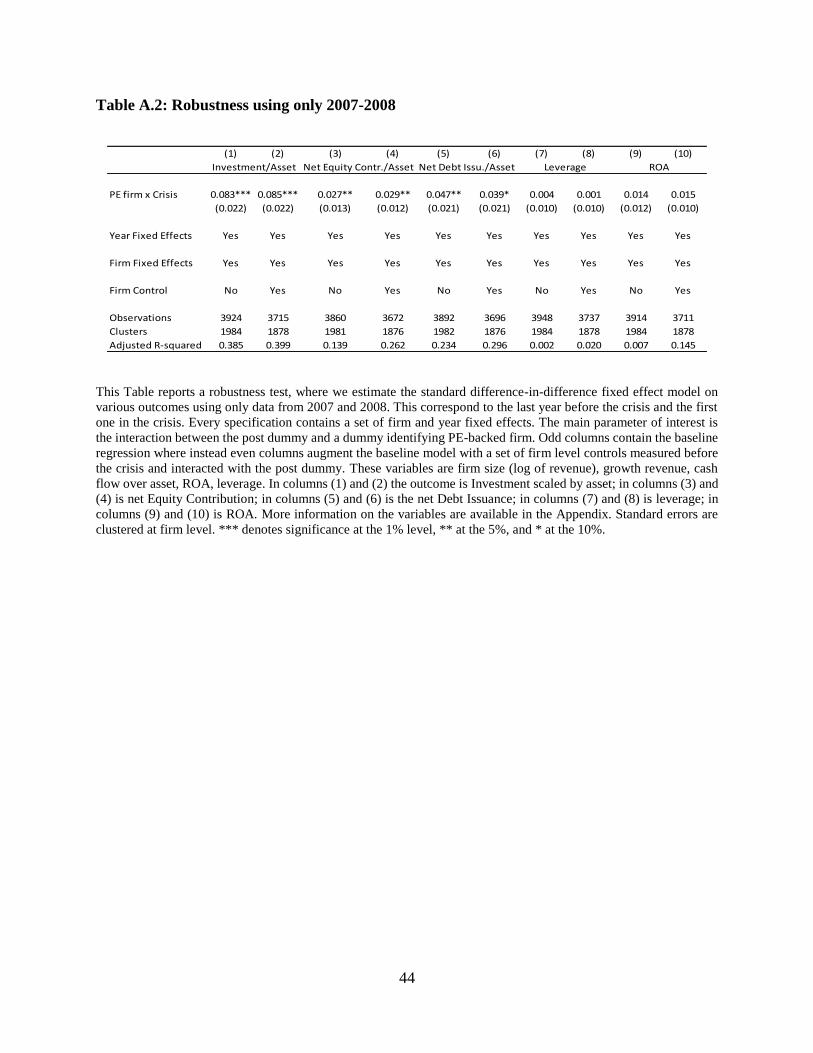
44
Table A.2: Robustness using only 2007-2008
(1) (2) (3) (4) (5) (6) (7) (8) (9) (10)
PE firm x Crisis 0.083*** 0.085*** 0.027** 0.029** 0.047** 0.039* 0.004 0.001 0.014 0.015
(0.022) (0.022) (0.013) (0.012) (0.021) (0.021) (0.010) (0.010) (0.012) (0.010)
Year Fixed Effects Yes Yes Yes Yes Yes Yes Yes Yes Yes Yes
Firm Fixed Effects Yes Yes Yes Yes Yes Yes Yes Yes Yes Yes
Firm Control No Yes No Yes No Yes No Yes No Yes
Observations 3924 3715 3860 3672 3892 3696 3948 3737 3914 3711
Clusters 1984 1878 1981 1876 1982 1876 1984 1878 1984 1878
Adjusted R-squared 0.385 0.399 0.139 0.262 0.234 0.296 0.002 0.020 0.007 0.145
Investment/Asset Net Equity Contr./Asset Net Debt Issu./Asset Leverage ROA
This Table reports a robustness test, where we estimate the standard difference-in-difference fixed effect model on
various outcomes using only data from 2007 and 2008. This correspond to the last year before the crisis and the first
one in the crisis. Every specification contains a set of firm and year fixed effects. The main parameter of interest is
the interaction between the post dummy and a dummy identifying PE-backed firm. Odd columns contain the baseline
regression where instead even columns augment the baseline model with a set of firm level controls measured before
the crisis and interacted with the post dummy. These variables are firm size (log of revenue), growth revenue, cash
flow over asset, ROA, leverage. In columns (1) and (2) the outcome is Investment scaled by asset; in columns (3) and
(4) is net Equity Contribution; in columns (5) and (6) is the net Debt Issuance; in columns (7) and (8) is leverage; in
columns (9) and (10) is ROA. More information on the variables are available in the Appendix. Standard errors are
clustered at firm level. *** denotes significance at the 1% level, ** at the 5%, and * at the 10%.

45
Table A.3: Robustness using only companies not experiencing exit
(1) (2) (3) (4) (5) (6) (7) (8) (9) (10)
PE firm x Crisis 0.044*** 0.040*** 0.017** 0.016** 0.030** 0.025** 0.003 0.000 -0.003 -0.003
(0.014) (0.014) (0.008) (0.008) (0.013) (0.012) (0.014) (0.014) (0.010) (0.009)
Year Fixed Effects Yes Yes Yes Yes Yes Yes Yes Yes Yes Yes
Firm Fixed Effects Yes Yes Yes Yes Yes Yes Yes Yes Yes Yes
Firm Control No Yes No Yes No Yes No Yes No Yes
Observations 9658 9271 9700 9367 10020 9567 10242 9776 9984 9630
Clusters 1525 1452 1525 1452 1525 1452 1525 1452 1525 1452
Adjusted R-squared 0.160 0.160 0.046 0.061 0.090 0.102 0.029 0.040 0.006 0.041
ROAInvestment/Asset Net Equity Contr./Asset Net Debt Issu./Asset Leverage
This Table reports a robustness test, where we estimate the standard difference-in-difference fixed effect model on
various outcomes using only data only for groups of matched firms where no company is identified as leaving the data
by 2011 (survivorship bias free). Every specification contains a set of firm and year fixed effects. The main parameter
of interest is the interaction between the post dummy and a dummy identifying PE-backed firm. Odd columns contain
the baseline regression where instead even columns augment the baseline model with a set of firm level controls
measured before the crisis and interacted with the post dummy. These variables are firm size (log of revenue), growth
revenue, cash flow over asset, ROA, leverage. In columns (1) and (2) the outcome is Investment scaled by asset; in
columns (3) and (4) is net Equity Contribution; in columns (5) and (6) is the net Debt Issuance; in columns (7) and (8)
is leverage; in columns (9) and (10) is ROA. More information on the variables are available in the Appendix. Standard
errors are clustered at firm level. *** denotes significance at the 1% level, ** at the 5%, and * at the 10%.

46
Table A.4: Robustness adding time-varying industry fixed effects
(1) (2) (3) (4) (5) (6) (7) (8) (9) (10)
PE firm x Crisis 0.055*** 0.053*** 0.022*** 0.021*** 0.039*** 0.037*** 0.012 0.013 -0.004 -0.005
(0.013) (0.013) (0.007) (0.007) (0.011) (0.011) (0.015) (0.014) (0.009) (0.008)
Industry X Year FE Yes Yes Yes Yes Yes Yes Yes Yes Yes Yes
Year Fixed Effects Yes Yes Yes Yes Yes Yes Yes Yes Yes Yes
Firm Fixed Effects Yes Yes Yes Yes Yes Yes Yes Yes Yes Yes
Firm Control No Yes No Yes No Yes No Yes No Yes
Observations 12456 11910 12469 12003 12903 12274 13205 12553 12865 12364
Clusters 1984 1878 1981 1876 1982 1876 1984 1878 1984 1878
Adjusted R-squared 0.163 0.163 0.042 0.060 0.093 0.105 0.019 0.040 0.010 0.045
Investment/Asset Net Equity Contr./Asset Net Debt Issu./Asset Leverage ROA
This Table reports a robustness test, where we estimate the standard difference-in-difference fixed effect model on
various outcomes adding set of fixed effects generated as the product of industry (two digit SIC) and the post dummy.
Every specification contains a set of firm and year fixed effects. The main parameter of interest is the interaction
between the post dummy and a dummy identifying PE-backed firm. Odd columns contain the baseline regression
where instead even columns augment the baseline model with a set of firm level controls measured before the crisis
and interacted with the post dummy. These variables are firm size (log of revenue), growth revenue, cash flow over
asset, ROA, leverage. In columns (1) and (2) the outcome is Investment scaled by asset; in columns (3) and (4) is net
Equity Contribution; in columns (5) and (6) is the net Debt Issuance; in columns (7) and (8) is leverage; in columns
(9) and (10) is ROA. More information on the variables are available in the Appendix. Standard errors are clustered
at firm level. *** denotes significance at the 1% level, ** at the 5%, and * at the 10%.
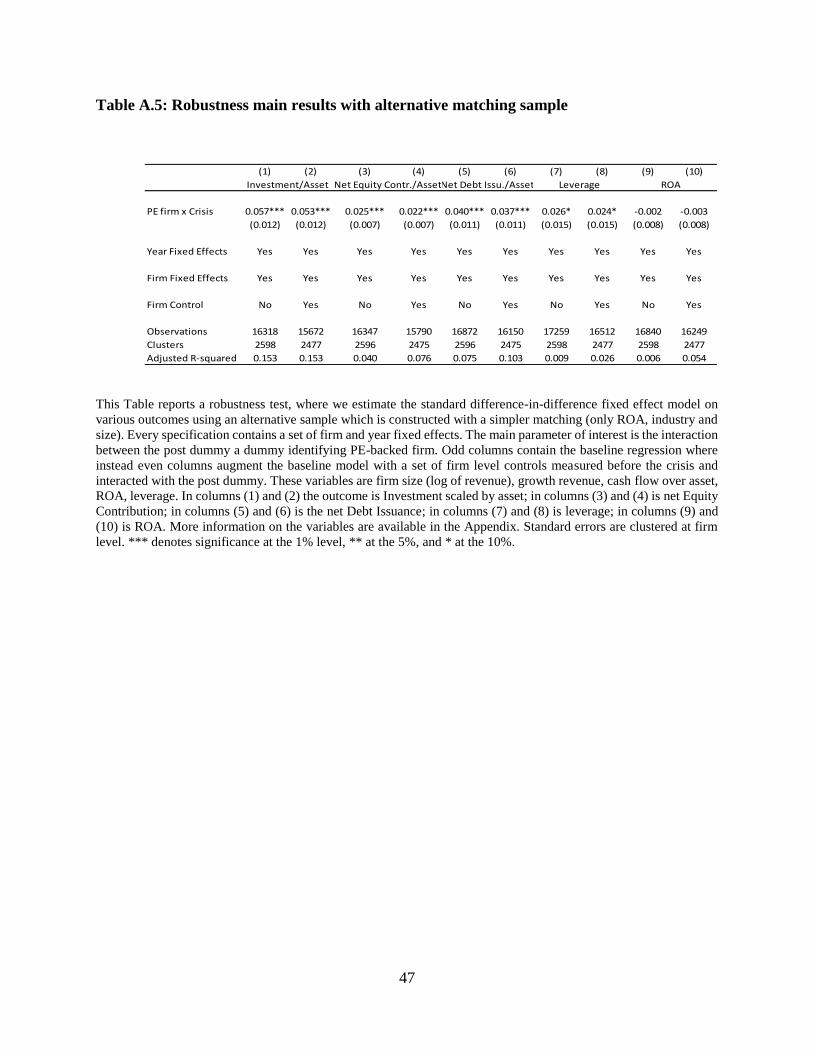
47
Table A.5: Robustness main results with alternative matching sample
(1) (2) (3) (4) (5) (6) (7) (8) (9) (10)
PE firm x Crisis 0.057*** 0.053*** 0.025*** 0.022*** 0.040*** 0.037*** 0.026* 0.024* -0.002 -0.003
(0.012) (0.012) (0.007) (0.007) (0.011) (0.011) (0.015) (0.015) (0.008) (0.008)
Year Fixed Effects Yes Yes Yes Yes Yes Yes Yes Yes Yes Yes
Firm Fixed Effects Yes Yes Yes Yes Yes Yes Yes Yes Yes Yes
Firm Control No Yes No Yes No Yes No Yes No Yes
Observations 16318 15672 16347 15790 16872 16150 17259 16512 16840 16249
Clusters 2598 2477 2596 2475 2596 2475 2598 2477 2598 2477
Adjusted R-squared 0.153 0.153 0.040 0.076 0.075 0.103 0.009 0.026 0.006 0.054
Investment/Asset Net Equity Contr./AssetNet Debt Issu./Asset Leverage ROA
This Table reports a robustness test, where we estimate the standard difference-in-difference fixed effect model on
various outcomes using an alternative sample which is constructed with a simpler matching (only ROA, industry and
size). Every specification contains a set of firm and year fixed effects. The main parameter of interest is the interaction
between the post dummy a dummy identifying PE-backed firm. Odd columns contain the baseline regression where
instead even columns augment the baseline model with a set of firm level controls measured before the crisis and
interacted with the post dummy. These variables are firm size (log of revenue), growth revenue, cash flow over asset,
ROA, leverage. In columns (1) and (2) the outcome is Investment scaled by asset; in columns (3) and (4) is net Equity
Contribution; in columns (5) and (6) is the net Debt Issuance; in columns (7) and (8) is leverage; in columns (9) and
(10) is ROA. More information on the variables are available in the Appendix. Standard errors are clustered at firm
level. *** denotes significance at the 1% level, ** at the 5%, and * at the 10%.